section 8 freight transportation and logistics · third-party logistics providers (3pls) to create...
TRANSCRIPT

Transform Milwaukee
Section 8 – Freight Transportation and Logistics
Summary Findings

Freight Originating in the Milwaukee CSA 2011 Estimates to 2040 Projections
Mode 1000’s of Tons
in 2011 1000’s of Tons
in 2040 Percent Change
Truck 63,996.1 98,078.9 53.3%
Rail 1,662.1 2,716.5 63.4%
Water 52.0 45.5 -12.5%
Air (include truck-air) 7.4 24.0 224.7%
Multiple modes & mail 1,008.7 2,026.0 100.9%
Pipeline 16.1 7.5 -53.4%
Other and unknown 877.0 2,029.6 131.4%
Total - All Modes 67,619.4 104,928.0 55.2%
Source: Source: FHA Freight Analysis Framework and Author’s Calculations

Freight Arriving in the Milwaukee CSA 2011 Estimates to 2040 Projections
Mode 1000’s of Tons
in 2011 1000’s of Tons
in 2040 Percent Change
Truck 56,643.4 81,427.9 43.8%
Rail 6,562.7 7,143.7 8.9%
Water 1,623.4 3,024.3 86.3%
Air (include truck-air) 18.5 49.3 167.0%
Multiple modes & mail 872.5 1,559.0 78.7%
Pipeline 3,735.4 2,779.3 -25.6%
Other and unknown 546.3 869.2 59.1%
Total - All Modes 70,002.2 96,852.7 38.4%
Source: Source: FHA Freight Analysis Framework and Author’s Calculations

Transportation, Warehousing and Logistics Establishments in Milwaukee County (as of Q4 2011)
NAICS Description Total
Estabs.
Establishments by Number of
Employees
0 to 9 10 to
99
100 to
499
500 or
More
481 Air Transportation 26 9 14 2 1
482 Rail Transportation 0 0 0 0 0
4831 Deep Sea, Coastal & Great Lakes Transportation 1 0 1 0 0
4841 General Freight Trucking 190 132 48 10 0
4842 Specialized Freight Trucking 85 57 25 3 0
4881 Support Activities for Air Transportation 20 7 11 2 0
4882 Support Activities for Rail Transportation 2 1 1 0 0
4883 Support Activities for Water Transportation 2 1 1 0 0
4884 Support Activities for Road Transportation 28 18 10 0 0
4885 Freight Transportation Arrangement 55 39 15 1 0
4889 Other Support Activities for Transportation 10 4 6 0 0
492 Couriers and Messengers 48 31 10 6 1
4931 Warehousing and Storage 44 22 20 2 0
Data Source: Wisconsin Department of Workforce Development


Transportation, Warehousing and Logistics – Other Notes
• While various modes of transportation are in competition with each other, the industry is increasingly complementary, multi-modal and consolidated. Industry trend toward integrated logistic services offering management, door-to-door packaging, freight forwarding, customs brokerage and the physical shipment of goods by ship, air, road and rail;
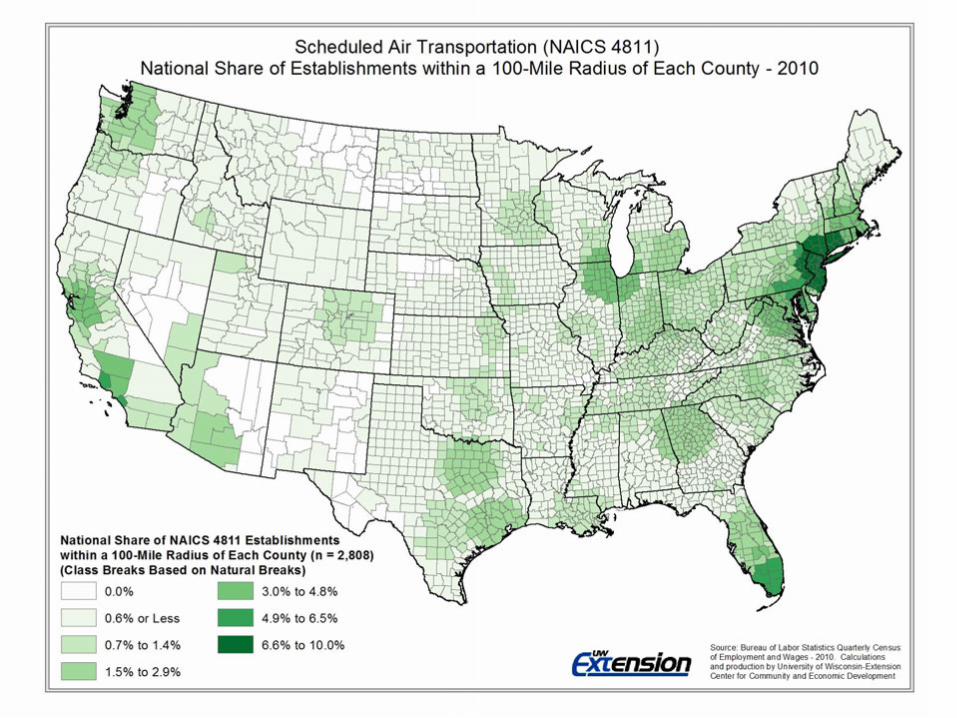
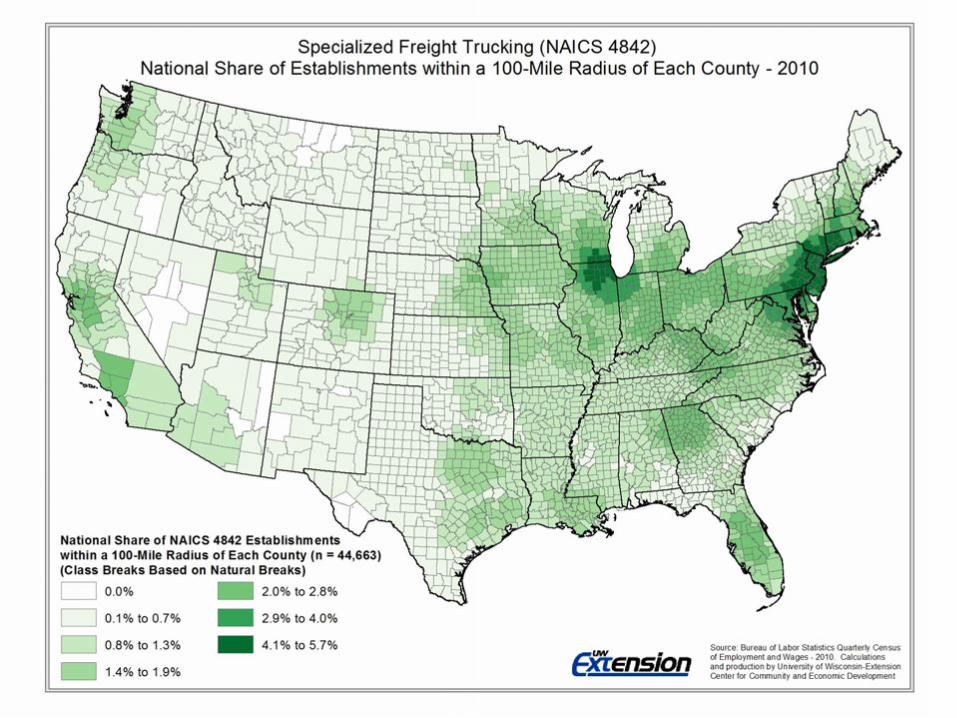
• As suggested by the establishment distribution, the industry is largely fragmented and dominated by small-to-medium firms. Scheduled air transportation, rail transportation and water transportation have greater revenue concentrations;
• Demand for transportation services is largely driven by the health of the manufacturing, agriculture, construction and wholesale trade sectors. Shipping volume tends to fall faster than manufacturing activity during an economic slowdown, as distributors and retailers have less inventory turnover. Consequently, freight industry growth driven less by infrastructure improvements and more by the industries that use freight.
• “Chicago’s presence changes the landscape in which air cargo carriers can operate a financially successful business. It is likely Milwaukee will always be predominantly served by the air cargo services provided out of the Chicagoland region, regardless of the relatively high annual average growth rates.” (Adams, et al, 2012).
Trends, Opportunities and Challenges – Truck Transportation
• Vulnerable to Fuel Prices — Fuel costs and labor are the industry's highest operating cost, with diesel often accounting for 20% of revenues or more. Companies may buy fuel in bulk, implement fuel surcharges, or hedge on fuel prices;
• Alternative Fuels —The transition to alternative fuels presents a challenge to the trucking industry, as the cost and efficiency of biodiesel and CNG have yet to match that of regular diesel fuel. However, the trend toward other fuels is expected to grow over the next decade;
• Customer Concentration — Many trucking firms receive a large portion of business from a few large customers or customers operating in the same industry. This concentration leaves trucking companies exposed to special credit or economic forces;
• Aging Workforce and High-Turnover Rates — Nationally and locally, the industry has a large share of workers age 55 and over. The industry also faces a higher than average employee turnover rate;
• Freight Theft — Transportation providers have billions worth of goods stolen annually. Truckload carriers are particularly vulnerable because their cargo can be easily identified and targeted. In addition to utilizing sophisticated technology to stop theft, experts believe cooperation between shippers and carriers can be an important aspect of crime prevention;
Sources: IBISWorld

Trends, Opportunities and Challenges – Rail Transportation
• Strong Demand — Advances in information systems and innovations in intermodal transport have led to a resurgence in the use of railroads. Railroads are also one of the most cost-effective and environmentally -friendly forms of freight transportation. Freight rail transportation is expected to increase nearly 90 percent by 2035 over 2007 levels, according to the Federal Railroad Administration;
• Increasing Intermodal Revenue — The transfer of containers from ship to truck, intermodal service, is one of the largest revenue-generators for Class I railroads (second only to coal). Intermodal rail accounts for about 20 percent of Class I railroad revenue, according to the Association of American Railroads (AAR);
• Public-Private Partnerships — Public-private partnerships (PPPs) between railroads and local governments can help railroads address public rail infrastructure improvements. The railroad industry has traditionally been wary of PPPs, but the demand for more rail capacity has made them more receptive to investment help from local governments;
• High Capital Spending — Freight railroads require significant capital to maintain their systems. Railroads spend about 15% of annual revenue on capital expenditures (manufacturing industries spend an average of 3%). New track costs ~$2.5 million per mile; new freight cars cost anywhere between $70,000 and $260,000, according to the Association of American Railroads.
Sources: IBISWorld

Trends, Opportunities and Challenges – Great Lakes and Coastal Transportation
• Waterborne Traffic Flat — Coastwise and lakewise traffic has remained flat for the past 20 years (around 300 million tons annually). The industry is mature, and long-term contracts keep relationships between carriers and shippers relatively steady;
• Great Lakes Shipping Dependent on Key Commodities — The Great Lakes shipping industry largely depends on commodities used by three industries: steel, utilities, and construction. As these industries depend heavily on the health of the US economy, economic slowdowns or competition from foreign steel manufacturers could greatly impact industry profitability;
• Dredging Backlog — Great Lakes sediment buildup has created a significant dredging backlog. Dredging and record-low water levels has forced carriers to "light load" which limits profitability and in some cases can cause shipment cancellations.
• Environmental Impact from Ballast Water — Great Lakes vessels face potential lawsuits and US Coast Guard fines of up to $27,500 a day for failing to maintain ballast water reports;
Sources: IBISWorld

Trends, Opportunities and Challenges – Logistics
• International Trade Expands — Annual volume of US international trade in goods (imports plus exports) has increased more than 50 percent over the past decade;
• Logistics Consulting and Analysis — Consulting opportunities include supply chain management, logistics analysis, and just-in-time (JIT) inventory management. Large companies (i.e. UPS and FedEx) have developing logistics consulting divisions leading to increased competition; individual forwarders often take on work as project consultants;
• Improved Technology — Companies have developed advanced proprietary systems that can reduce delivery times, lower loss rates, and track cargo as it moves; Advanced computer information systems select the best routes and rates for a shipment and allow customers to track and trace loads in real time. However, comprehensive systems are costly; and only fairly large shippers can afford the investment;
• Customer, Industry Concentration — Although large freight shipping service providers typically receive no more than 5 percent of business from any single customer, local forwarders often rely on just a few large accounts for the bulk of revenue. Many independent forwarders specialize in shipping goods for a particular industry, such as electronics or fresh produce, leaving them vulnerable to a slowdown in that industry.
Sources: IBISWorld

Trends, Opportunities and Challenges – Warehousing and Storage
• Logistics Services — The warehousing industry has evolved to also provide logistics services, enabling customers to identify, track, and expedite individual items through the supply chain. Many warehouse facilities are considered high throughput distribution (HTD) facilities rather than long-term storage buildings;
• Larger, Electronically Equipped Warehouses— Sophisticated distribution functions require large warehouses (1 million square feet is now common). Special wiring allows for the movement of computer-guided forklifts and electronic identification/throughput of items. Radio frequency identification (RFID) tags are being tested as a replacement for bar codes. Facilities also require more customized material handling equipment, such as those produced by machinery manufacturers;
• Outsourcing Warehouse/Distribution Functions — More companies are outsourcing to third-party logistics providers (3PLs) to create greater efficiencies, reduced capital investments and lower risks of poorly-sited facilities;
• Good Locations More Difficult to Find — With distribution-type warehouses becoming larger, fewer prime locations are available for construction. Smaller, older facilities tend to occupy space along major transportation corridors.
Sources: IBISWorld

Key Findings
Coordinating freight service in urban areas has been not typically been structured
around the provision of regional, IT-based integrated logistics and customer
fulfillment systems. Consensus is that private sector providers are best positioned
for selecting economic and cost-effective methods for delivering goods.
Instead coordination and support for urban freight development has focused on distinct
public sector roles:
1. Designating zones that allow private distribution and freight consolidation companies
to operate effectively (zoning for compatible uses including offices, creating buffers
between active loading, access to multi-modal transportation corridors, etc.);
2. Some communities have explored publically operated “urban freight villages”, but
these are often subsidized and not cost effective in the U.S. freight system;
3. Coordination and improvement of last mile delivery and public right of ways (turn
radius, loading zones, time of day, etc.);
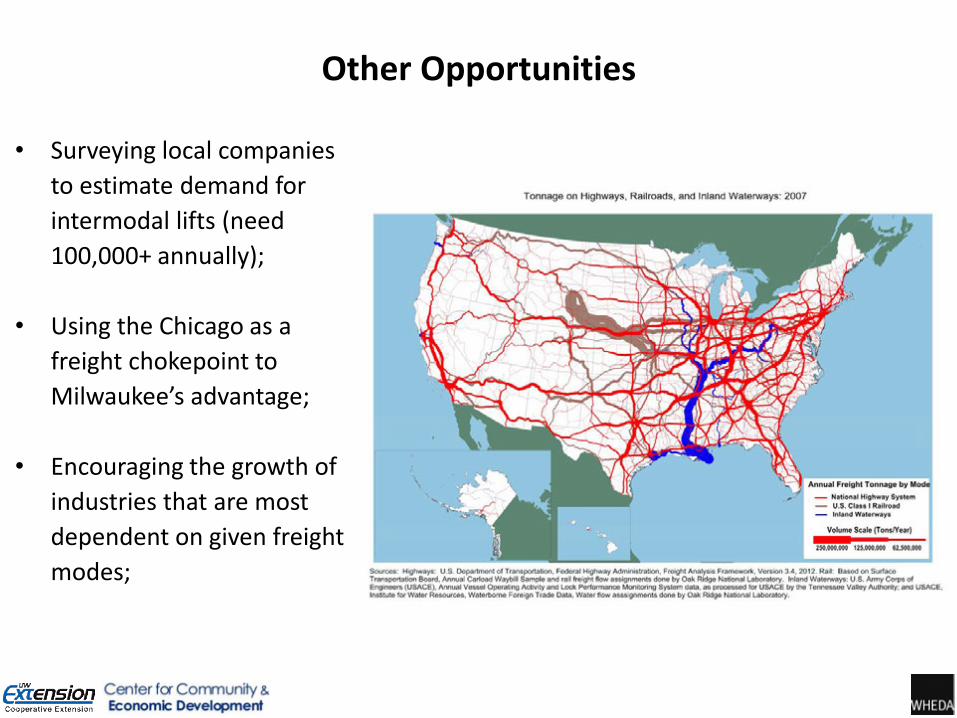
Other Opportunities
• Surveying local companies
to estimate demand for
intermodal lifts (need
100,000+ annually);
• Using the Chicago as a
freight chokepoint to
Milwaukee’s advantage;
• Encouraging the growth of
industries that are most
dependent on given freight
modes;

Site Selection Considerations
• Proximity to Demand Generators – As demand for freight transportation is largely driven by the agriculture, manufacturing, wholesale and retail sectors, proximity to concentrations of these firms is a primary consideration. The proximity of manufacturing establishments within a 200 to 500 mile radius of Milwaukee may be a particular advantage;
• Proximity to Population Centers – Freight transportation and warehousing industries are often concentrated in areas of high population that generate demand for retail and wholesale services;
• Periphery of Urban Areas - Many warehousing, inland port and other logistical centers are being built on large greenfield sites in exurban areas to avoid urban congestion and take advantage of lower labor costs. These facilities are typically located near large highway interchanges.

Support and Affiliated Industries
Primary Inputs Primary Support
Legal, accounting,
payroll and tax services
Computer systems
design and data
processing
Management, scientific and
technical consulting
Employment services and
office administrative
services
Management of
companies and
enterprises
Insurance
Wholesale trade
Internet and
telecommunications
Computer equipment
and electrical
components
Railroad rolling stock
manufacturing
Fuel and other
petroleum products
Real estate, construction
and services to buildings
and dwellings
Aerospace product and
part manufacturing
Ship and boat building
Motor vehicle, body and
trailer manufacturing
Advertising, public
relations and related
services
Auto parts, machine shop
services and other
fabricated metal products
Material handling and
packaging equipment
manufacturing and
repair
Transportation
equipment repair and
rental services
Transportation, Warehousing and Logistics
Couriers and Messenger Service
Great Lakes Transportation
Truck Transportation
Air Transportation
Rail Transportation
Freight Arrangement Services
Warehousing and Storage
Investigation and security
services

National Value of Shipments by Industry – Highest Amount by Air (including Truck)
NAICS Description Value of All Shipments
(Millions $)
Share of Value by Air
334 Computer and electronic product manufacturing $ 389,399 14.8%
336 Transportation equipment manufacturing $ 715,294 8.5%
4236 Electrical and electronic goods merchant wholesalers $ 338,597 7.4%
339 Miscellaneous manufacturing $ 144,279 5.4%
4234 Commercial equip. merchant wholesalers $ 397,976 5.1%
551114 Corporate, subsidiary, and regional managing offices $ 428,280 3.8%
333 Machinery manufacturing $ 343,262 2.1%
335 Electrical equipment, appliance, and component manufacturing $ 128,868 2.1%
4541 Electronic shopping and mail-order houses $ 216,817 2.0%
4238 Machinery, equipment, and supplies merchant wholesalers $ 363,108 1.9%
4239 Miscellaneous durable goods merchant wholesalers $ 210,361 1.9%
Source: Source: FHA Freight Analysis Framework and Author’s Calculations

Job Zone Distribution by Industry
Job Zone Truck Transportation Support Activities for
Transportation
Warehousing and
Storage
Job Zone 1 1.6% 3.2% 11.3%
Job Zone 2 83.7% 62.0% 69.7%
Job Zone 3 11.9% 26.9% 13.4%
Job Zone 4 2.0% 4.8% 3.7%
Job Zone 5 0.6% 0.5% 0.2%
Unclassified 0.2% 2.6% 1.7%
Source: BLS, O*NET and Author’s Calculations