sectoral linkages of financial services as channels of...
TRANSCRIPT

Sectoral Linkages of Financial Services as Channels of Economic Development –
an Input-Output Analysis of the Nigerian and Kenyan economies
Andreas Freytag and Susanne Fricke*
Jena Africa Study Group
Jena, July 2015
The study is part of the Research Project on Financial Sector Reform and Development in
Africa launched by the African Economic Research Consortium (AERC). The study was
supported by a grant from the AERC. The findings, opinions and recommendations are those
of the authors and do not necessarily reflect the views of the Consortium, its individual
members or the AERC Secretariat.
Acknowledgement
We thank the AERC for the financial and technical support of this study. Special thanks to
Isaac Otchere, Nicolas Biekpe, Kalu Ojah, Lemma Senbet, Witness Simbanegavi and to
Akpan Ekpo as well as to fellow researchers of the project for valuable comments and inputs
to the study.
* Corresponding author: [email protected]; Carl-Zeiss-Strasse 3, 07743 Jena, Germany;
http://www.wipo.uni-jena.de/

Abstract
Sectoral linkages of the financial sector act as channels of economic development. This paper
evaluates sectoral linkages of the Nigerian and Kenyan financial sectors, respectively. By
means of an Input-Output Analysis for 2007, 2009 and 2011 both backward linkages and
forward linkages, multiplier effects and variation indices for the financial services sectors are
determined. We additionally investigate these linkages for the communication sector due to
the increasing importance of mobile money. We find considerably high forward and backward
linkages only for the Nigerian financial sector. Here, changes in final demand for or primary
input into the financial sector have a wide and evenly spread impact on the rest of the
economy. The financial sector can be classified as key sector of the Nigerian economy. For
Kenya however, this can only be confirmed in part. Sectoral linkages are considerably lower
than in the case of Nigeria, which may be due to a well-developed mobile financial market in
Kenya. Results for the communication sector however yield rather low linkage values and
multiplier effects for both economies and do not map the expected role within the countries.
All results are confirmed by a robustness test. A lack of data coverage especially with regard
to mobile money and a high degree of informal transactions in the financial sector could
influence these results. Still, our findings confirm the economic significance of the financial
sector for both the economies also when this finding is more evident for the Nigerian
economy.
JEL Codes: D57, G20

1
Sectoral Linkages of Financial Services as Channels of Economic Development –
an Input-Output Analysis of the Nigerian and Kenyan economies
Andreas Freytag and Susanne Fricke
1. Introduction: aim and scope of the study
The financial system is the nerve center of a country’s development (Financial Stability
Report, 2011). An efficient provision of financial services is determining a country’s
economic growth and prosperity. First, the financial sector provides many employment
opportunities and generates high income. Second, financial services, comprising banking,
savings and investments as well as insurance services enable people to save money, to guard
against uncertainty. Thereby they build wealth and have the chance to receive loans. Third, an
efficient provision of and access to financial services is crucial for a country’s business
environment. Next to enabling business start-ups, these services enforce and increase the
efficiency of existing companies. Finally, and of specific importance for Africa, an efficient
provision of financial services fosters the expansion and the competitiveness of local
companies aiming at participating in regional and international markets (Sutton and Jenkins,
2007).
The latter fact is all the more important in light of recent developments of an ongoing
fragmentation of production processes and an expansion of Global Value Chains (GVCs).
These GVCs are of special interest for emerging and developing economies since they are a
first step into world markets providing an enormous potential for development and growth.
For African countries, the participation within these chains is worth striving for but also very
difficult. Only very few sub-Saharan African nations are well-integrated into GVCs, among
them Nigeria and – slightly less so – Kenya (Draper, Freytag and Fricke, 2014). Especially
these two economies play a significant regional role in West and Eastern Africa. As
Ogunleyhe (2011) suggests, Kenya and Nigeria can be considered growth poles in Africa
(together with South Africa, Botswana and Angola) and hence have the potential to drive
regional development. The state of development of their financial sector plays an important
role for both the domestic economies and the neighboring countries since positive spillovers
can arise to other countries in the region. An efficient provision of financial services is crucial
to improve the chances to join GVCs, (Miroudot et al., 2009). They are key in an economy
and determine other sectors’ competitiveness significantly.

2
However, there is a gap in the respective literature (see section 4 below), as the inter-sectoral
connectedness of financial services in emerging and developing countries has not been in the
focus. This study therefore aims at analyzing the specific role of the financial sector in two
African economies, namely Nigeria and Kenya. We assess the overall economic effects
coming from the sectoral linkages of the financial services sectors in Nigeria and Kenya. This
allows us understanding the developmental impact of the financial sector in the Nigerian and
Kenyan economies outlined by its inter-sectoral linkages to the other sectors and the overall
economy as channels through which the financial sector affects the competitiveness of other
sectors of the economy and the overall economy.
To do so, the study proceeds as follows. First, a brief outline on the relevance of inter-sectoral
linkages is given, followed by a summary on the economic importance of financial services as
well as a brief literature review, respectively. In section 5, a view on the current state of
financial sector development in Africa in general and Nigeria and Kenya in particular is
provided. In the main part of the study (sections 6 through 8) we analyze the financial sector’s
interconnectedness of the Nigerian and Kenyan economies respectively. As they already have
a sufficiently well-developed financial sector – but not a world class one, such as South
Africa – they provide a suitable framework for the analysis. The inter-sectoral connectedness
analysis of the financial sector is done with the help of an input-output analysis, comprising
assessments of linkages to the other sectors of the economy and the assessment of overall
economic effects coming from the financial sector (multiplier effects). This additionally
permits a characterization of the role of the financial sector by key sector assessment. In
section 9 we discuss the results as well as policy implications.
2. The relevance of inter-sectoral linkages
Inter-sectoral linkages reflect the interconnectedness between the sectors of an economy.
Mutual interdependencies between the sectors are decisive for the extent to which growth in
one sector contributes to growth of other sectors and overall growth. Tregenna (2008) outlines
ten mechanisms through which sectoral growth may yield overall economic growth. Of those
mechanisms, two very important channels are backward linkages and forward linkages.1
Backward linkages create additional demand for the output of upstream sectors which in turn
induces increased upstream investment and an increased level of capacity utilization, as well
1 The other mechanisms comprise: compositional effects; specialization; trade; employment; innovation,
technological progress and productivity growth; savings; fiscal and institutional mechanisms (Tregenna, 2008).

3
as possible upstream technological upgrading. The overall effect on the economy depends on
the kind of sectors to which a sector is backwardly linked (Tregenna, 2008).
By contrast, sectors’ forward linkages impact downstream sectors. Thus, decreasing costs of a
sector’s output can result in growth inducing effects to downstream industries. These could
include downstream investment, technological upgrading, or increased productivity and
resource utilization. Both of these growth inducing mechanisms – backward and forward
linkages – are so-called Hirschman-type production linkages (Tregenna, 2008).
In his theory of inter-industrial linkage analysis, Hirschman (1959) especially emphasizes the
role of backward linkages for growth stimuli. He further argues that forward linkages cannot
exist in pure form since they are a result of the demand emanating from existing backward
linkages. The existence of demand is therefore a condition for forward linkages. Accordingly,
he states that forward linkages can be considered a powerful reinforcement of backward
linkages. This consideration leads to the differentiation between industries that induce
economic development via backward linkages and industries that enable economic
development via forward linkages (Hirschman, 1959).
The most relevant sectors within an economy are the ones with both high backward and
forward linkages. They are considered key sectors for economic development since
investments into those yield overall economic effects (Hansda, 2001; Park, 1989). The inter-
sectoral connectedness of the financial sector is of specific interest due to its central role
within each economy.
3. The role of financial services
The financial industry covers a broad range of services necessary to manage transactions
between people and businesses respectively. In Africa, basic services are still not existent in
the quality and frequency needed in particular to increase savings. These are necessary to
finance investments (either via microcredits or regular credits), to facilitate the integration of
enterprises in regional as well as global trade, and to support business with insurance. Put
differently: the absence of such services increases transaction costs and may even be
prohibitive for interactions, reducing income opportunities below the potential.
Financial services are provided by diverse organizations that manage money (e.g. credit
unions, banks, insurance companies, accountancy companies, etc.). They are part of the so
called backbone services of an economy. These are infrastructural services which play a

4
specifically important role for each economy and also comprise energy supply, transportation,
communication and distribution.
The efficiency of backbone services is increased by service liberalization, including financial
services. Deardorff (2001) demonstrates that liberalizing trade in services stimulates trade in
goods significantly. He thereby focuses on what he terms trade services including
transportation, communication, travel services, professional services and also financial
services and insurance (Deardorff, 2001). Focusing on financial services, Francois and
Schuknecht (1999) confirm a positive relationship between economic growth and openness of
these services. In line with this, a cross-country analysis by Mattoo et al. (2001) shows that
countries with open financial and telecommunication services are growing up to 1.5
percentage points faster than those missing that characteristic.
However, studies specifically focusing on the inter-sectoral connectedness of financial
services are scarce. Existing studies focus on the analysis of the inter-sectoral connectedness
of services in general by means of an input-output analysis.
4. Studies on inter-sectoral linkages of the services sector
The majority of studies deals with inter-sectoral linkages of services focus on industrialized
countries. Scrutinizing for example the European economy for key markets and key sectors
applying the input-output analysis, Rueda-Cantuche et al. (2012) find that the financial sector
is a forward oriented sector (significant forward linkages to the other sectors of the economy)
which is evenly spread throughout the whole economy. Individual studies deal with e.g.
Scotland (Larreina 2008, Dewhurst 2010), Wales (Midmore et al. 2006) and Poland (Olczyk
2010). Breda and Cappariello (2010) analyze internationalization strategies of German and
Italian firms using Input-Output analysis.
When looking at emerging economies however, studies on inter-sectoral connectedness
predominantly only control for services in general, not for financial services in particular.
Tregenna (2008) for example focuses on the manufacturing sector as the engine of growth and
its linkages to the services sector for South Africa. Based on the examination of inter-sectoral
linkages from 1980-2005, she concludes that the strong backward linkages from
manufacturing to services indicate that cost and quality of services inputs are critical for the
manufacturing’s competitiveness (Tregenna, 2008). However, the study does not specifically
control for financial services and its role within the economy and the inter-industry system. In
order to assess the channels of service-led growth of the Indian economy, Hansda (2007) also
applies an Input-Output analysis to control for inter-industrial linkages within the Indian

5
economy. He concludes that services in general have the largest inducing effect on the
economy through forward and backward linkages to the other sectors of the Indian economy.
Among the services sectors, Hansda (2007) identifies trade and transportation as leading
services sectors with highest potential growth impacts, next to the heavy industry sector.
Nevertheless, he stresses the need to further investigate inter-sectoral linkages, especially with
regard to financial services since such an assessment is necessary for evaluating the benefits
of pursuing the creation of a financial services hub. This result is backed by Singh (2006),
who emphasizes the basic role of services for the industrialization process in India. Kaur et al.
(2009) use econometric methods to confirm the growth enhancing importance of financial
services linked to the primary and secondary sector respectively. Rashid (2004) argues that
both services and manufacturing are instrumental for the development of the primary sector in
Pakistan. Finally, Tounsi et al. (2013) try to identify key sectors in Morocco and come to the
conclusion that data quality and year of investigation are critical for the robustness of the
results. This warning has to be kept in mind. However, in light of the increasing necessity of
developing countries to develop a suitable financial industry, the linkages of the financial
sector are increasingly relevant and deserve a closer scrutiny.
5. Aspects of African financial sector performance in general and in Nigeria
and Kenya in particular
5.1 General aspects
African countries were rather late, financial liberalization only started in the late 1980s and
1990s. The liberalization involved liberalized interest rates, a higher independence of central
banks, privatizing state banks and pension payments, developing financial markets, and
encouraging competition between banks (Omankhanlen, 2012). In line with the enhancement
in the financial sector, access to financial services improved in Africa. New technologies such
as mobile money broadened the access to financial services.
However, challenges remain both in terms of financial depth, which comprises the size of
banks, other financial institutions and financial markets as well as in terms of financial access,
comprising access of firms or individuals to financial services such as credit, payment or
insurance. Despite the improvements in the financial sector, African financial systems still lag
behind other developing countries (Demirgüc-Kunt and Klapper, 2012). African financial

6
systems are rather shallow with a relatively low financial and banking depth (The World
Bank, 2006).
This evidence also holds for financial access. Principally, barriers to access financial services
tend to be lower in countries with a more competitive, open and market oriented and well
regulated financial system (World Bank, 2008). However, the majority of African countries’
financial systems is characterized by weak regulation environments, poor corporate
governance practices, absence of financial innovation, and inefficient payment and clearing
systems (Ncube, 2007).
This is a major challenge especially for small end mediums sized enterprises being almost
entirely excluded from access to financial services, which erects an obstacle to growth
(Demirgüc-Kunt and Klapper, 2012). In line with this, only less than a quarter of adults have a
formal financial institution account. A large part of the financial sector remains informal,
including informal methods to save and borrow money (The World Bank, 2006).
Moreover, other financing sources such as equity markets are under-developed (Demirgüc-
Kunt and Klapper, 2012). The nonbank sector even shows a lower degree of development
than the banking sector, and less than half of African countries have stock markets and only a
few of them are liquid (The World Bank, 2006). African stock exchanges are small and
among the most illiquid in the world (World Bank, 2013). A notable exception is South Africa
which has one of the most modern financial sectors in the world, including the stock exchange
(World Bank, 2013). The South African economy has already been in the focus of a number
of studies on inter-sectoral linkages (see for example Tregenna 2008; Stilwell et al., 2000;
Chang et al., 2014).
Broadening studies on inter-sectoral linkages of the economies of other African countries will
complement existing analyses. Regarding the inter-sectoral linkages of the financial sector,
primarily countries with higher levels of financial development are of interest. For our
analysis we therefore choose Nigeria and Kenya. As a result of a range of reforms, their
financial systems are among the more developed financial systems of African countries.
Moreover, the analysis of the role of the financial sector in both the countries is of relevance
even beyond the country-level since both are financial hubs within their respective regions
and can be considered as growth poles. Their financial sector performance therefore has a
significant impact at the regional level.

7
The Nigerian financial sector
In Nigeria, a number of reforms starting in 1952 aimed at economic and financial deregulation
and targeted fiscal balance and consolidation policy in banking and insurance. Thereby, a
market based financial system was enforced (Omankhanlen, 2012). After these reforms, the
economy experienced an increase in savings and investment as well as in loans and credit.
Subsequently, there were higher incentives to invest in more productive activities
(Omankhanlen, 2012). However, the global financial crisis 2008/2009 had a severe impact on
the Nigerian economy, leading to reduced capital and investment flows, impacting the
national budget (Ajakaiye and Fakiyesi, 2009).
After all, being among the 62 leading financial systems worldwide in 2012 (rank 61; Drexler
et al., 2012), Nigerias relatively well-developed financial system enables a profound
assessment of its interconnectedness to the other sectors of the economy. This also includes
relatively good ranks in the financial intermediation sector, including banking financial
services (rank 62), non-banking financial services (rank 58) and financial markets (rank 60)
(Drexler et al., 2012).
The Kenyan financial sector
In Kenya a number of reforms, starting in 1989, led to a well-developed financial sector.
Institutional and policy reforms, including inter alia the strengthening of regulations and
supervision of the financial system and the development and implementation of specific
restructuring programs for financial institutions. This package aimed at improving the
mobilization and allocation of domestic resources (Ngugi and Kabubo, 1998). These reforms
were accompanied by trade liberalization (Financial Stability Report, 2011).
Access to financial services has been dramatically increased with the help of the mobile-
money system M-PESA (Mobile Pesa), which has been launched in 2007 by the mobile-
network operator Safaricom. M-PESA is an electronic payment and store of value system
which is accessible from ordinary mobile phones (Mas and Radcliffe, 2011). The system is
used by over two-thirds of the Kenyan population. Transfers of money can also be done
between the users of M-PESA, which increases the efficiency and timeliness of money
transfers. This is especially important for Kenya where many workers in the cities transfer
money to their families in rural areas (The Economist, 2013). M-PESA further impacts net
household savings and investments since it is a safe storage system that makes long distance
transfers cheap and feasible (Jack and Suri, 2011).
8
Kenya also ranks among the 62 leading financial systems worldwide (rank 54, Drexler et al.,
2012), with banking financial services ranking 57, non-banking financial services 30 and
financial markets 56 (Drexler et al., 2012).
5.2 Selected indicators of financial performance, financial depth and financial
access
The relatively good performance of the financial sector of the Nigerian and Kenyan
economies is shown in Table 1 which depicts selected financial sector indicators for the
African continent (average), Sub-Saharan African countries (SSA) (average) and the results
for Nigeria and Kenya. The indicators illustrate business and regulatory
environment/performance of the financial sector, financial depth and financial access. The
performance of the financial sector which is taken from The World Bank’s ‘Country Policy
and Institutional Assessment (CPIA) Financial Sector Rating’ (World Bank, 2015a) reflects
the above-African average performance of Nigeria and Kenya. Measuring financial stability,
efficiency and access, CPIA rates (1=low, 6=high) of both Nigeria (value 3.5) and Kenya
(value 4) are well above the African (2.91) and Sub-Saharan African (2.92) average ratings.
By the same token the regulatory and business environment in Nigeria and Kenya are above
African and SSA average as indicated by the World Bank’s Ease of Doing Business Index
(World Bank, 2015b). A first indicator illustrating financial depth and size of the financial
sector is ‘private credit to GDP’ which indicates the domestic private credit to the real sector
as percentage of GDP in local currency. Obviously, Kenya records a high private credit/GDP
share (33.58%), which is above African average (26.11%) and Sub-Saharan African average
(24%). Nigeria however records a value slightly below Sub-Saharan African average
(22.91%). As alternative indicator for the size of the financial sector ‘deposit money banks’
assets to GDP’ is a more comprehensive indicator as it also takes into account credit to
government (next to private sector) and other bank assets than credit. Here, both Nigeria
(36.34%) and Kenya (48.49%) record values above African (32.46%) and Sub-Saharan
African (share of 28.98) average. The third indicator on financial depth and size indicates the
size of stock markets (‘stock market capitalization to GDP’). Here, Kenya (35.35 %)
consistent with African (35.21%) and Sub-Saharan African (34.36%) average. Nigeria records
a smaller share (17.30%). However, it has to be noted that only 15 African countries are
included in the data since many are lacking stock markets. The good performance of Nigeria
and Kenya is mirrored by selected parameters of financial access (account at a financial
institution, saved at a financial institution; World Bank, 2015c). Here, Nigeria and Kenya

9
record again values above the averages of overall Africa and SSA. A special form of financial
access turns out to be mobile money usage (mobile phone used to send money and used to pay
bills; World Bank, 2015c). Overall African and SSA average are again relatively low for both
parameters. Values for Nigeria are above average for ‘mobile phone used to send money’ but
just within SSA average and even below African average for ‘mobile phone used to pay bills’.
Kenya records by far the highest values – indicating that for example 60.48 % of people 15+
used the mobile phone to send money, and 13.43% to pay bills. This underlines the distinct
particularity of the Kenyan financial sector, with a considerable prevalence of mobile money.
Table 1 Selected indicators on the financial sector performance, financial depth and size and
financial access in Africa, Sub-Saharan Africa, Nigeria and Kenya, latest available years
Sources: World Bank (2015a), World Bank (2015b), World Bank (2015c)
An economic growth advantage for countries with higher levels of financial development is
ascertained (Creane et al., 2003). Overall, the data of Table 1 underline the advanced financial
sector performance of Nigeria and Kenya. A characterization of financial services as channels
of economic development is possible by assessing their inter-sectoral linkages to the
economy. In the case of Nigeria and Kenya an evaluation of inter-sectoral linkages of the
financial sector has to pay attention to two distinct particularities: A considerable impact of
the 2009 financial crisis within the economies was experienced. This was especially
pronounced in the Nigerian economy. Second, the Kenyan financial sector is especially
characterized by its considerably high prevalence of mobile money, with a high number of
financial services being offered by telecommunication services. In order to incorporate these
distinctive peculiarities into our study, we select three years for the analysis which capture
pre-crisis, crisis, and post-crisis years (2007, 2009, 2011). Additionally, we do not only
concentrate on the financial sector itself, we also take the communication sector into account
as there are overlaps between both the sectors due to the prevalence of mobile money.
Private credit
by deposit
money banks
and other
financial
institutions to
GDP (%)
Deposit
money banks'
assets to GDP
(%)
Stock market
capitalization
to GDP (%)
Account at a
formal
financial
institution (%
age 15+)
Saved at a
financial
institution in the
past year (% age
15+)
Mobile phone
used to send
money (% age
15+)
Mobile phone
used to pay bills
(% age 15+)
African average 2.91 142.94 26.11 32.46 35.21 21.31 10.12 8.28 3.24
Sub-Saharan African average 2.92 142.45 24.00 28.98 34.36 17.46 9.94 3.51 1.38
Nigeria 3.5 170 22.91 36.34 17.30 29.67 23.59 9.92 1.38
Kenya 4 136 33.58 48.49 35.35 42.34 23.28 60.48 13.43
CPIA Financial
Sector Rating
(1= low to
6=high) 2013
Ease of Doing
Business
Index 2014
(rankings:
1=low,
189=high)
Access to financial services
Global Financial Development Indicators, 2011
Size of the financial sector

10
6. Methodology
The inter-sectoral linkage analysis is conducted by means of an Input-Output analysis, on the
basis of Input-Output tables. It serves for describing the economic production structure and
interdependencies and interconnectedness of production processes. An Input-Output table
displays the production structure and transaction flows within an economy. Inter-sectoral
flows describe the transactions from the producing sectors (sectors i) to the purchasing sectors
(sectors j). Additionally, exogenous units comprising demand for products in terms of
consumption, investment and exports are depicted in the final demand 𝑓𝑖. Further, Input-
Output tables account as well for all primary inputs into production such as labor and capital.
They are termed value added in sector 𝑗 and denoted as 𝑣𝑗 (Miller and Blair 2009, p. 13;
Hanink 1997, p. 335).
6.1 Hypotheses
On the basis of the existing literature on the role of financial services, we hypothesize the
following:
H1: The financial sector yields significant forward linkages to the other sectors of the
economies.
H2: Changes in final demand or value added in the financial sector have a wide-spread impact
on the rest of the economy.
H3: These effects are larger in Nigeria than in Kenya. Inter-sectoral linkages from the
financial sector to the other sectors of the economy are expected to be less with higher levels
of financial services being provided by telecommunication enterprises.
H4: Due to the overlap between financial and communication sector, the communication
sector yields considerable high linkages to the other sectors of the economy.
6.2 Analyzing Input-Output data
In this study, Input-Output tables are analyzed based on the static open quantity model. It is
referred to as static since variables are measured for a given point in time (Holub and Schnabl
1994, p. 91). It is further termed open since it depends on the existence of the final demand as
an exogenous sector (Miller and Blair 2009, p. 34). Input-Output analysis is based on two
basic assumptions: constant returns to scale and non-substitutability of inputs within the
production process which implies that only one process is used for the production of each
output. Both assumptions are deployed on the grounds of practicability (Christ 1955, p. 139-
140; Raa, 2005, p. 14ff.), but are questionable as they are simplifying. The static character of

11
the model does not allow for dynamic aspects, like the change of technical coefficients in the
course of changing demands. Furthermore, the assumption of fixed coefficients ignores the
possibility of factor substitution. Another point of criticism of the open input-output analysis
is the assumption of the final demand being exogenously given. This assumption ignores
feedback effects and interdependencies between the production sectors and final demand. A
higher production can result in higher final demand, which can again result in higher
production (Holub and Schnabl, 1994, p. 421; Raa, 2005, p. 54). We address this issue in the
robustness test of the analysis. Despite these limitations, the input-output analysis is a suitable
approach for our study. For analytical purposes, its degree of abstraction is useful for
understanding the extent of integration of an industry within an economy and for the
illustration of its inter-sectoral connectedness.
In order to specifically measure a sector’s backward or forward linkage to exclusively the rest
of the economy we omit intra-sectoral transactions (net approach) and hence the on-diagonal
elements within the input-output tables.
The two basic models for analyzing Input-Output tables are the Leontief (1936) and Ghosh
(1958) approaches. Leontief’s (1936) approach is a demand-driven model and relates sectoral
gross outputs to the final demand, focusing on units of a product leaving the inter-industry
system. By contrast, Ghosh (1958) developed a supply-driven model which relates sectoral
gross production to primary inputs and to units entering the inter-industry system in the
beginning of the production process (Miller and Blair 2009, p. 543). In detail, both models are
built as follows:
The Leontief model is a set of linear equations, written in matrix representation by:
x = (I – A)-1
f , (1)
with x as a 1𝑥𝑛 column vector of the gross output of the n industries; 𝑓 as the 1𝑥𝑛 final
demand column vector; 𝐼 is a 𝑛𝑥𝑛 identity matrix and A is a 𝑛𝑥𝑛 matrix of direct input
coefficients with A= [𝑎𝑖𝑗]. The elements 𝑎𝑖𝑗 are also called technical coefficients. They denote
the share of intermediate products of sector 𝑖 bought by sector 𝑗 (𝑎𝑖𝑗 = 𝑧𝑖𝑗/𝑥𝑗) (Miller and
Blair 2009, p. 16). Whereas A displays direct input requirements for intermediates, the matrix
L = [𝑙𝑖𝑗] displays total input requirements, comprising direct and indirect ones. Indirect
requirements are requirements of sector 𝑖 whose output is directly required for the production
of sector 𝑗. L is denoted as:
L = (I - A)-1
, (2)
12
with (I – A)-1
as the Leontief inverse (input inverse). The elements 𝑙𝑖𝑗 illustrate the changes of
outputs from sector i both directly and indirectly necessary to produce one additional unit of
sector j (Holub and Schnabl 1994, p. 103).
Similarly, the Ghosh model is a set of linear equations. It is given by:
x’ = (I – B)-1
v’ (3)
with 𝑥’ as the transpose of the 𝑛𝑥1 output vector and 𝑣’ as the transposed 𝑛𝑥1 vector of
primary inputs. B = [𝑏𝑖𝑗] denotes a matrix of direct output coefficients (allocation
coefficients) where its elements 𝑏𝑖𝑗 = 𝑧𝑖𝑗/𝑥𝑖 represent the distribution of sector 𝑖’s output
across sector 𝑗 (European Commission 2008, p. 486; Miller and Blair 2009, p. 543).
Analogous to the Leontief inverse (input inverse), (I – B)-1
denotes the Ghosh inverse (output
inverse):
G = (I – B)-1
with G = [𝑔𝑖𝑗]. (4)
The elements 𝑔𝑖𝑗 depict the induced value of production in sector 𝑗 per unit of primary input
in sector 𝑖 (Miller and Blair 2009, p. 544).
Based on these two Input-Output models, parameters on the sectoral relevance for the
economy and the inter-sectoral connectedness within the economy can be assessed.
6.3 Applied Parameters of Inter-sectoral Relevance and Inter-sectoral
Connectedness
Inter-sectoral Linkages and Related Parameters
Backward linkages
Backward linkages mirror the strength by which sector 𝑗’s production depends on inter-
sectoral inputs (Miller and Blair 2009, p. 556). Chenery and Watanabe (1958, p. 492) suggest
using the column sums of the direct input coefficient matrix A as a measure for direct
backward linkages, thus:
𝐵𝐿𝑗𝐶𝑊 = ∑ 𝑎𝑖𝑗
𝑛𝑖=1 . (5)
A total measure of backward linkages, comprising both direct and indirect effects has been
suggested by Rasmussen (1956, p. 133-134). Total backward linkages mirror the change in
economy-wide output in case the final demand for a particular sector increases by one unit
(Miller and Blair 2009, p. 557). The total backward linkage of sector j is defined as the

13
column sum of the Leontief inverse L = [𝑙𝑖𝑗] (Miller and Blair 2009, p. 557). It is thus
equivalent to the output multiplier (see section “Multiplier effects”):
𝐵𝐿𝑗𝑅
= ∑ 𝑙𝑖𝑗𝑛𝑖=1 . (6)
For a reliable comparison of sectoral backward linkages, normalizations are useful (Miller and
Blair 2009, p. 557). Accordingly, in order to calculate the relative strength of the total
backward linkages, Rasmussen (1956, p. 134) developed the index of power of dispersion
(normalized backward linkages). It reflects the relative extent to which an increase in final
demand for the products of industry 𝑗 is dispersed throughout the total inter-industry system
(Drejer 2002, p. 5). It is described as:
∑ 𝑈𝑖𝑗𝑖 =1
𝑛∑ 𝑙𝑖𝑗𝑖
1
𝑛2 ∑ 𝑙𝑖𝑗𝑖𝑗
, (7)
with ∑ 𝑙𝑖𝑗𝑖 as the column sums of the Leontief inverse (Drejer 2002, p. 5). Sectors with above
average backward linkage reveal indices greater than one, indicating a strong integration with
the rest of the economy. Those sectors with below average linkages have indices lower than
one (Miller and Blair 2009, p. 558; Dasgupta and Chakraborty 2005, p. 8).
Forward linkages
Jones (1976, p. 327) suggests to utilize the Ghosh inverse G = [𝑔𝑖𝑗] for the calculation of
forward linkages. He argues that using the Leontief inverse twice (which has been suggested
by Chenery and Watanabe and Rasmussen) 2
, both as a measure of total backward and total
forward linkages involves a problem of double counting causal linkages, inasmuch as sales
from sector 𝑖 to sector 𝑗 are recorded as 𝑖’s forward linkage and 𝑗’s backward linkage. But
only one of these linkages can be effectively causal. Using the Ghosh inverse as a measure of
total forward linkages avoids this problem (Andreosso-O’Callaghan and Yuen 2004, p. 168-
169). Accordingly, total forward linkages are defined as the row sums of G:
FL i = ∑ 𝑔𝑖𝑗𝑛𝑗=1 (8)
2 An alternative approach is the application of the Leontief inverse as the basis for assessing forward linkages.
Chenery and Watanabe (1958, p. 492) suggest a direct forward linkage index which is defined as the row sums
of the direct output coefficient matrix B.. For calculating total forward linkages, Rasmussen (1958, p. 136)
developed a normalized index which describes the extent to which the total inter-industry system depends on the
particular sector 𝑖. This index is called sensitivity of dispersion. It is defined as the row sums of the Leontief
inverse (Drejer 2002, p. 5).

14
This measure is equivalent to the input multiplier (Miller and Blair 2009, p. 558) (see section
“Multiplier effects”). Following Rasmussen’s sensitivity of dispersion index (see footnote 2),
forward linkages based on the Ghosh inverse can be normalized correspondingly:
∑ 𝑈𝑖𝑗𝑗 =1
𝑛∑ 𝑔𝑖𝑗𝑗
1
𝑛2 ∑ 𝑔𝑖𝑗𝑖𝑗
, (9)
(following Miller and Blair 2009, p. 558).
Variation Indices
It is important to notice that both backward and forward linkages are sensitive to extreme
values. In case a sector buys for example large amounts only from few of the sectors within
the economy, it still denotes high backward linkages (Hansda 2007, p. 16). Thus, the
drawback of these indices is the lack of representing how evenly one sector draws on the
other ones (Salami et al. 2012, p. 4). As an index of the relative evenness of a sectors’
purchases or sells to other sectors, Rasmussen (1956, p. 138) developed the variation index.
The variation index of backward linkages is based on the elements of the Leontief inverse 𝑙𝑖𝑗
and is calculated as follows:
𝑉𝑏 =√1
𝑛∑ (𝑙𝑖𝑗−(
1
𝑛) ∑ 𝑙𝑖𝑗
𝑛𝑖=1 )
2𝑛𝑖=1
1
𝑛∑ 𝑙𝑖𝑗
𝑛𝑖=1
(10)
(Salami et al. 2012, p. 4). The variation index for forward linkages can be also calculated
according to Jones’ method based on the Ghosh inverse, as illustrated by equation (11).
𝑉𝑓𝐺 =√1
𝑛∑ (𝑔𝑖𝑗−(
1
𝑛) ∑ 𝑔𝑖𝑗
𝑛𝑗=1 )
2𝑛𝑗=1
1
𝑛∑ 𝑔𝑖𝑗
𝑛𝑗=1
(11)
(Rasmussen 1956, p. 138; Salami et al. 2012, p. 4-5).
A relatively large value of the backward variation index indicates that sector 𝑖 purchases its
inputs from only a few other sectors. Relatively large values of the forward variation index
reflect that sector 𝑗 sells outputs only to a few sectors within the economy (Hansda 2007, p.
16).

15
Multiplier Effects
Output multipliers
By definition, the output multiplier of sector 𝑗 reflects the value of production in all sectors of
the economy which is necessary in order to guarantee one additional monetary unit’s worth of
final demand for sector 𝑗’s output (Miller and Blair 2009, p. 245). The output multipliers are
calculated with the help of the column sums ∑ 𝑙𝑖𝑗𝑛𝑖=1 of the Leontief inverse L. They reflect
the cumulative revenues induced by one additional unit of final demand for a certain
commodity (European Commission 2008, p. 488; Miller and Blair 2009, p. 21). For practical
purposes, this can be used to determine the overall economic effects of spending one
additional monetary unit of public expenditure on the output of a particular sector (Miller and
Blair 2009, p. 246).
Input multipliers
The input multipliers are based on the Ghosh inverse G = [𝑔𝑖𝑗] and are thus supply oriented.
They are assessed with the help of the row sums ∑ 𝑔𝑖𝑗𝑛𝑗=1 of G. They reflect the effect on total
output in all sectors of the economy associated with an additional unit of primary inputs for
sector 𝑖 (Miller and Blair 2009, p. 545). In practical terms, this indicates where an additional
monetary unit’s worth of provision of primary inputs is most beneficial for the whole
economy (Miller and Blair 2009, p. 547).
Identifying Key Sectors
According to Hirschman (1958, p. 104), sectors with both high backward and high forward
linkages can be classified as key sectors of the economy. In normalized form, this comprises
sectors with both backward and forward linkages greater than one (Miller and Blair 2009, p.
559).
7. Data and data processing
Input-output data for Nigeria and Kenya are obtained from the Eora database, which provides
input-output tables for 187 economies worldwide (Lenzen et al., 2012; Lenzen et al., 2013).
Transaction flows within the input output tables are depicted in value added terms, giving a

16
good picture on domestic value adding activities in the specific sectors of the economy.3 We
use the input output tables for 2011 as they are the most recent ones and it is a post-crisis
year. In order to control for the obtained results, we additionally apply the analysis to the
input output tables of 2007 and 2009, as pre-crisis and crisis years. The input-output tables for
Nigeria depict 26 sectors. The Kenyan input-output table is more disaggregated with 51
sectors included in them. This different level of sectoral aggregation is by itself not
problematic since the sectors of our interest – the financial sector and the communication
sector4 - are in both cases depicted as one single sector. For the purpose of a better
comparability, we adjust the Kenyan sectoral depiction to the Nigerian one. After making the
Kenyan sectors comparable, 19 aggregated sectors of the economy emerge. See Annex 1 for a
listing of the Nigerian and Kenyan economic sectors in the input-output tables and the
classification of the Kenyan sectors to a higher aggregation.
8. Results
8.1 Descriptive Analysis
Before analyzing the inter-sectoral connectedness within the two economies with a specific
consideration of the financial and the communication sector, we first take a look at the
sectors’ structural composition. To that end we take three basic indicators into account: total
output, value added and final demand for the years 2007, 2009 and 2011.
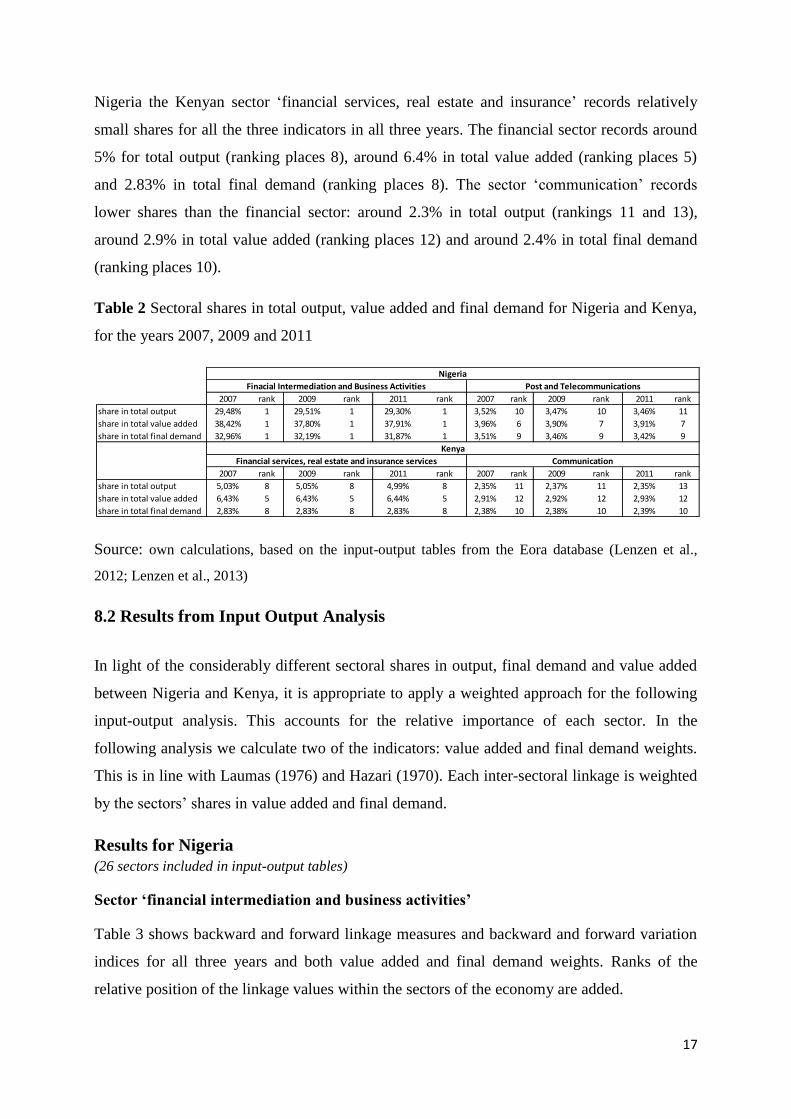
Table 2 depicts the sectoral shares in total output, total value added and total final demand for
Nigeria and Kenya for all three years. Looking at the 26 sectors of Nigeria, it is evident that
the sector ‘financial intermediation and business activities’ records the highest share in all the
three indicators for all three years (in total output around 29 %; in total value added around 38
% and in final demand around 32 %). The sector ‘post and telecommunications’ records
consistently lower shares in all three indicators, ranking places 10 and 11 in total output
(around 3.5%), places 6 and 7 for total value added (around 3.9%) and places 9 for total final
demand (around 3.5%).
However, the picture is different when we look at these sectoral shares for the 19 aggregated
sectors of the Kenyan economy. In contrast to the high shares of the financial sector in
3 Input-output tables in the Eora database are constructed based on different types of data: input-output tables
from national statistical offices, I-O compendia from Eurostat, the UN National Accounts Main Aggregates
Database, the UN National Accounts Official Data, the UN Comtrade international trade database, the UN
Servicetrade international trade database (Lenzen et al., 2013). 4 We cannot test the telecommunications sector in the narrower sense, since the data is aggregated and financial
services within the communication sector are not mentioned separately.
17
Nigeria the Kenyan sector ‘financial services, real estate and insurance’ records relatively
small shares for all the three indicators in all three years. The financial sector records around
5% for total output (ranking places 8), around 6.4% in total value added (ranking places 5)
and 2.83% in total final demand (ranking places 8). The sector ‘communication’ records
lower shares than the financial sector: around 2.3% in total output (rankings 11 and 13),
around 2.9% in total value added (ranking places 12) and around 2.4% in total final demand
(ranking places 10).
Table 2 Sectoral shares in total output, value added and final demand for Nigeria and Kenya,
for the years 2007, 2009 and 2011
Source: own calculations, based on the input-output tables from the Eora database (Lenzen et al.,
2012; Lenzen et al., 2013)
8.2 Results from Input Output Analysis
In light of the considerably different sectoral shares in output, final demand and value added
between Nigeria and Kenya, it is appropriate to apply a weighted approach for the following
input-output analysis. This accounts for the relative importance of each sector. In the
following analysis we calculate two of the indicators: value added and final demand weights.
This is in line with Laumas (1976) and Hazari (1970). Each inter-sectoral linkage is weighted
by the sectors’ shares in value added and final demand.
Results for Nigeria
(26 sectors included in input-output tables)
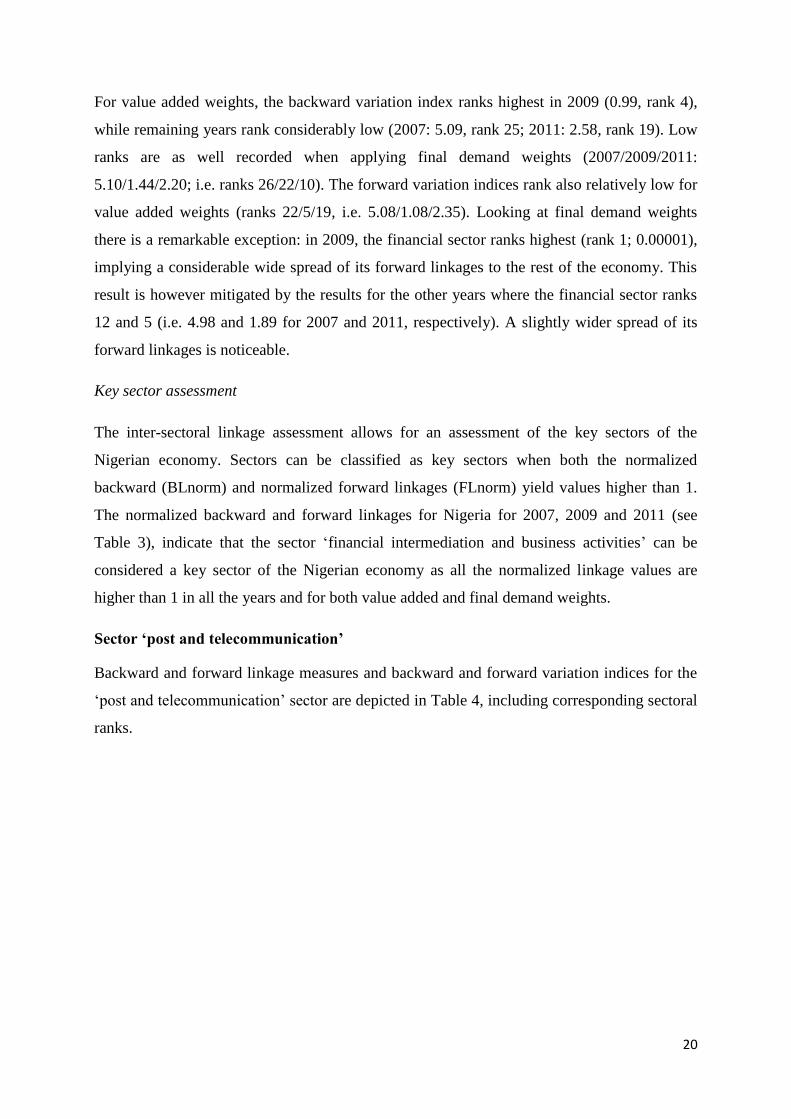
Sector ‘financial intermediation and business activities’
Table 3 shows backward and forward linkage measures and backward and forward variation
indices for all three years and both value added and final demand weights. Ranks of the
relative position of the linkage values within the sectors of the economy are added.
2007 rank 2009 rank 2011 rank 2007 rank 2009 rank 2011 rank
share in total output 29,48% 1 29,51% 1 29,30% 1 3,52% 10 3,47% 10 3,46% 11
share in total value added 38,42% 1 37,80% 1 37,91% 1 3,96% 6 3,90% 7 3,91% 7
share in total final demand 32,96% 1 32,19% 1 31,87% 1 3,51% 9 3,46% 9 3,42% 9
2007 rank 2009 rank 2011 rank 2007 rank 2009 rank 2011 rank
share in total output 5,03% 8 5,05% 8 4,99% 8 2,35% 11 2,37% 11 2,35% 13
share in total value added 6,43% 5 6,43% 5 6,44% 5 2,91% 12 2,92% 12 2,93% 12
share in total final demand 2,83% 8 2,83% 8 2,83% 8 2,38% 10 2,38% 10 2,39% 10
Nigeria
Kenya
Finacial Intermediation and Business Activities Post and Telecommunications
Financial services, real estate and insurance services Communication

18
Table 3 Inter-sectoral linkages of the financial sector in Nigeria for selected years
Note: Inter-sectoral linkage measures comprise backward and forward linkages and backward and
forward variation indices for the ‘financial intermediation and business activities’, for the years 2007,
2009 and 2011 (value added weights and final demand weights).
Source: own calculations, based on the input-output tables from the Eora database (Lenzen et al.,
2012; Lenzen et al., 2013)
Backward linkages and Forward linkages
The financial sector records rather low direct backward linkage values, ranking 6th
and 7th
places for value added weights in all three years and places 25 (in 2007 and 2009) and place 8
(2011) for final demand weights. However, when the total backward linkage measure is
applied, the financial sector records highest values for both value added and final demand
weights (for value added weights: 0.385 resp. 0.39; for final demand weights: 0.32 resp. 0.33,
i.e. for both weights ranks 1 in all years). This result is further emphasized when normalizing
the total linkages in order to illustrate the power of dispersion index. According to this index,
the financial sector records by far highest total backward linkage values (for value added
weights: 9.99/8.76/8.77; for final demand weights: 8.57/4.48/7.28; i.e. ranks 1 in all years).
The high linkage values of the financial sector are confirmed by the results for forward
linkages. But here again, the differing values between direct and total linkages are obvious.
5 Results are rounded in the last cited figure. For detailed results see Tables.
value rank value rank value rank value rank value rank value rank
direct 0,00079 7 0,00808 6 0,00863 6 0,00022 25 0,00075 25 0,00726 8
total (=output
multiplier)0,38420 1 0,38761 1 0,38942 1 0,32958 1 0,32338 1 0,32741 1
total normalized
linkage9,98930 1 8,76338 1 8,76881 1 8,56918 1 4,48121 1 7,28150 1
direct 0,00105 13 0,01036 13 0,01076 13 0,00758 1 0,07161 1 0,01191 10
total (=input
multiplier)0,38420 1 0,39035 1 0,39198 1 0,32958 1 0,40293 1 0,33249 1
total normalized
linkage9,98929 1 7,55928 1 7,53599 1 8,56919 1 9,05876 1 8,36872 1
5,08815 25 0,99145 4 2,57554 19 5,09784 26 1,43882 22 2,19226 10
5,08461 22 1,08471 5 2,34759 19 4,97989 12 0,00001 1 1,85622 5
Backward
linkages
Forward
linkages
value added weights final demand weights
2007 2009 2011 2007 2009 2011
Financial intermediation and business activities
Backward variation index
Forward variation index

19
Direct forward linkages predominantly record considerably low linkage values for value
added weights (2007/2009/2011: 0.001/0.01/0.01, i.e. all ranks 13), while results for final
demand weights are considerably higher (2007/2009/2011: 0.008/0.07/0.01, i.e. ranks 1/1/10).
Total forward linkages in contrast record consistently highest values (ranks 1) for all three
years (2007/2009/2011: 0.38/0.39/0.39 for value added weights and 0.33/0.40/0.33 for final
demand weights). Their significance is underlined by the normalization of total forward
linkages, where the financial sector also ranks highest (2007/2009/2011: 9.99/7.56/7.54 for
value added weights and 8.57/9.06/8.37 for final demand weights, ranks 1 in both weights and
all three years).
Multiplier effects
On the basis of these results it is possible to illustrate multiplier effects of the sectors. As
Table 3 shows, both input and output multipliers equal the total backward linkages (output
multiplier) and total forward linkages (input multiplier), respectively. ‘Financial
intermediation and business activities’ rank highest (ranks 1) for both multiplier measures in
both weights for all three years. The high rankings of the financial sector imply the following
considering the output multipliers: one additional unit of final demand for the ‘financial
intermediation and business activities’ sector induces around 0.39 (for value added weights)
or around 0.33 (for final demand weights) cumulative revenue for the overall economy.
Moreover, the input multipliers show the economic overall effect of an additional unit of
primary inputs into the ‘financial intermediation and business activities’ sector, which also
accounts for around 0.39 (for value added weights) and around 0.33 resp. 0.40 (for final
demand weights).
Variation index
As the previous section outlined, the financial sector is characterized by considerably high
total backward and total forward linkages. In order to furthermore specify the role of the
financial sector, the consideration of the relative spread of these linkages to the other sectors
of the economy is necessary. Table 3 also displays the relative evenness of the total backward
and total forward linkages, applying the variation index. Low values (= high ranks) indicate a
wide/even spread of the linkages to the other sectors of the economy, while high values (=
low ranks) indicate more concentrated linkages. While ‘financial intermediation and business
activities’ was consistently ranked first in total backward and total forward linkages, the ranks
are considerably lower in the variation indices for both value added and final demand weights.
20
For value added weights, the backward variation index ranks highest in 2009 (0.99, rank 4),
while remaining years rank considerably low (2007: 5.09, rank 25; 2011: 2.58, rank 19). Low
ranks are as well recorded when applying final demand weights (2007/2009/2011:
5.10/1.44/2.20; i.e. ranks 26/22/10). The forward variation indices rank also relatively low for
value added weights (ranks 22/5/19, i.e. 5.08/1.08/2.35). Looking at final demand weights
there is a remarkable exception: in 2009, the financial sector ranks highest (rank 1; 0.00001),
implying a considerable wide spread of its forward linkages to the rest of the economy. This
result is however mitigated by the results for the other years where the financial sector ranks
12 and 5 (i.e. 4.98 and 1.89 for 2007 and 2011, respectively). A slightly wider spread of its
forward linkages is noticeable.
Key sector assessment
The inter-sectoral linkage assessment allows for an assessment of the key sectors of the
Nigerian economy. Sectors can be classified as key sectors when both the normalized
backward (BLnorm) and normalized forward linkages (FLnorm) yield values higher than 1.
The normalized backward and forward linkages for Nigeria for 2007, 2009 and 2011 (see
Table 3), indicate that the sector ‘financial intermediation and business activities’ can be
considered a key sector of the Nigerian economy as all the normalized linkage values are
higher than 1 in all the years and for both value added and final demand weights.
Sector ‘post and telecommunication’
Backward and forward linkage measures and backward and forward variation indices for the
‘post and telecommunication’ sector are depicted in Table 4, including corresponding sectoral
ranks.
21
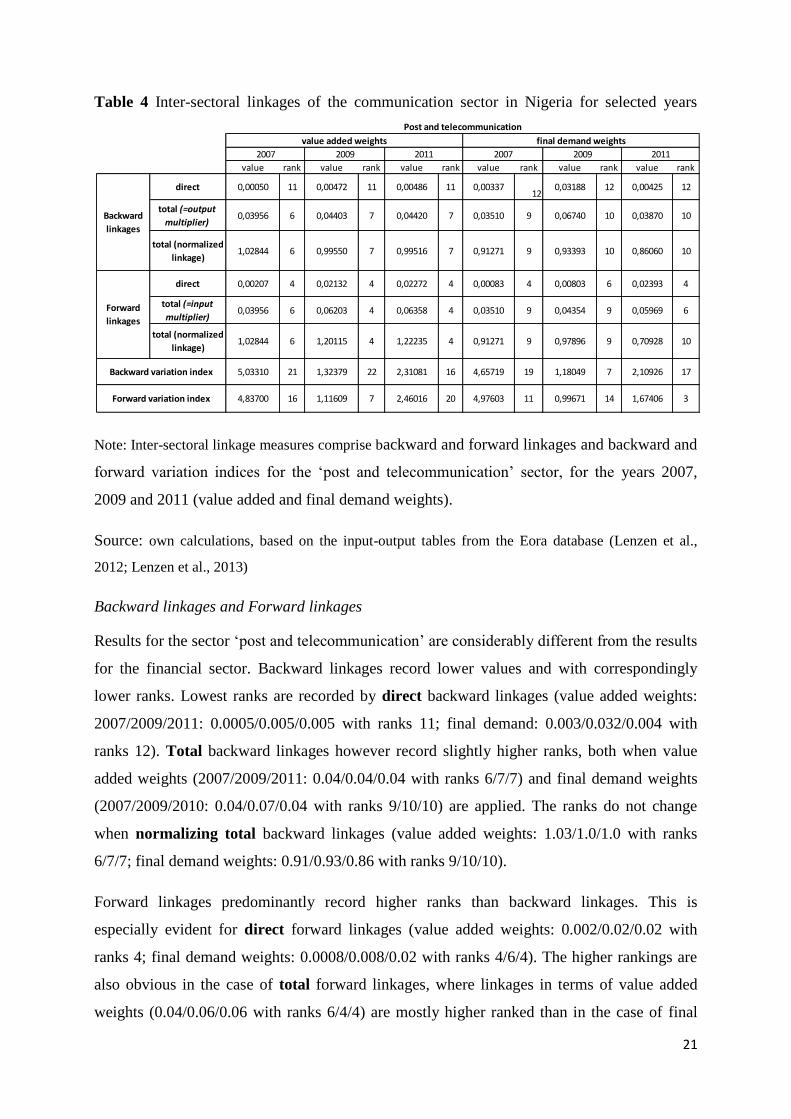
Table 4 Inter-sectoral linkages of the communication sector in Nigeria for selected years
Note: Inter-sectoral linkage measures comprise backward and forward linkages and backward and
forward variation indices for the ‘post and telecommunication’ sector, for the years 2007,
2009 and 2011 (value added and final demand weights).
Source: own calculations, based on the input-output tables from the Eora database (Lenzen et al.,
2012; Lenzen et al., 2013)
Backward linkages and Forward linkages
Results for the sector ‘post and telecommunication’ are considerably different from the results
for the financial sector. Backward linkages record lower values and with correspondingly
lower ranks. Lowest ranks are recorded by direct backward linkages (value added weights:
2007/2009/2011: 0.0005/0.005/0.005 with ranks 11; final demand: 0.003/0.032/0.004 with
ranks 12). Total backward linkages however record slightly higher ranks, both when value
added weights (2007/2009/2011: 0.04/0.04/0.04 with ranks 6/7/7) and final demand weights
(2007/2009/2010: 0.04/0.07/0.04 with ranks 9/10/10) are applied. The ranks do not change
when normalizing total backward linkages (value added weights: 1.03/1.0/1.0 with ranks
6/7/7; final demand weights: 0.91/0.93/0.86 with ranks 9/10/10).
Forward linkages predominantly record higher ranks than backward linkages. This is
especially evident for direct forward linkages (value added weights: 0.002/0.02/0.02 with
ranks 4; final demand weights: 0.0008/0.008/0.02 with ranks 4/6/4). The higher rankings are
also obvious in the case of total forward linkages, where linkages in terms of value added
weights (0.04/0.06/0.06 with ranks 6/4/4) are mostly higher ranked than in the case of final
value rank value rank value rank value rank value rank value rank
direct 0,00050 11 0,00472 11 0,00486 11 0,0033712
0,03188 12 0,00425 12
total (=output
multiplier)0,03956 6 0,04403 7 0,04420 7 0,03510 9 0,06740 10 0,03870 10
total (normalized
linkage)1,02844 6 0,99550 7 0,99516 7 0,91271 9 0,93393 10 0,86060 10
direct 0,00207 4 0,02132 4 0,02272 4 0,00083 4 0,00803 6 0,02393 4
total (=input
multiplier)0,03956 6 0,06203 4 0,06358 4 0,03510 9 0,04354 9 0,05969 6
total (normalized
linkage)1,02844 6 1,20115 4 1,22235 4 0,91271 9 0,97896 9 0,70928 10
5,03310 21 1,32379 22 2,31081 16 4,65719 19 1,18049 7 2,10926 17
4,83700 16 1,11609 7 2,46016 20 4,97603 11 0,99671 14 1,67406 3
Backward variation index
Post and telecommunication
Forward variation index
Backward
linkages
Forward
linkages
2007 2009 2011 2007 2009 2011
value added weights final demand weights

22
demand weights (0.04/0.04/0.06 with ranks 9/9/6). This is also the case after normalizing
total forward linkages (value added weights: 1.03/1.2/1.22 with ranks 6/4/4; final demand
weights: 0.91/0.98/0.71 with ranks 9/9/10).
Multiplier effects
Consistent with the results on linkage values, multiplier effects are lower for the sector ‘post
and telecommunication’ than for the financial sector. As depicted for the three years an
additional unit of final demand (output multiplier) would induce around 0.04 (for value added
weights) resp. around 0.04 or 0.07 (for final demand weights) cumulative revenue for the
overall economy. An additional unit of primary inputs (input multiplier) would have an
overall effect of 0.04 resp. 0.06 (for value added weights) or 0.04 resp. 0.06 (for final demand
weights).
Variation Indices
Along with the linkage results, the sector ‘post and telecommunication’ ranks lower in terms
of backward and forward variation indices. Low rankings are evident for the backward
variation index for value added weights (2007/2009/2011: 5.03/1.32/2.31 with ranks
21/22/16) and final demand weights (4.66/1.18/2.10 with ranks 19/7/17). This indicates a
rather low spread of the backward linkages to the rest of the economy. Also forward linkages
record a rather low spread to the rest of the economy, indicated by the forward variation
index, both in value added terms (4.84/1.12/2.46 with ranks 16/7/20) and final demand terms
(4.98/1/1.67 with ranks 11/14/3). Rank 3 in 2011 deviates from this result, indicating a
relatively evenly spread of forward linkages.
Key sector assessment
The classification of the normalized linkages measures of the sector ‘post and
telecommunication’ is not as clear as in the case of the financial sector. More specifically the
criterion BLnorm and FLnorm higher than 1 is only met in 2007 when value added weights
are applied (BLnorm 1.03; FLnorm 1.03). This allows a classification as key sector. For value
added weights it is remarkable that in 2009 and 2011 FLnorm is higher than 1, too (1.20 and
1.22) and BLnorm is roughly 1 (0.99 and 0.99). Hence, for value added weights this sector
may be considered as a border case key sector. Final demand weights BLnorm and FLnorm
are roughly 1 in 2007 and 2009 and hence the sector is close to be characterized as key sector.
This is not the case in 2011 (BLnorm 0.86; FLnorm 0.71).

23
Results for Kenya
(19 sectors derived by higher aggregation of the input-output tables)
Sector ‘financial services, insurance and real estate services’
Results for backward and forward linkages together with backward and forward variation
indices for all three years and value added and final demand weights are depicted in Table 5.
It additionally depicts the relative ranks of the sector’s results within the inter-industry
system.
Table 5 Inter-sectoral linkages of the financial sector in Kenya for selected years
Note: Inter-sectoral linkage measures comprise backward and forward linkages and backward and
forward variation indices for the ‘financial services, insurance and real estate’ sector, for the years
2007, 2009 and 2011 (value added and final demand weights).
Source: own calculations, based on the input-output tables from the Eora database (Lenzen et al.,
2012; Lenzen et al., 2013)
Backward linkages and forward linkages
As for direct backward linkages, the financial sector ranks relatively low both for value added
weights (2007/2009/2011: 0.001/0.02/0.001 with ranks 10/8/8) and final demand weights
(0.001/0.010/0.002 with ranks 11/10/16). Total backward linkages rank slightly higher (value
added weights:0.07/0.1/0.07 with ranks 5/6/5; final demand weights: 0.03/0.05/0.03 with
ranks 8/11/9). These rankings are similar in the case of normalized total backward linkages
(value added weights: 1.20/1.45/1.19 with ranks 5/6/5; final demand weights: 0.55/0.89/0.39
with ranks 8/10/9).
value rank value rank value rank value rank value rank value rank
direct 0,00145 10 0,02229 8 0,00129 8 0,00100 11 0,01299 10 0,00154 16
total (=output
multiplier)0,06577 5 0,10159 6 0,06577 5 0,02931 8 0,04871 11 0,02999 9
total normalized
linkage1,20362 5 1,44687 6 1,19464 5 0,54714 8 0,89161 10 0,38765 9
direct 0,00274 4 0,03189 5 0,00171 17 0,00141 7 0,01592 8 0,02888 8
total (=input
multiplier)0,06714 4 0,12521 5 0,06620 7 0,02976 8 0,05990 9 0,52862 8
total normalized
linkage1,24500 4 2,09830 5 0,98992 7 0,55212 8 1,00885 9 0,52862 8
3,51344 17 3,20721 14 4,14950 16 2,64275 16 -8,37315 2 3,99765 12
2,39015 12 2,32547 10 4,12120 16 2,37535 16 3,91350 14 4,15930 17
Backward variation index
Forward variation index
Backward
linkages
Forward
linkages
value added weights final demand weights
2007 2009 2011 2007 2009 2011
Financial services, insurance and real estate services

24
The relatively low rankings of the financial sector are confirmed by the results for forward
linkages (see Table 5). Still, slightly higher rankings are partly obvious for value added
weights for direct forward linkages (0.002/0.03/0.002 with ranks 4/5/17) and final demand
weights (0.001/0.02/0.03 with ranks 7/8/8). The relative rankings are similar when comparing
the total forward linkages (value added weights: 0.07/0.13/0.07 with ranks 4/5/7; final
demand weights: 0.03/0.06/0.53 with ranks 8/9/8) and the normalized total forward linkages
(value added weights: 1.25/2.1/0.99 with ranks 4/5/7; final demand weights: 0.55/1.01/0.53
with ranks 8/9/8).
Multiplier effects
Since multiplier values equal the total backward linkages (output multiplier) and total forward
linkages (input multiplier) it can be expected that the relative low linkage rankings of the
financial sector determine only small multiplier effects. The results of the three years reveal
that one additional unit of final demand (output multiplier) into the ‘financial services, real
estate and insurance services’ sector induces around 0.07 resp. 0.1 (for value added weights)
and around 0.03 resp. 0.05 (for final demand weights) cumulative revenue within the
economy. One additional unit of primary input yields an input multiplier around 0.07 resp.
0.13 (for value added weights) and 0.03/0.06 resp. 0.53 (for final demand weights) additional
overall economic revenue.
Variation index
The variation index provides information about the spread and the relative evenness of the
backward and forward linkages in the Kenyan economy. In all years the relative high
backward variation indices (value added weights: 3.51/3.21/4.15 with ranks 17/14/16; final
demand weights: 2.64/-8.37/4.00 with ranks 16/2/12) and forward variation indices (value
added weights: 2.39/2.32/4,12 with ranks 12/10/16; final demand weights: 2.38/3.91/4.16
with ranks 16/14/17) indicate a relatively low and uneven spread of backward and forward
linkages to the other sectors of the economy (exception: rank 2 for backward variation index
in 2009 for final demand weights).
Key sector assessment
Table 5 allows a classification of the financial sector based on total normalized backward and
forward linkages. Although linkage values are rather low, the results for value added weights
reveal that the ‘financial services, insurance and real estate services’ sector can still be

25
considered a key sector in 2007 and 2009 (BLnorm and FLnorm higher than 1). In 2011 only
BLnorm meets this criterion. For final demand weights however the values of BLnorm and
FLnorm are less than 1 in all the years, with the exception of FLnorm in 2009 (1.009).
Sector ‘communication’
Results for the linkage measures and variation indices the ‘communication’ sector are
depicted in Table 6, including corresponding sectoral rankings.
Table 6 Inter-sectoral linkages of the communication sector in Kenya for selected years
Note: Inter-sectoral linkages comprise backward and forward linkages and backward and forward
variation indices for the ‘financial services, insurance and real estate’ sector, for the years 2007, 2009
and 2011 (value added and final demand weights).
Source: own calculations, based on the input-output tables from the Eora database (Lenzen et al.,
2012; Lenzen et al., 2013)
Backward and forward linkages
Results of backward and forward linkages of the ‘communication’ sector indicate relatively
low linkage values. Rankings are predominantly lower than the ranks of the financial services
sector. Direct backward linkages rank low both for value added weights (2007/2009/2011:
0.0004/0.005/0.001 with ranks 12/13/7) and final demand weights (0.0005/0.006/0.004 with
ranks 13 resp. 11). This holds also for total backward linkages (value added weights:
0.03/0.04/0.03 with ranks 12; final demand weights: 0.02/0.03/0.03 with ranks 10/12/10). The
ranks do not change substantially after normalizing total backward linkages (value added
value rank value rank value rank value rank value rank value rank
direct 0,00040 12 0,00537 13 0,00137 7 0,00046 13 0,00573 13 0,00391 11
total (=output
multiplier)0,02950 12 0,03745 12 0,03071 12 0,02428 10 0,03253 12 0,02804 10
total normalized
linkage0,53994 12 0,53342 12 0,55784 12 0,45328 10 0,59547 11 0,36244 10
direct 0,00070 11 0,01067 12 0,00399 10 0,00027 14 0,00458 14 0,02513 10
total (=input
multiplier)0,02983 12 0,04868 13 0,03364 14 0,02409 10 0,03233 11 0,45993 10
total normalized
linkage0,55316 12 0,81573 13 0,50309 14 0,44685 10 0,54453 11 0,45993 10
2,67018 13 2,05625 5 4,03180 12 1,99897 9 -7,96388 3 3,58844 10
2,23530 9 3,92828 15 3,66895 10 2,20187 12 3,75744 13 4,02175 10
Backward variation index
Forward variation index
2011
Backward
linkages
Forward
linkages
2007 2009 2011 2007 2009
value added weights final demand weights
Communication

26
weights: 0.54/0.54/0.56 with ranks 12; final demand weights: 0.45/0.6/0.36 with ranks
10/11/10).
Forward linkage values for the ‘communication’ sector are lower than the ones of the
financial services sector. Direct forward linkages rank consistently low (value added weights:
0.0007/0.01/0.004 with ranks 11/12/10; final demand weights: 0.0003/0.005/0.03 with ranks
14/14/10), along with total forward linkages (value added weights: 0.03/0.05/0.03 with ranks
12/13/14; final demand weights: 0.02/0.03/0.46 with ranks 10/11/10). This is also underlined
when considering the results for the normalized total forward linkages (value added weights:
0.55/0.82/0.5 with ranks 12/13/14; final demand weights: 0.45/0.54/0.46 with ranks
10/11/10).
Multiplier effects
Due to the relatively low linkage values, small multiplier effects are determined in all three
years. The output multiplier (total backward linkages) indicates that one additional unit of
final demand into the ‘communication’ sector induces around 0.03 resp. 0.04 (for value added
weights) and around 0.02 resp. 0.03 (for final demand weights) cumulative revenue within the
economy. The input multiplier (total forward linkages) indicates that one additional unit of
primary input yields around 0.03 resp. 0.05 (for value added weights) and 0.02 resp. 0.03 and
0.5 (for final demand weights) additional overall economic revenue. Multiplier effects are
higher for the financial services sector than for the communication sector.
Variation index
The backward and forward variation indices indicate a rather low and uneven spread of the
linkages to the rest of the economy. Backward variation indices are predominantly low ranked
(value added weights: 2.67/2.06/4.03 with ranks 13/5/12; final demand weights: 2.0/-7.9/3.6
with ranks 9/3/10) with the exception of 2009 where a wider and more even spread of the
backward linkages is noticeable (value added weights rank 5, final demand weights rank 3).
Forward linkages are as well rather unevenly spread, indicated by a high variation indices
(value added weights: 2.24/3.93/3.67 with ranks 9/15/10; final demand weights: 2.20/3.76/4.0
with ranks 12/13/10).
Key sector assessment
The normalized backward and forward linkage measures of the ‘communication’ sector do
not allow a classification of the sector as a key sector of the Kenyan economy. All the

27
normalized linkage measures are smaller than 1 for both value added and final demand
weights in all three years.
Robustness test
In order to confirm our results from the open input-output model, we additionally test our
results by deploying the closed input-output model. We now include the final demand sectors
and value added sectors into the inter-industry system. This endogenized model takes
feedback effects and interdependencies between the production sectors and final demand
sector into account. After endogenizing final demand and value added into the inter-industry
system we proceed exactly as in the previous analysis. Again, linkages are weighted by final
demand and value added weights. The now additionally included final demand and value
added sectors are weighted by 1. We check for the same linkage measures and again
specifically focus on the financial services and communications sectors.6
Results for Nigeria
The relatively high rankings of the financial sector for total backward and total forward
linkages can be confirmed for both value added and final demand weights. The endogenized
sector final demand ranks first place. However, this is rather intuitive as it is weighted by 1.
Output multipliers vary considerably between the three years (2007/2009/2011: value added
weights: 0.38/1.01/7.89 with ranks 2/20/2; final demand weights: 0.33/14.1/11.05 with ranks
2). Based on normalized backward and forward linkages, the financial sector can be classified
as key sector in 2007 and 2011 and by approximation also in 2009 with normalized backward
linkages of value added weights in 2007/2009/2011 with 3.46/3.89/5.3 (ranks 2/2/3), final
demand weights with 3.46/0.88/1.23 (ranks 2) as well as normalized forward linkages of
value added weights with 4.73/0.88/1.21 (ranks 2/4/5) and of final demand weights with
2.89/3.23/4.32 (ranks 2).
Results for Kenya
Results for Kenya are in line with the previous results based on the open input-output model.
Total backward and total forward linkage values and rankings are relatively low for both
sectors. Output multipliers of the financial sector rank low for both value added weights
(2007/2009/2011: 0.07/0.29/0.07 with ranks 6) and final demand weights (0.08/0.44/0.09 with
ranks 8/9/9). Normalized backward linkages record values smaller than 1 for both value added
6 Detailed results are available upon request.

28
weights (0.64/0.12/0.65 with ranks 6) and final demand weights (0.58/0.86/0.6 with ranks 8).
Finally, normalized forward linkages record values smaller than 1 (value added weights:
0.61/0.70/0.63 with ranks 8/9/8 ; final demand weights: 0.27/0.06/0.28 with ranks 9/10/9).
9. Discussion
The sectoral interconnectedness of the financial services sector in the Nigerian and Kenyan
economies has been illustrated by the results of this study. The discussion summarizes the
relevant results for the financial services sector and relates them to the corresponding
hypotheses formulated in section 6. The results for the financial services sector do not deviate
substantially between the years 2007, 2009 and 2011 in both the countries.
While results for the Nigerian economy show relatively low direct backward and direct
forward linkages for the financial services sector, values for total backward and total forward
linkages rank highest in all three years. This result is of economic importance since both
linkage measures represent growth inducing mechanisms – the so-called Hirschman-type
production linkages (Tregenna, 2008, see section 2). The high total backward linkages
indicate that the financial services sector creates additional demand for the output of upstream
sectors, leading to increased upstream investment, capacity utilization and upstream
technological upgrading (see section 2). Furthermore, the relatively high total forward
linkages indicate a substantial impact on downstream sectors, including for example
downstream investment or technological upgrading. The results for the high values of forward
linkages are indicative for Hypothesis 1 (The financial sector yields significant forward
linkages to the other sectors of the economy). This is in line with Rueda-Cantuche et al.
(2012). In addition to the assumed high total forward linkages, the high total backward
linkage values underline the inter-sectoral connectedness of the financial services sector in
Nigeria. This is of specific relevance for growth stimuli. While backward linkages induce
economic development, forward linkages enable economic development. This allows a
classification of the Nigerian financial services as a sector which both induces and enables
development.
The picture is different for the inter-sectoral linkages in the Kenyan economy. Here, direct
and total backward linkages as well as direct and total forward linkages rank relatively low.
This does not support Hypothesis 1. The relatively low values of both backward and forward
linkages do not allow a distinct assignment of growth inducing or growth enabling functions
of the financial services sector in Kenya. Furthermore, the linkage values for the Nigerian

29
financial services sector are considerably higher. Yet, a direct comparison of the results
should be done with caution as there are differences in the levels of sectoral aggregation and
sectoral classifications between the two economies. A more disaggregated listing of its
components would facilitate a direct comparison of the linkage results.
The differences in the linkage values naturally also imply differences in the economy-wide
impact the financial services sector has within the two economies, as illustrated by the
multiplier effects (equivalent to total linkage measures). The high total linkage values of the
Nigerian economy imply high values of the output multiplier (equivalent to total backward
linkage) and input multiplier (equivalent to total forward linkage) of the financial services
sector. The high output multiplier of the financial services sector implies a high inducement of
cumulative revenues by one additional unit of final demand in the financial sector (see 7.3).
Furthermore, the high values of the input multiplier indicate that an additional unit of primary
input into the financial services sector has a major impact on the total output in the other
sectors of the economy. This is indicative for Hypothesis 2 (Changes in final demand or
value added in the financial sector have a wide-spread impact on the rest of the economy).
However, the variation indices indicate for value added weights a rather concentrated spread
of the linkages to the rest of the economy, whereas final demand weights approve a relatively
wider spread of the linkages to the economy. This limits the approval of Hypothesis 2 slightly,
since a wide-spread impact is only approved for final demand weights.
Results for the Kenyan economy lead to the conclusion that the financial services sector does
not yield economy wide growth effects similar to Nigeria (at least not directly), as the values
for the total backward and total forward linkages are relatively low which leads to low output
multipliers and predominantly low input multipliers. In addition to that, the variation indices
mainly indicate a low spread of the linkages of the financial services sector to the rest of the
economy (except for final demand weights 2009). In sum, Hypothesis 2 cannot be approved
for the Kenyan economy.
The significance of the financial sector for the two countries furthermore becomes clear when
looking at the key sector assessment. For Nigeria, results are evident for the key sector
assessment method applied: based on normalized backward and forward linkages, the
financial services sector clearly can be classified as a key sector of the Nigerian economy.
Results for the key sector assessment of Kenya depend on the applied sectoral weights. When
applying value added weights, the sector ‘financial services, real estate and insurance
services’ can be considered a key sector of the Kenyan economy. However, this does not
hold when applying final demand weights.

30
It is evident that results differ remarkably between the Nigerian and the Kenyan economies,
which is a confirmation of Hypothesis 3. While results clearly indicate the significant role of
the financial sector in Nigeria, this can only be proven in part for the case of Kenya. What
should be kept in mind is that the development level of the analyzed countries influences the
results. Since sectoral interdependence is largely the result of industrialization, high degrees
of sectoral linkages indicate a relatively high level of development (see Hirschman 1959, p.
104,110 for a theoretical explanation, and Yotopoulos and Nugent 1973, p. 163 for empirical
confirmation). While Nigeria is classified as a lower-middle income country, Kenya counts as
a low-income country (World Bank, 2014). We cannot fully assume that this difference in
income level solely accounts for the different extents of sectoral-interconnectedness of the
financial sectors, but since Nigeria is a country with a considerably well-developed financial
system, this can be conducive to it. The relative significance of the financial sector in the
Nigerian economy is already illustrated by its shares in total output, value added and final
demand (see Table 2). In this field, for a direct comparison of the two economies and the role
of the financial sector, a more detailed and disaggregated listing of the financial sector can
give details of this assertion.
The differences in the role of the financial sector within the economies may well be traced
back to the high prevalence of mobile money in Kenya. However, when controlling for the
role of the communication sector within both the two economies, results indicate strikingly
low linkage values in both cases. While for the Nigerian economy it can still be classified as
key sector (in part), this classification is not possible for the Kenyan economy due to
considerably low linkage values. This is not indicative for our Hypothesis 4. This result is
especially striking in the case of Kenya, as a large number of financial services is provided by
telecommunication enterprises. One reason why the results of this study do not reflect the
obviously high importance of communication services in these countries might be the
relatively high level of aggregation of the data. Since the data does not allow distinguishing
between the specific kinds of communication services, the distinction of financial services
within communication services (mobile money) is not feasible. Moreover, relatively low
values of inter-sectoral linkages might also be explained by a low degree of transparency and
data collection when it comes to mobile money transfer. A considerable amount of mobile
money transfer might not be captured by the input output data. Another important point for
both the financial and the communication sector is the consideration of the informal sector. As
a lot of financial transactions are still happening outside the formal financial sector, the data
does not capture the real size and number of transactions.

31
Results of this study document the economic significance of the financial services sector. This
is more evident for the Nigerian economy than for the Kenyan economy. But for both
countries the inter-sectoral linkages of the financial sector are channels by which the rest of
the economy is affected. Although the results differ between the Nigerian and the Kenyan
economies, it is a fact that both the economies are regional growth poles with the potential to
drive regional development. A complementary aspect is the consideration of the regional
relevance of the financial services sectors of Nigeria and Kenya for their surrounding
countries by developing multi-regional input-output tables. An efficient provision of financial
services is thus of high importance. This is of specific relevance in the context of developing
and enforcing the competitiveness of local companies which determines the ability to plug-in
or to upgrade within global value chains.

32
References
Ajakaiye, Olu and Tayo Fakiyesi (2009), Global Financial Crisis Discussion Series Paper 8:
Nigeria, Overseas Development Institute, London.
Andreosso-O'Callaghan, B. and G. Yue (2004), Inter-sectoral Linkages and Key Sectors in
China, 1987-1997, in: Asian Economic Journal, 18(2), p. 165–183.
Breda, Emanuele and Rita Cappariello (2010), A Tale of Two Bazaar economies: An Input-
Output Analysis for Germany and Italy, Banca d’Italia occasional Paper 79, Rome.
Chang, Young-Tae; Shin, Sung-Ho and Paul Tae-Woo Lee (2014), Economic impact of port
sectors on South African economy – input-output analysis, Transport Policy, 35, p. 333-
340.
Chenery, Hollis B. and Tsunehiko Watanabe (1959), International Comparisons of the
Structure of Production, Econometrica, 26(4), p. 487–521.
Creane, Susan; Goyal, Rishi; Mobarak, Mushfiq and Randa Sab (2003), Financial
Development in the Middle East and North Africa, International Monetary Fund,
Washington D.C.
Christ, Carl F. (1955), A Review of Input-Output Analysis, in: Conference on Research in
Income and Wealth (eds.): Input-Output Analysis: An Appraisal. Princeton: Princeton
University Press, p. 137–182.
Dasgupta, Paramita, and Debesh Chakraborty (2005), The Structure of the Indian Economy,
Paper presented at the 15th International Input-Output Conference, Beijing, China, P.R.
Deardorff, Alan V. (2001), International Provision of Trade Services, Trade, and
Fragmentation, World Bank Policy Research Working Paper 2548.
Demirgüc-Kunt, Asli and Leora Klapper (2012), Financial Inclusion in Africa – an overview,
World Bank Policy Research Working Paper No. 6088.
Dewhurst, John H.Li. (2010), Inter-connectedness in the Scottish Economy, Dundee
Discussion Papers in Economics, Dundee.
Draper, Peter, Freytag, Andreas and Susanne Fricke (2014), The potential of ACP countries to
participate in Global and Regional Value Chains: A Mapping of Issues and Challenges, a
report submitted to the ACP MTS Programme
Drejer, Ina (2002), Input-Output Based Measures of Interindustry Linkages Revisited A
Survey and Disucssion, Centre for Economic and Business Research Copenhangen.
Drexler, Michael; Hanouz, Margareta D.; Duffie, Darrell; Geiger, Thierry; Glass, Todd;
Reuttner, Isabella and Neeltje van Horen (2012), The Financial Development Report 2012,
World Economic Forum USA Inc., New York.
European Commission (2008), Manual of Supply, Use and Input-Output Tables, EuroStat
methodologies and working papers, 2008 edition.
Financial Stability Report (2011), Kenya’s Financial Sector Stability Report, 2011; December
2011, issue No. 3.
Francois, Joseph and Ludger Schuknecht (1999), Trade in Financial Services: Procompetitive
Effects and Growth Performance, CEPR Discussion Paper 2144.
Ghosh, A. (1958), Input-Output Approach in an Allocation System, in: Economica, 25(97), p.
58–64.
Hanink, Dean M. (1997), Principles and Applications of Economic Geography, Economy,
Policy, Environment, New York: Wiley and Sons.

33
Hansda, Sanjay K. (2007), Sustainability of Service-Led Growth: an Input-Output Exploration
of the Indian Economy, EconWPA GE Growth, Math methods No. 0512009.
Hazari, B.R. (1970), Empirical Identification of Key Sectors in the Indian Economy, The
Review of Economics and Stastistics, 52:3, pp. 301-305
Hirschman, Albert O. (1959), The Strategy of Economic Development. New Haven: Yale
University Press.
Holub, Hans-Werner and Hermann Schnabl (1994), Input-Output-Rechnung: Input Output-
Analyse. Einführung. München, Wien: Oldenbourg.
Jack, William and Tavneet Suri (2011), Mobile Money: The Economics of M-PESA, NBER
Working Paper Series, Working Paper No. 16721.
Jones, Leroy P. (1976), Measurement of Hirschmanian Linkages, in: The Quarterly Journal of
Economics, 90(2), p. 323–333.
Kaur Gunjeet, Sanjib Bordoloi and Raj Rajesh (2009), An Empirical Investigation of the
Inter-Sectoral Linkages in India, Reserve Bank of India Occasional Paper, vol. 30, issue 1.
Larreina, Mikel (2008), Financial Centres in Peripheral Regions: The Effect of the Financial
Services Industry on Regional Economy. The Case of the Scottish Financial Cluster,
Universidad Comercial de Deuste, mimeo.
Laumas, P.S. (1976), The Weighting Problem in Testing the Linkage Hypothesis, The
Quarterly Journal of Economics, 90:2, pp. 308-312
Lenzen M, Kanemoto K; Moran D, and Geschke A (2012) Mapping the structure of the world
economy, Environmental Science & Technology 46:15. 8374-8381
Lenzen, M., Moran, D., Kanemoto, K., Geschke, A. (2013) Building Eora: A Global Multi-
regional Input-Output Database at High Country and Sector Reso lution, Economic
Systems Research, 25:1, 20-49
Leontief, Wassily W. (1936), Quantitative Input and Output Relations in the Economic
Systems of the United States, in: The Review of Economics and Statistics, 18(3), p. 105–
125.
Mas, Ignacio and Daniel Radcliffe (2011), Mobile Payments Go Viral: M-PESA in Keyna,
Journal of Financial Transformation, Vol. 32, pp. 169-182.
Mattoo, Aaditya; Rathindran, Randeep and Arvind Subramanian (2001), Measuring Services
Trade Liberalization and its Impact on Economic Growth, in: World Bank Policy Research
Working Paper 2655.
Midmore, Peter, Max Munday and Annette Roberts (2006), Assessing Industry Linkages
Using Regional Input-Output Tables, Regional Studies, Vol. 40, issue 3, pp. 329-343.
Miller, Ronalds E. and Peter Blair (2009), Input Output Analysis. Foundations and
Extensions, Cambridge : Cambridge University Press.
Miroudot, Sébastien; Lanz, Rainer and Alexandros Ragoussis (2009), Trade in Intermediate
Goods and Services, in: OECD Trade Policy Working Paper No. 93.
Ncube, Mthuli (2007), Financial Services and Economic Development in Africa, Journal of
African Economies, Vol. 16 (suppl. 1), pp. 13-57.
Ngugi, R.W. and J.W. Kabubo (1998), Financial Sector Reforms and Interest Rate
Liberalization: The Kenya Experience, AERC Research Paper 72, African Economic
Research Consortium, Nairobi.
34
Ogunleyhe, E.K. (2011), Structural Transformation in sub-Saharan Africa: The regional
Growth Poles Strategy, Paper presented at the 2011 African Economic Conference,
October 25-28, 2011, Addis Ababa, Ethopia.
Olczyk, Magdalena (2010), Structural Changes in the Polish Economy - the Analysis of Input-
Output, MPRA Paper No. 33659, Munich.
Omankhanlen, Alex Ehimare (2012), The Financial Sector Reforms and Their Effect on the
Nigerian Economy, Economy Transdisciplinarity Cognition, Vol. 15, issue 2, pp. 45-57.
Park, Se-Hark (1989), Linkages between Industry and Services and their Implications for
Urban Employment Generation in Developing Countries, Journal of Development
Economics(30), p. 359–379.
Raa, Thijs ten (2005), The Economics of Input-Output Analysis, Cambridge: Cambridge
University Press.
Rashid, Abdul (2004), Sectoral Linkages; Identifying the Key Growth Stimulating Sector of
the Pakistan Economy, MPRA Paper No. 27210, Munich.
Rasmussen, P. Norregaard (1956), Studies in Inter-Sectoral Relations. Kopenhagen and
Amsterdam : Einar Harcks Forlag and North-Holland Publishing Company.
Rueda-Cantuche, J.M., Neuwahl, F.V.R. and L. Delgado (2012), The Adjustment Capacity of
the European Economy Examined with an Input-Output Based Key Sector Analysis:
Towards a Review of the European Single Market, European Commission Joint Research
Centre, JRC67436.
Salami, H.; Sadat Barikani, H. and M.S. Noori Naeini (2012), Can Agriculture be considered
a Key Sector for Economic Development in an Oil Producing Country? The Case of Iran,
Journal of Agricultural Science and Technology, 14), p. 1–10.
Singh, Nirvikar (2006), Services-Led Industrialization in India: Assessment and Lessons,
MPRA Paper No. 1276, Munich.
Stilwell, L.C., Minnitt, R.C.A, Monson, D. and G. Kuhn (2000), Input-Output analysis: its
potential application to the mining industry, in: The South African Institute of Mining and
Metallurgy.
Sutton, Christopher N. and Beth Jenkins (2007), The Role of the Financial Services Sector in
Expanding Economic Opportunity, Corporate Social Responsibility Report No. 19.
Cambridge, MA: Kennedy School of Government, Harvard University.
The Economist (2013), Why does Kenya lead the world in mobile money?, 27 March 2013,
accessible under http://www.economist.com/blogs/economist-explains/2013/05/economist-
explains-18 (visited on 3 March 2014).
Tounsi, Sais, El hadj Ezzahid, Aicha El Alaoui and Abdelaziz Nihou (2013), Key Sectors in
the Moroccan Economy: An Application of Input-Output Analysis, E-Economics, Vol. 7,
2013-18, April 26, 2013.
Tregenna, Fiona (2008), Sectoral engines of growth in South Africa: An analysis of services
and manufacturing, Research Paper / UNU-WIDER, No. 2008.98.
World Bank (2006), Making Finance Work for Africa, The World Bank, Washington D.C.
World Bank (2008), Finance for All? Policies and Pitfalls in Expanding Access. Washington,
DC, World Bank.
World Bank (2013), The Doing Business Report 2014 Understanding Regulations for Small
and Medium-sized Enterprises, 11th
edition, the World Bank, Washington.
35
World Bank (2014), World Bank Data Countries and Economies,
http://data.worldbank.org/country (visited on 12 January 2015).
World Bank (2015a), World Bank Data CPIA financial sector rating,
http://data.worldbank.org/indicator/IQ.CPA.FINS.XQ (visited on 1 April 2015).
World Bank (2015b), World Bank Data Ease of doing business index,
http://data.worldbank.org/indicator/IC.BUS.EASE.XQ (visited on 1 April 2015).
World Bank (2015c), Global Financial Development Database,
http://econ.worldbank.org/WBSITE/EXTERNAL/EXTDEC/EXTGLOBALFINREPORT/
0,,contentMDK:23492070~pagePK:64168182~piPK:64168060~theSitePK:8816097,00.ht
ml (visited on 1 April 2015).
Yotopoulos, Pan A. and Jeffrey B. Nugent (1973), A Balanced-Growth Version of the
Linkage Hypothesis: A Test, in: The Quarterly Journal of Economics, 87(2), p. 157–171.

36
Annex 1 Sectors listed in the Nigerian and Kenyan input-output tables and
classification of the Kenyan sectors for a higher aggregation
Source: Lenzen et al., 2012; Lenzen et al., 2013
Sectors in the Nigerian input output tables Sectors of the Kenyan economy
Agriculture (1) Maize Agriculture
Fishing (2) Wheat Agriculture
Mining and Quarrying (3) Rice Agriculture
Food & Beverages (4) Barley Agriculture
Textiles and Wearing Apparel (5) Cotton Agriculture
Wood and Paper (6) Other grains Agriculture
Petroleum, Chemical and Non-Metallic Mineral Products (7) Sugarcane Agriculture
Metal Products (8) Coffee Agriculture
Electrical and Machinery (9) Tea Agriculture
Transport Equipment (10) Roots and Tubers Agriculture
Other Manufacturing (11) Oils and Pulses Agriculture (1)
Recycling (12) Fruits Agriculture
Electricity, Gas and Water (13) Vegetables Agriculture
Construction (14) Cutflowers Agriculture
Maintenance and Repair (15) Other Crops Agriculture
Wholesale Trade (16) Beef Agriculture
Retail Trade (17) Dairy Agriculture
Hotels and Restraurants (18) Poultry Agriculture
Transport (19) Sheep and Goats Agriculture
Post and Telecommunications (20) Other livestock Agriculture
Finacial Intermediation and Business Activities (21) Fishing Fishing (2)
Public Administration (22) Forestry Agriculture
Education, Health and Other Services (23) Quarrying and Mining Mining and Quarrying (3)
Private Households (24) Meat and dairy processing Food & Beverages
Others (25) Grain Milling Food & Beverages (4)
Re-export & Re-import (26) Bakery and confectionary Food & Beverages
Beverages and tobacco Food & Beverages
Other food manufactures Food & Beverages
Textiles & wearing apparels Textiles and Wearing Apparel (5)
Leather and Footwear Textiles and Wearing Apparel
Wood and Paper Wood and Paper (6)
Printing and Publishing Wood and Paper
Petroleum and Gas Petroleum, Chemical and Non-Metallic Mineral Products (7)
Chemicals and chemical products Petroleum, Chemical and Non-Metallic Mineral Products
Metals and Machinery Metal Products (8)
Non-mettalic manufactures Petroleum, Chemical and Non-Metallic Mineral Products
Other Manufactures Other Manufacturing (9)
Water Electricity, Gas and Water
Electricity Electricity, Gas and Water (10)
Building and Construction Construction (11)
Trade Trade (12)
Hotels Hotels and Restraurants (13)
Transport Transport (14)
Communication Communication (15)
Financial services, real estate and insurance services Finacial Intermediation and Business Activities (16)
Restaurants Hotels and Restraurants
Other Services Education, Health and Other Services (17)
Public Administration Public Administration (18)
Health Education, Health and Other Services
Education Education, Health and Other Services
Reexport/Reimport Reexport/Reimport (19)
Electrical and Machinery
Transport Equipment
Recycling
Maintenance and Repair
Retail Trade
Private Households
Others
Classification of the Kenyan sectors for higher aggregation
Additional sectors in the Nigerian Input-output tabnles but missing in Kenya tables: