sedimentary thickness of the northern indo-gangetic plain
TRANSCRIPT

Sedimentary thickness of the northern Indo-Gangeticplain inferred from magnetotelluric studies
S DHAMODHARAN1,2, GAUTAM RAWAT
1,* , SACHIN KUMAR1
and D S BAGRI2
1Wadia Institute of Himalayan Geology, 33 GMS Road, Dehradun, India.
2Hemwati Nandan Bahuguna Garhwal University, Srinagar, India.*Corresponding author. e-mail: [email protected]
MS received 27 August 2019; revised 2 April 2020; accepted 17 April 2020
Knowledge of the sedimentary thickness and conBguration of the basement structure are important toestimate the seismic hazards in active foreland basin. We present sedimentary thickness of the northernIndo-Gangetic plain estimated from impedance tensors of 12 magnetotelluric sites. Occam’s one dimen-sional inversion scheme was applied to invariant of the magnetotelluric tensors for the period range of0.001–1 sec at each site. Inverted one dimensional model corroborates north-easterly dipping Indianbasement and accordingly increased thickness of the sedimentary column towards north and eastdirection. The top sedimentary layers of varying thickness and resistivity are correlated with the knownborewell logs and previous geophysical studies around the study area. Significant difference is observed inthe resistivity of the Indian basement and thickness of the sedimentary column across the Delhi HardwarRidge. The difference in resistivity may be an indicative of variation in compactness and degree ofsaturation of the sedimentary cover and the nature of the Indian basement rock across the Delhi HaridwarRidge.
Keywords. Indo-Gangetic plain; Himalaya; resistivity; magnetotelluric; 1D inversion; dimensionality.
1. Introduction
The sediments of the Indo-Gangetic plain (IGP)have varying thickness of *1–6 km (Lyon-Caenand Molnar 1985; Borah et al. 2015). These sedi-ments have been deposited over a deep troughformed by solid rocks of the Indian crust (Sastriet al. 1971; Rao 1973; Singh 1996). Geology andtectonic setting of the IGP, is closely related to theformation of the Himalayan orogeny. Neo-tectoni-cally active IGP was formed in response of theHimalayan uplift after the collision of India andEurasia continental plates (Dewey and Bird 1970;Pati et al. 2015). Due to the collision and subse-quent thrusting, the old sedimentary prism of an
intermediate sea was folded, faulted, thrusted anduplifted along with its basement in Cenozoic period(Burbank et al. 1996; Najman et al. 2004). Fromnorth to south, these fault lines are named as Indo-Tsangpo suture zone (ITSZ), South TibetanDetachment (STD), Main Central Thrust (MCT),Main Boundary Thrust (MBT), Himalayan Fron-tal Thrust (HFT) (Gansser 1964; Ni and Barazangi1984; Yin 2006; Jain et al. 2016; Thakur et al.2018). Further south of the HFT, a Cexure wasdeveloped on the Indian plate due to collision andpartial subduction below the overriding Eurasianplate. Later, the debris of the Himalayan sedimentsbrought by the major perennial rivers namely,Indus, Ganga, and Brahmaputra along with their
J. Earth Syst. Sci. (2020) 129:156 � Indian Academy of Scienceshttps://doi.org/10.1007/s12040-020-01422-z (0123456789().,-volV)(0123456789().,-volV)

tributaries (Lyon-Caen and Molnar 1983, 1985;Najman et al. 2004) and thus one of the world’slargest active foreland sedimentary basin over thecratonic sediment and the bend trough of theHimalayan fore deep was formed (Dewey and Bird1970; Singh et al. 2011; Pati et al. 2015). Theunderlying geology of the IGP is largely unreach-able due to the thick mask of the recent alluvialdeposits with the Siwalik sediments and assump-tions have been made about the continuation of themajor subsurface structural and tectonic featuresof the Indian peninsular shield, e.g., Aravalli–Delhifold belt and Vindhyan Group of rocks, beneath theIGP (Sastri et al. 1971; Mugnier and Huyghe 2006;Pant and Sharma 1993). These assumptions arelargely governed by the observation of gravityanomalies, magnetic data and conductivity struc-ture obtained through different geophysical stud-ies. The younger alluvium directly overlay on theSiwalik group of sediments. The Siwalik group isfurther subdivided into lower, middle, and upperlitho-stratigraphic units (Lyon-Caen and Molnar1985; Powers et al. 1998; Thakur et al. 2014) hav-ing thickness of 5–6 km (Wadia 1975). These unitsare mainly composed of sandstone, grit, conglom-erate, clay and silt which were deposited in abrackish as well as fresh water environment. IGPhas a width of 150–500 km and covers 300,000 km2
area in north India and consists of several basinslike, Punjab basin, Ganga basin, Purnea basin andBrahmaputra basin. These basins are separated byprominent structures or subsurface ridges likeDelhi–Lahore–Sargodha basement ridge, DelhiHaridwar Ridge, Faizabad Ridge andMonghyr–Saharsa Ridge (Karunakaran and RangaRao 1979; Valdiya 2016). The study area, which isa northern part of the IGP, consists of easternPunjab basin and western Ganga basin (Bgure 1)separated by the Delhi Haridwar Ridge (DHR).DHR aligned NNE–SSW is considered as northernextension of the Aravalli Mountain Belt and com-prises quartzite, slate and basic rocks of the DelhiGroup and gradually dipping down in northerndirection below the IGP (Bgure 2) and controls theforeland basin (Powers et al. 1998; Pal et al. 2000;Bagchi and Raghukanth 2017). Probable hydro-carbon potential of the Himalayan foreland basin,made an interest for various geophysical surveysand deep drilling programs conducted by Oil andNatural Gas Corporation (ONGC). In addition ofhydrocarbon potential, IGP and adjoining SiwalikHimalaya are the most susceptible regions forseismic hazards due to adjacent Himalayan seismic
zone and the thick sediment cover of the regions asit amplify the seismic waves (Khattri 1999; Parvezet al. 2006; Srinagesh et al. 2011; Borah et al. 2015;Bagchi and Raghukanth 2017). The knowledge ofsedimentary structure is required to quantify seis-mic hazard and ampliBcation role of the sedimentsin this region. The subsurface information can berevealed by various geophysical methods, viz.,gravity, seismic and electromagnetic (EM) geo-physics. The magnetotelluric (MT) method is oneof the EM methods which can be eAectively appliedto evaluate the thickness of the sedimentary basinand its basement structure, as there exist strongcontrast in resistivity between the conductivesedimentary basin and a resistive crystalline base-ment (Tournerie and Chouteau 2005; Consta-ble et al. 2009). Magnetotelluric investigationsfocussed on imaging subsurface of the Himalaya arebeing carried out along different transects inUttrakhand (Gupta and Gokaran 1994; Israil et al.2008; Rawat et al. 2014) and Himachal Himalaya(Gokarn et al. 2002; Veeraswamy et al. 2010),which provides geoelectrical properties of the sub-surface along the transect. In this present work, weare using 1D inversion of MT transfer functionobtained for MT sites occupied over the GangaPlain. These sites are part of three different MTproBles cutting across the Himalaya alongNahan–Kaurik Chango, Bijinaur–Mallari andPilibhit-Malpa, respectively. Each of these proBlestarts from the Ganga plains and cut across themajor thrust faults of the Indian Himalaya. Higherfrequency (1000 Hz–1 sec) MT data from Gangaplain largely reCect one dimensionality in resistiv-ity variation (Rawat et al. 2014; Manglik et al.2015). Therefore, 1D inversion of MT data overGanga plain for the period band of 1000 Hz–1 sec isattempted with an objective of providing constrainon sedimentary thickness of Ganga Plain.
2. Earlier geophysical studies
The sedimentary structure and its thicknessbeneath the IGP were inferred by various geo-physical studies, viz., gravity, seismic, aeromag-netic, magnetotelluric and borehole drilling datafrom the ONGC (Agocs 1957; Rao 1973; Kar-unakaran and Ranga Rao 1979; Gokarn et al. 2002;Israil et al. 2008; Rawat et al. 2014; Borah et al.2015). Initial aeromagnetic survey of the IGPshows thickness of the sedimentary columnincreasing towards the Himalayan foothills
156 Page 2 of 12 J. Earth Syst. Sci. (2020) 129:156

Figure 1. Tectonic map of Indo-Gangetic Plain and adjoining area after Sastri et al. (1971) and Karunakaran and Ranga Rao(1979). Red triangles are MT stations. MBT: Main Boundary Thrust, MCT: Main Central Thrust, DHR: Delhi Haridwar Ridge,distribution of earthquakes for the period of 1956–2017 has been shown in map, source: http://www.isc.ac.uk/iscbulletin/search/catalogue, �: ONGC borehole location with borehole logs (Karunakaran and Ranga Rao 1979), Basement contour (m) given byAgocs (1957).
Figure 2. Balanced structural cross section (along the proBle AB in Bgure 1) of the foreland basin modiBed after Powers et al.(1998) illustrating the thickness of the sediments and basement conBguration of the foreland basin.
J. Earth Syst. Sci. (2020) 129:156 Page 3 of 12 156

reaching more than 10 km in Siwalik Himalaya andeasterly dipping Indian basement in IGP, wherethe sedimentary thickness reaching more than6 km around Sarada depression (Agocs 1957; Sastriet al. 1971; Karunakaran and Ranga Rao 1979).Drilling and geophysical survey by ONGC indicatethat the basement of IGP consisting of Delhi group,Bundelkhand Gneiss, Aravalli group and Vindhyangroup dips gradually towards north and lies about4–6 km depth below the sediments around theHimalayan foothills (Bgure 2). From the boreholedata in Bgure 1, younger alluvium of the IGP hasoverlain the Siwalik sediments and Siwalik sedi-ments directly overlain on the Precambrian base-ment in western portion (Punjab plains), while ineastern portion (Ganga plains), the Siwalik sedi-ments have overlain the Vindhyan sedimentswhich is deposited over the metamorphosed Indianbasement (Sastri et al. 1971; Rao 1973). Powerset al. (1998) observed northwest portion of theHimalayan foreland basin sediment is detachedfrom pre-Tertiary basement along a shallow dip-ping decollement with the lateral ramp betweenKangra re-entrant (dips 2.5�) and Dehradun re-entrant (dips 6�) which explains the basement ofthe Indian crust has northeast dipping. BasementconBguration and sedimentary thickness of theIGP estimated by seismic studies carried out byvarious researchers, viz., Singh (1996), Dasguptaet al. (2000), Rai et al. (2006), Srinivas et al.(2013), Borah et al. (2015) and Hazarika et al.(2017) show that (a) sedimentary thickness of theIGP varies between 3 and 6 km, (b) the sedimentthickness increases from south to north, and (c) thebottom of the IGP is composed of metamorphosedPrecambrian basement and Late Proterozoic sedi-ments. Magneto-variational studies (Lilley et al.1981; Arora et al. 1982) delineated a mid-crustalconductor and interpreted it as the DHR, acrossthe western Ganga basin. MT observations ofGupta and Gokaran (1994), between Mohand andRamnagar on the Siwalik sediments of the Hima-layan foothills revealed that the subsurface geo-electric structure is predominantly four layeredand was explained as upper three layers of sedi-ments overlying a resistive basement. Top layeraround 50 m thick was due to the recent alluvialand post-Siwalik sediments deposited over a moreresistive Upper Siwalik layer with the thicknessbetween 700 and 1000 m. The third layer wasaround 3–4 km thick and recognised as the Middleand Lower Siwaliks. The resistive basement wasdelineated in Una and Mandi MT proBle at depths
in the range between 5 and 8 km from the surface(Gokarn et al. 2002). The results of 1D Occam’sinversion in central Ganga foreland basin revealedthat the south part of the Ganga basin has verythin sedimentary layer (500–600 m around Kan-pur), while northing towards the Himalaya thick-ness of the sedimentary column increases and reacharound 9 km around Siwaliks (Manglik et al. 2015).2D inversion of MT data in Garhwal Himalayaconducted by Israil et al. (2008) and Rawat et al.(2014) show the high conducting shallow depthlayer in foreland basin around the foothills ofHimalaya.Balanced structural cross section (along the
proBle AB in Bgure 1) of the foreland basin modi-Bed after Powers et al. (1998) explains the thick-ness of the sediments and basement conBgurationof the foreland basin.
3. Magnetotelluric method
Magnetotelluric is a natural source EM method(Tikhonov 1950; Cagniard 1953), which is used tothe study subsurface structure in terms of resis-tivity distribution. In this method, simultaneoustime variations of the Earth’s electrical (E) andmagnetic (B) Belds in orthogonal components aremeasured. These measurements provide informa-tion on the electrical conductivity structure of thesubsurface. The impedance tensor Z, which relatesinput magnetic Beld variations to output electricBeld measured over the surface of the Earth, isdeBned as:
E ¼ Z � B ð1Þ
The apparent resistivity is calculated fromimpedance tensor Z using
qaij ¼T
2pl0Zij
��
��2; ð2Þ
where Zij represents the elements of the impedancetensor Z.EM waves diffuse as they pass through the Earth
with the depth of penetration related to the period ofthe inducing magnetic Beld. The EM skin depth d, orthe depth at which the EM Belds are attenuated toe�1 of their surface amplitudes, is deBned as:
d ¼ pTqa=pl0 � 500
pTqappmeter; ð3Þ
where l0 is the magnetic permeability, equal to4p 9 10�7N/A2, T is the period, and qapp is the
156 Page 4 of 12 J. Earth Syst. Sci. (2020) 129:156

apparent resistivity, or resistivity of an equivalentuniform half-space.MT impedance tensors are subject to dimen-
sionality analysis to know which type of modellingapproach is suitable for modelling to retrieve thegeoelectrical structure. The regional geoelectricalstructure could be 1D, 2D, 3D or mixed.
4. Data acquisition and analysis
To study the resistivity variations in northernIGP, we analysed 12 BBMT sites (Bgure 1) fromthe Himalayan foreland basin which are part ofdifferent MT proBles cutting across the Hima-layan lithotectonic units. Based on the locationgiven in Bgure 1, the BBMT sites are divided inthree different proBles. Each proBle has fournumbers of stations and the distance betweenproBle 1 and proBle 2 is 140 km, and the distancebetween proBle 2 and proBle 3 is 180 km. Thesites situated west to the DHR are grouped in
proBle 1 with the length of 30 km and locatedsouthward in Nahan–Leopargil proBle. MT siteslocated immediate east to DHR and part of Bij-naur–Mallari proBle are grouped as proBle 2 withthe length of 55 km, whereas proBle 3 consists ofthe sites located immediate west of Saradadepression and part of Pilibhit–Malpa proBlewith the length of 50 km. MT sites at each pro-Bles are numbered from immediate south of theHFT. Location of MT sites are displayed usingsolid triangle in Bgure 1. At each sites, Bvecomponent MT time series were recorded for4–5 days duration using ADU-06 and ADU07e(Ms. Metronix, GmbH, Germany) recordingsystem. Pb–PbCl2 electrodes and induction coilmagnetic Beld sensors (MFS-06 and MFS06e),respectively, were used to measure electric andmagnetic components of the EM Beld. Therecorded time series were pre-processed for jumpsand spikes and then robustly processed for theestimation of MT impedance tensor. Coherencycriterion was applied to select segments of good
Figure 3. Apparent resistivity curves of proBle 1, 2 and 3 as a,b and c.
J. Earth Syst. Sci. (2020) 129:156 Page 5 of 12 156

cross correlation between electric and magneticBelds from the time series. MT impedance tensorsfor period range of 0.001–1000 sec were computedat each site. Previous MT investigations in theGarhwal Himalaya suggested variable regionaldimensionality, where the large number of MTresponses reCected 2D character and 2D mod-elling was attempted along the proBle; however,from all the MT responses the sites on the IGPshow 1D characteristic (Rawat 2013). Most of thesites showing xy- (N–S) and yx- (E–W) orthog-onal components of apparent resistivity andphase curves (Bgure 3) are similar at low periodsindicating the presence of a homogeneous elec-trically conductive layer. Therefore, 1D inversionmay be performed to obtain the thickness of thesedimentary structure overlying the basement.For the proBle 1, average resistivity is approxi-mately 10 X-m and with this average resistivity,
the skin depth relationship provide depth ofinvestigation is around 5 km, whereas for otherproBles average resitivity of 50 X-m provideapproximate depth of investigation of 11 km.We have carried out Swift skew (Swift 1967),
Bahr phase sensitive skew (Bahr 1988, 1991)analysis (Bgure 4) and WAL invariants (Weaveret al. 2000) to test the validity of the 1-Dassumption to map the sedimentary structureoverlying the Indian basement. From Bgure 4, it isobserved that Swift skew is almost 0 for all theperiods barring few at longer periods especially inproBle 1. Similarly, Bahr’s phase sensitive skew isalmost 0 for all the periods. Swift skew and Bahr’sphase sensitive skew value indicate that the 1D MTresponses are dominant in the period range of0.001–1 sec for proBle 2 and 3, whereas proBle 1shows 1D nature only in the period range of0.001–0.01 sec.
Figure 4. (a) Swift skew and (b) Bahr’s phase sensitive skew of all sites.
156 Page 6 of 12 J. Earth Syst. Sci. (2020) 129:156
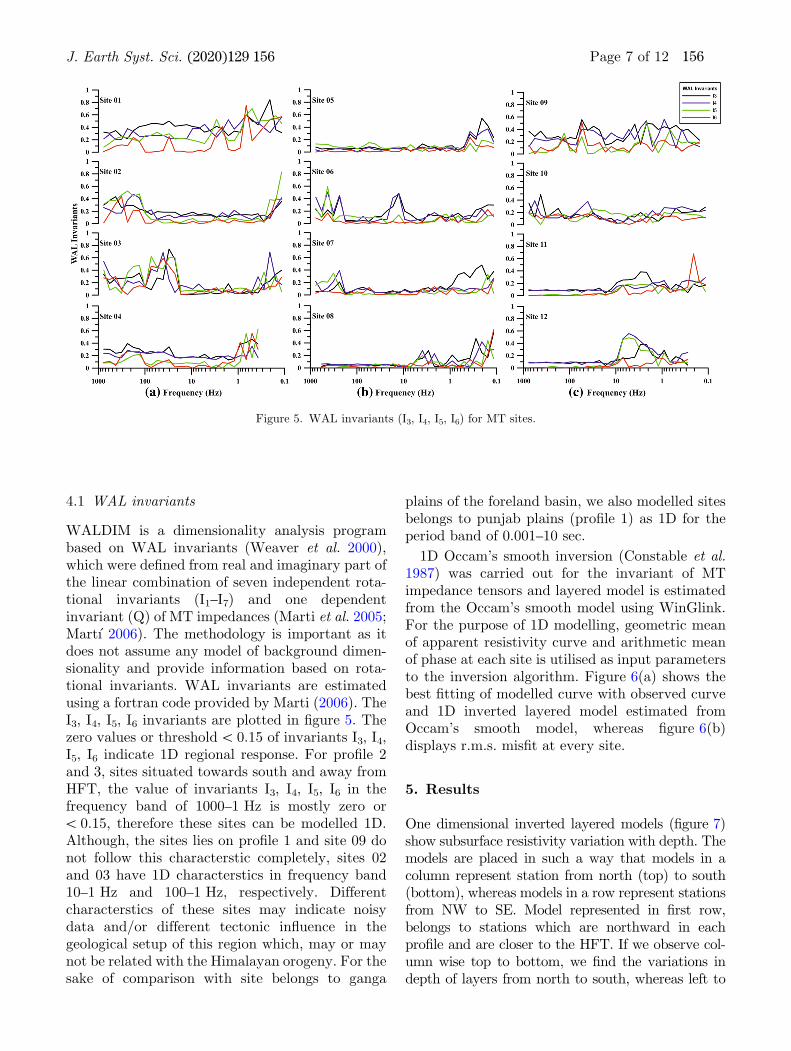
4.1 WAL invariants
WALDIM is a dimensionality analysis programbased on WAL invariants (Weaver et al. 2000),which were deBned from real and imaginary part ofthe linear combination of seven independent rota-tional invariants (I1–I7) and one dependentinvariant (Q) of MT impedances (Marti et al. 2005;Mart�ı 2006). The methodology is important as itdoes not assume any model of background dimen-sionality and provide information based on rota-tional invariants. WAL invariants are estimatedusing a fortran code provided by Marti (2006). TheI3, I4, I5, I6 invariants are plotted in Bgure 5. Thezero values or threshold\ 0.15 of invariants I3, I4,I5, I6 indicate 1D regional response. For proBle 2and 3, sites situated towards south and away fromHFT, the value of invariants I3, I4, I5, I6 in thefrequency band of 1000–1 Hz is mostly zero or\ 0.15, therefore these sites can be modelled 1D.Although, the sites lies on proBle 1 and site 09 donot follow this characterstic completely, sites 02and 03 have 1D characterstics in frequency band10–1 Hz and 100–1 Hz, respectively. Differentcharacterstics of these sites may indicate noisydata and/or different tectonic inCuence in thegeological setup of this region which, may or maynot be related with the Himalayan orogeny. For thesake of comparison with site belongs to ganga
plains of the foreland basin, we also modelled sitesbelongs to punjab plains (proBle 1) as 1D for theperiod band of 0.001–10 sec.
1D Occam’s smooth inversion (Constable et al.1987) was carried out for the invariant of MTimpedance tensors and layered model is estimatedfrom the Occam’s smooth model using WinGlink.For the purpose of 1D modelling, geometric meanof apparent resistivity curve and arithmetic meanof phase at each site is utilised as input parametersto the inversion algorithm. Figure 6(a) shows thebest Btting of modelled curve with observed curveand 1D inverted layered model estimated fromOccam’s smooth model, whereas Bgure 6(b)displays r.m.s. misBt at every site.
5. Results
One dimensional inverted layered models (Bgure 7)show subsurface resistivity variation with depth. Themodels are placed in such a way that models in acolumn represent station from north (top) to south(bottom), whereas models in a row represent stationsfrom NW to SE. Model represented in Brst row,belongs to stations which are northward in eachproBle and are closer to the HFT. If we observe col-umn wise top to bottom, we Bnd the variations indepth of layers from north to south, whereas left to
Figure 5. WAL invariants (I3, I4, I5, I6) for MT sites.
J. Earth Syst. Sci. (2020) 129:156 Page 7 of 12 156

right observation in row indicate variations in depthof layers in foreland basin along the Himalayan arc.
5.1 ProBle 1
The sites in this proBle are located in Punjabplains. Site no. 1 (SNG), is installed at Singhaulivillage. Here HFT dips 20�–30� towards N to NNEand marked by the Tertiary rocks (Middle Siwaliksandstones) over the Quaternary alluvium in thepiedmont zone (Philip et al. 2014). Inversion of MTdata in this group of sites has revealed four differ-ent layers. The top-most layer is having resistivityvariation from 9 to 14 X-m with the thicknessof 96–360 m (Bgure 7, column 1) followed bythe second layer which is having thickness of147–995 m with the moderate resistivity of11–237 X-m and the third layer is having resistivityapproximately 10 X-m with the thickness ranging
from 2400 to 3500 m. Fourth layer is markedby significant resistivity contrast from 367 to1150 X-m. This layer is interpreted as highlyresistive Indian basement and there is increase inits depth from south to north indicating northwarddip. The layer at a depth of 2400–3500 m at allsites of this group may be interpreted as thickSiwalik sediments. The low resistivity (around10 X-m) of this layer is indicative of highlysaturated pore spaces.
5.2 ProBle 2
The inversion models shown in the centre column(Bgure 7) are for the sites located at east of theDHR on Ganga plains. Here, basement of the IGPis estimated at 5100 m at site 05, 4270 m at site 06,3237 m at site 07 and 4485 m at site 08 with thesignificant changes in resistivity. Site no. 05 is
Figure 6. (a) Calculated and modelled response for site number 04 (BWL) and (b) misBt curve for all sites.
156 Page 8 of 12 J. Earth Syst. Sci. (2020) 129:156

located near HFT and having thick sedimentarycolumn. The inversion models of these sites revealfour layers, except for the site no. 8, where Bve
layers are observed due to considerable resistivitycontrasts. An important characteristic feature ofinversion models in this proBle is having lowresistive basement for sites 5, 6 and 7, whereas forsite 8 the basement is resistive. This difference isindicative of certain transition from south to north.The top layers in the inverted model of these sitesare moderately resistive between 31 and 56 X-mand having thickness of 271–523 m. The secondlayer at the site no. 5 is having resistivity of 13 X-mand thickness of 4829 m. The base of this layerwhere resistivity changes from 13 to 115 X-m at adepth of 5100 m mark the onset of basement rocksof the Indian origin and further resistivity of thebasement decrease at depth of 8145 m. In thisproBle, third layer having resistivity of 115 X-mmay be representing the Vindhyan sediments.
5.3 ProBle 3
The sites of this proBle are located over the westernCank of the Sarada depression (Bgure 1). Inversionsof MT sites reveal four layers at each site similar toother groups. The topmost layer shows moderateresistive nature ranging from 37 to 78 X-m with thedepth variation of 580–727 m. The low resistivityof second layer of this group (*11 X-m) may bedue to saturation with water. The fourth layer isthe basement of the IGP sedimentary basin esti-mated with thickness from north to south 5636,4500, 5322 and 5929 m, respectively, showing verylow resistivity.
6. Discussion
From the 1D inversion, the layered Earth models ofthe study area reveal four different layers at allsites except site no. 5 and 10, where Bve layers areobserved. The observation are similar to 1D MTobservation on the Siwalik sediments of theMohand and Ramnagar area by Gupta andGokaran (1994), where they also conformed threegeoelectric subsurface layers. However, it may benoted that the MT sites occupied by them werefrom Mohand to Ramnagar and were in closeproximity to HFT. Comparing with the borewelllog (with in Bgure 1) and balanced cross section(Bgure 2) with the present 1D inversion models, itis interpreted that top layer at every sites repre-sents dry younger alluvium as observed by mod-erate resistivity. Second layer represents the upperSiwalik along proBle 1 and middle Siwalik along
Figure 7. Layered 1D model derived from Occam Smoothmodel.
J. Earth Syst. Sci. (2020) 129:156 Page 9 of 12 156

proBles 2 and 3. The third layer in proBle 1 appearsto resemble middle Siwalik sediments and Vind-hyan sediments in proBles 2 and 3 due to the esti-mated difference in resistivity. The fourth layerrepresents the Precambrian basement rocks of theIndian crust. There is significant difference inresistivity of the basement rocks observed in Pun-jab plains and Ganga plains (across the DHR) dueto difference in nature of the basement rock and itis also supported by borewell data, seismic reCec-tion studies by ONGC (Karunakaran and RangaRao 1979; Powers et al. 1998) and seismic studies(Srinivas et al. 2013; Hazarika et al. 2017). ONGCborehole in Adampur village northwest to proBle 1shows 2513 m thick Siwalik sediments over themetamorphosed granitic basement (with inBgure 1), whereas another borewell log of Ujhaniaround 120 km south of site 12 described by Rao(1973) and Sastri et al. (1971) estimated thethickness of alluvium and upper Siwalik 705,1018 m, respectively, and highly metamorphosedPrecambrian basement rocks marked at 2015 mexplaining thickness of sediments decreasestowards south. These observations are in goodcorrelation with observed resistivity variation withdepth in this study. Although there is paucity ofdata to large spacing of MT sites along the Gangaplain, the observations from 1D inversion of MTtransfer function provide new constraint on thedepth and thickness of different layers of sedi-mentary cover beneath MT sites discussed in thispaper. Correlating these observations with largerwavelength variation of foreland sedimentarybasin, it can be inferred that the depth of thebasement increases north-easterly and is well cor-related with the balanced cross section given byPowers et al. (1998) and previous crustal studieshave been done by ONGC. This may have somebearing over the geometry of the MHT. Further,resistivity variations of different layers and base-ment along the sites discussed in this study may behelpful in understanding the nature of the sedi-ments and indicate significant differences acrossthe DHR. Earthquake events selected from ISCcatalogue with improved location (Bond�ar et al.2015; Di et al. 2015) are plotted in the map(Bgure 1) indicate the difference of focal depthsand magnitudes across the DHR. This difference isindicative of inCuence of DHR (Gahalaut andKundu 2012). The events occurring eastern side ofthe study area are inCuenced by collapse of meta-morphosed basement below the sedimentary cover(Hukku 1964; Kaila et al. 1968).
7. Conclusion
Thickness of the sedimentary column and base-ment conBguration of the Himalayan forelandbasin is estimated in various studies (Agocs 1957;Sastri et al. 1971; Rao 1973; Karunakaran andRanga Rao 1979; Raviverman et al. 1983; Lyon-Caen and Molnar 1985; Singh 1996; Dasgupta et al.2000; Gokran et al. 2002; Rai et al. 2006; Israil et al.2008; Srinivas et al. 2013; Rawat et al. 2014; Borahet al. 2015; Hazarika et al. 2017) for hydrocarbonexploration and seismic assessment. The presentstudy in northern Indo-Gangetic plain using MTdata also support the inferences obtained fromprevious works. These MT impedance tensors ofIGP reCect 1D signature of the regional geoelec-trical structure predominantly in higher frequency.Therefore, one dimensional Occam’s smoothinversion is applied to invariant of MT tensor andlayered model is retrieved. Combining inferencesfrom previous studies in the region and 1D layeredmodel obtained from MT invariants of MT sitesused in this study, we conBrm following:
1. The Indian basement is dipping towards theHimalayan arc and the thickness of the sedimen-tary column is declining gradually towards south.
2. Significant difference has been identiBed inresistivity of upper younger alluvium, theSiwalik sediments, Vindhyan sediments (inGanga plains) and the basement rocks.
3. The basements rocks between Ganga andPunjab plains were observed with significantresistivity difference.
4. Siwalik sediments of the IGP are highly con-ducting due to less compactness and high degreeof saturation.
Acknowledgements
We are thankful to the Director, Wadia Institute ofHimalayan Geology (WIHG) for the support,facilities to carryout the work and his kind per-mission to publish the work. We also thank thereviewers for their valuable comments to improvethe manuscript.
References
Arora B R, Lilley F E M, Sloane M N, Singh B P, Srivastava BJ and Prasad S N 1982 Geomagnetic induction and
156 Page 10 of 12 J. Earth Syst. Sci. (2020) 129:156

conductive structures in northwest India; Geophys. J. R.Astron. Soc. 69 459–475.
Agocs W B 1957 Airborne magnetometer survey: 1. Indo-Gangetic plains. 2. Rajasthan; Unpublished report submit-ted to Government of India.
Bagchi S and Raghukanth S T G 2017 Seismic response of thecentral part of Indo-Gangetic Plain; J. Earthq. Eng. 23183–207, https://doi.org/10.1080/13632469.2017.1323044.
Bahr K 1988 Interpretadon of the magnetotelluric impedancetensor: Regional induction and local telluric distortion; J.Geophys. 62 119–127.
Bahr K 1991 Geological noise in magnetotelluric data: A classi-Bcation of distortion types;Phys.EarthPlanet. Inter.66 24–38.
Bond�ar I, Engdahl E R, Villasenor A, Harris J and Storchak D2015 ISC-GEM: Global Instrumental Earthquake Cata-logue (1900–2009), II. Location and seismicity patterns;Phys. Earth Planet. Inter. 239 2–13, https://doi.org/10.1016/j.pepi.2014.06.002.
Borah K, Kanna N, Rai S S and Prakasam K S 2015 Sedimentthickness beneath the Indo-Gangetic Plain and SiwalikHimalaya inferred from receiver function modelling; J.Asian Earth Sci. 99 41–56, https://doi.org/10.1016/j.jseaes.2014.12.010.
Burbank D W, Beck R A and Mulder T 1996 The Himalayanforeland basin; In: Tectonic evolution of Asia (eds) Yin Aand Harrison T M, Cambridge University Press, Cam-bridge, pp. 149–188.
Cagniard L 1953 Basic theory of the magnetotelluric methodof geophysical prospecting; Geophysics 18 605–635.
Constable S C, Parker R L and Constable C G 1987 Practicalalgorithm for generating smooth models from electromag-netic sounding data; Geophysics 52 289–300.
Constable S, Key K and Lewis L 2009 Mapping oAshoresedimentary structure using electromagnetic methods andterrain eAects in marine magnetotelluric data; Geophys.J. Int. 176 431–442, https://doi.org/10.1111/j.1365-246X.2008.03975.x.
Dasgupta S, Pande P, Ganguly D, Iqbal Z, Sanyal K,Venkataramana N V, Roy A, Das L K, Misra P S andGupta H K 2000 Seismotectonic atlas of India and itsenvirons (eds) Narula P L, Acharyya S K and Banerjee J,Geological Survey of India, Kolkata, 43-sheets.
Dewey J F and Bird J M 1970 Mountain belts and the newglobal tectonics; J. Geophys. Res. 75 14.
Di D, Bond�ar I, Storchak D A, Engdahl E R, Bormann P andHarris J 2015 ISC-GEM: Global Instrumental EarthquakeCatalogue (1900–2009), III. Re-computed MS and mb,proxy MW, Bnal magnitude composition and completenessassessment; Phys. Earth Planet. Inter. 239 33–47, https://doi.org/10.1016/j.pepi.2014.06.005.
Gahalaut V K and Kundu B 2012 Possible inCuence ofsubducting ridges on the Himalayan arc and on the rupturesof great and major Himalayan earthquakes; Gondwana Res.21(4) 1080–1088, https://doi.org/10.1016/j.gr.2011.07.021.
Gansser A 1964 Geology of the Himalayas; Wiley Interscience,289p.
Gokarn S G, Rao C K and Gupta G 2002 Crustal structure inthe Siwalik Himalayas using magnetotelluric studies; EarthPlanets Space 54 19–30.
Gupta G and Gokaran S G 1994 Thickness of the Siwaliksediments in the Mohand–Ramnagar region using magne-totelluric studies; Phys. Earth Planet. Inter. 83 217–224.
Hazarika D, Wadhawan M, Paul A, Kumar N and Borah K2017 Geometry of the Main Himalayan Thrust and Mohobeneath Satluj valley, northwest Himalaya: Constraintsfrom receiver function analysis; J. Geophys. Res. SolidEarth. 122 2929–2945, https://doi.org/10.1002/2016JB013783.
Hukku B M 1964 Report on the geological investigations of theminor earthquakes around Sonepat (unpublished); Geolog-ical Survey of India.
Israil M, Tyagi D K, Gupta P K and Niwas S 2008Magnetotelluric investigations for imaging electrical struc-ture of Garhwal Himalayan corridor; J. Earth Syst. Sci. 117189–200.
Jain A K, Dasgupta S S, Bhargava O N, Israil M, JayangondaPerumal R, Patel R C, Mukul M, Parcha S K, Adlakha V,Agarwal K K, Singh P, Bhattacharyya K, Pant N C andBanerjee D M 2016 Tectonics and evolution of theHimalaya; Proc. Indian Nat. Sci. Acad. 82 581–604,https://doi.org/10.16943/ptinsa/2016/48469.
Kaila K L, Reddy P R and Hari Narain 1968 Crustal structurein the Himalayan foothills area of north India, from ‘p’ wavedata of shallow earthquakes; Bull. Seismol. Soc. Am. 58(2)597–612.
Karunakaran C and Ranga Rao A 1979 Status of explorationfor hydrocarbons in the himalayan region – contribution tostratigraphy and structure; Geol. Surv. India 41 1–66.
Khattri K N 1999 Probabilities of occurrence of great earth-quakes in the Himalaya; Proc. Indian Acad. Sci. (EarthPlanet. Sci.) 108 87–92.
Lilley F E M, Singh B P, Arora B R, Srivastava B J, Prasad SN and Sloane M N 1981 Magnetometer array study innorthwest India; Phys. Earth Planet. Inter. 25 232–240.
Lyon-Caen H and Molnar P 1983 Constraints on the structureof the Himalaya from an analysis of gravity anomalies and aCexural model of the lithosphere; J. Geophys. Res. 88 8171,https://doi.org/10.1029/JB088iB10p08171.
Lyon-Caen H and Molnar P 1985 Gravity anomalies, Cexureof the Indian plate. And the structure, support andevolution of the Himalaya and the Ganga basin; Tecton-ics 4 513–538.
Manglik A, Adilakshmi L, Suresh M and Thiagarajan S 2015Thick sedimentary sequence around Bahraich in thenorthern part of the central Ganga foreland basin; Tectono-phys. 653 33–40, https://doi.org/10.1016/j.tecto.2015.03.024.
Marti A, Queralt A P, Jones A and Ledo J 2005 ImprovingBahr’s invariant parameters using the WAL approach;Geophys. J. Int. 163 38–41.
Mart�ı A 2006 A magnetotelluric investigation of geoelectricdimensionality and study of the central Betic crustalstructure; PhD Dissertation, Universitatde Barcelona 306,http://www.tdx.cat/TDX-0115107-115853S.
Mugnier J L and Huyghe P 2006 Ganges basin geometryrecords a pre-15 Ma isostatic rebound of Himalaya; Geol.Soc. Am. 34 445–448, https://doi.org/10.1130/G22089.1.
Najman Y, Johnson C, White N M and Oliver G 2004Evolution of the Himalayan foreland basin, NW India;Basin Res. 16 1–24, https://doi.org/10.1111/j.1365-2117.2003.00223.x.
Ni J and Barazangi M 1984 Seismotectonics of the Himalayancollision zone: Geometry of the underthrusting Indian platebeneath the Himalaya; J. Geophys. Res. 89 1147–1163.
J. Earth Syst. Sci. (2020) 129:156 Page 11 of 12 156

Pal D, Srivastava R A K and Mathur N S 2000 InCuence ofDelhi–Hardwar–Harsil Ridge (DHHR) on Basin ConBgura-tion in Himalayan Foothills Belt during Tertiary; Him.Geol. 21(1) 1–11.
Pant C C and Sharma A K 1993 Quaternary sedimentation inthe Indo Gangetic Basin: A review; Curr. Sci. 64 855–862.
Parvez I A, Vaccari F and Panza G F 2006 InCuence of sourcedistance on site-effects in Delhi city; Curr. Sci. 91(6)827–835.
Pati P, Pradhan R M, Dash C, Parkash B, Awasthi A K 2015Terminal fans and the Ganga plain tectonism: A study ofneotectonism and segmentation episodes of the Indo-Gangetic foreland basin, India; Earth-Sci. Rev. 148134–149, https://doi.org/10.1016/j.earscirev.2015.06.002.
Philip G, Suresh N and Bhakuni S S 2014 Active tectonics inthe northwestern outer Himalaya: Evidence of large-mag-nitude palaeoearthquakes in Pinjaur Dun and the frontalHimalaya; Curr. Sci. 106 211–222.
Powers P M, Lillie R J and Yeats R S 1998 Structure andshortening of the Kangra and Dehra Dun reentrants, sub-Himalaya, India; Bull. Geol. Soc. Am. 110 1010–1027,https://doi.org/10.1130/0016-7606(1998)110%3c1010:SASOTK%3e2.3.CO;2.
Rai S S, Priestley K, Gaur V K, Mitra S, Singh M P and SearleM 2006 ConBguration of the Indian Moho beneath the NWHimalaya and Ladakh; Geophys. Res. Lett. 33, L15308,http://dx.doi.org/10.1111/j.1365-246X.2007.
Raiverman V, Kunte S V and Mukherjea A 1983 Basingeometry, Cenozoic sedimentation, and hydrocarbon pro-spects in northwestern Himalaya and Indo-Gangetic plains;Petrol. Asia J. 6 67–92.
Rao M B R 1973 The Subsurface Geology of the Indo-GangeticPlains; J. Geol. Soc. India 14 217–242.
Rawat G 2013 Electrical conductivity imaging of UttarakhandHimalaya using MT method; Ph.D. Thesis, IIT Roorkee,Roorkee.
Rawat G, Arora B R and Gupta P K 2014 Electrical resistivitycross-section across the Garhwal Himalaya: Proxy to Cuid-seismicity linkage; Tectonophys. 637 68–79, https://doi.org/10.1016/j.tecto.2014.09.015.
Sastri V V, Bhandari L L, Raju A T R and Datta A K 1971Tectonic framework and subsurface stratigraphy of theGanga basin; J. Geol. Soc. India 12 212–223.
Singh I B 1996 Geological evolution of Ganga Plain – Anoverview; J. Palaeontol. Soc. India 41 99–137.
Singh T, Sharma U, Awasthi A K, Virdi N S and Kumar R2011 Geomorphic and structural evidences of neotectonicactivity in the Sub-Himalayan belt of Nahan Salient, NW
India; J. Geol. Soc. India 77 175–182, https://doi.org/10.1007/s12594-011-0021-8.
Srinagesh D, Singh S K, Chadha R K, Paul A, Suresh G,Ordaz M and Dattatrayam R S 2011 AmpliBcation ofseismic waves in the Central Indo-Gangetic Basin, India;Seismol. Soc. Am. 101(5) 2231–2242.
Srinivas D, Srinagesh D, Chadha R K and Ravi Kumar M 2013Sedimentary thickness variations in the Indo-Gangetic fore-deep from inversion of receiver functions; Bull. Seismol. Soc.Am. 103 2257–2265, https://doi.org/10.1785/0120120046.
Swift C M 1967 A magnetotelluric investigation of anelectrical conductivity anomaly in the South WesternUnited States; Ph.D. Thesis, M.I.T, Cambridge, Mass.
Tikhonov A N 1950 On determination of electric character-istics of deep layers of the earth’s crust; Dokl. Acad. NaukSSSR 151 295–297.
Tournerie B and M Chouteau 2005 Three-dimensional mag-netotelluric survey to image structure and stratigraphy of asedimentary basin in Hungary; Phys. Earth Planet. Inter.150 197–212.
Thakur V C, Joshi M, Sahoo D, Suresh N, Jayankondaperu-mal R and Singh A 2014 Partitioning of convergence inNorthwest sub-Himalaya: Estimation of late Quaternaryuplift and convergence rates across the Kangra reentrant,North India; Int. J. Earth Sci. (Geol Rundsch). 103(4)1037–1056, https://doi.org/10.1007/s00531-014-1016-7.
Thakur V C, Jayangondaperumal R and Joevivek V 2018Seismotectonics of central and NW Himalaya: Plateboundary–wedge thrust earthquakes in thin- and thick-skinned tectonic framework; Geol. Soc. London, Spec. Publ.SP481.8, https://doi.org/10.1144/sp481.8.
Valdiya K S 2016 The making of India – geodynamic evolu-tion; 2nd edn, Springer International Publishing Switzer-land, 838p.
Veeraswamy K, Abdul Azeez K K and Basava S 2010Electrical structure across lesser and higher NW Himalaya,India; Chinese J. Geophys. 53(3) 576–584, https://doi.org/10.3969/j.issn.0001-5733.
Wadia D N 1975 Geology of India; 4th edn, Tata McGraw-HillPublishing Co., New Delhi (Tenth reprint, 1989).
Weaver J T, Agarwal A K and Lilley F E M 2000 Charac-terisation of the magnetotelluric tensor in terms of itsinvariants; Geophys. J. Int. 141 321–336.
Yin A 2006 Cenozoic tectonic evolution of the Himalayanorogen as constrained by along-strike variation of structuralgeometry, exhumation history, and foreland sedimentation;Earth-Sci. Rev. 76 1–131, https://doi.org/10.1016/j.earscirev.2005.05.004.
Corresponding editor: ARKOPROVO BISWAS
156 Page 12 of 12 J. Earth Syst. Sci. (2020) 129:156