seed dressing systemic insecticides and honeybees: a ...icm.eionet.europa.eu/etc_reports/assessing...
TRANSCRIPT


Cover photos: Upper left: Infralittoral rocks with photophilic algae and seahorse (Hippocampus guttulatus ) attached to the sponge (Halichondria panacea), Black Sea, © photo: Adrian Teaca,GeoEcoMar Upper right: Solan Bank Reef, NE Atlantic, © photo: JNCC Bottom left: European bullhead (Cottus gobio) hiding in seaweed in the Quarck World Heritage Site, Finland, Baltic Sea. © photo: Metsahallitus, 2007 Bottom right: Seagrass meadow (Posidonia oceanica), Mediterranean Sea, © photo: Leonardo Tunesi, ISPRA Layout: Miluše Rollerová Editor: Anita Künitzer – Helmholtz Centre for Environmental Research GmbH – UFZ, Germany Legal notice This European Topic Centre on Inland, Coastal and Marine Waters (ETC/ICM) Technical Report has not been subject to a European Environment Agency (EEA) member country review as it does not include national data nor provides any national statistic. However, it will act as a supporting document for future EEA assessments of marine protected areas which will be consulted through the EIONET network. The contents of this publication do not necessarily reflect the official opinions of the EEA, European Commission or other institutions of the European Communities. Neither the ETC/ICM nor any person or company acting on behalf of the ETC/ICM is responsible for the use that may be made of the information contained in this report. Copyright notice © ETC/ICM, UFZ, 2017 Reproduction is authorised, provided the source is acknowledged, save where otherwise stated. Information about the European Topic Centre on Inland, Coastal and Marine Waters is available on the internet at: water.eionet.europa.eu. ISBN: 978-3-944280-58-5 Author affiliation: Sabrina Agnesi, Aldo Annunziatellis, Giulia Mo, Leonardo Tunesi – ISPRA, Italy Peter Chaniotis – JNCC, United Kingdom Samuli Korpinen – SYKE, Finland Lidija Globevnik, Luka Snoj – TC Vode, Slovenia EEA Project manager: Johnny Reker, European Environment Agency, Denmark Reference to the report: Agnesi, S., Mo, G., Annunziatellis, A., Chaniotis, P., Korpinen, S., Snoj, L., Globevnik, L., Tunesi, L., Reker, J., 2017, Assessing Europe’s Marine Protected Area networks – Proposed methodologies and scenarios, ed. Künitzer, A.. ETC/ICM Technical Report 2/2017, Magdeburg: European Topic Centre on inland, coastal and marine waters, 72 pp. European Topic Centre on Inland, Coastal and Marine Waters – ETC/ICM Helmholtz Centre for Environmental Research GmbH – UFZ Brückstr.3a 39114 Magdeburg Germany Web: water.eionet.europa.eu

4 Assessing Europe’s Marine Protected Area networks
Contents
List of Acronyms .......................................................................................................................... 5
Executive summary ...................................................................................................................... 6
1 Introduction ....................................................................................................................... 8 1.1 Background and purpose of this report .......................................................................... 8 1.2 EU policy context ............................................................................................................. 9
2 A review of efforts to assess MPA ecological coherence of relevance at an EU-scale ........... 11 2.1 OSPAR ............................................................................................................................ 12 2.2 HELCOM ......................................................................................................................... 13 2.3 Barcelona Convention ................................................................................................... 14 2.4 Efforts to develop a pan-European assessment approach report ................................ 17 2.5 Key findings of relevance to an EU-level assessment ................................................... 17
3 Overview of available datasets to support an assessment of European MPA networks ....... 19 3.1 Assessment areas .......................................................................................................... 19 3.2 MPA datasets................................................................................................................. 19 3.3 European-wide datasets of marine features ................................................................. 21
4 Proposing a methodological framework for an assessment of EU MPA networks ............... 26 4.1 Tier 1 – Target-based pan European and EU regional assessments: ............................ 26 4.2 Tier 2 – Multi target scenario-based Pan European and EU Regional assessments ..... 27 4.3 Tier 3 – Case studies indicating further improvement to MPA network assessments . 28
5 Assessment routines and results ....................................................................................... 32 5.1 Tier 1 – Target-based pan European and EU regional assessments ............................. 32 5.2 Tier 2 – Multi target scenario-based Pan European and EU regional assessments ...... 37 5.3 Tier 3 – Case studies indicating further improvement to MPA network assessments . 49
6 Options for presenting the outputs of an assessment of EU MPA networks ........................ 59 6.1 Introduction to integrated assessments ....................................................................... 59 6.2 Quantitative scorecard approach .................................................................................. 59 6.3 Semi-quantitative scorecard approach ......................................................................... 62
7 Recommendations ............................................................................................................ 64
References ................................................................................................................................. 66
Annex 1 ..................................................................................................................................... 69

Assessing Europe’s Marine Protected Area networks 5
List of Acronyms CBD International Convention on Biodiversity CDDA Common Database on Designated Areas DG-ENV Directorate-General for the Environment DG-Mare Directorate-General for Maritime Affairs and Fisheries EEA European Environment Agency ETC / BD European Topic Center on Biological Diversity ETC / ICM European Topic Center on Inland and Coastal Marine Waters EUNIS European Nature Information System HD Habitats Directive HELCOM Baltic Marine Environment Protection Commission - Helsinki Commission IUCN International Union for Conservation of Nature MEG Marine Expert Group MedPAN Network of marine protected area managers in the Mediterranean Sea MPA Marine Protected Area MSFD Marine Strategy Framework Directive MSP Marine Spatial Planning Directive OSPAR Convention for the protection of the marine environment of the north-east Atlantic OOAO One out all out principle QA/QC Quality assured / Quality checked N2K Natura 2000 RAC/SPA Regional Activity Centre for Specially Protected Areas RSC Regional Sea Convention SAC Special Areas of Conservation SCI Site of Community Importance SPA Special Protection Area SPAMI Specially Protected Area of Mediterranean Importance UNEP-MAP United Nations Environment Programme - Mediterranean Action Plan WWF World Wide Fund for Nature
6 Assessing Europe’s Marine Protected Area networks
Executive summary ‘Ecological coherence’ is a term increasingly used to describe the ultimate goal in the design, establishment and assessment of marine protected area (MPA) networks. There are several EU-level policy drivers that call for the establishment of an ecologically coherent network of MPAs across Europe’s seas – most notably Article 13.4 of the Marine Strategy Framework Directive (MSFD) and the EU Biodiversity Strategy to 2020. By drawing on existing approaches put forward by the Regional Sea Conventions (RSCs) of relevance to European seas, this report presents a proposed methodological framework for the assessment of MPA networks in a European context to help inform the role that MPAs (and MPA networks) play in the delivery of EU-level reporting requirements. Section 2 of this report reviews the principles, criteria and indicators applied by RSCs to undertake ecological coherence assessments. In undertaking this exercise, we have identified that there are five key principles that are common place in RSC eco-coherence assessment methodologies:
• REPRESENTATIVITY – ensuring the range of marine habitats and species for which MPAs are considered appropriate are protected within MPAs and ensuring MPAs occupy at least 10% of sea area within different regions (with the rationale being the political target set out under Aichi Target 11 of the CBD).
• REPLICATION – ensuring a sufficient number of occurrences of a given feature are protected within MPAs and ensuring replication reflects what is known about a given features’ biogeographic range.
• CONNECTIVITY – ensuring individual MPAs are well-connected in terms of facilitating the exchange of species and ensuring adequate propagule/egg dispersal. In practice, however proximity analysis between MPAs in terms of minimum distance thresholds are applied due to a lack of understanding of how to assess connectivity in a scientifically meaningful way.
• ADEQUACY – RSCs vary in considering the principle of adequacy, but this tends to refer to ensuring individual MPAs are a specific minimum size and considering exposure to pressures associated with human activities that could affect the conservation status of protected features of individual MPAs. Minimum proportions of specific habitats and species to be included in an MPA network are also discussed under the principle of adequacy.
• MANAGEMENT – the importance of effective management of MPAs in achieving an ecologically coherent network. Across the RSCs, this is considered a conceptually separate aspect to ecological coherence.
Drawing on the findings of Section 2, Section 3 provides a review of the datasets available to support an MPA ecological coherence assessment at the EU-level and Section 4 presents a ‘three-tiered’ proposed approach to an assessment framework for European seas:
• TIER 1 – Target-based pan European and EU regional assessments of MPA representativity (percentage coverage of MPAs across different depth classes and distances from the coast and of benthic broad-scale habitats)
• TIER 2 – Multi-target scenario-based Pan European and EU regional assessments of replication of specific habitats and species of interest and proximity analysis between MPAs across a range of distance thresholds derived from the RSCs. An analysis of MPA size class is also presented.
• TIER 3 – Case studies indicating further improvement to MPA network assessments. This final tier presents examples of work that could be used to further develop and improve on MPA network assessments across European seas into the future.
Section 5 presents an overview of outputs from the assessment routines outlined in Table 4.1 based on the proposed three-tiered approach and Section 6 explores options around the presentation of outputs from such an assessment; including the exploration of quantitative and semi-quantitative approaches. The caveats behind the available data and approaches have revealed several recommendations that are important to consider in moving forward with an EU-level MPA network assessment. These are described in detail within Section 7 of this report but summarised here:

Assessing Europe’s Marine Protected Area networks 7
• Clarifying the requirements of EU level policy drivers in considering MPA network assessments – Most notably the specific requirements of Article 13.4 of the MSFD with respect to MPA network reporting.
• Including biology in the consideration of seabottom habitat and species protection within EU MPA networks - Expansion of pan-European spatial mapping efforts that would allow more ecologically meaningful assessments to be undertaken in the future. This should focus on addressing gaps in spatial coverage of modelled broad-scale seabed habitats, undertaking EUNIS Level 4 habitat mapping, and collating distribution maps of species for which MPAs are considered an appropriate conservation measure.
• Moving towards assessing protection, not just spatial overlap - Improved reporting on MPAs across underlying databases to infer the target of protection for specific habitats and species would aid the accuracy of MPA network assessments.
• Further definition of the scope for replication of revised broad habitats – Based on improved understanding of the biology of specific habitats and species rather than just generically-set targets.
• Moving towards network connectivity, rather than proximity - In an ideal world, specific information about species larval phases and dispersal patterns, in combination with data-rich oceanographic models, would be combined to develop a clearer picture of the potential interchange of biological diversity between MPAs.
• Further exploration of appropriate criteria under the network principles of ‘adequacy’ and ‘management’ - A consistent approach to generating and reporting information pertaining to MPA management and adequacy should be considered for roll out across all EU MPAs by drawing on progress and ideas put forward by the RSCs.
• Streamlining the availability of spatial and tabular data on EU MPAs – The N2K, CDDA and Regional Sea Convention databases are all proposed for use as source data for information on EU MPAs within this report. Ideally, there would be a data flow process developed centrally within the EU that draws in an automated way necessary attribute data into a centralised EU MPA database from which such MPA assessments can draw from into the future.
• Generating a centralised database of ‘other area-based measures’ as well as EU MPAs - Both the CBD and MSFD infer that not just MPAs in their strictest definition can be considered to contribute to EU MPA networks. Effort should be invested in developing a common definition of ‘other area-based measures’ in an EU context and a centralised database produced of such areas, the features they are considered to protect, and the likelihood of persistence of management that affords protection to said features.

8 Assessing Europe’s Marine Protected Area networks
1 Introduction 1.1 Background and purpose of this report The European Topic Centre for Inland, Coastal and Marine Waters (ETC/ICM) has over the past two years developed a methodology to define a harmonised dataset of Marine Protected Areas (MPAs) in Europe’s seas based on the analysis of spatial and tabular data reported by Member States within the framework of EU-reporting fora and at the regional sea convention level. This work has led to the definition of a baseline statistical analysis of MPA network distribution across Europe’s seas. This spatial analysis refers to the MPA network established by EU countries by the end of 2012. The results of the analysis have led to the publication of a European Environment Agency (EEA) policy briefing on the status and future perspectives of MPA networks across Europe (EEA, 2015a) while the extensive explanation regarding the methodology and findings are compounded into an EEA Technical report (EEA, 2015b). Both reports were developed to support the European Commission’s progress report (COM, 2015) on MPAs to the European Parliament and to the Council under Article 21 of the Marine Strategy Framework Directive (MSFD). Part of the baseline analysis on the MPA statistics was also used for the definition of an EEA MPA indicator measuring the progress made towards the CBD Aichi target 11. It is the intention of this work to set the context behind further defining a proposed assessment framework for assessing the ‘ecological coherence’ of EU MPA networks. ‘Ecological coherence’ is the term increasingly used under various marine policy instruments to summarise in a conceptual manner the ultimate goal in the design, establishment and assessment of marine protected area (MPA) networks. It is considered to be an overarching concept, encompassing within it a number of different principles and associated criteria (Deltares, 2014) that need to be met in order to conclude as to whether or not an MPA network can be considered to be ecologically coherent. Descriptions of what an ecologically coherent network of MPAs is have been formulated by Regional Sea Conventions (RSC) operating in European seas. By drawing on existing Regional Sea Convention (RSC) efforts to assess the ‘ecological coherence’ of networks to date, this report presents a proposed methodological framework for the assessment of MPA networks in a European context to help inform the role MPAs (and MPA networks) play in the delivery of reporting requirements under several EU-level policy drivers – most notably the Marine Strategy Framework Directive (MSFD) (Article 13.4) and the EU Biodiversity Strategy to 2020. In meeting this aim, the report:
• Reviews the principles, criteria and indicators applied by Regional Sea Conventions (RSCs) to undertake ecological coherence assessments (Section 2);
• Discusses the extent to which these principles, criteria and indicators can be applied in a European context based on the availability of European-wide datasets (Section 3);
• Proposes a methodological framework and associated procedures that could be operationalised to undertake an assessment of the EU MPA networks (Sections 4 and 5), as well as a review of ways in which the outputs of such an assessment can be presented (Section 6); and
• Concludes with a series of recommendations to help guide further work in this area at an EU-level (Section 7).
The report has not been in EIONET consultation as it does not include national data nor provides any national statistic. However, it will act as a supporting document for future EEA assessments of marine protected areas which will be consulted through the EIONET network.

Assessing Europe’s Marine Protected Area networks 9
1.2 EU policy context EC Birds and Habitats Directives The principle of a coherent ecological network of protected areas was first introduced into EU legislation by the Habitats Directive & Wild Birds Directives, which identifies the role of Special Areas of Conservation (SACs) and Special Protection Areas (SPAs) as a means through which habitats and species of community interest can be maintained or restored at a favourable conservation status. Collectively, SACs and SPAs comprise the Natura 2000 (N2K) network – a network of sites established for the conservation of specific habitats and species listed within the Annexes of the Directives. The Natura 2000 network is established on the basis of specific criteria and is subject to specific evaluations regarding the sufficiency of the network. This report does not undermine the sufficiency assessment of the Natura 2000 network in any way – but it is notable that the use of particular criteria such as representativity and adequacy (i.e. the use of SACs and SPAs for the protection of proportions of specific features listed within the Directives) are used to evaluate sufficiency of the network. The Marine Strategy Framework Directive The principle EU-level policy driver underpinning an assessment of MPA networks is the Marine Strategy Framework Directive (MSFD). Art.13.4 of the MSFD requires Member States to reach or maintain good environmental status through specific programmes of measures, amongst which is the establishment of spatial protection measures. Art 13.4 states that: “Programmes of measures established pursuant to this Article shall include spatial protection measures, contributing to coherent and representative networks of marine protected areas, adequately covering the diversity of the constituent ecosystems, such as special areas of conservation pursuant to the Habitats Directive, special protection measures pursuant to the Birds Directive, and marine protected areas as agreed by the Community or Member States concerned in the framework of international or regional agreements to which they are parties”. There are several observations with regards to the wording of Art 13.4 that should be considered in developing a proposed methodological framework for an assessment of MPA networks at the EU-level. Firstly, it appears that reference to ‘spatial protection measures’ is a reflection of the wording in Aichi Target 11 under the International Convention on Biological Diversity (CBD) whereby contributions may also include area-based conservation measures that do not necessarily constitute MPAs (1). Secondly, it is unclear whether Article 13.4 of the MSFD requires a) an assessment of the contribution that spatial protection measures (SPAs, SACs, Regional Sea Convention designations, national MPA designations and other types of spatial protection measures) make to ‘adequately covering the diversity of constituent ecosystems’ or b) whether it requires an assessment of the degree to which EU MPA networks are ‘coherent and representative’. For the purposes of this report, the latter has been assumed – but this requires clarification from the European Commission. This interpretation is reinforced by the emphasis placed in the preamble of the Directive itself concerning the need to establish and maintain ecologically representative networks of MPAs as a guarantee of ensuring the conservation of marine biodiversity. This interpretation is also reinforced by (1) “By 2020 at least 10 per cent of coastal and marine areas are conserved through effectively and equitably managed, ecologically representative and well connected systems of protected areas and other effective area-based conservation measures”. It is notable that notion 053 of the IUCN is calling for an amendment to this target to reflect an increase in fully protected MPAs to cover at least 30% of the oceans by 2030. For more information, see: https://portals.iucn.org/congress/motion/053

10 Assessing Europe’s Marine Protected Area networks
the MSFD Article 21 Commission Report that calls to ‘further develop an EU methodology for the assessment of MPA network coherence and representativity’(2). EU Biodiversity Strategy to 2020 The EU Biodiversity Strategy to 2020 reflects the commitments made by the EU in 2010 with respect to the CBD and its Strategic Plan for the period 2011-2020, which in defining its Aichi target 11, cited above, calls on the protection of at least 10% of coastal and marine areas. The EU Biodiversity Strategy takes stock of the CBD commitments and defines its marine species and habitat protection objectives (Target 1) as follows (3):
• Complete the Natura 2000 network and ensure its good management
• Make sure Natura 2000 sites obtain sufficient funding
• Raise awareness of Natura 2000, get citizens involved and improve the enforcement of the nature directives
• Make the monitoring and reporting of the EU nature law more consistent, relevant and up-to-date; provide a suitable ICT tool for Biodiversity
Maps presented in the report The maps presented in the report should be used on the following basis:
a. They are intended for the sole purposes of supporting the assessment of marine protected areas by Member States, stakeholders and the European Commission and its agencies.
b. Please note that neither the European Commission, the European Environment Agency nor its European Topic Centre for Inland, Coastal and Marine waters has competence in the geographical demarcation of EU Member States' borders. This is also the case for establishing the limits of the continental shelf of EU Member States, where international law applies. According to UNCLOS art. 76 (8), only the coastal State is competent to establish the outer limits of its continental shelf. It is to act on the basis of the recommendations of the Commission on the Limits of the Continental Shelf.
c. The maps and tables provided in this report and resulting from the evaluation of the available datasets are not intended to influence or question any ongoing negotiations occurring in UNCLOS or jurisdictional issues regarding maritime boundaries pertaining to EU Member States or to non-EU countries.
d. Please note that non-EU countries have not been consulted in the preparation of these maps. Some claims by EU-Member States to marine waters, particularly to Continental Shelf areas, may be contested by non-EU-countries. The claims for extended continental shelf from Spain are not represented in these maps.
e. Neither the European Commission, the European Environment Agency nor its European Topic Centre for Inland, Coastal and Marine waters is responsible for the use that may be made of the information provided in the tables and maps in this report. As such, there is a disclaimer associated with all maps: This map serves as a working tool only and shall not be considered as an official or legally-binding map representing marine borders in accordance with international law. This map shall be used without prejudice to the agreements that will be concluded between Member States or between Member States and non-EU states in respect of their marine borders.
f. EEA will continue to update the maps as and when new information is made available by EU Member States (e.g. as part of their on-going dialogue with neighbouring states, or when new agreements are reached under UNCLOS) and/or requested by DG ENV to further provide technical support to the MSFD CIS process.
For more information on the European marine regions, please refer to the EEA web-page https://www.eea.europa.eu/data-and-maps/data/msfd-regions-and-subregions#tab-documents. (2) See http://ec.europa.eu/environment/marine/eu-coast-and-marine-policy/implementation/pdf/marine_protected_areas.pdf (3) http://ec.europa.eu/environment/nature/biodiversity/strategy/index_en.htm

Assessing Europe’s Marine Protected Area networks 11
2 A review of efforts to assess MPA ecological coherence of relevance at an EU-scale
The aim of this report is to attempt to define an assessment framework for MPA networks at the level of the European seas. Therefore, we approached this by using the spatially widest ‘building blocks’ underpinning this, i.e. the approaches taken by the Regional Sea Conventions – which in geographical terms cover the majority of the MSFD EU Regions. We are, however, aware of the development of national guidelines for the assessment of MPA network coherence (e.g. Natural England and JNCC, 2010) as well as national (Carr et al., 2014) and sub-regional (Rees et al., 2015) efforts to assess MPA networks. In addition, the majority of Member States have also informed the development of Regional Sea Convention approaches in their contribution to these Conventions as Contracting Parties. As such, they are most likely to reflect an approach that is agreeable at a European level. Furthermore, in 2014 a study commissioned by DG ENV to a consortium of European partners, defined a methodology for evaluating the coherence of the European MPA networks (Deltares, 2014). The study described the guiding principles behind the establishment and assessment of MPAs as contained in international instruments such as the Convention on Biological Diversity, Regional Sea Conventions and the EU nature directives. The present report also draws on the conclusions of this latter report with particular emphasis on defining the concept of the ecological coherence and the proposals it makes in terms of scoring the potential assessment results. In order to review existing Regional Sea Convention efforts to assess ecological coherence of relevance to the development of an EU-level assessment framework, a workshop was held from 25th–26th June, 2015 in ISPRA, Rome. Participants to the workshop were ETC/ICM partners ISPRA, JNCC, SYKE, TC-Vode and EEA who have been involved in MPA analyses within the ETC/ICM and also in Regional Sea Conventions’ MPA network assessments. Discussions during the workshop led to the production of a comparison table listing the principles and associated criteria used by Regional Sea Conventions in their present or imminent assessments of MPA ecological coherence (see table 2.1). This was further refined as part of an MPA Regional Workshop on 20th April 2016 in Copenhagen, Denmark with wider representation of experts from Regional Sea Conventions and Member States. At the time of writing, during fall 2016, a full overview of the approach being undertaken for the 2016 MPA network assessment for the Mediterranean was not available. This section of the report provides an overview of Regional Sea Convention approaches under OSPAR (covering the North-east Atlantic Ocean), HELCOM (covering the Baltic Sea) and the Barcelona Convention (covering the Mediterranean Sea). To the best of the authors’ knowledge, there has been no active progress in MPA network assessments under the Bucharest Convention covering the Black Sea. Over the past decade, the Regional Sea Conventions have placed significant effort in attempting to transfer the concept of ecological coherence into operational principles and associated criteria that might be used to make inferences as to whether or not their MPA networks can be considered ecologically coherent. This began in 2003, with the OSPAR and HELCOM Regional Sea Conventions jointly defining, within their programmes of work, the objective of establishing ecologically coherent and well-managed MPA networks.

12 Assessing Europe’s Marine Protected Area networks
2.1 OSPAR OSPAR (2006) recommends that an assessment of MPA ecological coherence should be centred around five key principles: ‘features’, ‘representativity’, ‘connectivity’, ‘resilience’ and ‘management’ (see box 1). Several attempts to run MPA ecological coherence assessments have occurred since 2008 within OSPAR, the most recent being documented in 2013 (OSPAR, 2013). On the basis of past assessments, the OSPAR Commission is planning to run an MPA coherence assessment in 2017 based on data reported by Contracting Parties up to and including the end of 2016. The criteria and thresholds that will be used for the 2017 assessment are provided in table 2.1.
Box 1 – OSPAR principles for assessing the ecological coherence of MPA networks (derived from OSPAR, 2006)
Features – MPAs should be designated in areas that best represent the range of habitats, species and ecological processes in the OSPAR Maritime Area. Proportions of features that should be protected by the MPA network may be higher for particularly threatened and/or declining features. Representativity – MPAs should protect examples of the same features across their known biogeographical extent to reflect known sub-types. EUNIS Level 3 habitats are stated as a potentially useful way of characterising the OSPAR Maritime Area for the purposes of including biogeographic variation in the network. Connectivity – In the absence of dispersal data, connectivity may be approximated by ensuring the MPA network is well distributed in space. Where scientific understanding is further developed, the MPA network should reflect locations where a specific path between identified places is known (e.g. critical areas of a life cycle for a given species). Resilience – Replication of features in separate MPAs in each biogeographic area is desirable where possible. The appropriate size of a site should be determined by the purpose of the site and be sufficiently large enough to maintain the integrity of the feature(s) for which it is selected. Management – OSPAR MPAs should be managed to ensure the protection of the features for which they were selected and to support the functioning of an ecologically coherent network.
Assessing Europe’s Marine Protected Area networks 13
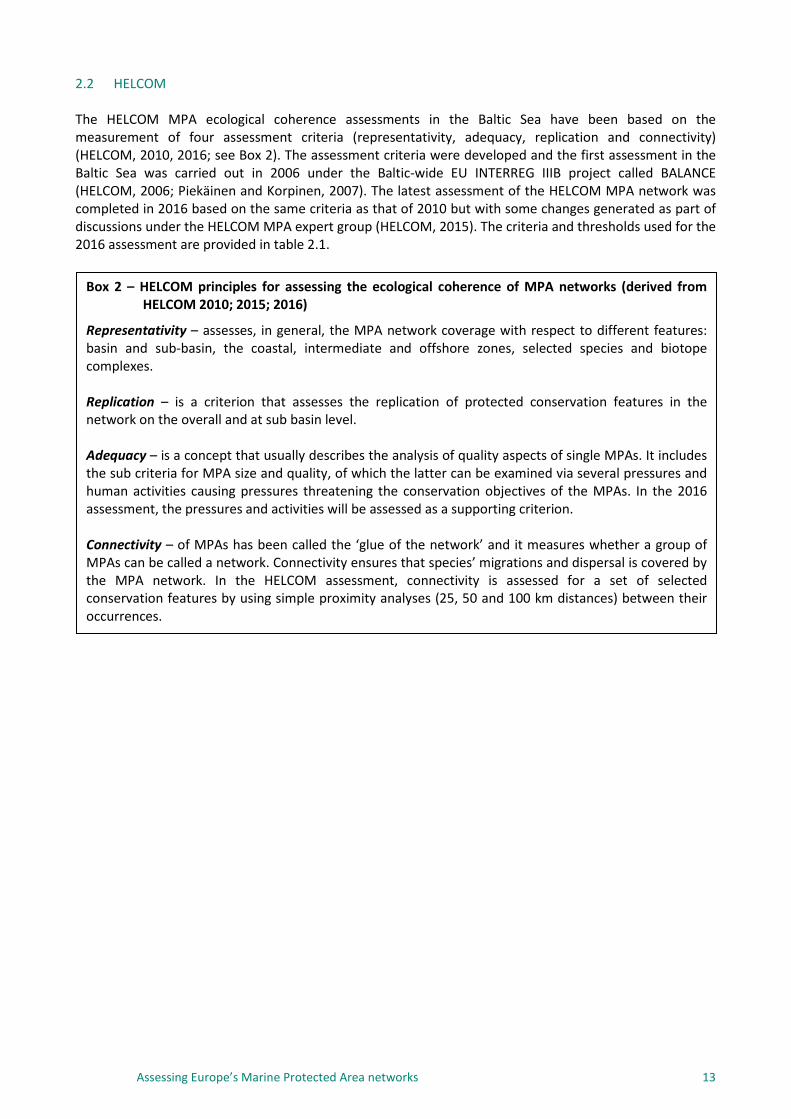
2.2 HELCOM The HELCOM MPA ecological coherence assessments in the Baltic Sea have been based on the measurement of four assessment criteria (representativity, adequacy, replication and connectivity) (HELCOM, 2010, 2016; see Box 2). The assessment criteria were developed and the first assessment in the Baltic Sea was carried out in 2006 under the Baltic-wide EU INTERREG IIIB project called BALANCE (HELCOM, 2006; Piekäinen and Korpinen, 2007). The latest assessment of the HELCOM MPA network was completed in 2016 based on the same criteria as that of 2010 but with some changes generated as part of discussions under the HELCOM MPA expert group (HELCOM, 2015). The criteria and thresholds used for the 2016 assessment are provided in table 2.1.
Box 2 – HELCOM principles for assessing the ecological coherence of MPA networks (derived from HELCOM 2010; 2015; 2016)
Representativity – assesses, in general, the MPA network coverage with respect to different features: basin and sub-basin, the coastal, intermediate and offshore zones, selected species and biotope complexes. Replication – is a criterion that assesses the replication of protected conservation features in the network on the overall and at sub basin level. Adequacy – is a concept that usually describes the analysis of quality aspects of single MPAs. It includes the sub criteria for MPA size and quality, of which the latter can be examined via several pressures and human activities causing pressures threatening the conservation objectives of the MPAs. In the 2016 assessment, the pressures and activities will be assessed as a supporting criterion. Connectivity – of MPAs has been called the ‘glue of the network’ and it measures whether a group of MPAs can be called a network. Connectivity ensures that species’ migrations and dispersal is covered by the MPA network. In the HELCOM assessment, connectivity is assessed for a set of selected conservation features by using simple proximity analyses (25, 50 and 100 km distances) between their occurrences.
14 Assessing Europe’s Marine Protected Area networks
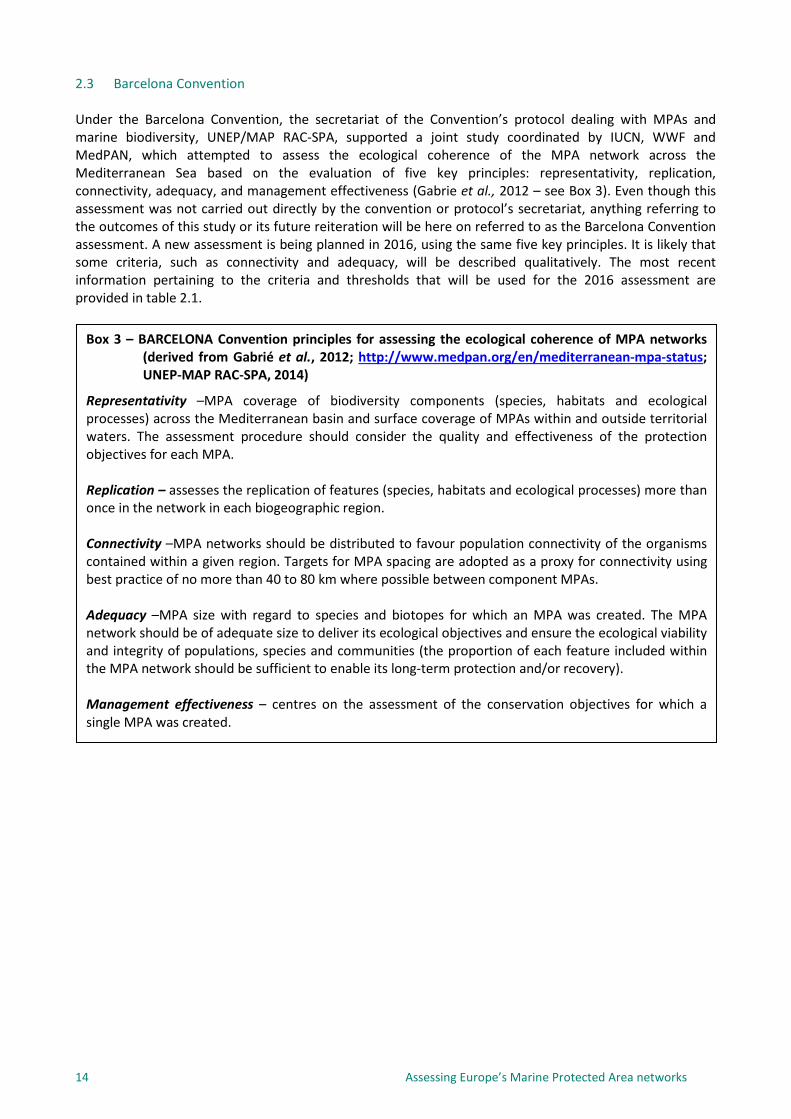
2.3 Barcelona Convention Under the Barcelona Convention, the secretariat of the Convention’s protocol dealing with MPAs and marine biodiversity, UNEP/MAP RAC-SPA, supported a joint study coordinated by IUCN, WWF and MedPAN, which attempted to assess the ecological coherence of the MPA network across the Mediterranean Sea based on the evaluation of five key principles: representativity, replication, connectivity, adequacy, and management effectiveness (Gabrie et al., 2012 – see Box 3). Even though this assessment was not carried out directly by the convention or protocol’s secretariat, anything referring to the outcomes of this study or its future reiteration will be here on referred to as the Barcelona Convention assessment. A new assessment is being planned in 2016, using the same five key principles. It is likely that some criteria, such as connectivity and adequacy, will be described qualitatively. The most recent information pertaining to the criteria and thresholds that will be used for the 2016 assessment are provided in table 2.1.
Box 3 – BARCELONA Convention principles for assessing the ecological coherence of MPA networks (derived from Gabrié et al., 2012; http://www.medpan.org/en/mediterranean-mpa-status; UNEP-MAP RAC-SPA, 2014)
Representativity –MPA coverage of biodiversity components (species, habitats and ecological processes) across the Mediterranean basin and surface coverage of MPAs within and outside territorial waters. The assessment procedure should consider the quality and effectiveness of the protection objectives for each MPA. Replication – assesses the replication of features (species, habitats and ecological processes) more than once in the network in each biogeographic region. Connectivity –MPA networks should be distributed to favour population connectivity of the organisms contained within a given region. Targets for MPA spacing are adopted as a proxy for connectivity using best practice of no more than 40 to 80 km where possible between component MPAs. Adequacy –MPA size with regard to species and biotopes for which an MPA was created. The MPA network should be of adequate size to deliver its ecological objectives and ensure the ecological viability and integrity of populations, species and communities (the proportion of each feature included within the MPA network should be sufficient to enable its long-term protection and/or recovery). Management effectiveness – centres on the assessment of the conservation objectives for which a single MPA was created.

Assessing Europe’s Marine Protected Area networks 15
Table 2.1 Comparison of Regional Sea Convention MPA network ecological coherence principles and associated criteria
Network principle
Equivalent OSPAR
principle(s) OSPAR criteriaa
Equivalent HELCOM principle
HELCOM criteriab
Equivalent Barcelona
Convention principle
Barcelona Convention criteriac
Repr
esen
tativ
ity
Representativity
MPAs, in combination with other relevant spatial measures as deemed appropriate, cover at least 10% in area of all Dinter biogeographic provinces
Representativity
MPA coverage is at least 10% of the basin and the sub-basins and of the coastal sea, outer coastal sea and the open sea zones. MPA coverage is at least ≥20% of the common benthic landscapes, and 60% of rare landscapes.
Representativity
MPA coverage is at least 10% of: basin, the 12 nautical mile zone, the open sea (beyond 12 nautical miles)d MPA coverage is measured with respect to: 8 ecoregions, EMODnet Broad Scale Habitats, marine mammals, marine turtles and Important Bird Arease
Repl
icat
ion
Features & Resilience
MPAs represent all EUNIS Level 3 habitat classes and OSPAR T&D species and habitats for which MPAs are considered appropriate more than once in all relevant biogeographic provinces where a given feature is presentf
Replication
At least 4 MPAs include each of the selected species and habitats in the network At least 4 patches of each benthic landscape type (x30) (min. 0.24km2) are protected in the network
Replication More than one MPA shall contain examples of a given feature (species, habitats and ecological processes) in the given ecoregion
a Based on Madrid Criteria as agreed at BDC 2015 b Based on 2016 assessment (HELCOM, 2015) https://portal.helcom.fi/default.aspx c Based on 2016 assessment d UNEP/MAP-RAC/SPA 2009 (http://www.rac-spa.org/sites/default/files/doc_pwmcpa/pwmcpa_en.pdf) e UNEP-MAP-RAC/SPA. 2010. (http://medabnj.rac-spa.org/images/stories/Publications/overview_report.pdf) f Note that OSPAR ‘Madrid Criteria’ originally stipulated an assessment of EUNIS Level 3 habitat protection within the 2017 OSPAR MPA network assessment. However, following a meeting of the Contracting Parties in 2015 we agreed this would not be possible for the 2017 assessment but would still form part of the aspiration for future assessments within OSPAR

16 Assessing Europe’s Marine Protected Area networks
Network principle
Equivalent OSPAR
principle(s) OSPAR criteriaa
Equivalent HELCOM principle
HELCOM criteriab
Equivalent Barcelona
Convention principle
Barcelona Convention criteriac Co
nnec
tivity
Connectivity
MPAs are geographically well-distributed, with a maximum distance of up to 250km for nearshore/coastline, 500km for offshore and 1000km for the high seas areas between MPAs
Connectivity
Number of connections between the same type of benthic landscape patches (minimum size 0.24 km2) when a connection is less than i) 25 km or ii) 50 km. Target: 50% of landscape patches have ≥20 connections Number of connections between species habitats (minimum size 0.24 km2) when a connection distance is set for each species’ dispersal range. Target: 50% of species habitats have ≥20 connections
Connectivity
No assessment will be made but a proximity study will be conducted, considering only legally-binding nationally designated MPAs with a management structure in place. A literature review will be conducted to produce a synthesis of main scientific findings regarding connectivity in the Mediterranean Sea
Adeq
uacy
Resilience
Site size is considered a site-based rather than a network-based principle within OSPAR and so not considered in the context of a network assessment
Adequacy ≥80% of MPAs have the minimum size of 30 km2 (marine area) or 10 km2 (terrestrial area)
Adequacy To be defined.
Man
agem
ent
Management
In development as a separate area to MPA eco-coherence. A pilot exercise is being undertaken based on a self-assessment questionnaire for Contracting Parties to complete. This covers questions such as ‘is management documented?’, ‘are management measures in place?’, ‘is a monitoring plan active’?, and ‘is there evidence of protected features moving towards their conservation objectives?’
Management To be defined. Management effectiveness
A questionnaire has been sent to MPA directors focusing on the collection of management data. The analysis will depend on the results obtained with this questionnaire. The questionnaire is based on the IUCN/WWF methodology for the evaluation of management effectivenessg
g https://portals.iucn.org/library/efiles/documents/2013-018.pdf

Assessing Europe’s Marine Protected Area networks 17
2.4 Efforts to develop a pan-European assessment approach report Though methods to assess MPA networks have been developed all over the Europe, the only attempt to propose a pan-European assessment framework was recently published by Deltares (2014). In this report the authors proposed a method to assess ecological coherence of the European MPA network. To that end, they reviewed the criteria used in Regional Sea Conventions, in international assessments outside the EU and in some national assessments. They proposed that ecological coherence be measured on the basis of four criteria and a number of sub-criteria (see table 2.2). In order to be comparable across Europe’s seas, the project aimed at a similar set of assessment criteria and a structured assessment methodology. This was achieved by proposing a quantitative and hierarchical approach where the four primary criteria were divided into further sub-criteria and these were subsequently implemented through ‘indicators’, i.e. sub-criteria which were made operational with the assessment methods, numeric target values and data. The assessment result was obtained after integration of the indicators and the ecological coherence was assessed as a percentage deviation from the quantitative targets. The integration of the criteria and sub-criteria was considered important in order to obtain an easily communicable assessment result. Table 2.2 Overview of the main criteria, subcriteria and indicators proposed in the Deltares 2014 report
for a European wide assessment method (modified from Deltares, 2014)
Main criteria Sub criteria Indicator Representativity Coverage of MPAs in the
marine region Proportion total area MPAs / total area
Coverage of MPAs in eco-regions/sub-regions
MPA area divided by the ecoregion area (for each ecoregion separately)
Representativity of depth zones
MPA area divided by the area of the depth zones (for n zones separately)
Representativity of conservation features
Proportion of MPA area including a feature (for n features separately)
Adequacy MPA size Proportion of MPAs ≥20 km2 (the size may be agreed to be something else)
Level of protection Proportion of sites falling under management category 2 (e.g. no take area) as proposed in Section 2.4
Connectivity Connectivity of MPAs Number of MPAs connected by 50 km distance (the distance can be agreed to be something else)
Replication Replication of sites per feature
Number of MPAs including a selected feature (for n features separately)
2.5 Key findings of relevance to an EU-level assessment A summary of the network principles and associated criteria and thresholds underpinning MPA ecological coherence assessments within each active Regional Sea Convention are set out in table 2.1. It is not surprising that the principles and criteria proposed at a pan-European level by Deltares (2014) are mostly coherent with those considered by RSCs. There are key synergies but also differences that are important to highlight in the context of drawing together a proposed assessment framework which is applicable at an EU-level:
• All three Regional Sea Conventions assess the percentage surface coverage of MPAs within a given region, sub-region or at various distances from the coast (often citing the need for ≥10% surface coverage with the rationale being the political target set out under Aichi Target 11 of the CBD). In addition, all three Regional Sea Conventions cite the need to protect the range of features (habitats, species and ecological processes) within their respective regions. Collectively, these criteria have been badged under the network principle of REPRESENTATIVITY.
• All three Regional Sea Conventions refer to the need to ensure that a sufficient number of examples of a given feature are protected within an MPA network and that this should reflect what

18 Assessing Europe’s Marine Protected Area networks
is known about the features’ biogeographic range in a given region or sub-region. This is often referred to under the network principle of REPLICATION (11).
• Whilst ensuring individual MPAs are well-connected in terms of facilitating the exchange of species and ensuring adequate propagule/egg dispersal is cited as being of importance across all three active Regional Sea Conventions, in practice there is a lack of sufficient information at a Regional Sea Convention level to undertake such an analysis. Instead proximity analysis is often used as a proxy under the network principle of CONNECTIVITY.
• Whilst MPA size is seen as an important factor to consider in MPA design, the Regional Sea Conventions vary in terms of how this is treated in the context of a network assessment. OSPAR does not consider MPA size to be an important factor in the context of an assessment of a network, as MPA sizing would have been considered in the context of site design to ensure the ecological integrity of the feature(s) an individual MPA is intended to protect. HELCOM does set a minimum size requirement for MPAs as part of a network. It is unknown at present whether this criterion will be considered in the 2016 Barcelona Convention network assessment. MPA size is often referred to under the network principle of ADEQUACY(12).
• MPA ‘quality’ is specifically referred to under HELCOM as an important consideration under the principle of ADEQUACY – approximated by the exposure of protected features to pressures associated with human activities that could threaten the achievement of conservation objectives.
• Proportion of features is also something that has been considered at a national level under several MPA network initiatives under the principle of adequacy (e.g. in the UK – see Natural England & JNCC (2010)(13) underpinned by the scientific findings of Rondinini (2011)(14)). In 2014 the Barcelona Convention, in drawing on the guidance set forth by the latter initiatives, suggests that in designing an MPA network aspects such as the proportion of each feature included within the MPA network capable of enabling its long term protection / recovery should be considered. This network principle is defined as ADEQUACY.
• All three Regional Sea Conventions refer explicitly to the importance of effective management of sites in achieving an ecologically coherent network – but this is considered conceptually separate from a network-level assessment of ecological coherence and refers more specifically to tracking progress of individual MPAs towards achieving their conservation objectives. These types of considerations are referred to under the broader principle of MANAGEMENT. It is notable that both OSPAR and the Barcelona Convention are attempting to collect and record such information in order to make a judgment against the degree to which their networks are ‘well-managed’ – with the OSPAR assessment of management effectiveness due to be reported in 2017. However, the questions being asked are not comparable and do not allow for a comprehensive review at the European level. Until standardised and shared datafields containing information on ‘MPA management’ (e.g. progress with the implementation of management plans/measures, monitoring plans and information on the degree to which conservation objectives have (or have not) been achieved) are introduced into all pertinent MPA databases (i.e. N2K, CDDA, RSCs), it is likely that no overall European assessment can be considered to assess MPA management with any degree of confidence.
(11) ‘Resilience’ under OSPAR. (12) ‘Resilience’ under OSPAR. (13) http://jncc.defra.gov.uk/PDF/100705_ENG_v10.pdf (14) http://jncc.defra.gov.uk/page-5813

Assessing Europe’s Marine Protected Area networks 19
3 Overview of available datasets to support an assessment of European MPA networks
As acknowledged by the Regional Sea Conventions of geographical relevance to the European marine area, the feasibility of undertaking MPA network assessments at a large spatial scale requires having access to well-managed and consistent data sources. This section of the report provides an overview of available datasets to support an EU-level MPA network assessment. 3.1 Assessment areas The proposed units which set the geographical boundary underpinning the proposed EU MPA network assessment framework are the EU marine regions and subregions defined for the purposes of applying the MSFD. The extent of the subregions has been object of inter-service consultation within the Commission and Eionet consultation. Furthermore, the European marine regions and subregions as defined by the MSFD and the Marine Spatial Planning Directives are considered to be ecologically relevant because they account for variation in environmental factors such as large-scale oceanographic processes. Map 3.1 indicates the extent of the MPA assessment area in each EU marine region and subregion as well as the relative extent of each Regional Sea Convention area (15). The assessment areas are further defined according to three buffer belts that indicate the distance from the coast (hereon referred to as 0-1NM, 1-12NM, 12 NM- END) defined in the EEA report on marine protected area spatial statistics (EEA, 2015b). 3.2 MPA datasets The MPA datasets available for use at the EU level are the marine Natura 2000, CDDA derived sites and Regional Sea Convention databases. MPAs established under these three frameworks are potentially different because they are defined according to different conservation objective features (i.e. Habitats and Bird Directives’ species and habitats of community importance as opposed to RSC features of regional conservation importance). In some regions the degree of overlap between sites established under these frameworks, such as the marine Natura 2000 versus the CDDA sites or the CDDA sites versus the RSC sites, can be moderately high depending on the interpretation given by Member States in incorporating European or regional conservation objectives into nationally designated MPA policies (EEA, 2015b). The assessment scenarios that will be generated by the present exercise will be based on the MPA datasets described in the EEA report on marine protected area spatial statistics (EEA, 2015b) which refer to data reported by Member States at the end of 2012. Future MPA network assessment re-runs will be able to rely on the availability of the same type of network data because Natura 2000 and CDDA spatial and tabular data are reported annually and can be accessed from the EEA portal (http://www.eea.europa.eu/data-and-maps/data/). Updated RSC MPA data can be obtained directly through the respective RSC databases. The assessment procedure foresees use of the spatial datasets which are joined to the respective site’s tabular information. (15) It is important to note that in some cases the surface area extent of the marine regions and subregions does not fully match that for which the European States have full legal competence. For example, in the Adriatic and the central Mediterranean and Ionian Sea, MPAs can be established in the territorial waters which extend 12 nautical miles from the coast for countries such as Italy and 6 nautical miles for Greece. Spatial measures of protection / management for areas lying beyond these territorial waters may not be established through national legislation but within the framework of international agreements such as international FAO’s General Fisheries Commission for the Mediterranean (i.e. for the establishment of Fishery Restriction Areas) or the Barcelona Convention (i.e. for the establishment of offshore MPAs).

20 Assessing Europe’s Marine Protected Area networks
Map 3.1 EEA MPA assessment areas according to EU marine regions and subregions and boundaries of Regional Sea Convention areas
Notes: This map serves as a working tool only and shall not be considered as an official or legally-binding map representing marine borders in accordance with international law. These maps shall be
used without prejudice to the agreements that will be concluded between Member States or between Member States and non-EU states in respect of their marine borders. Source: MSFD_Marine_Subregions_draft_EU_EEZ_20130614 (ETC/ICM); Barcelona convention area: http://forum.eionet.europa.eu/etc-icm-consortium/library/subvention-2014/tasks-and-
milestones-2014/1.6.1.-spatial-reference-layers/milestone-1-spatial-reference-layers-msfd/justification-delineation-msfd-article-4-marine-regions-and-subregions-internal; Bucharest convention area: boundaris defined in http://www.blacksea-commission.org/_tda2008-document3.asp; HELCOM convention area: http://maps.helcom.fi/website/mapservice/index.html; OSPAR convention area: http://odims.ospar.org/odims_data_files/ .

Assessing Europe’s Marine Protected Area networks 21
3.3 European-wide datasets of marine features In order to attempt to assess the MPA network coherence, screening of data sets providing exhaustive spatial coverage of the marine biological features is necessary in order to define the feasibility of assessing the network with respect to the distribution of the features of a given basin. The species groups considered within the framework of MSFD reporting could be the common units with which to evaluate the network across the EU. However the paucity of pan-European spatial and harmonized datasets on marine species’ distribution hinders this type of evaluation at present. MSFD Broad (ex-predominant) Habitats and EUNIS Level 3 Habitat Classes are the ‘common units’ that can depict marine benthic habitats at the finest level of detail across the EU Marine Regions. These habitat types can be can be derived from the EMODnet16 spatial product deliveries as EMODnet represents the most harmonized pan-European spatial data describing the sea bottom and its habitat types. Biological depth zones The EMODnet final delivery on broad-scale seabed habitats and substrate represents the best spatial data that can be used to assess network coverage against biological depth zones. The coverage of the EMODnet biological zone maps, with respect to the MPA assessment areas is shown in map 3.2. Biological zone definition is available for all European marine subregions with the exception of two small portions in the southern part of the Iberian Peninsula and in the southern part of Macaronesia.
Map 3.2 Availability of the modelled benthic biological zones from EMODnet products in the Regional Seas surrounding Europe
Notes: This map serves as a working tool only and shall not be considered as an official or legally-binding map representing marine
borders in accordance with international law. These maps shall be used without prejudice to the agreements that will be concluded between Member States or between Member States and non-EU states in respect of their marine borders.
16 http://www.emodnet.eu/seabed-habitats

22 Assessing Europe’s Marine Protected Area networks
Modelled broad scale habitats The EMODnet broad scale habitat maps produced within the framework of the EUSEAMAP projects are the most exhaustive spatial dataset available containing benthic broad scale habitat distribution in Europe’s seas. The geographic coverage of the EMODnet habitat final delivery (which is different from that of biological zone definition) with respect to the MPA assessment areas is shown in map 3.3. This map indicates the availability of complete coverage of broad scale modelled habitats in the Baltic Sea, North Sea, Black Sea and all the subregions of the Mediterranean Sea. However, the EMODnet broad scale habitat map has large gaps in parts of Macaronesia (Canaries and Madeira), as well as the Bay of Biscay and Iberian coast, and the southwestern part of the Celtic sea. These gaps are due to the absence of substrate information. This implies that MPA assessment outcomes based on benthic habitat data will have gaps for these areas. Map 3.3 Availability of the modelled broad scale benthic habitat from EMODnet products in the Regional
Seas surrounding Europe
Notes: This map serves as a working tool only and shall not be considered as an official or legally-binding map representing marine
borders in accordance with international law. These maps shall be used without prejudice to the agreements that will be concluded between Member States or between Member States and non-EU states in respect of their marine borders.
In areas where modelled broad scale habitat maps are available an option could be to run the assessment scenario using the EMODnet broad-scale habitats. However the resulting MPA network assessment would not be comparable from one subregion to another given that the EMODnet broad-scale habitat types are different amongst subregions. In fact each EMODnet modelled broad scale habitat types refer to specific peculiar biological features (i.e. specific benthic communities or biocoenosis) occurring at a regional sea level and as such cross comparison of network representativity of the single broad scale habitats amongst Europe’s seas will not be possible on a one to one habitat basis. A particular aspect worth considering is the degree to which EMODnet modelled broad-scale habitat categories can be cross-walked into the MSFD predominant habitat typologies. First of all let us accept the assumption that the ‘predominant benthic habitat types’, as defined by the Commission Staff Working Paper (European Commission, 2011) can be replaced by the “broad” habitat groups defined by the ongoing review process proposed by the European Commission (2016). This basically entails the substitution of the terms “shallow sublittoral” and “shelf sublittoral”, indicated in the Commission Staff Working Paper (SEC,

Assessing Europe’s Marine Protected Area networks 23
2011) with the respective terms “infralittoral” and “circalittoral”. The European Commission has proposed that these MSFD benthic habitats, in their revisited definition, be indicated as MSFD broad habitat groups (European Commission, 2016). It must be remembered that EMODNET broad-scale habitats were modelled, in different ways at each regional sea level, by intercepting single or multiple substrate classes (Folk 7 categories: sand, muddy sand, mud, sandy mud, mixed, coarse, hard bottoms) with the biological zone partitioning and arrays of other environmental parameters (i.e. energy, light, salinity). The analysis of the EMODnet modelled broad-scale habitat types, when crosswalked against the broad habitat groups, indicates that in some regions, such as the Mediterranean and the Black Sea, some broad-scale habitats were modelled taking into consideration more than one substrate class. As a consequence the modelled broad-scale habitat types do not crosswalk unambiguously into the MSFD broad habitat groups. The Emodnet seabed habitat delivery does provide a MSFD predominant habitat layer. However the attributes of the predominant habitat categories indicate that the habitats refer to the initial predominant categories defined by the Commission Staff Working Paper (European Commission, 2011). The MSFD predominant habitat categories, regardless of whether one considers them as defined by the Commission Staff Working Paper (2011), or in the revised version (European Commission, 2016), both differentiate bathyal and abyssal habitats into two substrate classes (hard / biogenic vs. soft bottoms) rather than considering the five substrate classes (4 soft bottoms and 1 hard) described in the shallower biological zones. Since the EMODnet modeled bathyal and abyssal broad scale habitats are described according to the Folk 5 substrate classes, where available, these sediment classes should always be considered. The MSFD predominant habitat classification also differentiates the bathyal zone in two subzones. Considering that not all European basins are characterised by modeled upper and lower bathyal (EMODnet models the Atlantic bathyal in three subzones: upper, middle and lower, while only one bathyal is modeled in the Mediterranean and Black Seas), it is not possible to consider the bathyal habitats based on two bathyal subdivisions. In light of the above considerations, the EMODNET seabottom habitat delivery be used in an alternative way so that MPA network coverage is analysed with respect to specific features, that are commonly shared between marine regions. The EMODnet seabottom habitats are described according to the Folk 5 or Folk 7 sediment classification and are sorted according to biological (depth) zones (17). These habitat features can be intersected to obtain a habitat list that contains a further level of detail with respect to the MSFD broad habitats and that can also be crosswalked into the broader MSFD broad habitat categories where such circumstances arise. Table 3.1 lists the proposed habitat classes and indicates their relationship to the MSFD broad habitats. The habitat map is constructed by using the EMODnet 2016 delivered biological zone definition (infralittoral, circalittoral, bathyal, abyssal zones) and the Folk 5 substrate classes (mud, sand, coarse, mixed, hard bottoms) that are described in each modeled habitats’ attribute table and which refer to the considered original substrate polygons. On the basis of this approach a total of 20 habitat classes are identified in each EU marine region / subregion (five habitat classes per each of the above-mentioned biological zones). The only exception is in the Mediterranean Sea where the substrate layer considered also provides information on the presence of Posidonia and Cymodocea beds. This implies that in this subregion the total number of considered habitats is 22. For the purpose of the present report we will refer to these proposed habitat classes as “revised broad habitats”. While not necessarily addressing the univocal biological features of each basin, the revised broad habitats allow to assess the MPA network at the highest level of available pan-European spatial resolution and allow cross comparison of network coverage from one basin to another. (17) http://www.emodnet-geology.eu/emodnet/srv/eng/progress#wp3

24 Assessing Europe’s Marine Protected Area networks
It is worthwhile noting that in the EMODNET Phase I and II deliveries (Cameron & Askew, 2011; Populus et al., 2017) the sandy mud and muddy sand Folk classes that characterize the modeled seabed habitat types are not attributed, with a consistent rule, to the broader Folk 5 mud and sand categories throughout the different regions. In the Mediterranean and Black sea regions, sandy mud is attributed to the Folk 5 mud class and muddy sand to the sand class (figure 3.1a) while in the North-East Atlantic Ocean and Baltic Sea regions both sandy mud and muddy sand are attributed to the Folk 5 mud sediment class (figure 3.1b) . The revised broad habitat layer used for the MPA assessment was constructed for each region on the basis of the above mentioned classification rules. The procedure developed to convert EMODnet seabed habitats in the revised broad scale habitats is described in Annex 1. Figure 3.1 Differences in the attribution of overall Folk sediment classes (in black) with respect to Folk 5
sediment classes (in colour) in the EMODnet modelled broad scale benthic habitat delivery (a Mediterranean and Black Sea; b North-East Atlantic Ocean and Baltic Sea) (Modified from Populus et al.,2017)
The MSFD broad habitat categories proposed by the European Commission also identify pelagic habitats. In the current EU proposal they are ‘variable salinity’, ‘coastal’, ‘shelf’ and ‘oceanic/beyond shelf’. Coastal, shelf and oceanic/beyond shelf could be identified through the boundaries of some of the biological zone partitions delivered by EMODnet (i.e. infralittoral as a proxy of coastal, circalittoral as proxy of shelf, bathyal and abyssal as proxy of oceanic/beyond shelf). However no pan-European spatial delineation or even textual definition of the pelagic broad habitat groups is available. As this is the situation, we will not yet include these to the assessment scheme, but note that the marine zones can be later adapted to the pelagic habitats, if necessary.

Assessing Europe’s Marine Protected Area networks 25
Table 3.1 Proposed assessment habitat classes (revised broad habitats) based on the crosswalk of MSFD broad habitat types with respect to EMODnet Folk 5 substrate and seabed biological zone classes
MSFD broad habitat groups (alias ex- MSFD predominant habitats)
EMODnet Folk5 seabed substrate types and biological zones (Revised broad habitats)
Littoral rock and biogenic reef N/A
Littoral sediment N/A
N/A Posidonia meadows
N/A Cymodocea meadows
Infralittoral rock and biogenic reef Infralittoral rock
Infralittoral coarse sediment Infralittoral coarse sediment
Infralittoral sand Infralittoral sand
Infralittoral mud Infralittoral mud
Infralittoral mixed sediment Infralittoral mixed sediment
Circalittoral rock and biogenic reef Circalittoral rock and biogenic reef
Circalittoral coarse sediment Circalittoral coarse sediment
Circalittoral sand Circalittoral sand
Circalittoral mud Circalittoral mud
Circalittoral mixed sediment Circalittoral mixed sediment
Upper bathyal rock and biogenic reef Bathyal rock
Upper bathyal sediment
Bathyal coarse
Bathyal sand
Bathyal mud
Bathyal mixed sediment
Lower bathyal rock and biogenic reef N/A no upper and lower bathyal biological zone partitioning is available in EMODnet seabed habitats (except Atlantic)
Lower bathyal sediment Abyssal rock and biogenic reef Abyssal rock
Abyssal sediment
Abyssal coarse
Abyssal sand
Abyssal mud
Abyssal mixed sediment

26 Assessing Europe’s Marine Protected Area networks
4 Proposing a methodological framework for an assessment of EU MPA networks Based on the findings presented in Sections 2 (in terms of Regional Sea Convention approaches as the appropriate building blocks for an EU-level MPA assessment methodology) and Section 3 (in terms of reviewing available EU-wide datasets to support such an assessment), this section puts forward a proposed methodological framework for a European assessment of MPA networks (see table 4.1). The decisions made are largely a reflection of:
• what makes sense in ecological terms and with assessment units that allow cross-comparison across basins;
• datasets available to support an EU-level assessment;
• apparent synergies across the Regional Sea Convention approaches;
• the needs dictated by the contents of marine policy directives such as the MSFD.
We have divided the proposed assessment framework presented in table 4.1 into three ‘tiers’ of assessment: Tier 1 – characterized by assessment procedures that address univocal assumptions: all three MPA
networks are considered all together (Natura 2000, CDDA, RSCs) at an overall European scale and at each biogeographic region scale, comparable aspects and features are considered across all regional seas, univocal targets and thresholds are used for each assessment trial.
Tier 2 – characterized by assessment procedures that address univocal assumptions as in Tier 1 with the exception that more than one target value is considered for any assessment so that more than one assessment scenario is produced for any given exercise. The considered targets refer to values used by RSCs in their past regional network assessments.
Tier 3 – characterized by specific assessments that consider subsets of MPAs screened on the basis of specific aspects or tabular information. This tier analyses specific aspects that cannot be assessed for all MPA networks due to missing information from some MPA datasets. The intent is to indicate how future improvements of databases and reporting on MPAs can improve European MPA assessment exercises.
4.1 Tier 1 – Target-based pan European and EU regional assessments
• REPRESENTATIVITY – ≥10% percentage coverage of MPAs across the EU marine region, at region /subregion level, in three distance belts from the coast (0-1NM, 1-12NM, 12 NM- END) and in 4 different biozones (infralittoral, circalittoral, bathyal, abyssal).
This is a reflection of common approaches across all three active Regional Sea Convention approaches and of the Aichi target 11 under the CBD. It also reflects a recommendation based on a review by Olsen et al., (2013) on science needs and priorities for achieving ecologically coherent networks in Europe; that MPAs should encompass a range of depths and environmental gradients. We fully understand that Aichi Target 11 also makes reference to other area-based measures contributing to the 10% target as well as MPAs, but there is no available information with which to encorporate other area-based measures into the assessment at the current time. Likewise, there is no formal EU definition of what ‘area-based measures’ means in an EU context.
• REPRESENTATIVITY – ≥20% or 60% coverage of revised broad habitats derived from EMODnet Ideally, we acknowledge that an assessment of network coverage for the biological components involving benthic habitats should be carried out at EUNIS Level 4 (which is where biological communities are introduced in this habitat classification). However, considering that the EUNIS habitat classification scheme is currently in the process of revision and that no harmonised EUNIS level 4 habitat map is available for

Assessing Europe’s Marine Protected Area networks 27
Europe’s seas, the interim assessment will be done at a broader scale. We consider that the revised broad habitats as defined through the work of EMODnet and described in chapter 3 represent an equivalent measure and the best available pan-European spatial data capable of presenting the ‘range of habitats’ present within the EU marine regions. The revised broad habitats intersect information on biological benthic zone with Folk 5 sediment class categories and reflect habitats at a basin level. The spatial layer used can be compared to a EUNIS level 3 (version revised in 2016) compliant map with the sole exception that the new version of EUNIS divides the circalittoral and bathyal into upper and lower subzones while EMODnet habitats do not contain this subdivision. The 20% target is derived from the methodology that is applied to assess marine Natura 2000 network sufficiency (ETC/BD 1997, 2009) whereby 20% habitat coverage is arbitrarily used to define the Natura 2000 sufficiency coverage for the Directive’s non-priority habitats. The Natura 2000 sufficiency coverage approach also foresees that at least 60% of the Community priority habitats be included in the network. Though this is not a legally binding target, we believe that it is more appropriate to raise the target to at least 60% when assessing a revised broad habitat that is univocally defined as a priority habitat. HD priority habitats are Posidonia meadows (habitat 1120) and coastal lagoons (habitat 1150). Posidonia meadows are the only revised broad habitat that can be associated to a HD priority habitat and as such they will be assessed with a 60% target. 4.2 Tier 2 – Multi target scenario-based Pan European and EU Regional assessments
• REPLICATION – number of revised broad habitat replicates in the MPA network in each EU marine regions/subregions
The ethos underpinning the principle of replication is to best safeguard protection of the range of habitats, species or ecological processes within a network. From an ecological point of view, it would make sense for such an assessment of replication to be based on features considered of conservation importance within particular EU marine regions. In their respective MPA network assessments, Regional Sea Conventions consider the sufficient replication of protection of features of conservation importance within each geographic subregion (i.e. Mediterranean ecoregions and sub-basins, OSPAR regions and Dinter biogeographic provinces, HELCOM subbasins). In so doing regional assessments measure the degree to which a feature is protected with sufficient replicates throughout a wide geographic area in order to guarantee the viability of the feature throughout space. Assesment of the feature’s replication thus acts in synergy with representativity and connectivity to guarantee that it is protected sufficient times throughout the feature’s geographic range, in sufficient quantity and in protected areas that are sufficiently close enough to guarantee viability. From a benthic habitat point of view EUNIS Level 4 habitats represent the level at which biological variation in seabottom habitat types can be accounted for. However as mentioned above, an assessment of replication of features cannot be run at a EUNIS level 4 level due to the paucity of spatial data and an inability to determine from available datasets whether such features are afforded protection within a given MPA. In the present pan-European assessment it is proposed to measure the degree of replication of each revised broad habitat class within each EU marine region / subregion. The replication scenarios will be generated considering two target values referring to minimum number of replicates. The first one refers to the target used in the OSPAR approach, whereby if more than 1 revised broad habitat occurs in the MPA network region / subregion the criterion is considered to be reached. The second scenario refers to the target used in the HELCOM approach whereby if if at least 4 revised broad habitats occur in the MPA network the criterion is reached.
• CONNECTIVITY – Proximity analysis of revised broad habitats between MPAs The connectivity criterion is developed so as to assess the degree of proximity of revised broad habitats contained within the MPA network at a regional / subregional level. The connectivity scenarios will be evaluated considering the distance of each broad habitat polygon within the MPA network against a series of distance target values. Since the revised broad habitats are inherently tied to a benthic zonation scheme

28 Assessing Europe’s Marine Protected Area networks
(infalittoral, circalittoral, bathyal, abyssal) the resulting scenario assessments are indicative of potential habitat connectivity with respect to the distance from the coast. This implies that the scenario assessments for connectivity do not need to be interpreted against buffer distance belt considerations. The target distance values that will be considered for the scenario assessments will reflect those used in previous and current RSC assessments (see table 2.1) with respect to distance from the coast. They are attributed on the basis of the biological zones in which the revised broad habitat types are found (infralittoral: 25, 50, 100 km, circalittoral: 50, 100, 250 km, bathyal/abyssal: 100, 250, 500 km). It is also proposed that the proximity analysis of each protected revised broad habitat take into consideration the degree of gaps that exist, within any given region / subregion and for each resulting target scenario, between protected revised broad habitats that are connected. The OSPAR convention approach that defines a tolerated value of up to 10 gaps between MPAs containing connected protected habitat (OSPAR, 2008) is considered reasonable and is introduced in the proximity analysis. For each generated scenario assessment, we assume that the target is reached if ≥75% of protected revised broad habitat is connected within each region / subregion.
• ADEQUACY – MPA size The adequacy principle is assessed by providing an overview of MPA size according to different target values (0-5 km2, 5-30 km2, 30-100 km2, and ≥100 km2). The proposed target value classes indicate MPA size trends above and below the Helcom assessment target, which foresees that most MPAs have a surface area of at least 30 km2, and the minimum 100 km2 size target indicated by Edgar et al. (2014) as one of five features critical to the conservation success of MPAs. A <5 km2 size category is also proposed to flag potential warnings on the assumption that MPAs that are small tend to not be characterized by species’ and habitat diversity and guarantee population viability. A threshold is applied to determine the goodness of the MPA size assessment for two targets: 75% of the sites should be ≥5 km2, which is a very conservative value compared to scientific studies of the the required MPA size (see the review by Deltares 2014). The same threshold is applied to the ≥30 km2 target in order to produce an overall European evaluation with respect to the HELCOM assessment procedure. 4.3 Tier 3 – Case studies indicating further improvement to MPA network assessments
• REPRESENTATIVITY – marine Natura 2000 and a case study from the Western Mediterranean Sea In Tier 1 we considered the coverage of revised broad habitats with respect to all MPAs. The evaluation of representativity of sea bottom habitats however, should be based on the assumption that MPAs have conservation objectives centered on sea bottom habitat protection. However not all of the considered MPA databases have attributes that allow to select MPAs based on this prerequisite. For the purposes of this part of the assessment framework, it is proposed to:
a) Run a comparison between revised broad habitat representativity of marine Natura 2000 sites against that of Natura 2000 sites established merely for benthic marine habitats. This will be run for all EU subregions and will allow comparison of representativity targets reached for all sites as opposed to sites selected for benthic habitat protection.
b) Run a revised broad habitat representativity of all MPAs in the Western Mediterranean Sea (CDDA, RSC, Natura2000) whose conservation objectives involve seabed habitat protection. The output will be compared to the overall Western Mediterranean Sea output for revised broad habitat representativity described in Tier 1.
The purpose of these Tier 3 assessments is to indicate how further refinements of the tabular databases (CDDA and all RSC) could allow, in the future, to identify whether or not EUNIS Level 3 habitat types and revised broad habitat types are considered to represent a protected feature of a given MPA. This adds confidence to the assessment outcome.
• MANAGEMENT – a case study on marine Natura 2000 sites age versus management plan

Assessing Europe’s Marine Protected Area networks 29
Although not directly linked to the measurement of MPA network coherence, one of the criteria used to assess MPA networks at international and regional sea level is the evaluation of management effectiveness. This principle links to the Aichi 11 target which has been explained in section 1. From a theoretical point of view a network could be designed so as to be most adequate in terms of its capacity to: represent the diversity of constituent elements of a given region, cover a sufficient size and replicate of habitat and species types, contain protected areas sufficiently close enough to guarantee the connectivity and exchange of species from one protected area to another. However, a pivotal aspect that needs to be evaluated in order to assess the coherence of the network with respect to the conservation objectives for which it was established is its capacity to deliver conservation benefits through an effective functioning and management. This is where measurement of management effectiveness becomes an important component to measure the strength of the network. Existing literature has advocated that MPA age can be used as a generic proxy to evaluate management effectiveness and some studies have indicated that the minimum MPA age threshold of 10 years can be considered indicative of the existence of sufficient management measures / plans and consequent MPA effectiveness (Gabrie et al. 2012; Edgar et al. 2014). This approach, however, has been subject of debate especially in cases in which the MPA establishment process does not foresee the strict implementation of site management tools following the MPA designation act. The analysis of MPA effectiveness would be best inferred by evaluating aspects such as the existence of management plans and type of management / conservation measures put in place. One of the limits to assessing any aspect regarding MPA networks in European seas is the high heterogeneity among the different tabular databases which influences the options available for running statistical elaborations involving specific parameters. This situation can require specific data treatment in order to evaluate the entire network components in a comparable way; often times this involves making a-priori assumptions and/or using proxy variables. A specific hindrance in evaluating management effectiveness of marine protected areas at regional level is that not all MPA databases (CDDA, RSCs, Natura 2000) contain data fields with information regarding the existence of MPA management measures / plans. At present the only European marine MPA reporting procedure that boasts a database with data fields for site establishment and the existence of a management plan is that related to the Natura 2000 network. The Natura 2000 reporting procedure foresees compiling information on: the existence of a site management plan, the name of the management plan and respective url address where the plan may be downloaded. Compilation of these fields is mandatory as of 2015. The present exercise investigates the scenario assessment which results when one evaluates the marine Natura 2000 network with respect to the MPA 10 year age threshold as opposed to that resulting from the assessment of the existence of a site specific management plan, as proxy for the evaluation of management effectiveness.
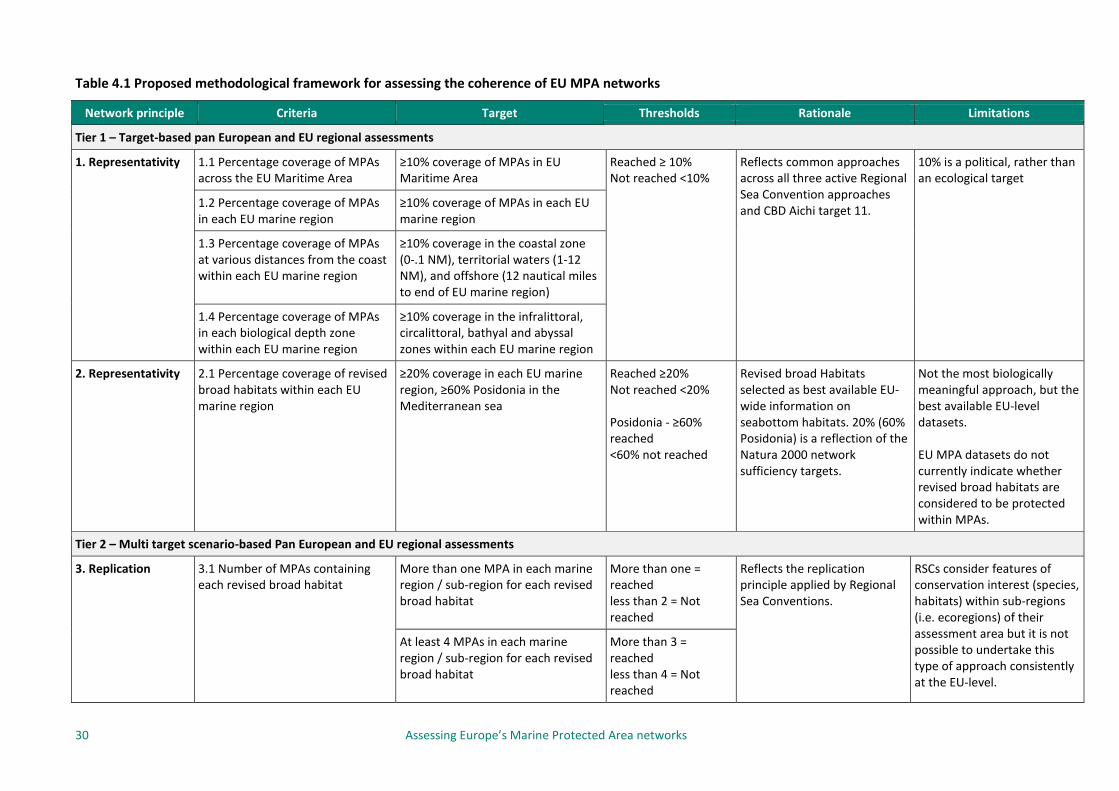
30 Assessing Europe’s Marine Protected Area networks
Table 4.1 Proposed methodological framework for assessing the coherence of EU MPA networks
Network principle Criteria Target Thresholds Rationale Limitations
Tier 1 – Target-based pan European and EU regional assessments
1. Representativity 1.1 Percentage coverage of MPAs across the EU Maritime Area
≥10% coverage of MPAs in EU Maritime Area
Reached ≥ 10% Not reached <10%
Reflects common approaches across all three active Regional Sea Convention approaches and CBD Aichi target 11.
10% is a political, rather than an ecological target
1.2 Percentage coverage of MPAs in each EU marine region
≥10% coverage of MPAs in each EU marine region
1.3 Percentage coverage of MPAs at various distances from the coast within each EU marine region
≥10% coverage in the coastal zone (0-.1 NM), territorial waters (1-12 NM), and offshore (12 nautical miles to end of EU marine region)
1.4 Percentage coverage of MPAs in each biological depth zone within each EU marine region
≥10% coverage in the infralittoral, circalittoral, bathyal and abyssal zones within each EU marine region
2. Representativity 2.1 Percentage coverage of revised broad habitats within each EU marine region
≥20% coverage in each EU marine region, ≥60% Posidonia in the Mediterranean sea
Reached ≥20% Not reached <20% Posidonia - ≥60% reached <60% not reached
Revised broad Habitats selected as best available EU-wide information on seabottom habitats. 20% (60% Posidonia) is a reflection of the Natura 2000 network sufficiency targets.
Not the most biologically meaningful approach, but the best available EU-level datasets. EU MPA datasets do not currently indicate whether revised broad habitats are considered to be protected within MPAs.
Tier 2 – Multi target scenario-based Pan European and EU regional assessments
3. Replication 3.1 Number of MPAs containing each revised broad habitat
More than one MPA in each marine region / sub-region for each revised broad habitat
More than one = reached less than 2 = Not reached
Reflects the replication principle applied by Regional Sea Conventions.
RSCs consider features of conservation interest (species, habitats) within sub-regions (i.e. ecoregions) of their assessment area but it is not possible to undertake this type of approach consistently at the EU-level.
At least 4 MPAs in each marine region / sub-region for each revised broad habitat
More than 3 = reached less than 4 = Not reached

Assessing Europe’s Marine Protected Area networks 31
Network principle Criteria Target Thresholds Rationale Limitations
4. Connectivity (proximity)
4.1 Proximity of infralittoral revised broad habitats contained in MPAs
Infralittoral broad habitats are no futher apart than than 25/50/100km in each EU marine region
Percentage of broad habitats included in MPAs lying in proximity value for each scenario range is given. 75% threshold applied to each scenario. Reached ≥ 75% Not reached <100%
Reflect the range of proximity analysis approaches used as a proxy for connectivity by the Regional Sea Conventions. All broad habitats contained in MPAs should be connected
Same as above, but also that proximity analysis is a relatively crude measure for the ecological connectedness of MPA networks 4.2 Proximity of circalittoral
revised broad habitats contained in MPAs
Circalittoral broad habitats are no futher apart than 50/100/250km in each EU marine region
4.3 Proximity of revised bathyal and abyssal broad habitats contained in MPAs
Bathyal / Abyssal Broad habitats are no further apart than 100/250/500 km in each EU marine region
5. Adequacy 5.1 MPA size Proportion of MPAs in each marine region /sub-region which are <5 km2, 5-30 km2, 30-100 km2, and ≥100 km2
Reached ≥75% sites are ≥5 km2 and ≥30 km2
Not reached <75% are ≥5 km2 and ≥30 km2
Tier 3 – Case studies indicating further improvement to MPA network assessments
6. Representativity 6.1 Percentage coverage of revised broad habitats within marine N2K sites selected for sea bottom habitats in each EU marine region compared against all marine Natura 2000 sites
≥20% coverage in each EU marine region, ≥60% Posidonia in the Mediterranean
Reached ≥20% Not reached <20% Posidonia - ≥60% reached <60% not reached
Revised broad habitats selected as best available EU-wide information on seabottom habitats. 20% (60% Posidonia) a reflection of Natura 2000 network sufficiency targets
Not the most biologically meaningful approach, but the best available EU-level seabed habitat datasets
6.2 Percentage coverage of revised broad habitats within ALL MPAs selected for sea bottom habitats in the Western Mediterranean sea
≥20% coverage in each EU marine region, ≥60% Posidonia
As above As above As above
8. Management and effectiveness of N2K
6.2 Percentage of N2K sites older than 10 years versus percentage of sites with management plans
none

32 Assessing Europe’s Marine Protected Area networks
5 Assessment routines and results This section provides an overview of the methodological assessment framework undertaken for each criterion based on the available datasets and the results obtained from each evaluation. 5.1 Tier 1 – Target-based pan European and EU regional assessments CRITERIA 1.1-4: Overall percentage coverage of MPAs across the EU marine area and within each EU
marine region /subregion. Percentage coverage of MPAs, at various distances from the coast and within different depth zones within each EU region / subregion
INPUT DATA: EU Maritime Area, EU Marine Regions, buffer distance belts (0-1NM, 1-12NM, 12NM-
END), Biological zones (infralittoral, circalittoral, bathyal, abyssal), derived from EMODnet seabed habitat map), designated MPAs in Europe (N2K, CDDA and RSCs).
ROUTINE: Spatial MPA network data layers are merged into a unique layer. Surface area of the
different MPAs are overlaid so that surface areas are counted only once in instances where MPAs overlap. The procedure to estimate the percentage coverage of MPAs is the one described in the EEA technical report 2015b. Python scripts will run a spatial analysis using ArcGIS (ESRI inc.).
CAVEATS: The spatial/tabular datasets used for the assessment against the criterion are affected
by several caveats. The MPA shoreline boundary derived from coastlines provided by EU Member States is often poor. The MPA polygon’s position in some cases may shift because of several cartographic issues such as incorrect projection systems. Spatial/tabular datasets are often not well compiled thereby affecting site selection.
RESULTS: A map with histograms in each EU Region illustrating whether MPA coverage in
distance from the coast and depth classes reaches the 10% target, percentage values in each EU Region for overall percentage coverage (map 5.1). This is accompanied by tables showing similar data (table 5.1 to 5.3).

Assessing Europe’s Marine Protected Area networks 33
CRITERIA 1.1 & 1.2 Table 5.1 Percentage coverage of MPAs across the EU marine Area and in each EU marine region
MPA assessment area regions, subregions, and overall EU marine area % covered by MPAs
Baltic Sea 13.5
North-East Atlantic Ocean 4.2
Celtic Sea 4.4
Greater North Sea incl. Kattegat and English Channel 17.9
Bay of Biscay and the Iberian Coast 3.2
Macaronesia 0.8
Mediterranean Sea 9.5
Western Mediterranean Sea 15.6
Ionian Sea and Central Mediterranean Sea 1.6
Adriatic Sea 2.0
Aegean-Levantine Sea 2.6
Black Sea 4.5
Total EU marine area 5.9 Source: table 3.7, EEA 2015b CRITERION 1.3 Table 5.2 Percentage cover of MPAs in nearshore, coastal and offshore waters in European marine
regions
MPA assessment area regions and subregions % of 0-1 NM
zone covered by MPAs
% of 1-12 NM zone covered by
MPAs
% of 12 NM-END covered by
MPAs
Baltic Sea 36.1 16.4 3.9
North-East Atlantic Ocean (inside 200 NM) 52.1 16.4 2.3
Celtic Sea 47.5 8.9 2.3
Greater North Sea incl. Kattegat and English Channel 63.4 32.4 11.2
Bay of Biscay and the Iberian Coast 48.9 15.8 1.7 Macaronesia 28.0 4.0 0.6
Mediterranean Sea 30.6 14.2 6.1
Western Mediterranean Sea 60.4 29.6 10.1 Ionian Sea and Central Mediterranean Sea 30.5 2.7 --- Adriatic Sea 17.0 1.4 ---
Aegean-Levantine Sea 14.2 2.4 ---
Black Sea 77.9 19.3 ---
Total 40.2 15.6 3.0 Source: table 3.8, EEA 2015b
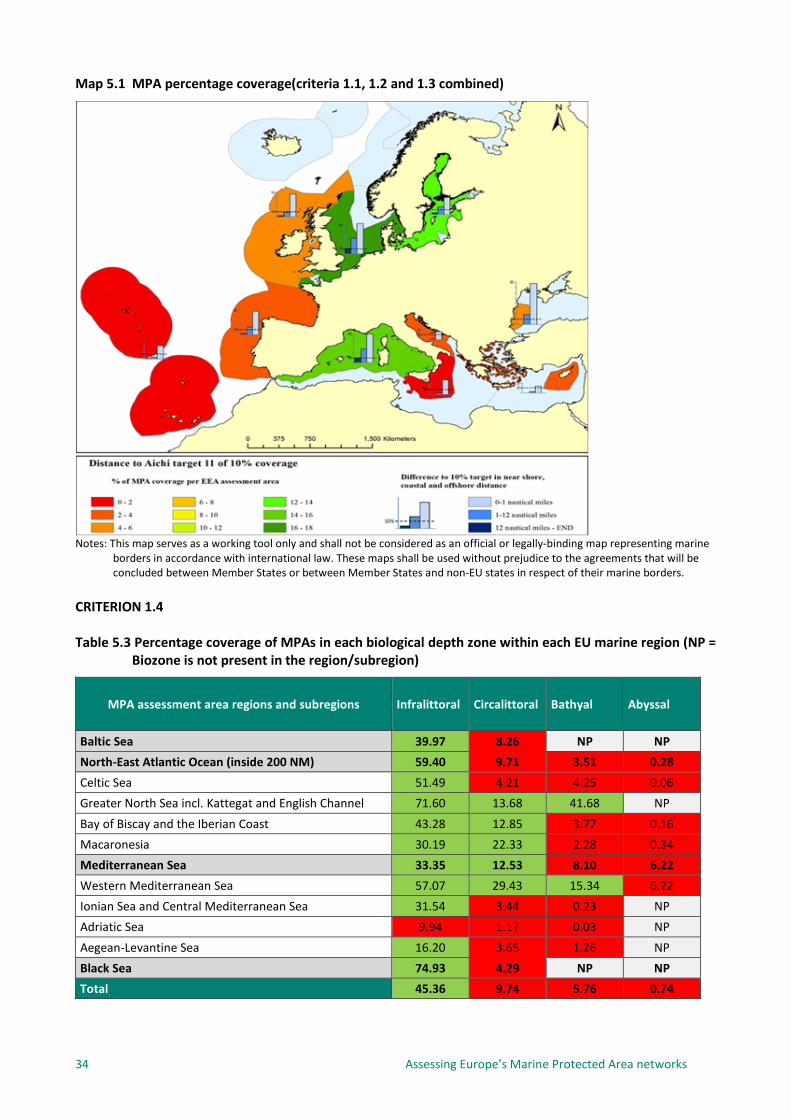
34 Assessing Europe’s Marine Protected Area networks
Map 5.1 MPA percentage coverage(criteria 1.1, 1.2 and 1.3 combined)
Notes: This map serves as a working tool only and shall not be considered as an official or legally-binding map representing marine
borders in accordance with international law. These maps shall be used without prejudice to the agreements that will be concluded between Member States or between Member States and non-EU states in respect of their marine borders.
CRITERION 1.4 Table 5.3 Percentage coverage of MPAs in each biological depth zone within each EU marine region (NP =
Biozone is not present in the region/subregion)
MPA assessment area regions and subregions Infralittoral Circalittoral Bathyal Abyssal
Baltic Sea 39.97 8.26 NP NP North-East Atlantic Ocean (inside 200 NM) 59.40 9.71 3.51 0.28 Celtic Sea 51.49 4.21 4.25 0.06 Greater North Sea incl. Kattegat and English Channel 71.60 13.68 41.68 NP Bay of Biscay and the Iberian Coast 43.28 12.85 3.77 0.16 Macaronesia 30.19 22.33 2.28 0.34 Mediterranean Sea 33.35 12.53 8.10 6.22 Western Mediterranean Sea 57.07 29.43 15.34 6.22 Ionian Sea and Central Mediterranean Sea 31.54 3.44 0.23 NP Adriatic Sea 9.94 1.17 0.03 NP Aegean-Levantine Sea 16.20 3.65 1.26 NP Black Sea 74.93 4.29 NP NP Total 45.36 9.74 5.76 0.74

Assessing Europe’s Marine Protected Area networks 35
CRITERION 2.1: Percentage coverage of the revised broad habitats within each EU marine region INPUT SOURCE: EU Marine Regions, EMODnet seabed habitat, designated MPAs in Europe (N2K, CDDA
and RSCs) ROUTINE: The procedure requires the evaluation of the percentage of each revised broad
habitats occurring within MPAs in each EU Marine Region. This is evaluated by intersecting the MPA layer with each habitat layer in order to obtain the coverage of each habitat type within MPAs. The revised broad habitat classes are generated from the EMODnet seabed habitat layer (see par 4.1.2).
CAVEATS: MPAs may not provide adequate protection to seabed habitat types included within
their boundaries due to different conservation MPA objectives or possible inadequate management measures.
Substrate and habitat maps are not available for some areas of some Atlantic EU Marine Regions (see map 3.2).
The broad-scale modelled map has a 250 m pixel resolution so coverage of small-scale or patchy habitats (i.e. infralittoral muddy sand, hard bottoms) will likely be under-represented. MPA coverage of these habitat types could be underestimated or not picked up at all. Littoral habitats have a small extension and are not represented in broad scale habitat maps so representativity of habitats occurring in this depth zone is excluded from analysis.
RESULTS: A table describing the % of each revised broad habitat type included in the MPA
network per EU marine region. Colour denotes whether target reached (≥20%) or not reached (<20%) (Posidonia oceanica = 60%) (table 5.4).
Table 5.4 indicates that most biogeographic regions are characterized by a high percentage cover of infralittoral revised broad habitats that greatly surpasses the criterion target (the highest value reaching an exceptional 83.79%). The same target sufficiency trend is observed in most subregions. The only exception to this trend appears in the Adriatic sea and in the Aegean and Levantine sea where the percentage of protected infralittoral revised broad habitats is most often below 20%. In the other biological zones remarkedly fewer revised broad habitats reach the 20% coverage target. Generally speaking there is a decreasing % coverage trend from the shelf to offshore which indicates that the Member State protection efforts have been principally focused to the shallower waters.

36 Assessing Europe’s Marine Protected Area networks
CRITERION 2.1 Table 5.4. Percentage coverage of the revised broad habitats within each EU marine region (NP = Revised broad habitat is not present in the region/subregion)
MPA assessment area regions and subregions Ir Ic Is Im Imx Pos Cym Cr Cc Cs Cm Cmx Br Bc Ms Bm Bmx Ar Ac As Am Amx
Baltic Sea 29.33 44.74 59.53 36.03 28.92 NP NP 17.80 19.88 23.39 4.10 6.61 NP NP NP NP NP NP NP NP NP NP North-East Atlantic Ocean (inside 200 NM) 35.44 55.39 68.99 58.49 48.28 NP 62.59 17.74 7.27 10.06 5.47 15.25 11.41 12.76 6.62 3.08 5.16 0.15 0.00 0.79 0.64 0.87
Celtic Sea 40.48 40.87 69.21 64.94 42.35 NP NP 15.91 4.06 2.73 3.00 5.29 26.45 13.55 7.43 3.46 4.37 0.00 NP 17.64 0.04 1.16 Greater North Sea incl. Kattegat and English Channel 57.67 63.87 77.45 57.44 57.19 NP NP 46.54 9.35 13.63 6.25 16.12 NP NP 0.00 41.73 39.58 NP NP NP NP NP
Bay of Biscay and the Iberian Coast 13.92 41.36 37.23 57.04 14.73 NP NP 13.78 28.72 10.52 7.82 22.31 17.95 0.00 6.93 6.38 0.59 0.18 NP 0.64 0.77 NP
Macaronesia 27.24 37.42 28.97 50.60 19.22 NP 62.59 17.06 10.38 41.33 38.48 7.13 3.86 10.65 4.63 1.87 6.41 0.15 0.00 0.01 0.71 0.87 Mediterranean Sea 39.90 38.91 25.36 NP 19.24 62.55 17.17 18.04 42.48 10.82 12.70 2.95 3.33 58.82 28.63 7.38 0.08 NP 48.77 42.39 4.79 NP Western Mediterranean Sea 57.16 53.43 51.12 NP 77.17 62.82 29.63 21.33 48.70 24.08 31.98 34.85 5.67 87.52 36.46 14.19 0.94 NP 48.77 42.39 5.16 NP Ionian Sea and Central Mediterranean Sea 33.74 38.90 28.22 NP 55.33 52.75 19.40 4.60 26.42 3.83 3.12 1.82 0.08 3.51 4.62 0.14 0.00 NP NP NP 0.00 NP
Adriatic Sea 18.92 10.27 8.95 NP 14.95 64.97 1.87 26.41 6.22 1.09 0.94 3.45 NP NP 7.70 0.00 NP NP NP NP NP NP Aegean-Levantine Sea 2.53 5.06 10.34 NP 1.01 76.36 NP 1.09 3.34 4.47 3.55 3.21 0.00 0.03 20.18 0.72 3.15 NP NP NP NP NP Black Sea 59.94 76.57 83.79 57.11 67.99 NP NP 67.87 10.28 2.24 5.51 1.16 NP NP NP 0.00 NP NP NP NP 0.00 0.00 Total 34.06 49.02 54.37 42.39 30.82 62.55 19.60 17.79 8.66 10.85 7.06 8.17 9.45 16.38 12.82 5.61 4.68 0.15 48.76 6.60 1.38 0.84
Habitat legend: I, C, B and A = infralittoral, circalittoral, bathyal, abyssal; r,c,s,m,mx = rock, coarse, sand, mud, mixed sediments; Pos, Cy = Posidonia oceanica meadows, Cymodocea nodosa beds

Assessing Europe’s Marine Protected Area networks 37
5.2 Tier 2 – Multi target scenario-based Pan European and EU regional assessments CRITERION 3.1 Number of MPAs containing each revised broad habitat INPUT SOURCE: MSFD region and subregions, designated MPAs in Europe (N2K, CDDA and RSCs),
revised broad habitat (derived from EMODnet seabed habitat map) ROUTINE: The procedure evaluates the occurrence of each seabed habitat within the established
MPA network. This is evaluated by spatially joining the the revised broad habitat layer with the MPA layer in order to count the number of MPAs containing each broad habitat. As the MPAs established under different networks can overlap, the occurrence counts of overlapping MPAs containing a given revised broad habitat are removed from the total count replications in order to avoid over-estimation. The potential bias that remains inherent in this procedure is that, in some cases, the number of replicates could still be under-estimated. A specific manual check and correction is therefore carried out for all those situations where the results showed replication results that were close to the scenario targets.
CAVEATS: Replication of revised broad habitats across a bioregion is weak as revised broad
habitats could contain many potential features of conservation interest. Replication should be used to assess if enough replicates of biological features are protected within distinct subzones across a wide region in order to guarantee that protection distribution is widely dispersed across a given region. All three RSCs measure replication of features of conservation interest across smaller subareas of each regional sea. This works in synergy with representativity and connectivity. Since no consistent approach to detecting subareas (or ecoregions) exists across all regional seas and only broad habitat data is available, the present exercise can only measure the distribution of revised broad habitats under protection across the marine regions, thereby weakening the detection capacity for replication at a finer geographic level of subdivision and in term of features of conservation interest. Same caveats were identified in criterion 2.1.
RESULTS: Table showing the reached/not reached target for both scenarios (i.e. when more than one replication = scenario 1 is reached = indicated with R and a yellow cell; when at least 4 replicates = scenario 2 is reached = indicated with R and a green cell; less than 2 replicates = no target reached = indicated with NR within a red cell (table 5.5).
Table 5.5 indicates that most biogeographic regions/subregions are characterized by a high replication rate of infralittoral and circalittoral revised broad habitats. All infralittoral habitats reach one of the replication targets, the majority of which is reached with the highest replication target. A close target obtainment is observed for almost all circalittoral habitats with the exception of 3 habitats which do not reach either of the two targets. Attainment of replication target, for either target, drastically decreases in the deeper biological zones and is markedly low in the abyssal habitats.

38 Assessing Europe’s Marine Protected Area networks
Table 5.5 Replication of the revised broad habitats within each EU marine region (Green = more than 4 replicates; Yellow = 2 or 3 replicates; Red = less than 2 replicates; Grey = Revised broad habitat not present in the region / subregion)
MPA assessment area regions and subregions Ir Ic Is Im Imx Pos Cym Cr Cc Cs Cm Cmx Br Bc Bs Bm Bmx Ar Ac As Am Amx
Baltic Sea
Celtic Sea Greater North Sea incl. Kattegat and English Channel
Bay of Biscay and the Iberian Coast
Macaronesia
Western Mediterranean Sea Ionian Sea and Central Mediterranean Sea
Adriatic Sea
Aegean-Levantine Sea
Black Sea Habitat legend: I, C, B and A= infralittoral, circalittoral, bathyal, abyssal; r,c,s,m,mx =rock, coarse, sand, mud mixed sediments; Pos, Cy = Posidonia oceanica meadows, Cymodocea nodosa beds

Assessing Europe’s Marine Protected Area networks 39
CRITERIA 4.1-3: Proximity of infralittoral, circalittoral, bathyal and abyssal revised broad habitats contained in MPAs
INPUT SOURCE: MSFD region and subregion, MPA (N2K, CDDA and RSCs), EMODnet seabed habitat
map. ROUTINE: The revised broad-scale habitats present in the MPAs are selected. A point feature of
the boundaries of each dissolved polygon representing the revised habitat is created and used as input data in a cost distance with barriers analysis. This involves using a distance, set to half of each scenario target value. Since the proximity is evaluated only where 2 or more revised broad habitat sites occur, cost distance polygons containing only 1 feature are deleted from the generated layer. The latter layer, rapresents the connected zones and is used to select the revised habitats contained in MPAs which are considered as being connected (under the influence of polygon of the same revised habitat). The percentage of connected area for each revised broad habitat (%ch) is calculated using the following formula:
Where Sch is the cumulative connected surface for a specific protected revised broad habitat per marine region / subregion; Sb is the total surface of the revised broad habitat included in the MPA network at region / subregion level; n is the number of connected zones per marine region / subregion containing revised habitat in MPAs that are connected according to the specific scenario.
The denominator of the formula was identified after several test trials on the data. It
allows to take into account the number of gaps observed when applying each connectivity target. The introduced weighting factor (25) was formulated because it allows, in cases of 10 or more gaps, to reduce the connected surface by about 25% the original value. The emphasis on 10 gaps represents the conceptual tolerated limit of gaps in the network and stems from the OSPAR approach (2008). The 25% reduction obtained in situations where the number of gaps are potentially high reduces the connectivity value to a point below the application of the ≥75% threshold for proposed connectivity sufficiency.
TARGET: 25/50/100 km (target scenarios for infralittoral habitats); 50/100/250 km (for
circalittoral habitats); 100/250/500 km (for bathyal and abyssal habitats) CAVEATS: Caveat related to input data identified for criterion 2.1. Other caveats are related to
the methodological assumptions needed to estimate the percentage of connected areas (i.e. connectivity between sites which benefit from larval/species exchange is here interpreted as proximity between areas, sites cannot be selected on the basis of what is its protection goal, weighting factor due to gaps presence, etc). Examining spatial coverage, as opposed to actual protection of seabed habitat types, does not provide an accurate representation of the degree to which seabed habitat types are protected by MPAs.
RESULTS: Table showing the percentage of each connected revised habitat within MPAs
according to each target scenario in the different subregions (table 5.6). The cell

40 Assessing Europe’s Marine Protected Area networks
colours are used to express whether each resulting habitat connectivity target (three different target scenarios are provided for each habitat type and indicated with the codes S1-S3 referring to the target values defined in the target section above for each biological zone) has been reached based on the following threshold rule: ≥75% of habitat contained in MPAs is connected = target reached (green) <75% = target not reached (red) Histograms indicating the percentage of connected habitats within MPAs per region/subregion are also provided with visual indication on sufficiency according to the distance to threshold (figure 5.1 to 5.10).
The results of the proximity analysis of protected revised broad habitats, presented in table 5.6, indicates a general low attainment of the scenario targets in inshore habitats as opposed to offshore ones. Infralittoral habitats generally do not meet the proximity targets even when considering the widest proximity target (100 km) in most regions except the Adriatic Sea, the Aegean Levantine Sea and the Black Sea. Circalittoral habitats generally do not meet the first proximity target but do reach the targets generated in the two wider distance scenarios. On the other hand, proximity targets are reached for most of the deeper habitats. The proximity results have to be interpreted with caution and taking into due consideration: the target trends observed in the habitat representativity criterion assessment results, the physical factors that may play a role in the overall results as well as the proposed assessment methodology. In the infralittoral zone, where representativity assessments indicate a very high percentage of broad habitat cover, proximity values for all three distance scenarios are most often below target. This result may be influenced by: the fact that large surface areas of infralittoral habitats are protected, that the individual habitat distribution is composed of small patches distributed over large extenses, and the morphological complexity of the shoreline which can introduce physical barriers contributing to the identification of several groupings of protected habitat polygons (and consequent high number of gaps). In such conditions, despite a high protection effort for individual habitat coverage, the analysis methodology may paradoxically generate a lower proximity result between protected features. The assessment exercise allowed to define a formula for estimating the percentage of proximity reached by a protected revised broad habitat considering both protected connected habitats and the number of connected zones. Given the above mentioned factors, which are likely to influence the overall infralittoral habitat proximity results, it may be useful to consider the usage of more appropriate thresholds for tolerated connected zone gaps as well as the overall threshold values used to assess target attainment. Furthermore in the proximity analysis different parameters could be considered in the future, in this regards there are numerous examples of subregional or even national approaches to the assessment of MPA network connectivity that can help set the aspirations for more sophisticated and ecologically meaningful assessments into the future. For example, Johnsson et al. (2016) in a study of MPA network connectivity in the Kattegat region used population dynamics and oceanographic data to develop a biogeographic model that could be used to select optimal locations for a well-connected MPA network.
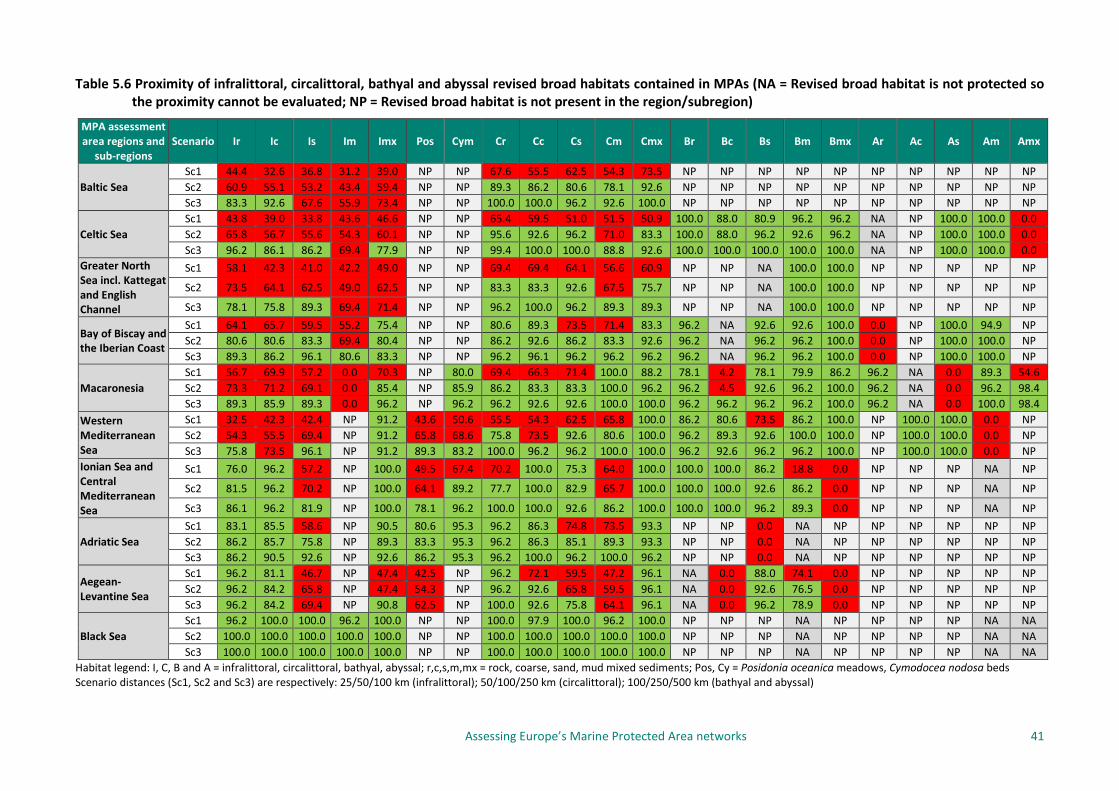
Assessing Europe’s Marine Protected Area networks 41
Table 5.6 Proximity of infralittoral, circalittoral, bathyal and abyssal revised broad habitats contained in MPAs (NA = Revised broad habitat is not protected so the proximity cannot be evaluated; NP = Revised broad habitat is not present in the region/subregion)
MPA assessment area regions and
sub-regions Scenario Ir Ic Is Im Imx Pos Cym Cr Cc Cs Cm Cmx Br Bc Bs Bm Bmx Ar Ac As Am Amx
Baltic Sea Sc1 44.4 32.6 36.8 31.2 39.0 NP NP 67.6 55.5 62.5 54.3 73.5 NP NP NP NP NP NP NP NP NP NP Sc2 60.9 55.1 53.2 43.4 59.4 NP NP 89.3 86.2 80.6 78.1 92.6 NP NP NP NP NP NP NP NP NP NP Sc3 83.3 92.6 67.6 55.9 73.4 NP NP 100.0 100.0 96.2 92.6 100.0 NP NP NP NP NP NP NP NP NP NP
Celtic Sea Sc1 43.8 39.0 33.8 43.6 46.6 NP NP 65.4 59.5 51.0 51.5 50.9 100.0 88.0 80.9 96.2 96.2 NA NP 100.0 100.0 0.0 Sc2 65.8 56.7 55.6 54.3 60.1 NP NP 95.6 92.6 96.2 71.0 83.3 100.0 88.0 96.2 92.6 96.2 NA NP 100.0 100.0 0.0 Sc3 96.2 86.1 86.2 69.4 77.9 NP NP 99.4 100.0 100.0 88.8 92.6 100.0 100.0 100.0 100.0 100.0 NA NP 100.0 100.0 0.0
Greater North Sea incl. Kattegat and English Channel
Sc1 58.1 42.3 41.0 42.2 49.0 NP NP 69.4 69.4 64.1 56.6 60.9 NP NP NA 100.0 100.0 NP NP NP NP NP
Sc2 73.5 64.1 62.5 49.0 62.5 NP NP 83.3 83.3 92.6 67.5 75.7 NP NP NA 100.0 100.0 NP NP NP NP NP
Sc3 78.1 75.8 89.3 69.4 71.4 NP NP 96.2 100.0 96.2 89.3 89.3 NP NP NA 100.0 100.0 NP NP NP NP NP
Bay of Biscay and the Iberian Coast
Sc1 64.1 65.7 59.5 55.2 75.4 NP NP 80.6 89.3 73.5 71.4 83.3 96.2 NA 92.6 92.6 100.0 0.0 NP 100.0 94.9 NP Sc2 80.6 80.6 83.3 69.4 80.4 NP NP 86.2 92.6 86.2 83.3 92.6 96.2 NA 96.2 96.2 100.0 0.0 NP 100.0 100.0 NP Sc3 89.3 86.2 96.1 80.6 83.3 NP NP 96.2 96.1 96.2 96.2 96.2 96.2 NA 96.2 96.2 100.0 0.0 NP 100.0 100.0 NP
Macaronesia Sc1 56.7 69.9 57.2 0.0 70.3 NP 80.0 69.4 66.3 71.4 100.0 88.2 78.1 4.2 78.1 79.9 86.2 96.2 NA 0.0 89.3 54.6 Sc2 73.3 71.2 69.1 0.0 85.4 NP 85.9 86.2 83.3 83.3 100.0 96.2 96.2 4.5 92.6 96.2 100.0 96.2 NA 0.0 96.2 98.4 Sc3 89.3 85.9 89.3 0.0 96.2 NP 96.2 96.2 92.6 92.6 100.0 100.0 96.2 96.2 96.2 96.2 100.0 96.2 NA 0.0 100.0 98.4
Western Mediterranean Sea
Sc1 32.5 42.3 42.4 NP 91.2 43.6 50.6 55.5 54.3 62.5 65.8 100.0 86.2 80.6 73.5 86.2 100.0 NP 100.0 100.0 0.0 NP Sc2 54.3 55.5 69.4 NP 91.2 65.8 68.6 75.8 73.5 92.6 80.6 100.0 96.2 89.3 92.6 100.0 100.0 NP 100.0 100.0 0.0 NP Sc3 75.8 73.5 96.1 NP 91.2 89.3 83.2 100.0 96.2 96.2 100.0 100.0 96.2 92.6 96.2 96.2 100.0 NP 100.0 100.0 0.0 NP
Ionian Sea and Central Mediterranean Sea
Sc1 76.0 96.2 57.2 NP 100.0 49.5 67.4 70.2 100.0 75.3 64.0 100.0 100.0 100.0 86.2 18.8 0.0 NP NP NP NA NP
Sc2 81.5 96.2 70.2 NP 100.0 64.1 89.2 77.7 100.0 82.9 65.7 100.0 100.0 100.0 92.6 86.2 0.0 NP NP NP NA NP
Sc3 86.1 96.2 81.9 NP 100.0 78.1 96.2 100.0 100.0 92.6 86.2 100.0 100.0 100.0 96.2 89.3 0.0 NP NP NP NA NP
Adriatic Sea Sc1 83.1 85.5 58.6 NP 90.5 80.6 95.3 96.2 86.3 74.8 73.5 93.3 NP NP 0.0 NA NP NP NP NP NP NP Sc2 86.2 85.7 75.8 NP 89.3 83.3 95.3 96.2 86.3 85.1 89.3 93.3 NP NP 0.0 NA NP NP NP NP NP NP Sc3 86.2 90.5 92.6 NP 92.6 86.2 95.3 96.2 100.0 96.2 100.0 96.2 NP NP 0.0 NA NP NP NP NP NP NP
Aegean-Levantine Sea
Sc1 96.2 81.1 46.7 NP 47.4 42.5 NP 96.2 72.1 59.5 47.2 96.1 NA 0.0 88.0 74.1 0.0 NP NP NP NP NP Sc2 96.2 84.2 65.8 NP 47.4 54.3 NP 96.2 92.6 65.8 59.5 96.1 NA 0.0 92.6 76.5 0.0 NP NP NP NP NP Sc3 96.2 84.2 69.4 NP 90.8 62.5 NP 100.0 92.6 75.8 64.1 96.1 NA 0.0 96.2 78.9 0.0 NP NP NP NP NP
Black Sea Sc1 96.2 100.0 100.0 96.2 100.0 NP NP 100.0 97.9 100.0 96.2 100.0 NP NP NP NA NP NP NP NP NA NA Sc2 100.0 100.0 100.0 100.0 100.0 NP NP 100.0 100.0 100.0 100.0 100.0 NP NP NP NA NP NP NP NP NA NA Sc3 100.0 100.0 100.0 100.0 100.0 NP NP 100.0 100.0 100.0 100.0 100.0 NP NP NP NA NP NP NP NP NA NA
Habitat legend: I, C, B and A = infralittoral, circalittoral, bathyal, abyssal; r,c,s,m,mx = rock, coarse, sand, mud mixed sediments; Pos, Cy = Posidonia oceanica meadows, Cymodocea nodosa beds Scenario distances (Sc1, Sc2 and Sc3) are respectively: 25/50/100 km (infralittoral); 50/100/250 km (circalittoral); 100/250/500 km (bathyal and abyssal)
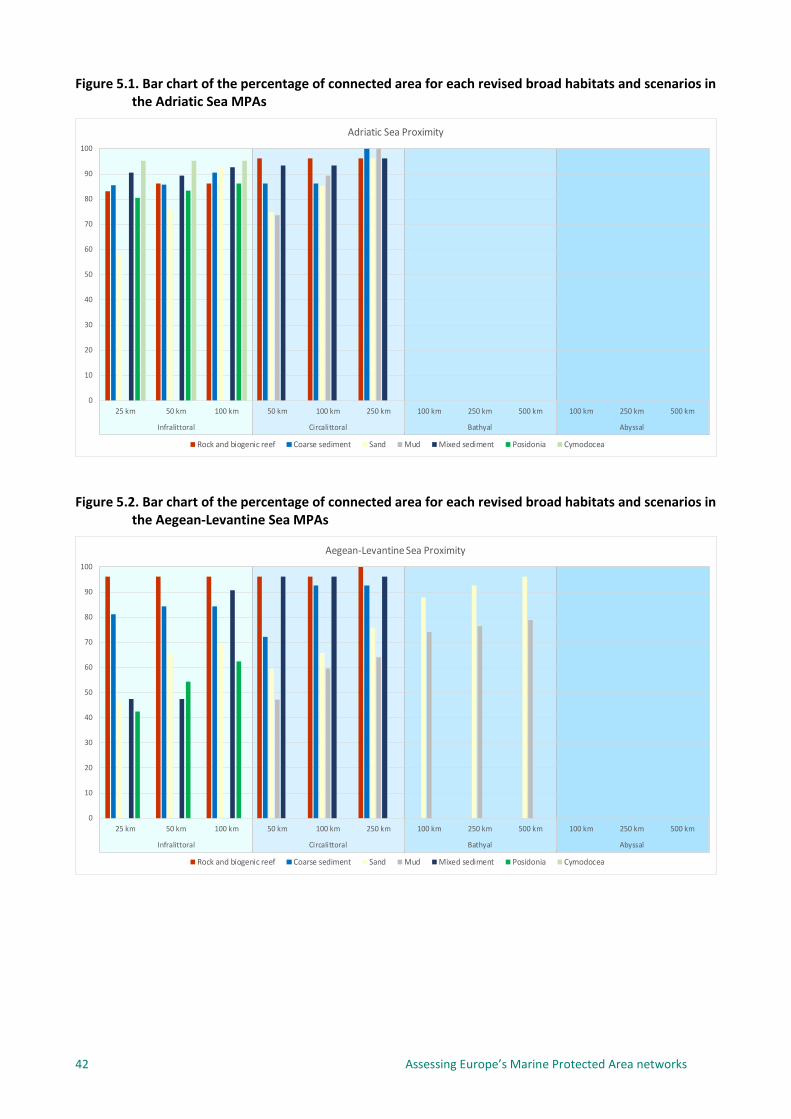
42 Assessing Europe’s Marine Protected Area networks
Figure 5.1. Bar chart of the percentage of connected area for each revised broad habitats and scenarios in the Adriatic Sea MPAs
0
10
20
30
40
50
60
70
80
90
100
25 km 50 km 100 km 50 km 100 km 250 km 100 km 250 km 500 km 100 km 250 km 500 km
Infralittoral Circalittoral Bathyal Abyssal
Adriatic Sea Proximity
Rock and biogenic reef Coarse sediment Sand Mud Mixed sediment Posidonia Cymodocea
Figure 5.2. Bar chart of the percentage of connected area for each revised broad habitats and scenarios in
the Aegean-Levantine Sea MPAs
0
10
20
30
40
50
60
70
80
90
100
25 km 50 km 100 km 50 km 100 km 250 km 100 km 250 km 500 km 100 km 250 km 500 km
Infralittoral Circalittoral Bathyal Abyssal
Aegean-Levantine Sea Proximity
Rock and biogenic reef Coarse sediment Sand Mud Mixed sediment Posidonia Cymodocea

Assessing Europe’s Marine Protected Area networks 43
Figure 5.3. Bar chart of the percentage of connected area for each revised broad habitats and scenarios in the Baltic Sea MPAs
0
10
20
30
40
50
60
70
80
90
100
25 km 50 km 100 km 50 km 100 km 250 km 100 km 250 km 500 km 100 km 250 km 500 km
Infralittoral Circalittoral Bathyal Abyssal
Baltic Sea Proximity
Rock and biogenic reef Coarse sediment Sand Mud Mixed sediment Posidonia Cymodocea Figure 5.4. Bar chart of the percentage of connected area for each revised broad habitats and scenarios in
the Bay of Biscay and the Iberian Coast MPAs
0
10
20
30
40
50
60
70
80
90
100
25 km 50 km 100 km 50 km 100 km 250 km 100 km 250 km 500 km 100 km 250 km 500 km
Infralittoral Circalittoral Bathyal Abyssal
Bay of Biscay and the Iberian Coast Proximity
Rock and biogenic reef Coarse sediment Sand Mud Mixed sediment Posidonia Cymodocea

44 Assessing Europe’s Marine Protected Area networks
Figure 5.5. Bar chart of the percentage of connected area for each revised broad habitats and scenarios in the Black Sea MPAs
0
10
20
30
40
50
60
70
80
90
100
25 km 50 km 100 km 50 km 100 km 250 km 100 km 250 km 500 km 100 km 250 km 500 km
Infralittoral Circalittoral Bathyal Abyssal
Black sea Proximity
Rock and biogenic reef Coarse sediment Sand Mud Mixed sediment Posidonia Cymodocea
Figure 5.6. Bar chart of the percentage of connected area for each revised broad habitats and scenarios in
the Celtic Sea MPAs
0
10
20
30
40
50
60
70
80
90
100
25 km 50 km 100 km 50 km 100 km 250 km 100 km 250 km 500 km 100 km 250 km 500 km
Infralittoral Circalittoral Bathyal Abyssal
Celtic sea Proximity
Rock and biogenic reef Coarse sediment Sand Mud Mixed sediment Posidonia Cymodocea

Assessing Europe’s Marine Protected Area networks 45
Figure 5.7. Bar chart of the percentage of connected area for each revised broad habitats and scenarios in the Greater North Sea incl. Kattegat and English Channel MPAs
0
10
20
30
40
50
60
70
80
90
100
25 km 50 km 100 km 50 km 100 km 250 km 100 km 250 km 500 km 100 km 250 km 500 km
Infralittoral Circalittoral Bathyal Abyssal
Greater North sea including tha Kattegat Channel Proximity
Rock and biogenic reef Coarse sediment Sand Mud Mixed sediment Posidonia Cymodocea Figure 5.8. Bar chart of the percentage of connected area for each revised broad habitats and scenarios in
the Ionian Sea and Central Mediterranean Sea MPAs
0
10
20
30
40
50
60
70
80
90
100
25 km 50 km 100 km 50 km 100 km 250 km 100 km 250 km 500 km 100 km 250 km 500 km
Infralittoral Circalittoral Bathyal Abyssal
Ionian and Central Mediterranean sea proximity
Rock and biogenic reef Coarse sediment Sand Mud Mixed sediment Posidonia Cymodocea

46 Assessing Europe’s Marine Protected Area networks
Figure 5.9. Bar chart of the percentage of connected area for each revised broad habitats and scenarios in the Macaronesia MPAs.
0
10
20
30
40
50
60
70
80
90
100
25 km 50 km 100 km 50 km 100 km 250 km 100 km 250 km 500 km 100 km 250 km 500 km
Infralittoral Circalittoral Bathyal Abyssal
Macaronesia proximity
Rock and biogenic reef Coarse sediment Sand Mud Mixed sediment Posidonia Cymodocea Figure 5.10. Bar chart of the percentage of connected area for each revised broad habitats and scenarios
in the Western Mediterranean Sea MPAs.
0
10
20
30
40
50
60
70
80
90
100
25 km 50 km 100 km 50 km 100 km 250 km 100 km 250 km 500 km 100 km 250 km 500 km
Infralittoral Circalittoral Bathyal Abyssal
Western Mediterranean sea proximity
Rock and biogenic reef Coarse sediment Sand Mud Mixed sediment Posidonia Cymodocea CRITERION 5: MPA size INPUT SOURCE: EU marine regions, designated MPAs in Europe (N2K, CDDA, RSCs) ROUTINE: The size values are calculated by considering the surface area extents of all sites
present in each marine region and subregion (sensu MSFD). The marine surface areas are obtained by measuring the extent of all sites regardless of the presence of overlap (both partial and complete) with other polygons belonging to other sites. This means

Assessing Europe’s Marine Protected Area networks 47
that the resulting values include the evaluation of surface area extent of MPAs that may be totally or partially juxtaposed to other MPAs. The procedure is run in ArcGIS using an automated sequence of commands managed by a specifically designed python script (Adequacy_size.py). The script allows the batch extractions from the spatial sub-regional geodatabases containing the marine site layers of the number of sites belonging to the following size classes:
• CLASS1 < 5 km2
• CLASS2 ≥= 5 – < 30 km2
• CLASS3 ≥= 30 – < 100 km2
• CLASS4 ≥= 100 km2 CAVEATS: A high number of small MPAs may result due to cartographic errors (i.e. a shift caused
by wrong projection, poor shoreline data, poor datum definition). This is likely for CDDA sites which were selected only through spatial database query. Small polygons that introduce bias may be present for marine SPAs (selected on the basis of N02 and N03 habitat classes) which are coastal but result as marine due to the above shifts.
RESULTS: A table where the number of MPAs per class size is reported for each EU marine
region. This table also provides the percentage of MPAs ≥5 and ≥30 km2. The threshold rule to measure adequacy is based on the assumption that target is reached when ≥75% of sites are larger than the two proposed targets: 5km2 and 30 km2 for any given region / sub-region (table 5.7). An area frequency distribution histogram and pie chart indicating size class distribution per marine region is also provided (figure 5.11).
Both table 5.7 and figure 5.11 clearly highlight the predominance of small MPAs in every regions/subregion. The application of the ≥75% of ≥5 km2 MPA rule does not indicate an adequate MPA size distribution in any region. The histograms in figure 5.11 indicate a general decreasing size trend from class1 to class3. In most regions there is a marginally higher total number of class 4 MPA size. The only exception to this trend appears to be in the Adriatic Sea and Aegean-Levantine sea subregions where class 4 MPAs are fewer than class 3. Table 5.7 Number of sites belonging to each size class per European regional seas/sub-regions and
percentage of sites at threshold
European regional seas and sub-regions (sensu MSFD)
N° of sites in size Class1 (≤ 5 km2)
N° of sites in size Class2 (5–30 km2)
N° of sites in size Class3
(30–100 km2)
N° of sites in size Class4 (≥ 100 km2)
% Sites ≤ 5 km2
% Sites ≥ 5km2
% Sites ≥ 30km2
Baltic Sea 2320 372 148 210 76.1 23.9 11.7 Celtic Seas 721 213 123 137 60.4 39.6 21.8
Greater North Sea, incl. the Kattegat and the English
Channel 969 206 143 216 63.2 36.8 23.4
Bay of Biscay and the Iberian Coast 154 74 49 57 46.1 53.9 31.7
Macaronesia 89 35 16 23 54.6 45.4 23.9 Mediterranean Sea 21.8
Western Mediterranean Sea 421 145 73 85 58.1 41.9 13.9 Ionian Sea and the Central
Mediterranean Sea 196 40 19 19 71.5 28.5 12.6
Adriatic Sea 149 25 14 11 74.9 25.1 20.8 Aegean-Levantine Sea 129 46 35 11 58.4 41.6 25.8
Black Sea 25 21 7 9 40.3 59.7 11.7

48 Assessing Europe’s Marine Protected Area networks
Figure 5.11. Area-frequency distribution of MPAs by european regional seas and subregion
0
50
100
150
200
250
< 5 > =5 - < 30 >= 30 - < 100 >= 100
Num
ber o
f MPA
s
Area (Km2)
Ionian Sea and the Central Mediterranean Sea
Ionian Sea and the Central Mediterranean Sea
< 5
> =5 - < 30
>= 30 - < 100
>= 100
0
500
1000
1500
2000
2500
< 5 > =5 - < 30 >= 30 - < 100 >= 100
Num
ber o
f MPA
s
Area (Km2)
Baltic Sea
Baltic Sea
< 5
> =5 - < 30
>= 30 - < 100
>= 100
0
20
40
60
80
100
120
140
< 5 > =5 - < 30 >= 30 - < 100 >= 100
Num
ber o
f MPA
s
Area (Km2)
Aegean-Levantine Sea
Aegean-Levantine Sea
< 5
> =5 - < 30
>= 30 - < 100
>= 100
0
20
40
60
80
100
120
140
160
180
< 5 > =5 - < 30 >= 30 - < 100 >= 100
Num
ber o
f MPA
s
Area (Km2)
Bay of Biscay and the Iberian Coast
Bay of Biscay and the Iberian Coast
< 5
> =5 - < 30
>= 30 - < 100
>= 100
0
5
10
15
20
25
30
< 5 > =5 - < 30 >= 30 - < 100 >= 100
Num
ber o
f MPA
s
Area (Km2)
Black Sea
Black Sea
< 5
> =5 - < 30
>= 30 - < 100
>= 100
0
100
200
300
400
500
600
700
800
< 5 > =5 - < 30 >= 30 - < 100 >= 100
Num
ber o
f MPA
s
Area (Km2)
Celtic Seas
Celtic Seas
< 5
> =5 - < 30
>= 30 - < 100
>= 100
0
200
400
600
800
1000
1200
< 5 > =5 - < 30 >= 30 - < 100 >= 100
Num
ber o
f MPA
s
Area (Km2)
Greater North Sea, incl. the Kattegat and the English Channel
Greater North Sea, incl. the Kattegat and the English Channel
< 5
> =5 - < 30
>= 30 - < 100
>= 100
0
20
40
60
80
100
120
140
160
< 5 > =5 - < 30 >= 30 - < 100 >= 100
Num
ber o
f MPA
s
Area (Km2)
Adriatic Sea
Adriatic Sea
< 5
> =5 - < 30
>= 30 - < 100
>= 100
0
10
20
30
40
50
60
70
80
90
100
< 5 > =5 - < 30 >= 30 - < 100 >= 100
Num
ber o
f MPA
s
Area (Km2)
Macaronesia
Macaronesia
< 5
> =5 - < 30
>= 30 - < 100
>= 100
0
50
100
150
200
250
300
350
400
450
< 5 > =5 - < 30 >= 30 - < 100 >= 100
Num
ber o
f MPA
s
Area (Km2)
Western Mediterranean Sea
Western Mediterranean Sea
< 5
> =5 - < 30
>= 30 - < 100
>= 100

Assessing Europe’s Marine Protected Area networks 49
5.3 Tier 3 – Case studies indicating further improvement to MPA network assessments CRITERION 6.1: Percentage coverage of the revised broad habitats within marine N2K sites selected for
seabottom habitat protection in each EU marine region compared to coverage against all marine N2K sites.
INPUT SOURCE: EU Marine Regions, EMODnet seabed habitat, marine N2K sites. ROUTINE: Marine N2K sites are screened to exclude all those marine N2K sites whose tabular
data indicate that they only protect species (i.e. all SPAs, all SCIs/SACs selected only for marine species). The procedure requires the evaluation of the percentage of each revised broad habitat occurring within the filtered N2K sites as well as the entire marine N2k database. Revised broad habitat classes are generated from EMODnet seabed habitat layer (see par 4.1.2). Each of the two N2K site layers (screened versus not screened) is intersected with the habitat layer in order to compute percentage habitat in each of the two layers.
CAVEATS: Substrate and habitat maps are not available for some areas of some Atlantic EU
Marine Regions (see map 3.2). The broadscale modelled map has a 250 m pixel resolution so coverage of small-scale
or patchy habitats (i.e. infralittoral hard bottoms) will likely be under-represented. MPA coverage of these habitat types could be underestimated or not picked up at all. Littoral habitats have a small extension and are not represented in broad scale habitat maps so representativity of habitats occurring in this depth zone is excluded from analysis.
RESULTS: A table describing the % of each revised broad habitat type included in the N2K
network established for marine habitats compared to that obtained with the overall N2K network, per EU marine region. Colour denotes whether target reached (≥20%) or not reached (<20%) (Posidonia = 60%) (table 5.8) .
The comparison between the representativity values calculated using the complete N2K marine site dataset and the N2K sites selected for the presence of marine habitats are similar in terms of target attainment for most revised broad habitat. This is due to the relatively small percentage differences obtained at single revised broad habitat surface area level. Selection of N2K sites for marine habitats results in 3 more infralittoral and 3 circalittoral habitats not attaining the 20% target coverage and for 1 Posidonia habitat not attaining the 60% coverage. In these cases the non attainment of the target is driven by the fact that the complete N2K site habitat coverage is very close to the 20% target to begin with and drops below target once the query is carried out.

50 Assessing Europe’s Marine Protected Area networks
Table 5.8 Percentage coverage of the revised broad habitats within each EU marine region in: a) all marine N2K sites and b) marine N2K sites established for marine habitats (NP = Revised Broad habitat is not present in the region/subregion)
a) MPA assessment area regions and subregions Ir Ic Is Im Imx Pos Cym Cr Cc Cs Cm Cmx Br Bc Ms Bm Bmx Ar Ac As Am Amx Baltic Sea 18.5 43.8 59.1 32.3 25.5 NP NP 13.1 19.0 22.9 3.7 5.7 NP NP NP NP NP NP NP NP NP NP North-East Atlantic Ocean (inside 200 NM) 31.9 52.5 67.3 55.2 45.5 NP 53.7 14.9 9.7 9.8 5.1 14.5 9.4 12.2 5.6 2.2 2.6 0.0 0.0 0.8 0.1 0.0 Celtic Sea 21.2 31.7 62.5 56.7 30.8 NP NP 12.6 3.2 2.4 2.3 3.1 26.4 13.5 7.4 3.5 4.4 0.0 NP 17.6 0.0 1.1 Greater North Sea incl. Kattegat and English Channel 53.5 62.2 76.7 54.4 56.5 NP NP 39.3 17.4 13.5 6.0 15.8 NP NP 0.0 41.7 39.6 NP NP NP NP NP
Bay of Biscay and the Iberian Coast 44.6 40.8 37.3 56.7 14.1 NP NP 13.3 28.7 10.4 7.8 22.3 17.9 0.0 6.9 6.4 0.6 0.2 NP 0.6 0.8 NP Macaronesia 14.2 33.7 17.8 23.3 2.7 NP 53.7 8.2 9.4 3.0 38.5 2.4 0.5 0.4 0.1 0.0 0.1 0.0 0.0 0.0 0.0 0.0 Mediterranean Sea 33.0 24.6 18.5 NP 17.3 52.7 9.6 11.7 24.0 5.8 3.2 2.8 2.4 3.1 8.5 0.6 0.1 NP 0.0 0.0 0.0 NP Western Mediterranean Sea 47.4 34.0 36.4 NP 77.2 50.8 9.3 11.7 27.4 12.0 6.2 34.9 4.0 4.4 6.9 0.9 0.9 NP 0.0 0.0 0.0 NP Ionian Sea and Central Mediterranean Sea 24.1 38.9 24.5 NP 55.3 50.2 19.2 3.6 26.4 3.3 3.1 1.8 0.1 3.5 4.4 0.1 0.0 NP NP NP 0.0 NP Adriatic Sea 18.1 0.1 4.0 NP 9.6 64.4 1.6 26.4 0.0 0.5 0.6 0.2 NP NP 7.7 0.0 NP NP NP NP NP NP Aegean-Levantine Sea 2.5 5.0 10.3 NP 1.0 76.3 NP 1.1 3.3 4.5 3.5 3.2 0.0 0.0 19.0 0.7 3.2 NP NP NP NP NP Black Sea 59.9 76.6 83.8 57.1 68.0 NP NP 64.8 9.9 2.1 5.5 1.2 NP NP NP 0.0 NP NP NP NP 0.0 0.0 Total 28.0 45.6 51.6 38.9 27.5 52.7 11.9 14.5 10.5 9.8 4.2 7.3 7.7 11.5 6.5 1.2 2.3 0.0 0.0 0.7 0.0 0.0 b) MPA assessment area regions and subregions Ir Ic Is Im Imx Pos Cym Cr Cc Cs Cm Cmx Br Bc Ms Bm Bmx Ar Ac As Am Amx Baltic Sea 17.6 36.5 50.5 29.7 19.4 NP NP 11.6 13.8 15.4 2.8 4.3 NP NP NP NP NP NP NP NP NP NP North-East Atlantic Ocean (inside 200 NM) 27.7 49.0 56.1 41.8 28.7 NP 53.7 12.7 7.4 8.5 3.9 7.9 9.4 12.2 4.1 2.0 2.6 0.0 0.0 0.2 0.0 0.0 Celtic Sea 16.7 23.9 48.2 44.6 28.6 NP NP 10.9 2.8 1.7 1.6 2.9 26.4 13.5 7.4 3.5 4.4 0.0 NP 17.6 0.0 1.1 Greater North Sea incl. Kattegat and English Channel 48.0 59.1 64.0 37.0 33.0 NP NP 36.6 13.8 12.4 5.3 12.6 NP NP 0.0 41.7 39.6 NP NP NP NP NP
Bay of Biscay and the Iberian Coast 40.7 38.5 33.1 52.4 14.0 NP NP 10.4 13.5 6.0 4.8 6.5 17.9 0.0 3.2 2.5 0.6 0.2 NP 0.0 0.0 NP Macaronesia 11.9 33.3 16.9 15.5 2.7 NP 53.7 8.1 9.4 2.8 38.5 2.4 0.5 0.4 0.1 0.0 0.1 0.0 0.0 0.0 0.0 0.0 Mediterranean Sea 31.3 24.3 17.2 NP 17.3 52.4 9.6 11.3 21.4 5.4 2.1 2.8 2.4 2.8 8.5 0.6 0.1 NP 0.0 0.0 0.0 NP Western Mediterranean Sea 45.0 33.7 33.9 NP 77.2 50.8 9.2 11.4 24.4 11.0 3.4 34.9 4.0 3.9 6.9 0.9 0.9 NP 0.0 0.0 0.0 NP Ionian Sea and Central Mediterranean Sea 24.1 38.9 24.0 NP 55.3 50.2 19.2 3.6 26.4 3.3 3.1 1.8 0.1 3.5 4.4 0.1 0.0 NP NP NP 0.0 NP Adriatic Sea 15.8 0.1 3.0 NP 9.6 56.5 1.6 24.5 0.0 0.4 0.6 0.2 NP NP 0.0 0.0 NP NP NP NP NP NP Aegean-Levantine Sea 2.5 5.0 9.6 NP 1.0 76.3 NP 1.1 3.3 3.9 3.2 3.2 0.0 0.0 18.7 0.7 3.2 NP NP NP NP NP Black Sea 34.4 36.7 61.6 52.1 30.9 NP NP 27.9 2.6 1.2 5.0 0.3 NP NP NP 0.0 NP NP NP NP 0.0 0.0 Total 25.0 40.5 43.7 33.5 20.3 52.4 11.9 12.5 8.0 8.3 3.2 4.9 7.7 11.5 5.4 1.1 2.3 0.0 0.0 0.2 0.0 0.0 (Habitat legend: I, C, B and A= infralittoral, circalittoral, bathyal, abyssal; r,c,s,m,mx =rock, coarse, sand, mud mixed sediments; Pos, Cy = Posidonia oceanica meadows, Cymodocea nodosa beds).

Assessing Europe’s Marine Protected Area networks 51
CRITERION 6.2: Percentage coverage of the revised broad habitats within all MPAs established for seabottom habitat protection in the western Mediterranean sea region.
INPUT SOURCE: EU Marine Regions, EMODnet seabed habitat, western Mediterranean MPAs (N2K,
CDDA, RSC sites) ROUTINE: All western Mediterranean MPAs are screened so as to retain only those sites whose
establishment objectives / management measures involve seabed habitat conservation. This implies screening all CDDA and SPAMI sites on a one to one basis and researching their establishment / management statute through a websearch so as to retain all those that involve seabed habitat protection. The N2K sites screened for criterion 6.1 and lying in the western Mediterranean are also considered. The screened CDDA, SPAMI and SCIs are considered as a distinct layer. The percentage of each revised broad habitat occurring within the latter layer is computed so as to obtain a revised broad habitat representativity assessment with higher confidence. The result of the assessment is compared against the one obtained in criterion 2.1.
CAVEATS: The broadscale modelled map has a 250 m pixel resolution so coverage of small-scale
or patchy habitats (i.e. infralittoral hard bottoms) will likely be under-represented. MPA coverage of these habitat types could be underestimated or not picked up at all. Littoral habitats have a small extension and are not represented in broad scale habitat maps so representativity of habitats occurring in this depth zone is excluded from analysis.
RESULTS: A table describing the % coverage of each revised broad habitat type included both in
all the MPAs and in the MPA network established for seabed habitats. Cell colour of each assessed habitat denotes whether target reached (≥20%) or not reached (<20%) (Posidonia = 60%) (table 5.9)

52 Assessing Europe’s Marine Protected Area networks
Table 5.9 Percentage coverage of the revised broad habitats in: a) all Western Mediterranean Sea MPAs and b) Western Mediterranean Sea MPAs established for marine habitats
Revised broad habitats % coverage in all MPAs % coverage in MPAs for marine habitats
Infralittoral rock 57,16 48,16
Infralittoral coarse sediment 53,43 34,52
Infralittoral sand 51,12 35,46
Infralittoral mud NP NP
Infralittoral mixed sediment 77,17 77,17
Posidonia beds 62,82 51,45
Cymodocea beds 29,63 9,35
Circalittoral rock and biogenic reef 21,33 12,21
Circalittoral coarse sediment 48,70 28,54
Circalittoral sand 24,08 12,58
Circalittoral mud 31,98 8,41
Circalittoral mixed sediment 34,85 34,85
Bathyal rock 5,67 4,10
Bathyal coarse 87,52 6,47
Bathyal sand 36,46 7,02
Bathyal mud 14,19 1,16
Bathyal mixed sediment 0,94 0,94
Abyssal rock NP NP
Abyssal coarse 87,52 6,47
Abyssal sand 42,39 0,00
Abyssal mud 5,16 0,00
Abyssal mixed sediment NP NP Screening of the overall western Mediterranean MPAs in order to assess revised broad habitat coverage within the network only when MPAs are established for the purpose of seabed habitat conservation reveals that the obtained habitat percentage cover is almost always much lower than that obtained when analyzing all MPAs, regardless of their seabed protection objectives. In the latter case only 31% of revised broad habitats do not reach the optimal representativity target in the western Mediterranean. However, when assessing only MPAs whose mandates or management contain seabed habitat conservation measures, the percentage of revised broad habitats included in the networks that do not reach the target increase more than twofold (68%). This substantial difference evidences the importance that assessments be made on MPA subsets adequately screened with respect to the assessment questions that are being raised. In the case of the western Mediterranean sea, absence of data fields containing specific protection objective information in the CDDA database, and lack of a centralized tabular SPAMI database, required additional investigations to be carried out through a websearch so as to screen each MPA on a one to one basis, thus revealing the need for future work on MPA database improvement. A word of caution should also be placed on the actual surface area present within the MPA boundaries that actually benefits from seabed protection measures. In cases in which MPAs are characterized by multiple zonation schemes, only a portion of the MPAs surface area may actually lie under specific management regime. An accurate seabed habitat representativity assessment is possible only if the MPA databases (tabular and spatial) allow to identify which portion(s) of the MPA polygon(s) is/are subjected to specific measures.

Assessing Europe’s Marine Protected Area networks 53
CRITERION 7.1: Percentage of N2K sites older than 10 years versus the percentage of sites with management plans INPUT SOURCE: EU Marine Regions, Natura 2000 sites and tabular data. ROUTINE: The N2K database reported at the end of 2015 is queried and marine sites are
extrapolated as illustrated in the procedure reported by EEA (2015b). Tabular information on year of site establishment is queried in order to sort Natura 2000 sites and to compute the percentage of marine sites older than 10 years (date of establishment prior to 31/12/2005) as opposed to sites established during the last 10 years for every given biogeographic region. Further queries are made concerning the reported existence of a management plan.
The procedure is run in ArcGIS using an automated sequence of commands managed by a specifically designed process using model builder. In this procedure the marine sites are joined using the site code with the table “Natura2000sites” in order to extract the information about site age and with the table “management” for collecting the information concerning the existence of management plans. The methodology to define site age is the same as that used in the ETC/ICM deliverable on MPA hindcasting (ETC /ICM, 2014). This procedure assigns the age of each site by considering on first instance the values contained in the tabular datafields “Date_Prop_SCI” and “Date_SPA”. In cases where these fields are both empty, the value reported in “Date_Compilation” is considered. The presence of a management plan is assessed for each site by considering the presence of information in the following fields: Manag_Status; Manag_Plan_URL and Manag_plan. One aspect to mention is that datafield “Manag_status” allows for the following options: Y (presence of management), N (absence of management) or P (management in preparation) but also “-“. In this latter case, if the associated field “Manag_Plan_URL” was filled, it was assumed that a management plan is active, if not, it was assumed that the site is not managed. The resulting query results are joined in a unique summary table. This table contains, per each subregion, the total number of sites, the number of sites where a management plan is established, and the number of sites without management plan. The table also divides the sites according to the MPA age threshold (≥ or < 10 years since site establishment). The data is analysed so as to first define the percentage of sites older and younger than 10 years. Sites are also considered in terms of percentage of sites with: a management plan, a management plan in preparation, with no management plan or for which no data was reported. This is analysed for all the marine sites irrespective of their age (date of establishment) and also for sites older and younger than the 10 year old threshold.
CAVEATS: This criterion is affected by many biases, first of all the year of establishment is a very
indirect way of measuring management efficacy, furthermore the information of date of establishment is not present in all the datasets. Another caveat could be introduced in cases where no dates pertaining to site establishment are recorded. This condition could be estimated in N2K through the percentage of use of the “date_compilation” field, whereas in CDDA by the frequency of empty YEAR field.
RESULTS: Histograms indicating the proportion of MPAs older and younger than 10 years.
(figures 5.12 and 5.13).

54 Assessing Europe’s Marine Protected Area networks
Figure 5.12 Percentage of marine Natura 2000 sites older and younger than 10 years per biogeographic region and on the overall

Assessing Europe’s Marine Protected Area networks 55
Figure 5.13 Inferring MPA effectiveness through MPA age versus information on the existence of site management plans
Figure 5.12 indicates that most biogeographic regions are characterized by a high percentage (over 70%) of marine N2K sites older than 10 years. Therefore if the 10 year age threshold is considered for inferring management effectiveness, based on the assumption that old sites have operative management plans/measures, then one could assume that most biogeograpic regions have an effective management scheme which will guarantee that conservation objectives are met. The only exceptions would appear to be

56 Assessing Europe’s Marine Protected Area networks
the regions hosting countries for which the Habitats Directive has recently come into force, such as the Black Sea or the Adriatic Sea where most sites are inevitably below the 10 year threshold. Figure 5.13 indicates that the biogeographic regions with marine N2K sites with highest percentage of management plans that are existing / in preparation are the Baltic (70% of sites) followed by the Ionian-Central Mediterranean, Macaronesia and Western Mediterranean (50% or more). The Adriatic and Celtic sea are the biogeographic regions with the lowest percentage of sites with management plans. This is not surprising for the Adriatic as the recent accession of Croatia into the EU and recent establishment of marine N2K sites influences this scenario. If one compares the percentage of overall N2K sites with management plans / in preparation against the percentages of N2K sites older than 10 years that have management plans, one notices that the percentage values for these two categories are oftentimes not markedly different within some biogeographic regions. This implies that in these regions most management plans are established several years (and possibly well beyond 10 years) after site establishment and management plans very seldom are put in place for sites younger than 10 years. While the Baltic, North Sea and Ionian sea are the regions with highest percentage of sites older than 10 years (more than 90% of sites are older than 10 years), only 70% of Baltic sites have management plans / in preparation and only 50% of North Sea and Ionian – Central Mediterranean sites have management plans. In the Celtic sea more than 80% of sites are older than 10 years but less than 10% of these older sites have management measures / plans in place. On the overall these figures indicate that if the 10 year age threshold is considered as a proxy of MPA effectiveness, intended as high likelihood of a management plan being in place, evidence shows that the likelihood of a region having at least 75% of older sites with management plans in place is not met. It must be noted that a rapid test was conducted on the same dataset by considering as age threshold 20 years and analyzing the resulting percentage of sites characterized by the presence of management plans. In this scenario, despite the duplication of the age threshold, the detected increase in management plan existence / in preparation was marginal. Given the variety of legal interpretations over the obligation to implement site management measures pursuant to Natura 2000 site establishment, it appears doubtful that inferences can be made concerning management plan implementation if one were to consider only MPA age. This suggests that the site age cannot be used as proxy for the evaluation of the management effectiveness. Another aspect worthy of notice lies in the number of observed No Data records (“Null” values in the N2K database) in the management plan database fields in some regions (i.e. Adriatic, Baltic, North Sea). The “null” values represent about 10% of the sites and they occur mainly in the Adriatic sea (this is due to the Croatian sites that have been recently been established). This indicates that, at present, Member States have the option to decline reporting information on the existence of site management plans, by leaving the data field blank. This aspect should be further investigated and object of discussion at policy implementation consideration level so that data reporting on this subject become mandatory. One of the principal benefits of a reporting process and database management is the level of control that can be exerted over the reporting obligations. It is clear that information on the existence of site specific management plans is the first step towards attempting to understand whether MPA networks are actually functioning to potentially deliver their conservation benefits. It would therefore seem wise to foresee that compilation of the N2K datafields concerning this aspect be fully completed with no derogation allowing for “no data” records in order to fully understand the potential management capacity that the network has. Other problems in database compilation were detected during data processing for management plan existence. Numerous Swedish sites report the replicated name of the actual site in the fields “Manag_Plan” which clearly indicates a reporting error. This type of inaccuracy can prevent the correct elaboration of the data and as such attention on how to improve the QA/QC of the reporting to avoid such errors would be beneficial.

Assessing Europe’s Marine Protected Area networks 57
The above exercise is directed at N2K sites in order to ascertain the degree to which N2K sites can be considered to be under the influence of management schemes and therefore on the road to MPA conservation effectiveness. No analogous assessment can at present be run on RSC and CDDA marine sites as datafields involving the existence of site management plans do not exist in the respective databases. Future efforts at adapting existing MPA databases so as to contain such datafields would allow to describe the overall network capacity to strive towards MPA management effectiveness. The above illustrated Tier 3 assessment centered on ascertaining the degree to which N2K sites can be considered to be under the influence of management schemes and therefore on the road to MPA conservation effectiveness. However it would be optimal to improve the overall MPA database reporting so as to assess other aspects relating to the implementation of adequate conservation measures, on the existence of monitoring schemes capable of detecting whether MPAs are effectively delivering with resulting improved conservation statuses of their protected features. Some RSCs have begun assessing these specific aspects. In 2016, OSPAR undertook an exercise to collate information on the degree to which OSPAR MPAs may be considered to be ‘well-managed’(OSPAR, 2017). Whilst there is no formal agreement on what constitutes ‘well managed’ in terms of an MPA – a questionnaire was developed that poses four key questions that reflect progress around the implementation cycle of an MPA:
• A – Is MPA management documented? This question explores whether information concerning the management of an OSPAR MPA has been published. Management in this context is interpreted as conservation objectives for protected features, documented known pressures and threats that could affect protected features, a list of management actions that may need to be undertaken to address known pressures and threats, and finally spatial information on the distribution of protected features within a given OSPAR MPA.
• B – Are measures to achieve conservation objectives being implemented? This question explores whether specific management actions have been identified and put into place by site managers to address known pressures and threats by a legal mechanism or other effective means.
• C – Is monitoring in place to assess if measures are working? This question explores whether specific monitoring focussed on the ecological status of protected features of OSPAR MPAs has taken place, or as a minimum a means of monitoring the compliance of site users with implemented measures.
• D – Is the MPA moving towards or has it reached its conservation objectives? This question explores whether information collected on the ecological status of the protected features of OSPAR MPAs support the achievement, or movement towards achieving, a sites conservation objectives.
As part of the data collection exercise, Contracting Parties were asked to answer each question with a Yes, Partially, No or Unknown response and to provide brief additional information that help justifies the response for each of their OSPAR MPAs. 80% of OSPAR MPAs were reported against in the 2016 data call. A summary of the results are provided in figure 5.14 below.

58 Assessing Europe’s Marine Protected Area networks
Figure 5.14 Results of the assessment of OSPAR MPA management effectiveness (From OSPAR, 2017).
Figure 5.14 shows that nearly two-thirds of the OSPAR MPA network has full management information in place that is publicly documented, with a further 16% of OSPAR MPAs having partial management information in place which is publicly documented. The latter is largely due to conservation objective updates taking place or because work is ongoing to identify the management actions that may be required to address the known pressures and threats to the protected features of OSPAR MPAs. Figure 5.14 also indicates that whilst there is progress on taking management action and implementing measures to achieve the conservation objectives of the protected features of OSPAR MPAs, such actions are largely only partially completed across the OSPAR Maritime Area; a similar picture emerged concerning the implementation of monitoring studies for OSPAR MPAs. Consequently, the predominant response to whether OSPAR MPAs are moving towards achieving their conservation objectives is ‘unknown’ because site-specific data on the ecological status of the protected features of OSPAR MPAs are not available. Work moving forward should focus on the implementation of all management measures that Contracting Parties feel are required to achieve the conservation objectives of the protected features of OSPAR MPAs. In parallel, long-term monitoring studies should also be established to evaluate the effectiveness of such management measures in order to state with greater confidence whether the conservation objectives of the protected features of OSPAR MPAs have been achieved. Finally, work should progress on improving methods of evaluating the degree to which the OSPAR MPA network is well-managed to support a more sophisticated assessment that can be fed into the OSPAR Quality Status Report. This should build on sound ecological data to determine whether or not the OSPAR MPA network is delivering a genuine conservation benefit to targeted habitats, species and ecological processes. The type of approach adopted by OSPAR is a simple yet effective mechanism by which information on MPA management might accumulated for the purposes of considering EU-level management effectiveness; at least as a starting point. It would therefore seem appropriate to review all the MPA database reporting procedures so as to comprehend future data reporting mechanisms that involve management effectiveness information by drawing on the OSPAR experience in assessing management effectiveness.

Assessing Europe’s Marine Protected Area networks 59
6 Options for presenting the outputs of an assessment of EU MPA networks The proposed methodological framework for the assessment of EU MPA networks as presented in table 4.1 is presented in a hierarchical structure with specific criteria under each network principle. Given that a significant number of outputs are generated as a result of applying the proposed assessment framework (as highlighted in Section 5), it would be sensible to consider existing practice in presenting integrated assessments of MPA networks which are applicable at an EU level. More specifically, the assessment outputs related to Tier 1 evaluations provide a single result for each unit assessed under each criterion, thereby calling for an approach that integrates the results. 6.1 Introduction to integrated assessments Experience from integrated assessment tools has shown that fairly simple integration methods can give robust assessment results (Andersen et al. 2015a, b). For instance, the HELCOM integrated assessments of eutrophication, biodiversity and hazardous substances were based on assessment tools which integrated quantitative indicators and the associated thresholds for desired status (HELCOM 2009, 2010 c, d). A recent study showed that the integrated biodiversity status was highly correlated with the anthropogenic pressures in the Baltic Sea sub-basins (Andersen et al. 2015 a). In another recent study, the integrated eutrophication status of the Baltic Sea was calculated retrospectively for several decades and the status successfully correlated with the long-term changes in nutrient loads to the sea area (Andersen et al. 2015 b). In the past, integrated assessments have been accused of lacking transparency, producing single figures or outputs that may be misinterpreted if not accompanied by supporting background information. To overcome this, the ultimate objective would be to maximise transparency in the assessment outcome whilst at the same time being able to provide sufficient contextual information without the key messages of a given assessment being lost. In the remainder of this section, we draw on the experience of Deltares (2014) who explored the use of ‘scorecards’ as a means of presenting MPA network assessment ouputs in an EU context as part of their work. We present two alternatives respectively; a fully quantitative approach based on weighted criteria, and a semi-quantitative approach. It is important to emphasise of course that the final decision on how to present the outcomes of an assessment will rest in the specific questions being asked. Until there is some degree of clarity on the questions being asked of MPA networks at a European level (to inform e.g. the MSFD and EU Biodiversity Strategy) it remains difficult to select one particular approach over another. 6.2 Quantitative scorecard approach The quantitative scorecard works at the level of the indicators which are the features contained in each criterion that are the object of the assessment. Indicator assessments are based on the comparison between the measured value of the indicator and a defined target. According to the Deltares (2014) approach, the ratio which results from the latter relationships is subsequently weighted by an uncertainty factor for the data, targets and methods used to assess each indicator. The overall assessment result for a criterion is then obtained by averaging the individual indicators. Table 6.1. below illustrate an example of how this type of a scorecard can be applied to the criteria. The values indicated in the table are based on the results of representativity criteria indicated in section 5 for the western Mediterranean. The percent coverage of each indicator falling under each criterion is indicated in the first column. The targets considered are the 10% coverage for criteria 1.1–1.3. Criterion 1.4 is assessed using different coverage target values to measure sufficiency for broad-scale habitats. All but one revised broad habitat are assessed against a 20% coverage. This means that if the network does not guarantee a minimum 20% coverage for a specific habitat, the respective indicator assessment is classified as insufficient. The only revised broad habitat type that can be associated entirely to a priority HD habitat

60 Assessing Europe’s Marine Protected Area networks
type is Posidonia beds (habitat 1120). In this case the 60% target threshold coverage is used to test representativity of the network for this habitat type. The coverage to target value is calculated as a ratio. The Deltares (2014) approach involved scoring each indicator assessment for the following uncertainty factors: data, target and method involved. This scoring was carried out through the application of a correction value of 1, 0.75 and 0.5 corresponding, respectively to LOW, MODERATE and HIGH uncertainty for each of the factors. In the Deltares (2014) approach, the uncertainty affected the assessment result of each single indicator by weighting it with the ‘correction’ value. If weighting for uncertainty is chosen to not be automatically introduced , another approach would be to show the uncertainty (or confidence) separately and not to weight each indicator assessment by the uncertainty factors (i.e. data, target and methodology used). In such a case the result of each indicator should be taken as it is (the column ‘Ratio’ in table 6.1) and the uncertainty is presented separately. The rationale of this latter approach is that the responsibility of interpreting the assessment lies in the end-user’s choice to consider the direct assessment result on its own or take stock of the uncertainty weight introduced by the potential sources of error. In other words, it is the readers’ choice to judge and interpret the assessment result. If the weighted approach is used, a transparent description is provided regarding how the uncertainty was estimated and how the assessment result is affected by the uncertainty. If the unweighted approach is used, the shortages of the assessment are kept separate from the result. The latter approach has been used in the HELCOM integrated assessments (HELCOM 2009, 2010 c, d). In our test case (table 6.1), we attempted to apply the correction factors to the representativity criteria assessments of the Western Mediterranean Sea. In order to compensate situations where each specific ‘exceeding indicators assessments’ could override the low scoring indicator assessments a method for standardising the resulting “ratio” was introduced. This implied setting a ceiling of 1 for indicator assessment values whenever the target was surpassed (column ‘limited ratio’). This avoids biasing the overall criterion average in situations where many habitats yield coverage values that greatly exceed the target threshold reference condition for sufficiency, and override the insufficiency generated by smaller coverage values of few habitat types. This means that averaging of all the “rescaled” indicators would always fall below 1.0 if any indicator falls short of reaching the target, irrespective of whether we choose the option of weighting for uncertainty or not. Uncertainty weighting was introduced for each indicator assessment. The EMODnet seabed habitat confidence value could not be used because it is expressed on a three-tier confidence assessment (high, medium, low) for each single modelled cell. It is therefore difficult to interpolate such values on an overall basin level and place these in the scorecard with a global value for each revised broad habitat. We therefore propose as an example to rank the uncertainty of data to 1.0 except for habitats characterised by hard bottoms which were scored 0.75 (moderate uncertainty) because we believe that the 250m pixel resolution of the EMODnet map is not adequate for portraying the exhaustive presence of hard bottoms (given that rocky bottoms in this region are unlikely to have a surface area extension big enough to be adequately portrayed in this scale map) and because the EMODnet substrate data layer does not provide an exhaustive description of the hard bottom distribution in the basin. Target uncertainty weights were 1.0 (low uncertainty) except for the revised broad habitat types which can potentially contain at least one assemblage (i.e. biocoenosis, facies, association) considered of conservation importance at RSC level. For these habitats a weight of 0.75 (moderate uncertainty) was applied on the assumption that the 20% target may not be ambitious enough given that an assemblage of conservation importance may be present within these revised broad habitat types. Methodology uncertainty weights of 0.75 (moderate uncertainty) were applied to the representativity criteria for each biological zone due to the uncertainty that the MPAs each have management plans and adequate management measures in place. Methodology uncertainty weights of 0.75 were applied to each revised broad habitat assessment because the habitat coverage methodology does not consider whether the MPAs were established for seabed habitat conservation. The argumentations over such weighting choices are not exhaustive, they need to be object of further discussion, and they are therefore to be considered proposals. The resulting weighted ratio is then corrected for through the same “standardisation” procedure as was done to the unweighted original ratio. This leads to a corrected uncertainty ratio (column “Limited weighted ratio).

Assessing Europe’s Marine Protected Area networks 61
Table 6.1 Example of scorecard development for the representativity principle and respective criteria for
the Western Mediterranean Sea. Key: ‘Ratio’ is the ‘Indicator result %’ divided by ‘Target threshold %’. In ‘Limited ratio’ as well as in the Limited weighted ratio, the ‘Ratio’ cannot exceed 1.0. ‘Uncertainty’ columns give three uncertainty estimates (1.0 = low, 0.75 = moderate and 0.5 = high), the average of which can be used to weight the ‘Weighted average’.
We did not test other options to weight indicators. Weighting of indicators could also be carried out by area, functional importance or by conservation priority. In an area-based weighting, more weight would be
Criterion Representativity indicator name
Indicator result
%
Target threshold
% Ratio Limited
ratio Uncertain
data Uncertain
target Uncertain method
Weighted ratio
Limited weighted
ratio
1.2 Sub-region 15,60 10 1,56 1,0 1 1 1 1,56 1,0
1.3 0-1 NM 60,38 10 6,04 1,0 1 1 1 6,04 1,0
1.3 1-12 NM 29,58 10 2,96 1,0 1 1 1 2,96 1,0
1.3 12NM - END 10,14 10 1,01 1,0 1 1 1 1,01 1,0
Average criterion 2,89 1,0 2,89 1,0
1.4 infralittoral 57,07 10 5,71 1,0 1 1 0,75 4,28 1,0
1.4 circalittoral 29,43 10 2,94 1,0 1 1 0,75 2,21 1,0
1.4 bathyal 15,34 10 1,53 1,0 1 1 0,75 1,15 1,0
1.4 abyssal 6,22 10 0,62 0,62 1 1 0,75 0,47 0,47
Average criterion 2,70 0,91 2,03 0,87
2.1 Infralittoral rock 57,16 20 2,86 1,0 0,75 0,75 0,75 1,21 1,0
2.1 Infralittoral coarse 53,43 20 2,67 1,0 1 1 0,75 2,00 1,0
2.1 Infralittoral sand 51,12 20 2,56 1,0 1 0,75 0,75 1,44 1,0
2.1 Infralittoral mixed 77,17 20 3,86 1,0 1 0,75 0,75 2,17 1,0
2.1 Posidonia meadows 62,82 60 1,05 1,0 1 1 0,75 0,79 0,79
2.1 Cymodocea beds 29,63 20 1,48 1,0 1 1 0,75 1,11 1,0
2.1 Circalittoral rock 21,33 20 1,07 1,0 0,75 0,75 0,75 0,45 0,45
2.1 Circalittoral coarse 48,7 20 2,44 1,0 1 1 0,75 1,83 1,0
2.1 Circalittoral sand 24,08 20 1,20 1,0 1 0,75 0,75 0,68 0,68
2.1 Circalittoral mud 31,98 20 1,60 1,0 1 1 0,75 1,20 1,0
2.1 Circalittoral mixed 34,85 20 1,74 1,0 1 0,75 0,75 0,98 0,98
2.1 Bathyal rock 5,67 20 0,28 0,28 0,75 0,75 0,75 0,12 0,12
2.1 Bathyal coarse 87,52 20 4,38 1,0 1 1 0,75 3,28 1,0
2.1 Bathyal sand 36,46 20 1,82 1,0 1 1 0,75 1,37 1,0
2.1 Bathyal mud 14,19 20 0,71 0,71 1 0,75 0,75 0,40 0,4
2.1 Bathyal mixed 0,94 20 0,05 0,05 1 1 0,75 0,04 0,04
2.1 Abyssal coarse 48,77 20 2,44 1,0 1 1 0,75 1,83 1,0
2.1 Abyssal sand 42,39 20 2,12 1,0 1 1 0,75 1,59 1,0
2.1 Abyssal mud 5,16 20 0,26 0,26 1 1 0,75 0,19 0,19
Average criterion 1,82 0,86 1,19 0,77

62 Assessing Europe’s Marine Protected Area networks
given to those benthic broad-scale habitats which have larger area in the assessment area and, thus, would be the predominant features of the region. However, this approach would not have much scientific support as it is not only the dominance of a habitat but its functions that have the positive significance on the marine environment. In the weighing by functional importance, the focus would be on giving more weight for those broad-scale habitats which support higher quantities of marine biodiversity and food web than other broad-scale habitats. The challenge of this approach lies in the availability of exhaustive knowledge on the functional importance of the broad-scale habitats and it may be more relevant to assess this for more detailed habitat types. In the weighting by conservation priority, one can give more weight to those indicators which potentially contain conservation features of high priority. The latter approach is feasible and may provide important messages for further development of the MPA network. 6.3 Semi-quantitative scorecard approach An alternative, or possibly supplementary, approach to the quantitative scorecard approach illustrated in table 6.1 is one which provides a more qualitative illustration of assessment outputs, but still considers underlying confidence in each assessment routine, input data and target values. Although this approach does not attempt to aggregate or weight assessment outputs to result in an overall score, it does provide a more accessible means of taking action based on the results of an assessment and therefore potentially provides a more valuable means by which decision-makers can take appropriate action to further develop MPA networks. In table 6.2, each overall network principle and associated individual criteria assessment results are reported with a brief comment to help contextualise the outcomes of each assessment. Concerning the example listed for representativity in table 6.2 below, the overall assessment result per criteria (where aggregating outputs of indicator is required e.g. coverage of MPAs in the nearshore, territorial and offshore waters within a given EU Region) could be based broadly on the following routine:
• ‘Target Reached’ – All criteria are considered to be reached;
• ‘Moving towards target’ – The majority (50% or in excess of 50%) of criteria are considered to reach their threshold value;
• ‘Not moving towards target’ – The majority (less than 50%) of criteria are not considered to have reached their threshold value.
One aspect of this approach which would need further discussion in the appropriate fora is the percentage threshold used to define the boundary between the”moving towards target” and “not moving towards target” class. In the above mentioned example we have chosen the 50% of criteria as the threshold point. However, a more conservative approach (i.e. 75% , 90% etc.) would lead to an overall stricter evaluation of distance to target and thereby influence the overall semi-quantitative scoring. Importantly, at the end of each of the criteria rows, confidence is scored based on underlying input data, principle targets and methodology undertaken to generate the assessment output with corresponding comments provided for each. This is important to aid future developments and aspirations for improving the EU-level assessment framework. It is not felt appropriate to further aggregate the overall criteria assessment results into an overall score using the semi-quantitative approach outlined in table 6.2. Instead, an overall summary statement is proposed as a means to capture the outcomes of the overall principle assessment.

Assessing Europe’s Marine Protected Area networks 63
Table 6.2 Example of semi-quantitative summary statistics of an MPA network assessment for the western Mediterranean alongside underlying confidence.
TIER 1 REPRESENTATIVITY & ADEQUACY– percentage coverage of MPAs and seabottom habitat types
Assessment Result Comments
EU Region Target Reached Percentage cover of MPAs in the EU Region far exceeds the 10% threshold value standing at 23%.
Nearshore, territorial and offshore waters Target Reached
Percentage cover of MPAs in the nearshore, territorial and offshore waters areas exceeds the 10% threshold value in all cases, with a greater proportion in the nearshore and terrestrial waters areas by comparison to offshore waters.
Biological depth zones Moving towards target
MPAs exceed the 10% threshold in all zones except the abyssal.
Revised broad habitats Moving towards target
Most revised broad habitats reach MPA coverage target (n=15) attainment with the exception of 3 bathyal and 1 abyssal habitat
CONFIDENCE
Underlying data High-moderate High-moderate confidence in input sediment data but poor resolution for hard bottoms and biological zone boundaries.
Target Low
10% target based on a political, rather than scientific grounds. 20% target based on Natura 2000 approach for seabottom habitat types, does not contain considerations of likelihood of features of conservation interest.
Methodology Moderate
MPAs are not screened for existence of management plans and management effectiveness. MPAs do not necessarily protect the occurrence of seabottom habitat types where they interesect with MPA boundaries.
SUMMARY: Although the overall distribution of MPAs in the Western Mediterranean appears to be close to the targets of each criterion, the degree of confidence lying behind the targets and methodology is low and this undermines the overall confidence of the assessment results.

64 Assessing Europe’s Marine Protected Area networks
7 Recommendations The work presented in this report considers the development of a proposed methodological framework for the assessment of EU MPA networks (sections 2 & 4), reviews the available datasets which are available to support an EU-level MPA assessment (section 3) and considers how such an assessment might be undertaken and presented (sections 5 & 6). The outcomes of running the proposed methodology have provided an overall analysis of the networks with respect to common comparable elements. The assessment exercise has provided different assessment scenarios that provide room for debate on the status of the networks when more than one conservation objective is considered. The caveats behind the available data and approaches have also revealed several recommendations that are important to consider in moving forward with an EU-level MPA network assessment:
• Clarifying the requirements of EU level policy drivers in considering MPA network assessments – As identified in Section 1.2, MPA networks are mentioned under Article 13.4 of the MSFD, the EU Biodiversity Strategy and sufficiency of European marine N2K Sites are considered in the context of the EC Birds and Habitats Directives. A piece of work is required, in coordination with the European Commission, to help define, to a finer level of detail, the different requirements of MPA network reported information in fulfilling the requirements of each of these EU-level policy drivers.
• Including biology in the consideration of seabottom habitat and species protection within EU MPA networks – The current approach to using the revised broad habitats, though it contains biological zone and substrate attributes that provide for a general ecological differentiation, considers the physical characteristics of seabottom habitat types across EU Regions and not associated biological communities. Even so, in some portions of the assessed subregions there are large substrate data gaps or coarse substrate data quality. It is very clear that the baseline spatial data against which the MPA networks are currently assessed has large gaps as far as data quality and biology are concerned. This report recommends the further expansion of pan-European spatial mapping efforts that would allow more ecologically meaningful assessments to be undertaken in the future. More specifically this should focus on: o Improved and completed spatial coverage of basic physical parameters necessary to model
broad scale seabed habitats o EUNIS Level 4 habitats across EU waters o Species (particularly those of conservation / management importance for which MPAs are
usually established) distribution maps which are currently missing from the proposed assessment. Future efforts centered on aligning MS MSFD reporting obligations in terms of spatial data on species distribution (according to functional groups) would allow to assess the network for this aspect.
• Moving towards assessing protection, not just spatial overlap – The approach to assessing the proportion of seabottom habitats within with MPAs in sections 4 and 5 of this report examines spatial overlap and not actual protection (albeit removal of MPAs from the analysis considered to afford protection to species only does infer a slight increase in the confidence of the assessment outputs). Improved reporting on MPAs across the different databases indicating the conservation and protection objectives as well as the protection effectiveness would allow to assess in finer detail the actual attainment of target protection.
• Further definition of the scope for replication of revised broad habitats – Regional Sea Convention replication assessments rely on the measurement of the degree of replication of biological features with respect to regional ecoregions or subregions. Coordination with RSC conventions to define the comparability of regional ecoregions with respect to replication assessments of revised broad habitats would allow to improve the future replication assessment of broad habitats at a finer geographic scale thereby providing better insight into the distance to target for this criterion.
• Moving towards network connectivity, rather than proximity – The approach put forward in this report, as well as all three Regional Sea Conventions, have resorted to the use of proximity analysis to make inferences about the degree to which MPA networks are well connected. In an ideal world, specific information about species larval phases and dispersal patterns, in combination with data-

Assessing Europe’s Marine Protected Area networks 65
rich oceanographic models, would be combined to develop a clearer picture of the potential interchange of biological diversity between MPAs. There are several good examples of this at a sub-regional level (e.g. from a study in the Kattegat) from which to draw on and it is recommended that significant effort goes into further development and collation of such models and life histories information into the future at an EU-wide level. This is an EU-level recommendation also put forward by Olsen et al., (2013) in their review of science needs for MPA networks across Europe.
• Further exploration of appropriate criteria under the network principles of ‘adequacy’ and ‘management’ – Regional Sea Conventions differ greatly in their assessment of adequacy and management as part of MPA network assessments – although all three Regional Sea Conventions consider these principles to be an important component of overall network coherence. Whilst this report proposes the use of ‘exploratory’ work involving MPA size classes and reporting on management plan existence as proxies under these two principles, we would recommend that a consistent approach to generating and reporting information pertaining to MPA management be considered for roll out across all EU MPAs (potentially taking inspiration from approaches being used across the North-east Atlantic and Mediterranean Regional Sea Conventions). We would also recommend that adequacy assessment details be further discussed with respect to the possibility of introducing a more site-based conservation requirement approach as has been advocated by some RSCs. More specifically this could entail a framework that maintains the proposed size target classes, in line with RSC prerogatives, but that assesses the MPAs’ adequacy with respect to the requirements of the biological features contained within each MPA. In order to pursue this line, information on biological features contained in each MPA should be made available through a harmonised data reporting mechanism spanning across all considered EU MPAs. Crosswalking of the adequacy requirements of the principal regional sea biological features (i.e. protected species, functional species, habitats of conservation interest, etc.) with respect to the proposed adequacy target classes could be optimally carried out within the framework of the pertinent RSC fora.
• Streamlining the availability of spatial and tabular data on EU MPAs – The N2K, CDDA and Regional Sea Convention databases are all proposed for use as source data for information on EU MPAs within this report. The Tier 3 assessments have evidenced the importance of evaluating certain MPA characteristics in order for the assessments to be more complete and credible and they have also highlighted how not all MPA databases provide the necessary information. Ideally, there would be a data flow process developed centrally within the EU that draws in an automated way necessary attribute data into a centralised EU MPA database from which such MPA assessments can draw from into the future. Given that this may represent a too ambitious goal in the medium term, efforts should be made to harmonise MPA database reporting so that all the databases report comparable information required for the exhaustive conduction of an MPA assessment. This should include, amongst others aspects: standardised tabular and spatial data with QA/QC procedures, the objectives of MPA establishment, the protected features of each MPA,the year the MPA was designated; the existence of management plans and information on progress towards implementing appropriate management, monitoring and assessment of conservation status (see also recommendation around management above), MPA size (in a standard unit of area measurement) and a list of MSFD Broad Habitats and EUNIS Level 3 habitat classes considered to cross-walk to protected features (as per the recommendation above).
• Generating a centralised database of ‘other area-based measures’ as well as EU MPAs – Both the CBD and MSFD infer that not just MPAs in their strictest definition can be considered to contribute to EU MPA networks. Effort should be invested in developing a common definition of ‘other area-based measures’ in an EU context and a centralised database produced of such areas, the features they are considered to protect, and the likelihood of persistence of management that affords protection to said features. This will enable such areas to be built into further assessments in the future.

66 Assessing Europe’s Marine Protected Area networks
References Andersen, J.H., Halpern, B.S., Korpinen, S., Murray, C. & Reker, J., 2015a, ‘Baltic Sea biodiversity status vs. cumulative human pressures’, Estuarine, Coastal and Shelf Science 161, 88–92. Andersen, J.H., Carstensen, J., Conley, D.J., Dromph, K., Fleming, V., Gustafsson, B., Josefson, A., Norkko, A., Villnäs, A. & Murray, C., 2015b, ‘A Baltic Sea-wide analysis of temporal and spatial trends in eutrophication status’, Biological Reviews, doi: 10.1111/brv.12221. Cameron, A. and Askew, N. (eds.), 2011, EUSeaMap ‑ Preparatory Action for development and assessment of a European broad ‑ scale seabed habitat map final report. http://www.emodnet-seabedhabitats.eu/Files/20110228_FinalReport_EUSeaMap_v2.8.zip Carr, H., Cornthwaite, A., Wright, H., Davies, J., 2014, Assessing progress towards an ecologically coherent network of MPAs in Secretary of State Waters in 2014 . JNCC, 61pp. http://jncc.defra.gov.uk/pdf/JNCC_NetworkProgressInSoSWaters_2014.pdf CBD, 2010, Strategic Plan for Biodiversity 2011–2020. UNEP/CBD/COP/10/INF/12/Rev.1, 14 March 2011. https://www.cbd.int/kb/record/meetingDocument/77515?Event=COP-10 COM, 2015, Report from the Commission to the European Parliament and the Council on the progress in establishing marine protected areas (as required by Article 21 of the Marine Strategy Framework Directive 2008/56/EC), N. 481-final, Brussels, 1.10.2015, 8pp. + Annexes, http://ec.europa.eu/transparency/regdoc/rep/1/2015/EN/1-2015-481-EN-F1-1.PDF Deltares, 2014, Proposal for an assessment metehod of the ecological coherence of networks of marine protected areas in Europe, 1208917-000 Deltares. Edgar, G.H., Stuart-Smith, R.D., Willis, T.J., Kininmonth, S., Baker, S.C., Banks, S., Barrett, N.S., Becerro, M.A., Bernard, A.T.F., Berkhout, J., Buxton, C.D., Campbell, S.J., Cooper, A.T., Davey, M., Edgar, S.C., Forsterra, G., Galvan, D.E., Irigoyen, A.J., Kushner, D.J., Moura, R., Parnell, P.E., Shears, N.T., Soler, G., Strain, E.M.A., Thomson, R.J., 2014, ‘Global conservation outcomes depend on marine protected areas with five key features’, Nature Research letters 506, 216-220. Doi:10.1038/nature13022 EEA, 2015a, Marine protected areas in Europe's seas – An overview and perspectives for the future, EEA Report 3/2015. http://www.eea.europa.eu/publications/marine-protected-areas-in-europes EEA, 2015b, Spatial analysis of Marine Protected Area Networks in Europe´s seas. EEA Technical report, 17/2015. http://www.eea.europa.eu/publications/spatial-analysis-of-marine-protected ETC / BD, 1997, Criteria for assessing national lists of pSCIs at the biogeographical level Hab. 97/2 rev. 4 18/11/9, http://bd.eionet.europa.eu/activities/Natura_2000/crit ETC / BD, 2009, Additional guidelines for assessing sufficiency of Natura 2000 proposals (SCIs) for marine habitats and species, http://bd.eionet.europa.eu/activities/Natura_2000/chapter6 ETC /ICM, 2014, ETC/ICM Technical report regarding MPA hind casting and N2K country profiles. Version 1.1, December 17, 2014. Key Deliverable 1.6.2.b European Commission, 2016, CTTEE_14-2016-03. Proposal for a Commission Decision on GES Criteria_draft v4.

Assessing Europe’s Marine Protected Area networks 67
European Commission / Joint Research Council, 2015, Review of the Commission Decision 2010/477/EU concerning MSFD criteria for assessing good environmental status. Draft Report of the JRC’s Descriptor 1 workshop to support the review process and complement the D1 review manual, GES_14-2015-02, Report of MSFD workshop on Descriptor 1. Gabrié, C., Lagabrielle, E., Bissery, C., Crochelet, E., Meola, B., Webster, C., Claudet, J., Chassanite, A., Marinesque, S., Robert, P., Goutx, M., Quod, C., 2012, The Status of Marine Protected Areas in the Mediterranean Sea, MedPAN & RAC/SPA. Ed: MedPAN Collection. 256 pp. HELCOM, 2003, Guidelines for Designating Marine and Coastal Baltic Sea Protected Areas (BSPA) and Proposed Protection Categories, updated and approved by HELCOM HOD 11/2003 HELCOM, 2006, ‘Initial analysis on status of ecological coherence of the BSPA network. HELCOM’ HABITAT 8/2006, document 5.2/5, https://portal.helcom.fi/Archive/Shared%20Documents/HABITAT%208-2006-5.2-5%20status%20of%20BSPA%20network.pdfhttps://portal.helcom.fi/Archive/Shared%20Documents/HABITAT%208-2006-5.2-5%20status%20of%20BSPA%20network.pdf. HELCOM, 2010a, ‘Towards an ecologically coherent network of well-managed Marine Protected Areas – Implementation report on the status and ecological coherence of the HELCOM BSPA network: Executive Summary’, Balt. Sea Environ. Proc. 124A. HELCOM, 2010b, ‘Towards an ecologically coherent network of well-managed Marine Protected Areas – Implementation report on the status and ecological coherence of the HELCOM BSPA network’, Balt. Sea Environ. Proc. 124B. HELCOM, 2010c, ‘Ecosystem Health of the Baltic Sea 2003–2007: HELCOM Initial Holistic Assessment’, Balt. Sea Environ. Proc. 122. HELCOM, 2010d, ‘Hazardous substances in the Baltic Sea – An integrated thematic assessment of hazardous substances in the Baltic Sea’, Balt. Sea Environ. Proc. 120B. HELCOM , 2015, Proposed method for the next assessment of ecological coherence of the Baltic Sea MPA network, Baltic Marine Environment Protection Commission Working Group on the State of the Environment and Nature Conservation Helsinki. 3N-1. STATE&CONSERVATION 2-2015 HELCOM, 2016, ‘Ecological coherence assessment of the Marine Protected Area network in the Baltic’, Balt. Sea Environ. Proc. 148 Natural England and the Joint Nature Conservation Committee, 2010, The Marine Conservation Zone Project: Ecological Network Guidance. Sheffield and Peterborough, UK. Noss, R. F., 1992, The Wildlands project: Land Conservation Strategy – Environmental Policy and Biodiversity, R. Edward Grumbine (ed.), 10–25. Olsen, E.M., Johnson, D., Weaver, P., Goñi, R., Ribeiro, M.C., Rabaut, M., Macpherson, E., Pelletier, D., Fonseca, L., Katsanevakis, S., Zaharia, T., 2013, Achieving ecologically coherent MPA Networks in Europe: science needs and priorities. Marine Board Position Paper 18. Larkin K.E. and McDonough N.(Eds.). European Marine Board, Ostend, Belgium. OSPAR, 2006, Guidance on developing an ecologically coherent network of OSPAR marine protected areas, Reference number 2006-3, 11 pp. OSPAR, 2008, Background document on three initial spatial tests used for assessing the ecological coherence of the OSPAR MPA network. OSPAR Commission, 17 pp.

68 Assessing Europe’s Marine Protected Area networks
OSPAR, 2013, An assessment of the ecological coherence of the OSPAR Network of Marine Protected Areas in 2012. OSPAR Commission, 619/2013, http://www.ospar.org/documents?v=7346 OSPAR, 2017, Intermediate Assessment. Summary status of the OSPAR network of Marine Protected Areas (MPAs) (2016). Available online at: https://oap.ospar.org/en/ospar-assessments/intermediate-assessment-2017/biodiversity-status/marine-protected-areas/ Piekäinen, H. and Korpinen S., 2007, Towards an Assessment of Ecological Coherence of the Marine Protected Areas Network in the Baltic Sea Region, BALANCE Interim Report 25, 141 pp, www.balance-eu.org/publications. Populus, J., Vasquez, M., Albrecht, J., Manca, E., Agnesi, S., Al Hamdani, Z., Andersen, J., Annunziatellis, A., Bekkby, T., Bruschi, A., Doncheva, V., Drakopoulou, V., Duncan, G., Inghilesi, R., Kyriakidou, C., Lalli, F., Lillis, H., Mo, G., Muresan, M., Salomidi, M., Sakellariou, D., Simboura, M., Teaca, A., Tezcan, D., Todorova, V., Tunesi, L., 2017, EUSeaMap. A European broad-scale seabed habitat map. http://doi.org/10.13155/49975 Rees, S., Foster, N., Langmead, O., Griffiths, C., 2015, An assessment of the network of marine protected areas in the Celtic Seas. A report for WWF ‐UK by the Marine Institute, Plymouth University and The Marine Biological Association of the United Kingdom. pp 165 SEC, 2011, Commission Staff Working Paper: Relationship between the initial assessment of marine waters and the criteria for good environmental status, European Commission, 2011, 1255 final, http://ec.europa.eu/environment/marine/pdf/SEC_2011_1255_F_DTS.pdf UNEP, 2009, 16th Ordinary Meeting of the Contracting Parties to the Convention for the Protection of the Marine Environment and the Coastal Region of the Mediterranean and its Protocols Marrakesh (Morocco), 3-5 November 2009, UNEP(DEPI)/MED IG.19/8, 24 November 2009. http://www.rac-spa.org/mcpa.a UNEP/MAP RAC/SPA, 2009, Regional Working Programme for the Coastal and Marine Protected Areas in the Mediterranean Sea including the High Sea, (http://www.rac-spa.org/sites/default/files/doc_pwmcpa/pwmcpa_en.pdf) UNEP-MAP RAC/SPA, 2010, Overview of scientific findings and criteria relevant to identifying SPAMIs in the Mediterranean open seas, including the deep sea. By Notarbartolo di Sciara, G. and Agardy, T. Ed. RAC/SPA, Tunis, 71pp, http://medabnj.rac-spa.org/images/stories/Publications/overview_report.pdf UNEP/MAP RAC/SPA, 2014, Guidelines to improve the implementation of the Mediterranean Specially Protected Areas network and connectivity between Specially Protected Areas, By Dan Laffoley. ed. RAC/SPA, Tunis, 32pp, http://www.rac-spa.org/sites/default/files/doc_spa/guidance_build_mpa_netwrk_en.pdf
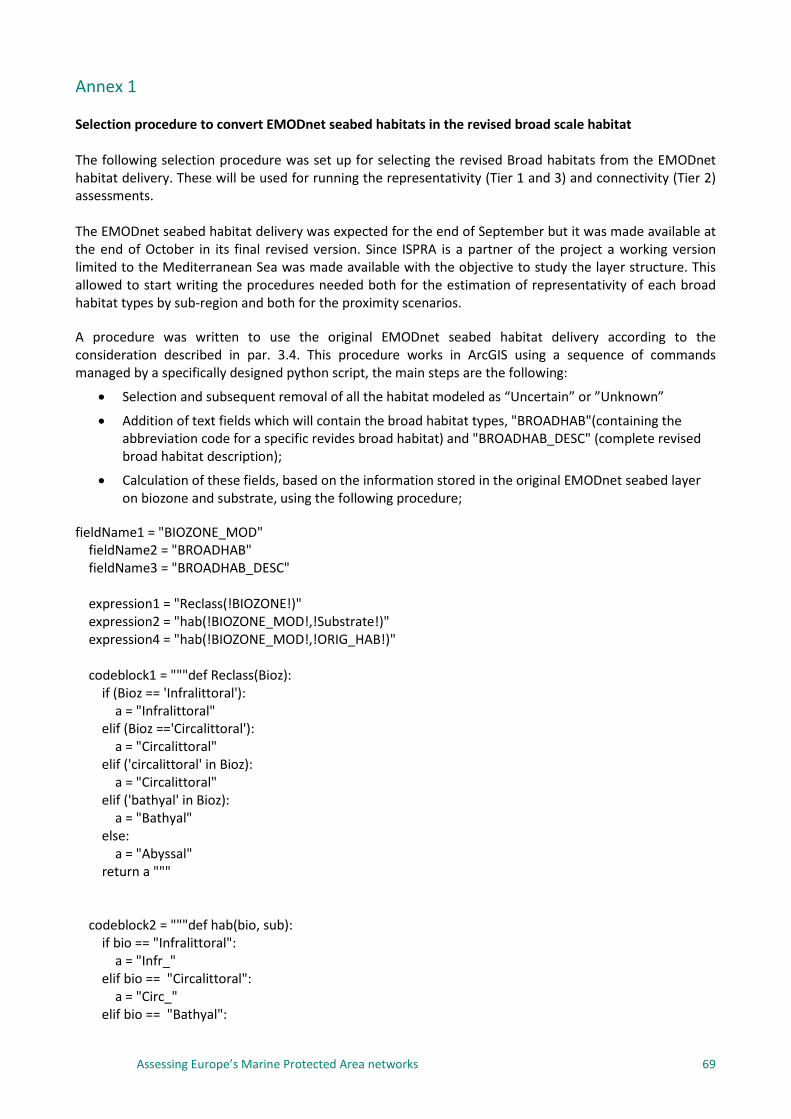
Assessing Europe’s Marine Protected Area networks 69
Annex 1 Selection procedure to convert EMODnet seabed habitats in the revised broad scale habitat The following selection procedure was set up for selecting the revised Broad habitats from the EMODnet habitat delivery. These will be used for running the representativity (Tier 1 and 3) and connectivity (Tier 2) assessments. The EMODnet seabed habitat delivery was expected for the end of September but it was made available at the end of October in its final revised version. Since ISPRA is a partner of the project a working version limited to the Mediterranean Sea was made available with the objective to study the layer structure. This allowed to start writing the procedures needed both for the estimation of representativity of each broad habitat types by sub-region and both for the proximity scenarios. A procedure was written to use the original EMODnet seabed habitat delivery according to the consideration described in par. 3.4. This procedure works in ArcGIS using a sequence of commands managed by a specifically designed python script, the main steps are the following:
• Selection and subsequent removal of all the habitat modeled as “Uncertain” or ”Unknown”
• Addition of text fields which will contain the broad habitat types, "BROADHAB"(containing the abbreviation code for a specific revides broad habitat) and "BROADHAB_DESC" (complete revised broad habitat description);
• Calculation of these fields, based on the information stored in the original EMODnet seabed layer on biozone and substrate, using the following procedure;
fieldName1 = "BIOZONE_MOD" fieldName2 = "BROADHAB" fieldName3 = "BROADHAB_DESC" expression1 = "Reclass(!BIOZONE!)" expression2 = "hab(!BIOZONE_MOD!,!Substrate!)" expression4 = "hab(!BIOZONE_MOD!,!ORIG_HAB!)" codeblock1 = """def Reclass(Bioz): if (Bioz == 'Infralittoral'): a = "Infralittoral" elif (Bioz =='Circalittoral'): a = "Circalittoral" elif ('circalittoral' in Bioz): a = "Circalittoral" elif ('bathyal' in Bioz): a = "Bathyal" else: a = "Abyssal" return a """ codeblock2 = """def hab(bio, sub): if bio == "Infralittoral": a = "Infr_" elif bio == "Circalittoral": a = "Circ_" elif bio == "Bathyal":

70 Assessing Europe’s Marine Protected Area networks
a = "Bath_" else: a = "Abys_" if ('Coarse' in sub): b = "Coar" elif ('Cymodocea' in sub): b = "Cym" elif ('Posidonia' in sub): b = "Pos" elif sub == 'Fine mud': b = "Mud" elif sub == 'Mixed sediment': b = "Mix" elif sub == "Mud to muddy sand": b = "Mud" elif sub == "Rock or other hard substrata": b = "Rock" elif sub == "Sand": b = "Sand" else: b = "Mud" return "{0}{1}".format(a,b)""" codeblock3 = """def hab(bio, sub): if bio == "Infralittoral": a = "Infralittoral" elif bio == "Circalittoral": a = "Circalittoral" elif bio == "Bathyal": a = "Bathyal" else: a = "Abyssal" if ('Coarse' in sub): b = "Coarse sediment" elif ('Posidonia' in sub): b = "Posidonia" elif sub == 'Fine mud': b = "Mud" elif sub == 'Mixed sediment': b = "Mixed sediment" elif sub == "Mud to muddy sand": b = "Mud" elif sub == "Rock or other hard substrata": b = "Rock" elif sub == "Sand": b = "Sand" elif sub == "Sandy mud to muddy sand": b = "Mud" else: b = "Cymodocea" return "{0} {1}".format(a,b)"""

Assessing Europe’s Marine Protected Area networks 71

72 Assessing Europe’s Marine Protected Area networks