seismic hazard zone report for the richmond...
TRANSCRIPT
SEISMIC HAZARD ZONE REPORT 070
SEISMIC HAZARD ZONE REPORT FOR THE RICHMOND 7.5-MINUTE QUADRANGLE,
ALAMEDA COUNTY, CALIFORNIA
2003
DEPARTMENT OF CONSERVATION California Geological Survey
STATE OF CALIFORNIA
GRAY DAVIS GOVERNOR
THE RESOURCES AGENCY MARY D. NICHOLS
SECRETARY FOR RESOURCES
DEPARTMENT OF CONSERVATION DARRYL YOUNG
DIRECTOR
CALIFORNIA GEOLOGICAL SURVEY
JAMES F. DAVIS, STATE GEOLOGIST
Copyright © 2003 by the California Department of Conservation. All rights reserved. No part of this publication may be reproduced without written consent of the Department of Conservation.
“The Department of Conservation makes no warrantees as to the suitability of this product for any particular purpose.”

SEISMIC HAZARD ZONE REPORT 070
SEISMIC HAZARD ZONE REPORT FOR THE RICHMOND 7.5-MINUTE QUADRANGLE,
ALAMEDA COUNTY, CALIFORNIA
CALIFORNIA GEOLOGICAL SURVEY'S PUBLICATION SALES OFFICES:
Southern California Regional Office 888 South Figueroa Street, Suite 475 Los Angeles, CA 90017 (213) 239-0878
Publications and Information Office 801 K Street, MS 14-31 Sacramento, CA 95814-3531 (916) 445-5716
Bay Area Regional Office 345 Middlefield Road, MS 520 Menlo Park, CA 94025 (650) 688-6327

List of Revisions – Richmond SHZR 070
6/1/05 BPS address correction, web link updates
10/10/05 Bay Area Regional Office and Southern California Regional Office addresses updated

CONTENTS
EXECUTIVE SUMMARY .......................................................................................................... vii
INTRODUCTION ...........................................................................................................................1
SECTION 1 LIQUEFACTION EVALUATION REPORT Liquefaction Zones in the Richmond 7.5-Minute Quadrangle, Alameda County, California...................................................3
PURPOSE....................................................................................................................................3
BACKGROUND .....................................................................................................................4
METHODS SUMMARY.........................................................................................................4
SCOPE AND LIMITATIONS.................................................................................................5
PART I .........................................................................................................................................5
PHYSIOGRAPHY...................................................................................................................5
GEOLOGY ..............................................................................................................................6
ENGINEERING GEOLOGY ..................................................................................................9
GROUND WATER ...............................................................................................................11
PART II......................................................................................................................................12
LIQUEFACTION POTENTIAL ...........................................................................................12
LIQUEFACTION SUSCEPTIBILITY..................................................................................13
LIQUEFACTION OPPORTUNITY .....................................................................................14
LIQUEFACTION ZONES ....................................................................................................15
ACKNOWLEDGMENTS .........................................................................................................17
REFERENCES ..........................................................................................................................17
iii
SECTION 2 EARTHQUAKE-INDUCED LANDSLIDE EVALUATION REPORT Earthquake-Induced Landslide Zones in the Richmond 7.5-Minute Quadrangle, Alameda County, California .......................................................................................................................................23
PURPOSE..................................................................................................................................23
Background............................................................................................................................24
METHODS SUMMARY.......................................................................................................24
Scope and Limitations............................................................................................................25
PART I .......................................................................................................................................26
PHYSIOGRAPHY.................................................................................................................26
GEOLOGY ............................................................................................................................27
ENGINEERING GEOLOGY ................................................................................................33
PART II......................................................................................................................................37
EARTHQUAKE-INDUCED LANDSLIDE hazard potential...............................................37
EARTHQUAKE-INDUCED LANDSLIDE Hazard ZONE .................................................41
ACKNOWLEDGMENTS .........................................................................................................42
REFERENCES ..........................................................................................................................42
AIR PHOTOS ............................................................................................................................45
APPENDIX A Source of Rock Strength Data...........................................................................46
SECTION 3 GROUND SHAKING EVALUATION REPORT Potential Ground Shaking in the Richmond 7.5-Minute Quadrangle, Alameda County, California ..........................................47
PURPOSE..................................................................................................................................47
EARTHQUAKE HAZARD MODEL .......................................................................................48
APPLICATIONS FOR LIQUEFACTION AND LANDSLIDE HAZARD ASSESSMENTS52
USE AND LIMITATIONS....................................................................................................55
REFERENCES ..........................................................................................................................56
iv

ILLUSTRATIONS
Figure 2.1. Yield Acceleration vs. Newmark Displacement for the Southern California Edison Lucerne Record......................................................................................................................39
Figure 3.1. Richmond 7.5-Minute Quadrangle and portions of adjacent quadrangles, 10 percent exceedance in 50 years peak ground acceleration (g)—Firm rock conditions. ........49
Figure 3.2. Richmond 7.5-Minute Quadrangle and portions of adjacent quadrangles, 10 percent exceedance in 50 years peak ground acceleration (g)—Soft rock conditions. .........50
Figure 3.3. Richmond 7.5-Minute Quadrangle and portions of adjacent quadrangles, 10 percent exceedance in 50 years peak ground acceleration (g)—Alluvium conditions. .........51
Figure 3.4. Richmond 7.5-Minute Quadrangle and portions of adjacent quadrangles, 10 percent exceedance in 50 years peak ground acceleration—Predominant earthquake..........53
Figure 3.5. Richmond 7.5-Minute Quadrangle and portions of adjacent quadrangles, 10 percent exceedance in 50 years magnitude-weighted pseudo-peak acceleration for alluvium - Liquefaction opportunity......................................................................................54
Table 1.1. Correlation of Quaternary Stratigraphic Nomenclatures Used within the Richmond Quadrangle...............................................................................................................................8
Table 1.2. Geotechnical Characteristics for Quaternary Geological Units in the Richmond 7.5-Minute Quadrangle ................................................................................................................10
Table 1.3. Liquefaction Susceptibility for Quaternary Map Units within the Richmond 7.5-Minute Quadrangle ................................................................................................................11
Table 2.1. Summary of the Shear Strength Statistics for the Richmond Quadrangle.................36
Table 2.2. Summary of Shear Strength Groups for Geologic Formations that Occur within the Mapped Portion of the Richmond Quadrangle. .....................................................................37
Table 2.3. Hazard Potential Matrix for Earthquake-Induced Landslides in the Richmond Quadrangle.. ...........................................................................................................................40
Plate 1.1. Quaternary geologic map of the Richmond 7.5-Minute Quadrangle, California. .....58
Plate 1.2. Depth to historically highest ground water and location of boreholes used in this study, Richmond 7.5-Minute Quadrangle, California. ..........................................................59
v

Plate 2.1. Landslide inventory, and shear strength locations, Richmond 7.5-Minute Quadrangle, California...........................................................................................................60
vi

EXECUTIVE SUMMARY
This report summarizes the methods and sources of information used to prepare the Seismic Hazard Zone Map for the Alameda County portion of the Richmond 7.5-Minute Quadrangle. The map displays the boundaries of zones of required investigation for liquefaction and earthquake-induced landslides over an area of approximately 10 square miles at a scale of 1 inch = 2,000 feet.
The Richmond 7.5-Minute Quadrangle covers approximately 60 square miles in Alameda, Contra Costa, and San Francisco counties. However, only the Alameda County portion of the quadrangle (17 percent) has been evaluated during the current study. Parts of the cities of Berkeley and Albany lie within the study area. Albany occupies flatlands along the margin of the bay and includes Albany Hill, whereas Berkeley occupies flatlands along the margin of the bay as well as steep hilly areas in the Berkeley Hills. The flatland areas in Berkeley and Albany are heavily developed for residential and commercial use. Most of the hilly areas in Berkeley also have been developed for residential use. Interstate highway 80/580 extends along the shoreline of San Francisco Bay. Bay Area Rapid Transit (BART) extends through the cities of Berkeley and Albany subparallel to Interstate 80/580.
The map is prepared by employing geographic information system (GIS) technology, which allows the manipulation of three-dimensional data. Information considered includes topography, surface and subsurface geology, borehole data, historical ground-water levels, existing landslide features, slope gradient, rock-strength measurements, geologic structure, and probabilistic earthquake shaking estimates. The shaking inputs are based upon probabilistic seismic hazard maps that depict peak ground acceleration, mode magnitude, and mode distance with a 10 percent probability of exceedance in 50 years.
In the Richmond Quadrangle the liquefaction zone coincides with the shoreline areas and low-relief plain where artificial fill rests upon Bay Mud or Holocene alluvial deposits contain liquefiable layers. The eastern zone boundary is defined by the surface projection of the contact between ground water and the base of Holocene alluvial fan deposits. Fractured bedrock units, abundant existing landslides, and hilly terrain in the Berkley Hills and Albany Hill contribute to an earthquake-induced landslide zone that covers about 22 percent of the Alameda County portion of the quadrangle.
vii

How to view or obtain the map
Seismic Hazard Zone Maps, Seismic Hazard Zone Reports and additional information on seismic hazard zone mapping in California are available on the California Geological Survey's Internet page: http://www.conservation.ca.gov/CGS/index.htm
Paper copies of Official Seismic Hazard Zone Maps, released by CGS, which depict zones of required investigation for liquefaction and/or earthquake-induced landslides, are available for purchase from:
BPS Reprographic Services 945 Bryant Street San Francisco, California 94105 (415) 512-6550
Seismic Hazard Zone Reports (SHZR) summarize the development of the hazard zone map for each area and contain background documentation for use by site investigators and local government reviewers. These reports are available for reference at CGS offices in Sacramento, San Francisco, and Los Angeles. NOTE: The reports are not available through BPS Reprographic Services.

INTRODUCTION
The Seismic Hazards Mapping Act (the Act) of 1990 (Public Resources Code, Chapter 7.8, Division 2) directs the California Department of Conservation (DOC), Division of Mines and Geology (DMG) [now called California Geological Survey (CGS)] to delineate seismic hazard zones. The purpose of the Act is to reduce the threat to public health and safety and to minimize the loss of life and property by identifying and mitigating seismic hazards. Cities, counties, and state agencies are directed to use the seismic hazard zone maps in their land-use planning and permitting processes. They must withhold development permits for a site within a zone until the geologic and soil conditions of the project site are investigated and appropriate mitigation measures, if any, are incorporated into development plans. The Act also requires sellers (and their agents) of real property within a mapped hazard zone to disclose at the time of sale that the property lies within such a zone. Evaluation and mitigation of seismic hazards are to be conducted under guidelines adopted by the California State Mining and Geology Board (SMGB) (DOC, 1997). The text of this report is on the Internet at http://gmw.consrv.ca.gov/shmp/webdocs/sp117.pdf
The Act also directs SMGB to appoint and consult with the Seismic Hazards Mapping Act Advisory Committee (SHMAAC) in developing criteria for the preparation of the seismic hazard zone maps. SHMAAC consists of geologists, seismologists, civil and structural engineers, representatives of city and county governments, the state insurance commissioner and the insurance industry. In 1991 SMGB adopted initial criteria for delineating seismic hazard zones to promote uniform and effective statewide implementation of the Act. These initial criteria provide detailed standards for mapping regional liquefaction hazards. They also directed CGS to develop a set of probabilistic seismic maps for California and to research methods that might be appropriate for mapping earthquake-induced landslide hazards.
In 1996, working groups established by SHMAAC reviewed the prototype maps and the techniques used to create them. The reviews resulted in recommendations that 1) the process for zoning liquefaction hazards remain unchanged and 2) earthquake-induced landslide zones be delineated using a modified Newmark analysis.
This Seismic Hazard Zone Report summarizes the development of the hazard zone map. The process of zoning for liquefaction uses a combination of Quaternary geologic mapping, historical ground-water information, and subsurface geotechnical data. The process for zoning earthquake-induced landslides incorporates earthquake loading, existing landslide features, slope gradient, rock strength, and geologic structure. Probabilistic seismic hazard maps, which are the underpinning for delineating seismic hazard zones, have been prepared for peak ground acceleration, mode magnitude, and mode distance with a 10 percent probability of exceedance in 50 years (Petersen and others, 1996) in accordance with the mapping criteria.
1

This report summarizes seismic hazard zone mapping for potentially liquefiable soils and earthquake-induced landslides in the Richmond 7.5-Minute Quadrangle.
SECTION 1 LIQUEFACTION EVALUATION REPORT
Liquefaction Zones in the Richmond 7.5-Minute Quadrangle,
Alameda County, California
By Kevin B. Clahan, M. Elise Mattison, Anne M. Rosinski,
Keith L. Knudsen, and Wayne D. Haydon
California Department of Conservation California Geological Survey
PURPOSE
The Seismic Hazards Mapping Act (the Act) of 1990 (Public Resources Code, Chapter 7.8, Division 2) directs the California Department of Conservation (DOC), Division of Mines and Geology (DMG) [now called California Geological Survey (CGS)] to delineate Seismic Hazard Zones. The purpose of the Act is to reduce the threat to public health and safety and to minimize the loss of life and property by identifying and mitigating seismic hazards. Cities, counties, and state agencies are directed to use seismic hazard zone maps developed by CGS in their land-use planning and permitting processes. The Act requires that site-specific geotechnical investigations be performed prior to permitting most urban development projects within seismic hazard zones. Evaluation and mitigation of seismic hazards are to be conducted under guidelines adopted by the California State Mining and Geology Board (SMGB) (DOC, 1997). The text of this report is on the Internet at http://gmw.consrv.ca.gov/shmp/webdocs/sp117.pdf
Following the release of DMG Special Publication 117 (DOC, 1997), agencies in the Los Angeles metropolitan region sought more definitive guidance in the review of geotechnical investigations addressing liquefaction hazards. The agencies made their request through the Geotechnical Engineering Group of the Los Angeles Section of the American Society of Civil Engineers (ASCE). This group convened an implementation
3
CALIFORNIA GEOLOGICAL SURVEY SHZR 070 4
committee under the auspices of the Southern California Earthquake Center (SCEC). The committee, which consisted of practicing geotechnical engineers and engineering geologists, released an overview of the practice of liquefaction analysis, evaluation, and mitigation techniques (SCEC, 1999). This text is also on the Internet at: http://www.scec.org/
This section of the evaluation report summarizes seismic hazard zone mapping for potentially liquefiable soils in the Richmond 7.5-Minute Quadrangle. Section 2 (addressing earthquake-induced landslides) and Section 3 (addressing potential ground shaking), complete the report, which is one of a series that summarizes production of similar seismic hazard zone maps within the state (Smith, 1996). Additional information on seismic hazards zone mapping in California is on CGS’s Internet web page: http://www.conservation.ca.gov/CGS/index.htm
BACKGROUND
Liquefaction-induced ground failure historically has been a major cause of earthquake damage in northern California. During the 1989 Loma Prieta and 1906 San Francisco earthquakes, significant damage to roads, utility pipelines, buildings, and other structures in the San Francisco Bay Area was caused by liquefaction-induced ground displacement.
Localities most susceptible to liquefaction-induced damage are underlain by loose, water-saturated, granular sediment within 40 feet of the ground surface. These geological and ground-water conditions are widespread in the San Francisco Bay Area, most notably in alluviated valley floodplains and around the margin of the bay. In addition, the potential for strong earthquake ground shaking is high because of the many nearby active faults. The combination of these factors constitutes a significant seismic hazard in the San Francisco Bay Area, including areas in the Richmond Quadrangle.
METHODS SUMMARY
Characterization of liquefaction hazard presented in this report requires preparation of maps that delineate areas underlain by potentially liquefiable sediment. The following were collected or generated for this evaluation:
• Existing geologic maps were used to provide an accurate representation of the spatial distribution of Quaternary deposits in the study area. Geologic units that generally are susceptible to liquefaction include late Quaternary alluvial and fluvial sedimentary deposits and artificial fill
• Construction of shallow ground-water maps showing the historically highest known ground-water levels
• Quantitative analysis of geotechnical data to evaluate liquefaction potential of deposits

2003 SEISMIC HAZARD ZONE REPORT FOR THE RICHMOND QUADRANGLE 5
• Information on potential ground shaking intensity based on CGS probabilistic shaking maps
The data collected for this evaluation were processed into a series of geographic information system (GIS) layers using commercially available software. The liquefaction zone map was derived from a synthesis of these data and according to criteria adopted by the SMGB (DOC, 2000).
SCOPE AND LIMITATIONS
Evaluation for potentially liquefiable soils generally is confined to areas covered by Quaternary (less than about 1.6 million years) sedimentary deposits. Such areas within the Richmond Quadrangle consist mainly of gently sloping alluvial fans and low-lying shoreline regions. CGS’s liquefaction hazard evaluations are based on information on earthquake ground shaking, surface and subsurface lithology, geotechnical soil properties, and ground-water depth, which is gathered from various sources. Although selection of data used in this evaluation was rigorous, the quality of the data used varies. The State of California and the Department of Conservation make no representations or warranties regarding the accuracy of the data obtained from outside sources.
Liquefaction zone maps are intended to prompt more detailed, site-specific geotechnical investigations, as required by the Act. As such, liquefaction zone maps identify areas where the potential for liquefaction is relatively high. They do not predict the amount or direction of liquefaction-related ground displacements, or the amount of damage to facilities that may result from liquefaction. Factors that control liquefaction-induced ground failure are the extent, depth, density, and thickness of liquefiable materials, depth to ground water, rate of drainage, slope gradient, proximity to free faces, and intensity and duration of ground shaking. These factors must be evaluated on a site-specific basis to assess the potential for ground failure at any given project site.
Information developed in the study is presented in two parts: physiographic, geologic, and hydrologic conditions in PART I, and liquefaction and zoning evaluations in PART II.
PART I
PHYSIOGRAPHY
Study Area Location and Physiography
The Richmond 7.5-Minute Quadrangle covers approximately 60 square miles in Alameda, Contra Costa, and San Francisco counties. The boundary between Alameda and Contra Costa counties trends east-northeastward through the center of San Francisco Bay in the southwestern quarter of the quadrangle and bends southeastward within the
CALIFORNIA GEOLOGICAL SURVEY SHZR 070 6
Berkeley Hills on the east side of the quadrangle. Only the Alameda County portion of the quadrangle (approximately 10 square miles or about 17 percent) has been evaluated during the current study.
Parts of the cities of Berkeley and Albany lie within the study area. Albany occupies flatlands along the margin of the bay and includes Albany Hill, whereas Berkeley occupies flatlands along the margin of the bay as well as steep hilly areas in the Berkeley Hills. The flatland areas in Berkeley and Albany are heavily developed for residential and commercial use. Most of the hilly areas in Berkeley also have been developed for residential use. Hillside areas are accessed by a system of steep, winding roads.
Elevations in the map area range from sea level along the shore of San Francisco Bay to more than 1,100 feet in the southwestern corner of the quadrangle. The Berkeley Hills are drained by numerous creeks, which primarily flow westward across the alluvial plain to San Francisco Bay. Cordonices Creek defines the boundary between Albany and Berkeley. El Cerrito Creek, which defines the boundary between Alameda and Contra Costa Counties is also the northern boundary of the current study.
North-trending Interstate highway 80/580 extends along the shoreline of San Francisco Bay from the southern boundary of the quadrangle to the Alameda County line. A network of secondary roads traverses the area. Bay Area Rapid Transit (BART) extends roughly north-south through the cities of Berkeley and Albany, and is east and subparallel to Interstate 80/580.
GEOLOGY
Bedrock and Surficial Geology
Geologic units that generally are susceptible to liquefaction include late Quaternary alluvial and fluvial sedimentary deposits and artificial fill. To evaluate the areal and vertical distribution of shallow Quaternary deposits and to provide information on subsurface geologic, lithologic and engineering properties of the units in the Richmond Quadrangle, digital geologic maps were obtained from the U.S. Geological Survey. These include a Quaternary map by Witter (unpublished) and a map of part of the Oakland metropolitan area (Graymer, 2000). These GIS maps were combined, with minor modifications along the bedrock/Quaternary contact, to form a single, 1:24,000-scale geologic map of the Richmond Quadrangle. The distribution of Quaternary deposits on this map (summarized on Plate 1.1) was used in combination with other data, discussed below, to evaluate liquefaction potential and develop the Seismic Hazard Zone Map.
In the Richmond Quadrangle, Witter (unpublished) mapped 9 Quaternary map units. The methods used by Witter in his mapping of the Richmond Quadrangle are the same as those described by Knudsen and others (2000b). These methods consist of interpretation of topographic maps, aerial photographs, and soil surveys, as well as compiled published and unpublished geologic maps. The ages of deposits are estimated using landform shape, relative geomorphic position, cross cutting relationships, superposition, depth and
2003 SEISMIC HAZARD ZONE REPORT FOR THE RICHMOND QUADRANGLE 7
degree of surface dissection, and relative degree of soil profile development. Table 1.1 compares stratigraphic nomenclature used in Knudsen and others (2000b) and the CGS GIS database, with that of several previous studies performed in northern California.
Within the study area, Quaternary deposits are restricted to the East Bay plain. Topographically higher southeast-sloping Pleistocene alluvial fan surfaces (Qpf, Qof) at the base of the Berkeley Hills are incised by Holocene alluvial deposits (Qhf, Qha) that extend to the historical shoreline of San Francisco Bay. Artificial fill over Bay Mud (afbm) deposits extends from the historical shoreline to the present bay margin along most of the shoreline. Thin deposits of latest Holocene beach sand (Qhbs) are along the shoreline at the Albany/Berkeley border. Cordonices Creek is defined by intermittent artificial stream channel (ac), modern stream channel (Qhc), and artificial fill (af) deposits where culverted or reported.
The bedrock geology of the area is associated with a series of oceanic crust and volcanic arc terranes that were accreted to the continent during Mesozoic and Cenozoic time, and further deformed by transpression along the Hayward Fault Zone during the Cenozoic. The oldest mapped geologic units are rocks of the Jurassic Coast Range Ophiolite (Graymer and others, 1996). Additional units include the Late Jurassic-Early Cretaceous Franciscan Complex, the Late Jurassic-Early Cretaceous Knoxville Formation, the Late Cretaceous Great Valley Sequence, and numerous Tertiary sedimentary and volcanic units. Albany Hill consists of Novato Quarry Terrane sandstone and siltstone. See the earthquake-induced landslide portion (Section 2) of this report for additional descriptions of bedrock geology.

CALIFORNIA GEOLOGICAL SURVEY SHZR 070 8
UNIT Witter (unpublished)
Knudsen and others (2000b)
Helley and Graymer (1997)
Helley and others (1979)
CGS GIS database
Artificial fill af af af af Artificial fill over Bay Mud afbm afbm afbm
Artificial stream channel ac ac Qhasc ac Modern stream channel deposits Qhc Qhc Qhsc Qhsc Qhc
Latest Holocene beach sand Qhbs Qhbs Qhbs
Holocene San Francisco Bay Mud(1) Qhbm Qhbm Qhbm Qhbm Qhbm
Holocene alluvial fan deposits Qhf Qhf Qhaf Qham, Qhac Qhf
Holocene alluvial fan levee deposits Qhl Qhl Qhl Qhl
Latest Pleistocene to Holocene dune sand(1) Qds Qds Qms,Qhms Qps Qds
Latest Pleistocene to Holocene alluvial fan deposits(1)
Qf Qf Qf
Latest Pleistocene alluvial fan deposits Qpf Qpf Qpaf Qpf
Early to late Pleistocene pediment deposits Qop Qop Qop
Notes: (1) Not mapped at surface but unit interpreted in the subsurface.
Table 1.1. Correlation of Quaternary Stratigraphic Nomenclatures Used within the Richmond Quadrangle. For this study, CGS has adopted the nomenclature of Knudsen and others (2000b).
Structural Geology
The Richmond Quadrangle is within the active San Andreas Fault system, which distributes shearing across a complex system of primarily northwest-trending, right-lateral, strike-slip faults that include the San Andreas, Hayward, and Calaveras faults. The Hayward Fault extends northwest-southeast through the eastern part study area. The Calaveras Fault is approximately 15 miles southeast of the eastern border of the quadrangle. The San Andreas Fault is about 16 miles to the southwest of the East Bay shoreline. Historical ground-surface rupturing earthquakes have occurred on all of these faults (Lawson, 1908; Keefer and others, 1980; Hart, 1984). In addition to the previously listed faults, the Concord-Green Valley, Mt. Diablo Thrust, and Greenville faults also will contribute, over the long term, to the release of almost all of the seismic moment in

2003 SEISMIC HAZARD ZONE REPORT FOR THE RICHMOND QUADRANGLE 9
the San Francisco Bay Area (WGCEP, 1999). The Concord-Green Valley, Mt. Diablo Thrust, and Greenville faults are approximately 13, 18, and 32 miles east of the eastern border of the quadrangle, respectively.
ENGINEERING GEOLOGY
Information on subsurface geology and engineering characteristics of unconsolidated deposits was obtained from borehole logs collected from reports on geotechnical and environmental projects. For this investigation, 62 borehole logs were collected from the files of the California Department of Transportation (CalTrans), Alan Kropp and Associates, and Alameda County Water District. Data from these borehole logs were entered into a CGS geotechnical GIS database (Plate 1.2).
Standard Penetration Tests (SPTs) provide a standardized measure of the penetration resistance of geologic deposits and are commonly used as an index of soil density. This in-field test consists of counting the number of blows required to drive a split-spoon sampler (1.375-inch inside diameter) one foot into the soil at the bottom of a borehole at chosen intervals while drilling. The driving force is provided by dropping a 140-pound hammer weight 30 inches. The SPT method is formally defined and specified by the American Society for Testing and Materials in test method D1586 (ASTM, 1999). Recorded blow counts for non-SPT geotechnical sampling where the sampler diameter, hammer weight or drop distance differ from those specified for an SPT (ASTM D1586), are converted to SPT-equivalent blow counts. The actual and converted SPT blow counts are normalized to a common-reference, effective-overburden pressure of one atmosphere (approximately one ton per square foot) and a hammer efficiency of 60 percent using a method described by Seed and Idriss (1982) and Seed and others (1985). This normalized blow count is referred to as (N1)60.
Geotechnical borehole logs provided information on lithologic and engineering characteristics of 529 feet of Holocene materials and 1,250 feet of Pleistocene materials penetrated by boreholes analyzed for this study. Geotechnical characteristics of the Quaternary map units are summarized in Tables 1.2 and 1.3. Analysis of these data leads to recognition of certain characteristics and relationships among the units, including: 1) median values for penetration resistance suggest Holocene materials are less dense and more readily penetrated than Pleistocene materials; 2) penetration resistance values measured from the same map unit can vary considerably; 3) most alluvial fan deposits are fine-grained; and 4) late Pleistocene to Holocene dune sand (Qds) is primarily coarse grained with a wide range of penetration resistance values. Not shown in Tables 1.2 and 1.3 is the frequent occurrence of gravel within units generally of Pleistocene age.
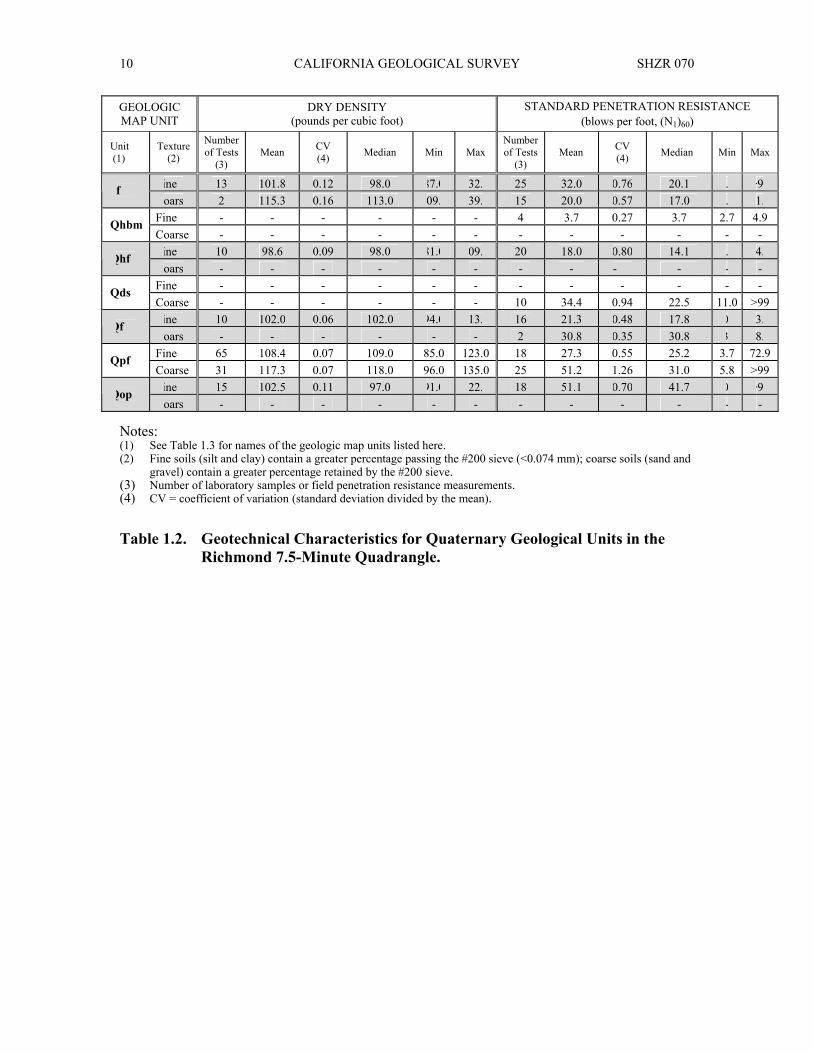
CALIFORNIA GEOLOGICAL SURVEY SHZR 070 10
GEOLOGIC MAP UNIT
DRY DENSITY (pounds per cubic foot)
STANDARD PENETRATION RESISTANCE (blows per foot, (N1)60)
Unit (1)
Texture (2)
Number of Tests
(3) Mean CV
(4) Median Min Max Number of Tests
(3) Mean CV
(4) Median Min Max
Fine 13 101.8 0.12 98.0 87.0 132.0 25 32.0 0.76 20.1 6.6 >99 af Coarse 2 115.3 0.16 113.0 109.0 139.0 15 20.0 0.57 17.0 6.5 41.7 Fine - - - - - - 4 3.7 0.27 3.7 2.7 4.9 Qhbm Coarse - - - - - - - - - - - - Fine 10 98.6 0.09 98.0 81.0 109.0 20 18.0 0.80 14.1 6.9 74.9 Qhf Coarse - - - - - - - - - - - - Fine - - - - - - - - - - - - Qds Coarse - - - - - - 10 34.4 0.94 22.5 11.0 >99 Fine 10 102.0 0.06 102.0 94.0 113.0 16 21.3 0.48 17.8 10.6 43.2 Qf Coarse - - - - - - 2 30.8 0.35 30.8 23.2 38.4 Fine 65 108.4 0.07 109.0 85.0 123.0 18 27.3 0.55 25.2 3.7 72.9 Qpf Coarse 31 117.3 0.07 118.0 96.0 135.0 25 51.2 1.26 31.0 5.8 >99 Fine 15 102.5 0.11 97.0 91.0 122.0 18 51.1 0.70 41.7 10.5 >99 Qop Coarse - - - - - - - - - - - -
Notes: (1) See Table 1.3 for names of the geologic map units listed here. (2) Fine soils (silt and clay) contain a greater percentage passing the #200 sieve (<0.074 mm); coarse soils (sand and
gravel) contain a greater percentage retained by the #200 sieve. (3) Number of laboratory samples or field penetration resistance measurements. (4) CV = coefficient of variation (standard deviation divided by the mean).
Table 1.2. Geotechnical Characteristics for Quaternary Geological Units in the Richmond 7.5-Minute Quadrangle.

2003 SEISMIC HAZARD ZONE REPORT FOR THE RICHMOND QUADRANGLE 11
Geologic Map
Unit (1)
Description
Length of boreholes
penetrating map unit
(feet)
Composition by Soil Type (2)
(Percent of total sediment
column logged)
Depth to ground water (feet) and liquefaction susceptibility category
assigned to geologic unit (3)
<10 10 to 30 30 to 40 >40
af Artificial fill (4) 312 CL 49; SW 11; SC 8; ML 4; other 28 VH-L H-L M-L VL
afbm Artificial fill over Bay Mud 0 n/a VH H M VL
ac Artificial stream channel 0 n/a VH-L H M VL
Qhc Modern stream channel deposits 0 n/a VH H M VL
Qhbs Latest Holocene beach sand 0 n/a VH H M VL
Qhbm Holocene San Francisco Bay mud 126 MH 46; CH 30; CL 24 H M L VL
Qhf Holocene alluvial fan deposits 90 CL 78; ML 9; SC 8; other 5 H M L VL
Qhl Holocene alluvial fan levee deposits 1 GP 100 H M L VL
Qds Latest Pleistocene to Holocene dune sand 60 SP 43; SC 28; SM 22;
SW 7 M L L VL
Qf Late Pleistocene to Holocene alluvial fan deposits 128 CL 71; SM 6; other 23 M L L VL
Qpf Late Pleistocene alluvial fan deposits 982 CL 63; GC 16; SC 12;
other 9 L L VL VL
Qop Early to late Pleistocene pediment deposits 80 CL 54; CH 31; ML 7;
other 8 L L VL VL
Notes: (1) Susceptibility assignments are specific to the materials within the Richmond 7.5-Minute Quadrangle. (2) Unified Soil Classification System. (3) Based on the Simplified Procedure (Seed and Idriss, 1971; Youd and Idriss, 1997) and a small number of
borehole analyses for some units. (4) The liquefaction susceptibility of artificial fill ranges widely, depending largely on the nature of the fill, its age,
and whether it was compacted during emplacement. (5) n/a = not applicable
Table 1.3. Liquefaction Susceptibility for Quaternary Map Units within the Richmond 7.5-Minute Quadrangle. Units indicate relative susceptibility of deposits to liquefaction as a function of material type and ground water depth within that deposit. VH = very high, H = high, M = moderate, L = low, and VL = very low to none.
GROUND WATER
Liquefaction hazard may exist in areas where depth to ground water is 40 feet or less. CGS uses the highest known ground-water levels because water levels during an earthquake cannot be anticipated because of the unpredictable fluctuations caused by natural processes and human activities. A historical-high ground-water map differs from

CALIFORNIA GEOLOGICAL SURVEY SHZR 070 12
most ground-water maps, which show the actual water table at a particular time. Plate 1.2 depicts a hypothetical ground-water table within alluviated areas.
Ground-water conditions were investigated in the Richmond Quadrangle to evaluate the depth to saturated materials. Saturated conditions reduce the effective normal stress, thereby increasing the likelihood of earthquake-induced liquefaction (Youd, 1973). The evaluation was based on first-encountered water noted in geotechnical borehole logs acquired from Alameda County Water District, Alameda County Public Works Department, and the State Water Resources Control Board. The depths to first-encountered unconfined ground water were plotted onto a map of the project area, interpreted, and contoured. Water depths from boreholes known to penetrate confined aquifers were not utilized.
Regional ground-water contours on Plate 1.2 show historical-high water depths, as interpreted from borehole logs from investigations between the 1950’s and 1999. Depths to first-encountered water range from 0 to greater than 10 feet below the ground surface (Plate 1.2). In general, ground water is near the ground surface in the Richmond Quadrangle. It is close to the surface near San Francisco Bay margins and deepest (greater than 10 feet) along the Berkeley Hills range front (Plate 1.2).
PART II
LIQUEFACTION POTENTIAL
Liquefaction may occur in water-saturated sediment during moderate to great earthquakes. Liquefied sediment loses strength and may fail, causing damage to buildings, bridges, and other structures. Many methods for mapping liquefaction hazard have been proposed. Youd (1991) highlights the principal developments and notes some of the widely used criteria. Youd and Perkins (1978) demonstrate the use of geologic criteria as a qualitative characterization of liquefaction susceptibility and introduce the mapping technique of combining a liquefaction susceptibility map and a liquefaction opportunity map to produce a liquefaction potential map. Liquefaction susceptibility is a function of the capacity of sediment to resist liquefaction. Liquefaction opportunity is a function of the potential seismic ground shaking intensity.
The method applied in this study for evaluating liquefaction potential is similar to that of Tinsley and others (1985). Tinsley and others (1985) applied a combination of the techniques used by Seed and others (1983) and Youd and Perkins (1978) for their mapping of liquefaction hazards in the Los Angeles region. CGS’s method combines geotechnical analyses, geologic and hydrologic mapping, and probabilistic earthquake shaking estimates, but follows criteria adopted by the SMGB (DOC, 2000).

2003 SEISMIC HAZARD ZONE REPORT FOR THE RICHMOND QUADRANGLE 13
LIQUEFACTION SUSCEPTIBILITY
Liquefaction susceptibility reflects the relative resistance of a soil to loss of strength when subjected to ground shaking. Physical properties of soil such as sediment grain-size distribution, compaction, cementation, saturation, and depth govern the degree of resistance to liquefaction. Some of these properties can be correlated to the geologic age of a deposit and the environment of deposition. With increasing age, relative density may increase through cementation of the particles or compaction caused by the weight of the overlying sediment. Grain-size characteristics of a soil also influence susceptibility to liquefaction. Sand is more susceptible than silt or gravel, although silt of low plasticity is treated as liquefiable in this investigation. Cohesive soils generally are not considered susceptible to liquefaction. Such soils may be vulnerable to strength loss with remolding and represent a hazard that is not addressed in this investigation. Soil characteristics and processes that result in higher measured penetration resistances generally indicate lower liquefaction susceptibility. Thus, blow count and cone penetrometer values are useful indicators of liquefaction susceptibility.
Saturation is required for liquefaction, and the liquefaction susceptibility of a soil varies with the depth to ground water. Very shallow ground water increases the susceptibility to liquefaction (soil is more likely to liquefy). Soils that lack resistance (susceptible soils) typically are saturated, loose and sandy. Soils resistant to liquefaction include all soil types that are dry, cohesive, or sufficiently dense. CGS’s map inventory of areas containing soils susceptible to liquefaction begins with evaluation of geologic maps and historical occurrences, cross-sections, geotechnical test data, geomorphology, and ground-water hydrology. Soil properties and soil conditions such as type, age, texture, color, and consistency, along with historical depths to ground water are used to identify, characterize, and correlate susceptible soils. Because Quaternary geologic mapping is based on similar soil observations, liquefaction susceptibility maps typically are similar to Quaternary geologic maps. CGS’s qualitative relations among susceptibility, geologic map unit and depth to ground water are summarized in Table 1.3. Most Holocene materials where water levels are within 30 feet of the ground surface have susceptibility assignments of high (H) to very high (VH) (Table 1.3). Holocene San Francisco Bay Mud (Qhbm) primarily is composed of fine-grained material and is assigned moderate susceptibility. However, this unit may contain lenses of material with higher liquefaction susceptibility. All latest Pleistocene and older deposits within 30 feet of the ground surface have low (L) susceptibility assignments except late Pleistocene to Holocene alluvial fan deposits (Qf) and latest Pleistocene to Holocene dune sand (Qds). The Qf unit is relatively dense in the Richmond Quadrangle but may have low densities along with lenses of potentially liquefiable material that could liquefy if saturated (Table 1.3). It is therefore assigned moderate susceptibility. Latest Pleistocene to Holocene dune sand (Qds) is not mapped on the quadrangle but interpreted in the subsurface and has a moderate (M) susceptibility assignment where it is saturated above 10 feet. All other units have low (L) to (VL) susceptibility assignments within 40 feet of the ground surface.
CALIFORNIA GEOLOGICAL SURVEY SHZR 070 14
LIQUEFACTION OPPORTUNITY
Liquefaction opportunity is a measure, expressed in probabilistic terms, of the potential for strong ground shaking. Analyses of in-situ liquefaction resistance require assessment of liquefaction opportunity. The minimum level of seismic excitation to be used for such purposes is the level of peak ground acceleration (PGA) with a 10 percent probability of exceedance over a 50-year period (DOC, 2000). The earthquake magnitude used in CGS’s analysis is the magnitude that contributes most to the calculated PGA for an area.
For the Richmond Quadrangle, PGAs of 0.60g to 0.68g, resulting from an earthquake of magnitude 7.1, were used for liquefaction analyses. The PGA and magnitude values were based on de-aggregation of the probabilistic hazard at the 10 percent in 50-year hazard level (Petersen and others, 1996). See the ground motion section (3) of this report for further details.
Quantitative Liquefaction Analysis
CGS performs quantitative analysis of geotechnical data to evaluate liquefaction potential using the Seed-Idriss Simplified Procedure (Seed and Idriss, 1971; Seed and others, 1983; National Research Council, 1985; Seed and others, 1985; Seed and Harder, 1990; Youd and Idriss, 1997; Youd and others, 2001). Using the Seed-Idriss Simplified Procedure one can calculate soil resistance to liquefaction, expressed in terms of cyclic resistance ratio (CRR), based on SPT results, ground-water level, soil density, moisture content, soil type, and sample depth. CRR values are then compared to calculated earthquake-generated shear stresses expressed in terms of cyclic stress ratio (CSR). The Seed-Idriss Simplified Procedure requires normalizing earthquake loading relative to a M7.5 event for the liquefaction analysis. To accomplish this, CGS’s analysis uses the Idriss magnitude-scaling factor (MSF) (Youd and Idriss, 1997). It is convenient to think in terms of a factor of safety (FS) relative to liquefaction, where: FS = (CRR / CSR) * MSF. FS, therefore, is a quantitative measure of liquefaction potential. CGS uses a factor of safety of 1.0 or less, where CSR equals or exceeds CRR, to indicate the presence of potentially liquefiable soil. While an FS of 1.0 is considered the “trigger” for liquefaction, for a site specific analysis an FS of as much as 1.5 may be appropriate depending on the vulnerability of the site and related structures.
The CGS liquefaction analysis program calculates an FS for each geotechnical sample where blow counts were collected. Typically, multiple samples are collected for each borehole. The program then independently calculates an FS for each non-clay layer that includes at least one penetration test using the minimum (N1)60 value for that layer. The minimum FS value of the layers penetrated by the borehole is used to determine the liquefaction potential for each borehole location. The reliability of FS values varies according to the quality of the geotechnical data. FS, as well as other considerations such as slope, presence of free faces, and thickness and depth of potentially liquefiable soil, are evaluated in order to construct liquefaction potential maps, which are then used to make a map showing zones of required investigation.
2003 SEISMIC HAZARD ZONE REPORT FOR THE RICHMOND QUADRANGLE 15
Of the 62 geotechnical borehole logs reviewed in this study (Plate 1.2), most include blow-count data from SPTs or from penetration tests that allow reasonable blow count translations to SPT-equivalent values. Non-SPT values, such as those resulting from the use of 2-inch or 2½-inch inside-diameter ring samplers, were translated to SPT-equivalent values if reasonable factors could be used in conversion calculations. The reliability of the SPT-equivalent values varies. Therefore, they are weighted and used in a more qualitative manner. Few borehole logs, however, include all of the information (e.g. soil density, moisture content, sieve analysis, etc.) required for an ideal Seed-Idriss Simplified Procedure. For boreholes having acceptable penetration tests, liquefaction analysis is performed using recorded density, moisture, and sieve test values or using averaged test values of similar materials.
The Seed-Idriss Simplified Procedure for liquefaction evaluation was developed primarily for clean sand and silty sand. As described above, results depend greatly on accurate evaluation of in-situ soil density as measured by the number of soil penetration blow counts using an SPT sampler. However, many of the Holocene alluvial deposits in the study area contain a significant amount of gravel. In the past, gravelly soils were considered not to be susceptible to liquefaction because the high permeability of these soils presumably would allow the dissipation of pore pressures before liquefaction could occur. However, liquefaction in gravelly soils has been observed during earthquakes, and recent laboratory studies have shown that gravelly soils are susceptible to liquefaction (Ishihara, 1985; Harder and Seed, 1986; Budiman and Mohammadi, 1995; Evans and Zhou, 1995; and Sy and others, 1995). SPT-derived density measurements in gravelly soils are unreliable and generally too high. They are likely to lead to overestimation of the density of the soil and, therefore, result in an underestimation of the liquefaction susceptibility. To identify potentially liquefiable units where the N values appear to have been affected by gravel content, correlations were made with boreholes in the same unit where the N values do not appear to have been affected by gravel content.
LIQUEFACTION ZONES
Criteria for Zoning
Areas underlain by materials susceptible to liquefaction during an earthquake were included in liquefaction zones using criteria developed by the Seismic Hazards Mapping Act Advisory Committee and adopted by the SMGB (DOC, 2000). Under those guideline criteria, liquefaction zones are areas meeting one or more of the following:
1. Areas known to have experienced liquefaction during historical earthquakes
2. All areas of uncompacted artificial fill containing liquefaction-susceptible material that are saturated, nearly saturated, or may be expected to become saturated
3. Areas where sufficient existing geotechnical data and analyses indicate that the soils are potentially liquefiable
4. Areas where existing geotechnical data are insufficient

CALIFORNIA GEOLOGICAL SURVEY SHZR 070 16
In areas of limited or no geotechnical data, susceptibility zones may be identified by geologic criteria as follows:
a) Areas containing soil deposits of late Holocene age (current river channels and their historic floodplains, marshes and estuaries), where the M7.5-weighted peak acceleration that has a 10 percent probability of being exceeded in 50 years is greater than or equal to 0.10 g and the water table is less than 40 feet below the ground surface; or
b) Areas containing soil deposits of Holocene age (less than 11,000 years), where the M7.5-weighted peak acceleration that has a 10 percent probability of being exceeded in 50 years is greater than or equal to 0.20 g and the historical high water table is less than or equal to 30 feet below the ground surface; or
c) Areas containing soil deposits of latest Pleistocene age (11,000 to 15,000 years), where the M7.5-weighted peak acceleration that has a 10 percent probability of being exceeded in 50 years is greater than or equal to 0.30 g and the historical high water table is less than or equal to 20 feet below the ground surface.
Application of SMGB criteria to liquefaction zoning in the Richmond Quadrangle is summarized below.
Areas of Past Liquefaction
Knudsen and others (2000b) compiled data from Tinsley and others (1998) and Youd and Hoose (1978) for earthquakes in the San Francisco Bay region. Tinsley and others (1998) compiled observations of evidence for liquefaction for the 1989 Loma Prieta earthquake; Youd and Hoose (1978) compiled them for earlier earthquakes, including 1868 Hayward and 1906 San Andreas. The Knudsen and others (2000b) digital database differs from earlier compilation efforts in that the observations were located on a 1:24,000-scale base map rather than the smaller scale base maps used in the earlier publications. Sites were reevaluated and some single sites were broken into two or more where the greater base map scale allowed. Within the Richmond Quadrangle, historical liquefaction is not documented by either compiler.
Artificial Fills
In the Richmond Quadrangle, artificial fill over Bay Mud (afbm) is extensive as a result of the practice of infilling of the natural bay margins. Because this unit has hosted a large fraction of historical occurrences (Knudsen and others, 2000a), all areas mapped as afbm are included in the zone of required investigation.
Areas with Sufficient Existing Geotechnical Data
Borehole logs that include penetration test data and sufficiently detailed lithologic descriptions were used to evaluate liquefaction potential as estimated by the Seed-Idriss Simplified Procedure. In Holocene alluvial deposits (Qhf, Qhl), and artificial fill over Bay Mud (afbm) that cover much of flatland area, most of the borehole logs that were

2003 SEISMIC HAZARD ZONE REPORT FOR THE RICHMOND QUADRANGLE 17
analyzed using the Seed-Idriss Simplified Procedure contain sediment layers that may liquefy under the expected earthquake loading. These areas containing saturated potentially liquefiable material are included in the zone.
Geotechnical data for Holocene alluvial fan deposits (Qhf) in the area of Albany and Berkeley indicate a thin mantle of Holocene material over Pleistocene deposits. The liquefaction zone boundary extending from the Alameda/Contra Costa County boundary (excluding the sections along stream channels) is the surface projection of the contact between ground water and the base of Holocene fan deposits (Qhf). The areas excluded from the zone occur where lower density, younger material is above the water table (i.e. unsaturated) and only denser Pleistocene material is saturated.
Areas with Insufficient Existing Geotechnical Data
Adequate geotechnical borehole information for artificial and modern stream channel deposits (ac and Qhc) generally is lacking in most areas. These deposits, therefore, are evaluated and included or excluded from the liquefaction zone for reasons presented in criterion 4-a, above. In the Richmond Quadrangle, ground water and ground motions are sufficiently high to include these Holocene units within the liquefaction zone.
ACKNOWLEDGMENTS
The authors would like to thank personnel with the Cities of Albany and Berkeley for their assistance with data collection efforts. Rob Witter from William Lettis and Associates provided geologic mapping and discussion. Alan Kropp of Alan Kropp and Associates provided access to his files. Tom Geisler at the State Water Resources Control Board supplied ground-water data. Tom Holzer and Michael Bennett of the U.S. Geological Survey provided CPT data and important geologic discussion and information. At CGS, special thanks to Ralph Loyd and Al Barrows for their technical review; to Marvin Woods, Teri McGuire, Bob Moskovitz and Barbara Wanish for their GIS operations support; to Luis Acedo for assistance with input of geotechnical borehole data into the database; to Christopher Wills for geologic investigation; and to Ross Martin and Barbara Wanish for their help with preparation of the graphical liquefaction hazard zone map for this report.
REFERENCES
American Society for Testing and Materials, 1999, Standard test method for penetration test and split-barrel sampling of soils, Test Method D1586-99, in Annual Book of ASTM Standards, v. 4.08.
Budiman, J.S. and Mohammadi, Jamshid, 1995, Effect of large inclusions on liquefaction of sands, in Evans, M.D. and Fragaszy, R.J., editors, Static and Dynamic properties

CALIFORNIA GEOLOGICAL SURVEY SHZR 070 18
of Gravelly Soils: American Society of Civil Engineers Geotechnical Special Publication no. 56, p. 48-63.
California Department of Conservation, Division of Mines and Geology, 1997, Guidelines for evaluating and mitigating seismic hazards in California, Special Publication 117, 74 p.
California Department of Conservation, Division of Mines and Geology, 2000, Recommended criteria for delineating seismic hazard zones in California, Special Publication 118, 12 p.
Evans, M.D. and Zhou, Shengping, 1995, Liquefaction behaviour of sand-gravel composites: American Society of Civil Engineers, Journal of Geotechnical Engineering, v. 121, no. 3, p. 287-298.
Graymer, R.W., 2000, Geologic map and map database of the Oakland metropolitan area, Alameda, Contra Costa, and San Francisco counties, California: U.S. Geological Survey Miscellaneous Field Studies MF-2342, scale 1:24,000, Version 1.0.
Graymer, R.W., Jones, D.L. and Brabb, E.E., 1996, Preliminary geologic map emphasizing bedrock formations in Alameda County, California: a digital database: U.S. Geological Survey Open-File Report 96-252.
Harder, L.F. and Seed, H.B., 1986, Determination of penetration resistance for coarse-grained soils using the Becker hammer drill: University of California at Berkeley, College of Engineering, Earthquake Engineering Research Center, report no. UCB/EERC-86/06, 126 p.
Hart, E.W., 1984, Evidence of surface faulting associated with Morgan Hill earthquake of April 24, 1984 in The 1984 Morgan Hill, California earthquake: Department of Conservation, Division of Mines and Geology Special Publication 68, p. 161-173.
Helley, E.J. and Graymer, R.W., 1997, Quaternary Geology of Alameda County, and parts of Contra Costa, Santa Clara, San Mateo, San Francisco, Stanislaus, and San Joaquin counties, California: a digital database: U.S. Geological Survey Open-File Report 97-97, 2 sheets, scale 1:100,000.
Helley, E.J., Lajoie, K.R., Spangle, W.E. and Blair, M.L., 1979, Flatland deposits of the San Francisco Bay Region, California – their geology and engineering properties, and their importance to comprehensive planning: U.S. Geological Survey Professional Paper 943, 88 p.
Ishihara, Kenji, 1985, Stability of natural deposits during earthquakes, in Proceedings of the Eleventh International Conference on Soil Mechanics and Foundation Engineering, San Francisco, v. 1, p. 321-376.

2003 SEISMIC HAZARD ZONE REPORT FOR THE RICHMOND QUADRANGLE 19
Keefer, D.K., Wilson, R.C. and Tannaci, N.E., 1980, Reconnaissance report on ground failures and ground cracks resulting from the Coyote Lake, California, earthquake of August 6, 1979: U.S. Geological Survey Open-File Report 80-139, 14 p.
Knudsen, K.L., DeLisle, M.J., Clahan, K.B., Mattison, E., Perkins, J.B., and Wentworth, C.M., 2000a, Applicability of Quaternary geologic mapping in assessing earthquake-induced liquefaction hazard: San Francisco Bay Area: Earthquake Engineering Research Institute, Proceedings of the Sixth International Conference on Seismic Zonation (6ICSZ), November 12-15, Palm Springs, California, CD-ROM, 6 p.
Knudsen, K.L., Sowers, J.M., Witter, R.C., Wentworth, C.M., Helley, E.J., Nicholson, R.S., Wright, H.M. and Brown, K.H., 2000b, Preliminary maps of Quaternary deposits and liquefaction susceptibility, nine-county San Francisco Bay region, California: a digital database: U.S. Geological Survey Open-File Report 00-444.
Lawson, A.C., chairman, 1908, The earthquake of April 18, 1906, Report of the State Earthquake Investigation Commission: Carnegie Institution of Washington, Washington D.C., v. I, 451 p.
National Research Council, 1985, Liquefaction of soils during earthquakes: National Research Council Special Publication, Committee on Earthquake Engineering, National Academy Press, Washington, D.C., 240 p.
Petersen, M.D., Bryant, W.A., Cramer, C.H., Cao, Tianqing, Reichle, M.S., Frankel, A.D., Lienkaemper, J.J., McCrory, P.A. and Schwartz, D.P., 1996, Probabilistic seismic hazard assessment for the State of California: California Department of Conservation, Division of Mines and Geology Open File Report 96-08; also U.S. Geological Survey Open-File Report 96-706, 33 p.
Seed, H.B. and Idriss, I.M., 1971, Simplified procedure for evaluating soil liquefaction potential: Journal of the Soil Mechanics and Foundations Division of ASCE, v. 97: SM9, p. 1,249-1,273.
Seed, H.B. and Idriss, I.M., 1982, Ground motions and soil liquefaction during earthquakes: Monograph Series, Earthquake Engineering Research Institute, Berkeley, California, 134 p.
Seed, H.B., Idriss, I.M. and Arango, Ignacio, 1983, Evaluation of liquefaction potential using field performance data: Journal of Geotechnical Engineering, v. 109, no. 3, p. 458-482.
Seed, H.B., Tokimatsu, Kohji, Harder, L.F., and Chung, R.M., 1985, Influence of SPT procedures in soil liquefaction resistance evaluations: Journal of Geotechnical Engineering, ASCE, v. 111, no. 12, p. 1,425-1,445.
Seed, R.B. and Harder, L.F., 1990, SPT-based analysis of cyclic pore pressure generation and undrained residual strength: Proceedings of the H. Bolton Seed Memorial Symposium, v. 2, p. 351-376.
CALIFORNIA GEOLOGICAL SURVEY SHZR 070 20
Smith, T.C., 1996, Preliminary maps of seismic hazard zones and draft guidelines for evaluating and mitigating seismic hazards: California Geology, v. 49, no. 6, p. 147-150.
Southern California Earthquake Center, 1999, Recommended procedures for implementation of DMG Special Publication 117 guidelines for analyzing and mitigating liquefaction in California: Southern California Earthquake Center, University of Southern California, 63 p.
Sy, Alex, Campanella, R.G. and Stewart, R.A., 1995, BPT-SPT correlations for evaluations of liquefaction resistance in gravelly soils, in Evans, M.D. and Fragaszy, R.J., editors, Static and Dynamic Properties of Gravelly Soils: American Society of Civil Engineers Geotechnical Special Publication no. 56, p. 1-19.
Tinsley, J.C. III, Egan, J.A., Kayen, R.E., Bennett, M.J., Kropp, Alan and Holzer, T.L., 1998, Appendix: maps and descriptions of liquefaction and associated effects, in Holzer, T.L., ed, The Loma Prieta, California, Earthquake of October 17, 1989—liquefaction: U.S. Geological Survey Professional Paper 1551-B, p. B287-B314, map scales 1:100,000 and 1:24,000.
Tinsley, J.C., Youd, T.L., Perkins, D.M. and Chen, A.T.F., 1985, Evaluating liquefaction potential, in Ziony, J.I., editor, Evaluating earthquake hazards in the Los Angeles region — An earth science perspective: U.S. Geological Survey Professional Paper 1360, p. 263-316.
WGCEP, 1999, Earthquake probabilities in the San Francisco Bay Region: 2000 to 2030 - A Summary of Findings: U.S. Geological Survey Open-File Report 99-517, Online Version 1.0.
Witter, R.C. unpublished Quaternary geologic mapping of the Oakland East 7.5-Minute Quadrangle, to be incorporated in revision to: Knudsen, K.L., Sowers, J.M., Witter, R.C., Wentworth, C.M., Helley, E.J., Nicholson, R.S., Wright, H.M., and Brown, K.H., 2000, Preliminary maps of Quaternary deposits and liquefaction susceptibility, nine-county San Francisco Bay region, California: a digital database, U.S. Geological Survey, Open-File Report 00-444.
Youd, T.L., 1973, Liquefaction, flow and associated ground failure: U.S. Geological Survey Circular 688, 12 p.
Youd, T.L., 1991, Mapping of earthquake-induced liquefaction for seismic zonation: Earthquake Engineering Research Institute, Proceedings, Fourth International Conference on Seismic Zonation, v. 1, p. 111-138.
Youd, T.L., and Hoose, S.N, 1978, Historic ground failures in northern California triggered by earthquakes: U.S. Geological Survey Professional Paper 993, map scales 1:250,000 and 1:24,000.

2003 SEISMIC HAZARD ZONE REPORT FOR THE RICHMOND QUADRANGLE 21
Youd, T.L. and Idriss, I.M., 1997, editors, Proceedings of the NCEER workshop on evaluation of liquefaction resistance of soils: National Center for Earthquake Engineering Research Technical Report NCEER-97-0022, 276 p.
Youd, T.L., Idriss, I.M., Andrus, R.D., Arango, I., Castro, G., Christian, J.T., Dobry, R., Finn, W.D.L., Harder, L.F. Jr., Hynes, M.E., Ishihara, K., Koester, J.P., Liao, S.S.C., Marcusson, W.F., Martin, G.R., Mitchell, J.K., Moriwaki, Y., Power, M.S., Robertson, P.K., Seed, R.B. and Stokoe, K.H., 2001, Liquefaction resistance of soils; Summary report from the 1996 NCEER/NSF workshops on evaluation of liquefaction resistance of soils: Journal of Geotechnical and Geoenvironmental Engineering, October 2001, p. 817-833.
Youd, T.L. and Perkins, D.M., 1978, Mapping liquefaction-induced ground failure potential: Journal of Geotechnical Engineering, v. 104, p. 433-446.

2003 SEISMIC HAZARD ZONE REPORT FOR THE RICHMOND QUADRANGLE 23
SECTION 2 EARTHQUAKE-INDUCED LANDSLIDE
EVALUATION REPORT
Earthquake-Induced Landslide Zones in the Richmond 7.5-Minute Quadrangle,
Alameda County, California
By Timothy P. McCrink and Mark O. Wiegers
California Department of Conservation California Geological Survey
PURPOSE
The Seismic Hazards Mapping Act (the Act) of 1990 (Public Resources Code, Chapter 7.8, Division 2) directs the California Department of Conservation (DOC), Division of Mines and Geology [now called California Geological Survey (CGS)] to delineate Seismic Hazard Zones. The purpose of the Act is to reduce the threat to public health and safety and to minimize the loss of life and property by identifying and mitigating seismic hazards. Cities, counties, and state agencies are directed to use seismic hazard zone maps prepared by CGS in their land-use planning and permitting processes. The Act requires that site-specific geotechnical investigations be performed prior to permitting most urban development projects within the hazard zones. Evaluation and mitigation of seismic hazards are to be conducted under guidelines established by the California State Mining and Geology Board (DOC, 1997). The text of this report is on the Internet at http://gmw.consrv.ca.gov/shmp/webdocs/sp117.pdf
Following the release of DMG Special Publication 117 (DOC, 1997), agencies in the Los Angeles metropolitan region sought more definitive guidance in the review of geotechnical investigations addressing landslide hazards. The agencies made their

CALIFORNIA GEOLOGICAL SURVEY SHZR 070 24
request through the Geotechnical Engineering Group of the Los Angeles Section of the American Society of Civil Engineers (ASCE). This group convened an implementation committee in 1998 under the auspices of the Southern California Earthquake Center (SCEC). The committee, which consisted of practicing geotechnical engineers and engineering geologists, released an overview of the practice of landslide analysis, evaluation, and mitigation techniques (SCEC, 2002). This text is also on the Internet at: http://www.scec.org/
This section of the evaluation report summarizes seismic hazard zone mapping for earthquake-induced landslides in the Alameda County portion of the Richmond 7.5-Minute Quadrangle. Section 1 (addressing liquefaction) and Section 3 (addressing earthquake shaking), complete the report, which is one of a series that summarizes the preparation of seismic hazard zone maps within the state (Smith, 1996). Additional information on seismic hazard zone mapping in California can be accessed on the California Geological Survey's Internet page: http://www.conservation.ca.gov/CGS/index.htm
BACKGROUND
Landslides triggered by earthquakes historically have been a significant cause of earthquake damage. In California, large earthquakes such as the 1971 San Fernando, 1989 Loma Prieta, and 1994 Northridge earthquakes triggered landslides that were responsible for destroying or damaging numerous structures, blocking major transportation corridors, and damaging life-line infrastructure. Areas that are most susceptible to earthquake-induced landslides are steep slopes in poorly cemented or highly fractured rocks, areas underlain by loose, weak soils, and areas on or adjacent to existing landslide deposits. These geologic and terrain conditions exist in many parts of California, including numerous hillside areas that have already been developed or are likely to be developed in the future. The opportunity for strong earthquake ground shaking is high in many parts of California because of the presence of numerous active faults. The combination of these factors constitutes a significant seismic hazard throughout much of California, including the hillside areas of Berkeley and Albany.
METHODS SUMMARY
The mapping of earthquake-induced landslide hazard zones presented in this report is based on the best available terrain, geologic, geotechnical, and seismological data. If unavailable or significantly outdated, new forms of these data were compiled or generated specifically for this project. The following were collected or generated for this evaluation:
• Digital terrain data were used to provide an up-to-date representation of slope gradient and slope aspect in the study area

2003 SEISMIC HAZARD ZONE REPORT FOR THE RICHMOND QUADRANGLE 25
• Geologic mapping was used to provide an accurate representation of the spatial distribution of geologic materials in the study area. In addition, a map of existing landslides, whether triggered by earthquakes or not, was prepared
• Geotechnical laboratory test data were collected and statistically analyzed to quantitatively characterize the strength properties and dynamic slope stability of geologic materials in the study area
• Seismological data in the form of CGS probabilistic shaking maps and catalogs of strong-motion records were used to characterize future earthquake shaking within the mapped area
The data collected for this evaluation were processed into a series of GIS layers using commercially available software. A slope stability analysis was performed using the Newmark method of analysis (Newmark, 1965), resulting in a map of landslide hazard potential. The earthquake-induced landslide hazard zone was derived from the landslide hazard potential map according to criteria developed in a CGS pilot study (McCrink and Real, 1996; McCrink, 2001) and adopted by the State Mining and Geology Board (DOC, 2000).
SCOPE AND LIMITATIONS
The methodology used to make this map is based on earthquake ground-shaking estimates, geologic material-strength characteristics and slope gradient. These data are gathered from a variety of outside sources. Although the selection of data used in this evaluation was rigorous, the quality of the data is variable. The State of California and the Department of Conservation make no representations or warranties regarding the accuracy of the data gathered from outside sources.
Earthquake-induced landslide zone maps are intended to prompt more detailed, site-specific geotechnical investigations as required by the Act. As such, these zone maps identify areas where the potential for earthquake-induced landslides is relatively high. Due to limitations in methodology, it should be noted that these zone maps do not necessarily capture all potential earthquake-induced landslide hazards. Earthquake-induced ground failures that are not addressed by this map include those associated with ridge-top spreading and shattered ridges. It should also be noted that no attempt has been made to map potential run-out areas of triggered landslides. It is possible that such run-out areas may extend beyond the zone boundaries. The potential for ground failure resulting from liquefaction-induced lateral spreading of alluvial materials, considered by some to be a form of landsliding, is not specifically addressed by the earthquake-induced landslide zone or this report. See Section 1, Liquefaction Evaluation Report, for more information on the delineation of liquefaction zones.
This map covers only the portion of the Richmond Quadrangle that lies within Alameda County. Seismic Hazard Zone maps will be prepared for the Contra Costa County portion at a later date.

CALIFORNIA GEOLOGICAL SURVEY SHZR 070 26
The remainder of this report describes in detail the mapping data and processes used to prepare the earthquake-induced landslide zone map in the Almaeda County portion of the Richmond Quadrangle. The information is presented in two parts. Part I covers physiographic, geologic and engineering geologic conditions in the study area. Part II covers the preparation of landslide hazard potential and landslide zone maps.
PART I
PHYSIOGRAPHY
Study Area Location and Physiography
The northern part of the City of Berkeley and all of the City of Albany lie in the southeastern part of the Richmond Quadrangle. These cities are in the northwestern part of Alameda County. The southern and southeastern parts of the City of Berkeley extend into the adjoining Oakland East, Oakland West and Briones Valley quadrangles.
Berkeley and Albany lie on the eastern shore of San Francisco Bay. Berkeley extends eastward across a very gently sloping alluvial plain into the Berkeley Hills to the east. Albany is smaller and lies mostly on the alluvial plain except for Albany Hill near the shoreline. Albany Hill is an isolated, rounded hill that rises about 300 feet above the surrounding plain.
The alluvial plain in west Berkeley and Albany is heavily developed for residential and commercial use. Some of the developed area has been established for a century or more. The Berkeley Hills also have been developed for residential use over a similar period. The hills are characterized by many older homes that lie along a system of narrow, winding streets. The eastern side of Berkeley extends up and over the crest of the Berkeley Hills and is bordered by Wildcat Canyon. Wildcat Canyon has steep wooded and grassy slopes that are managed as park lands in Tilden and Wildcat Canyon regional parks. Single family residences and multistory apartment buildings flank Albany Hill. The crest of the hill is preserved as a park and is covered by a thick stand of eucalyptus trees.
The Berkeley Hills are characterized by steep, benched terrain that was formed by a combination of deep-seated landsliding, erosion and tectonic movement. Rocky outcrops protrude in some areas. Some of these outcrops lie within small parks, for example Indian Rock Park and Great Stone Face Park. Numerous steep ravines that contain the headwaters of creeks that extend westward across the alluvial plain to San Francisco Bay cut the slopes. Major creeks in the study area are Codornices Creek, which forms the boundary between Berkeley and Albany, and Cerrito Creek, which forms the boundary between Richmond and Albany and Berkeley. The highest point in the study area is on the crest of the Berkeley Hills at about 1200 feet above sea level.
2003 SEISMIC HAZARD ZONE REPORT FOR THE RICHMOND QUADRANGLE 27
Digital Terrain Data
The calculation of slope gradient is an essential part of the evaluation of slope stability under earthquake conditions. An accurate slope gradient calculation begins with an up-to-date map representation of the earth’s surface in the form of a digital topographic map. Within the Richmond Quadrangle, a Level 2 digital elevation model (DEM) was obtained from the USGS (U.S. Geological Survey, 1993). This DEM, prepared from the 7.5-minute quadrangle topographic contours based on 1946 aerial photography, has a 10-meter horizontal resolution and a 7.5-meter vertical accuracy.
A slope map was made from the DEM using a third-order, finite difference, center-weighted algorithm (Horn, 1981). The DEM was also used to make a slope aspect map. The manner in which the slope and aspect maps were used to prepare the zone map will be described in subsequent sections of this report.
GEOLOGY
Bedrock and Surficial Geology
The primary source of bedrock geology used in this slope stability evaluation is the geologic map and map database of the Oakland metropolitan area by Graymer (2000). This digital geologic database was compiled at a resolution of 1:24,000 from previously published reports and from new mapping and field checking by Graymer (2000). A geologic map by Dibblee (1980) was also reviewed. Witter (unpublished) prepared a Quaternary surficial geologic map of the Richmond Quadrangle at a scale of 1:24,000. Surficial geology is discussed in detail in Section 1 of this report. CGS geologists merged the digital surficial and bedrock geologic maps, and contacts between surficial and bedrock units were modified in some areas to resolve differences between the two maps. Geologic field reconnaissance was performed to assist in adjusting contacts and to review the lithology and structure of the various geologic units.
The geology of the Berkeley Hills consists of two highly deformed Mesozoic basement assemblages that are unconformably overlain by Tertiary sedimentary and volcanic rocks and unconsolidated Quaternary deposits. These two Mesozoic basement complexes are the Great Valley Complex and the Franciscan Complex (Graymer, 2000).
The Great Valley Complex includes the Coast Range Ophiolite, which is composed of serpentinite, gabbro, diabase, basalt and keratophyre (altered silicic volcanic rock), and the Great Valley Sequence, which is composed of sandstone, conglomerate and shale of Jurassic and Cretaceous age. The ophiolitic rocks are the remnants of arc-related ocean crust (Graymer, 2000). The Great Valley Sequence consists of turbidites that were deposited on top of the crustal rocks. The Great Valley Complex rocks exposed in the map area have been assigned to the Del Puerto Terrane by Graymer (2000) based on the presence of abundant silicic volcanic rock (keratophyre). The type area for the Del Puerto Terrane is on the eastern side of the Diablo Range.

CALIFORNIA GEOLOGICAL SURVEY SHZR 070 28
The Franciscan Complex is composed of weakly to strongly metamorphosed graywacke, basalt, argillite, chert and other rocks. The Franciscan Complex was accreted beneath the Great Valley Complex by subduction. During subduction, the Franciscan rocks were intensely sheared and tectonically mixed, producing a melange of small to large blocks of various rock types embedded in a matrix of crushed rock material.
In recent years, bedrock units in much of the San Francisco Bay area have been subdivided into individual stratigraphic assemblages that lie within discreet fault-bounded bedrock structural blocks. The concept of statigraphic assemblages in the bay area was introduced by Jones and Curtis (1991) and further defined by Graymer and others (1994). Individual stratigraphic assemblages are considered to have originated in separate depositional basins or in different parts of large basins and were later juxtaposed against one another by large offsets on Tertiary strike-slip and dip-slip faults. Each of these fault-bounded stratigraphic assemblages differs from its neighbors in depositional and deformational history. The study area is underlain by three of these stratigraphic assemblages: the Berkeley Hills Assemblage, the Hayward-Oakland Hills Assemblage and an assemblage of Franciscan rocks with no Tertiary cover.
The Berkeley Hills Assemblage is exposed on the east side of the Hayward Fault. It consists of Cretaceous through Miocene sedimentary and volcanic rocks. It is distinguished from other assemblages by the presence of a thick stack of late Miocene volcanic rocks (the Moraga Formation and the Bald Peak Basalt).
The Hayward-Oakland Hills Assemblage contains rocks of the Coast Range Ophiolite and the Great Valley Sequence with no Tertiary cover. This assemblage contains keratophyre of the Del Puerto Terrane that previously was mapped as the Northbrae Rhyolite in Berkeley and the Leona Rhyolite in the Oakland and Hayward areas.
Franciscan rocks form the basement on the west side of the Hayward Fault and are directly overlain with angular unconformity by Quaternary deposits with no intervening Tertiary strata. Faulted bodies of Franciscan rock are also found along the east side of the Hayward fault in the map area.
The following rock types are exposed in the map area. Franciscan Complex melange (KJfm) of Cretaceous and/or Late Jurassic age consists of sheared argillite, graywacke and green tuff with blocks of graywacke, chert, shale, greenstone basalt, and high-grade metamorphic blocks (glaucophane schist, amphibolite and eclogite). An individual block of graywacke (fs) is included in the melange in the map area. The Franciscan Complex also includes an undivided sandstone member (KJfs) of Late Cretaceous to Late Jurassic age (Graymer, 2000) consisting of graywacke and meta-graywacke. Sandstone of the Novato Quarry Terrane (Kfn) of the Franciscan Complex is exposed on Albany Hill. This unit consists of fine- to coarse-grained, mica-bearing lithic wacke (Graymer, 2000).
Several rock types of the Coast Range Ophiolite are exposed in the map area. Serpentinite (sp) consists mainly of sheared serpentinite but also includes massive serpentinized harzburgite. In some places, the serpentinite has been altered to silica carbonate rock (sc). Keratophyre and quartz keratophyre of Late Jurassic age (Jsv)

2003 SEISMIC HAZARD ZONE REPORT FOR THE RICHMOND QUADRANGLE 29
consists of highly altered intermediate to silicic volcanic and hypabyssal rocks (Graymer, 2000). This unit was previously mapped as the Leona and Northbrae rhyolite.
Two units of the Great Valley Sequence are mapped in the study area (Graymer, 2000). Unnamed shale and sandstone of Cretaceous age is designated as (Ku). The Knoxville Formation (KJk) consists of silt and clay shale with thin interbeds of sandstone.
The Orinda Formation (Tor) of late Miocene age consists of non-marine pebble to boulder conglomerate, conglomeratic sandstone, fine- to coarse-grained sandstone, siltstone and mudstone.
The Moraga Formation (Tmb) consists of late Miocene basalt and andesite flows with minor rhyolite tuff.
Structural Geology
The primary geologic structure in the study area is the Hayward Fault, an active right-lateral strike-slip fault with an estimated slip rate of about 9 mm per year. The Hayward Fault is actively creeping in Berkeley and other East Bay cities, as manifested by offset curbs, streets, buildings and other structures in numerous locations. Lienkaemper (1992) has mapped the inferred active trace of the Hayward Fault in detail. Various other traces are shown on earlier geologic maps (Smith, 1980; Dibblee, 1980; Radbruch-Hall, 1974). Associated with the main trace are numerous splays and subsidiary traces that may accommodate secondary movements or that may be slightly older abandoned traces. Bedrock units in the vicinity of the Hayward Fault zone have been complexly offset and juxtaposed along the main trace and it’s associated subsidiary traces.
East of the Hayward Fault, an older west-vergent reverse or thrust fault juxtaposes Mesozoic rocks of the Great Valley Complex and Franciscan Complex against Miocene sedimentary and volcanic rocks of the Orinda and Moraga formations. This fault marks the west boundary of the of the Berkeley Hills stratigraphic assemblage (Graymer, 2000).
Preserved folding in the study area is confined to the Tertiary rocks of the Berkeley Hills Assemblage. A small northwest-trending syncline has been mapped in the study area just west of the crest of the Berkeley Hills (Graymer, 2000). Beds of the Orinda and Moraga formations dip southwest on the east limb of this syncline and northeast on the west limb. Folding is not preserved in the Mesozoic rocks of the Coast Range Complex or Franciscan Complex in the study area.
Landslide Inventory
As a part of the geologic data compilation, an inventory of existing landslides within Alameda County portion of the Richmond Quadrangle was prepared. Landslides outside of Alameda County were not mapped in this study. The landslide inventory was prepared by field reconnaissance, analysis of stereo-paired aerial photographs and a review of previously published landslide mapping. Landslides were mapped at a scale of 1:24,000. For each landslide included on the map a number of characteristics (attributes) were compiled. These characteristics include the confidence of interpretation (definite,

CALIFORNIA GEOLOGICAL SURVEY SHZR 070 30
probable and questionable) and other properties, such as activity, thickness, and associated geologic unit(s). Landslides rated as definite and probable were carried into the landslide zoning as described later in this report. Landslides rated as questionable were not carried into the slope stability analysis due to the uncertainty of their existence. The completed landslide map was scanned, digitized, and the attributes were compiled in a database. A version of this landslide inventory is included with Plate 2.1.
The Berkeley Hills within the City of Berkeley are underlain by numerous large, deep-seated landslides, some of which have been active and have distressed buildings, streets and utilities since development of the hills began more than a century ago. Earth movements have usually not been extensive enough to cause complete destruction of homes and structures except in a few cases. However, many homes, streets and utilities have required substantial repairs and structural upgrades to repair damage caused by earth movement.
Topographically, the Berkeley Hills exhibit many features that are suggestive of a long and complex history of massive, deep-seated landslide activity, including benched and irregular terrain, lobate geomorphic features at the base of hills, and scarp-like concavities and breaks in slope near the crest of the hills. Many of the landslide features are old and have been extensively modified by erosion and development, obscuring the extent and certainty of some of the features. It is likely that some of the landslide features have developed over a period of thousands of years, some perhaps originating in the Pleistocene. Landslide morphology is further complicated by movements on the Hayward Fault, which have offset some of the old deep-seated landslide masses and displaced the toes northwesterly from their source areas.
A review of various engineering records, newspaper articles, photographs and maps collected and made available by the firm of Alan Kropp Associates, Inc. of Berkeley, California confirms that landslide movements have caused considerable problems in the Berkeley Hills over the years. A list of some landslide-related improvements made in Berkeley prior to 1952 appears in a 1954 report issued by the City of Berkeley, prepared under the auspices of John Phillips, City Manager.
• In 1904 a drainage tunnel was driven at Euclid and Cedar to control earth movements.
• In 1915 two trenches were constructed at Cragmont and Halkin connecting to a tunnel on the west side of Euclid to reduce earth movement.
• In 1930, a tunnel with two wings was constructed on Cragmont between Bret Harte Way and Regal Road. This project was shortened due to excessive earth movement and lack of funds.
• In 1933 the city dug a well near High Court, however, lack of labor forces resulted in it extending to only 22.5 feet.
• In 1942 a trench was dug to bedrock and filled with rock and a drainage pipe on Keith Avenue and Eleanor Walk. However, earth movement halted part of the installation.
2003 SEISMIC HAZARD ZONE REPORT FOR THE RICHMOND QUADRANGLE 31
• In 1944 property owners installed a 200-foot rock drain on Corona Court.
• In 1952 property owners on Vassar Street north of Spruce installed a drainage system to control earth movements.
The 1954 city report also describes accelerated earth movements observed at several locations between Spruce Street and Cragmont Avenue north of Codornices Park. Specific locations of earth movement addressed in the report include areas near the intersection of Spruce Street and Los Angeles Avenue, Keith Avenue and Euclid Avenue, Arch Street and Corona Court, and at several locations on Cragmont Avenue. The report recommended drainage systems in several locations to control earth movement, as listed below:
• Keeler Avenue between Poppy Lane and Sterling Avenue easterly to Miller Avenue
• Cragmont Avenue south of Regal Road, a low area between Cragmont Avenue and Keith Avenue, and Keith Avenue east of Euclid
• Cragmont west of Regal Road
• Euclid Avenue at and south of Keith Avenue, including the low area between Euclid and High Court
• Glen Avenue from Oak Street south
• A ravine north of Corona Court
• Arch Street between Oak Street and Eunice Street
It is unknown how many, if any, of these drainage systems were constructed.
One of the earlier drainage systems mentioned in the 1954 city report, on Vassar Street north of Spruce, was the subject of several newspaper reports in the early 1950’s. At that time, an assessment district of 89 properties was being considered to generate funds for a drainage system on Spruce Street, Kentucky Street and Vassar Street to control earth movements. The assessment district was rejected by a majority of the property owners, and a smaller district was considered for 15 properties with the most serious damage along Vassar Street. Seepage from Summit Reservoir was identified as a possible contributor to the earth movement. According to the 1954 city report, a drainage system was eventually constructed in Vassar Street.
Another of the drainage systems mentioned in the 1954 report, on Cragmont between Regal Road and Bret Harte Way, is downslope from a landslide that destroyed a section of Keeler Avenue. This road was destroyed some time prior to the time when the 1939 aerial photos were flown that were studied by CGS for this report. The damaged section of Keeler Avenue has never been rebuilt.

CALIFORNIA GEOLOGICAL SURVEY SHZR 070 32
Another drainage system mentioned in the 1954 report, along Keith Avenue at Eleanor Walk, was constructed through a landslide area that destroyed two homes on Cragmont Avenue upslope from Keith. Newspaper articles from 1942 collected by Alan Kropp Associates, Inc. provide accounts and photographs of the damaged homes and streets. Both Cragmont and Keith have been reconstructed through this slide area and there are homes at what appears to be the approximate site of the homes that were destroyed in 1942.
In 1960, a report issued by the Engineering Division of the City of Berkeley, Samuel C. Jacka, Director, addressed recurring earth movement and proposed drainage systems in the area of San Luis Road and Southampton Avenue. This report was prepared in response to petitions signed by a group of property owners that suffered property damage from accelerated earth movements after several heavy rainfall seasons in the late 1950’s. Specific recommended drainage system locations included:
• San Luis Road west and north from Southhampton Avenue
• Santa Barbara Road at the upper end of Southampton Avenue
• Southampton Avenue and Somerset Lane outletting in John Hinkel Park and Southampton to beyond Tunbridge Lane
• Southampton Avenue from San Diego Road to beyond Tunbridge Lane
• San Diego Road from Devon Road to Southampton Avenue
It is not known how many, if any, of these improvements were made.
Downslope movements along Marin Avenue have been documented in surveys that were performed to estimate fault creep along the active Hayward Fault (Hoexter and others, 1982; Hoexter and others, 1992). The 1982 study includes a map showing earth movement features (street and sidewalk distress, structural damage, etc.) in an area that extends about 2000 feet northwest and southeast of Marin Avenue. Some of these features are interpreted to be due to landslide creep, others are interpreted to be the result of fault creep. The 1992 study concludes that landslide creep accelerated along Marin Avenue between 1982 and 1992 compared to pre-1982 movements, possibly due to extremely wet rainfall seasons in 1982 and 1983. The surveys indicate that landslide creep was active between 1982 and 1992 along a continuous section of Marin Avenue between Spruce Street and Grizzly Peak Boulevard.
During field reconnaissance by CGS in 2001 and 2002, numerous areas of distress to streets, sidewalks and structures were noted. Some of the more heavily distressed areas are the same as those that were addressed in the city reports from the 1950’s and 1960’s. For example, significant distress was noted in the vicinity of Corona Court and Southampton Avenue, both of which were addressed in the city reports. Other areas with notable distress observed in 2001 and 2002 are listed below. This list is only a sample list of distress in the Berkeley Hills.

2003 SEISMIC HAZARD ZONE REPORT FOR THE RICHMOND QUADRANGLE 33
• Eunice Avenue and various side streets below Codornices Park
• Yosemite Road and the Arlington (below the Southampton Avenue area)
• Most of Marin Avenue
• A broad area north and northwest of Euclid Street and Cedar Street
Landsliding also has been active in recent years along Wildcat Canyon Road, which forms the northeastern boundary of the City of Berkeley. The road has been damaged at several places, and numerous soldier-pile walls have been constructed to control sliding and maintain the roadway. This road rests upon the Orinda Formation, which is weak and friable in this area.
Albany Hill appears to have some old debris flow deposits on the west side and several earth slides or rock slides on the north side. All of these features are covered by mature vegetation and do not appear to have been recently active. Deep rock cuts have been made on the west side of Albany Hill for construction of several multi-story apartment buildings. Retaining walls have been constructed to support parts of these cuts.
ENGINEERING GEOLOGY
Geologic Material Strength
To evaluate the stability of geologic materials under earthquake conditions, the geologic map units described above were ranked and grouped on the basis of their shear strength. Generally, the primary source for shear-strength measurements is geotechnical reports prepared by consultants on file with local government permitting departments. Shear-strength data for the units identified on the Richmond Quadrangle geologic map were obtained from cities of Berkeley, Oakland and Piedmont, Alameda County, the University of California at Berkeley, Lawrence Berkeley Laboratory, Berlogar Geotechnical Consultants, Harza Engineering Company, and the CGS Environmental Review Project (see Appendix A). The locations of rock and soil samples taken for shear testing within the Richmond Quadrangle are shown on Plate 2.1. Shear tests from the adjoining Briones Valley, Oakland West and Oakland East quadrangles were used to augment data for several geologic formations for which little or no shear test information was available within the Richmond Quadrangle.
Shear strength data gathered from the above sources were compiled for each geologic map unit. Geologic units were grouped on the basis of average angle of internal friction (average phi) and lithologic character. This study relied heavily upon the data and analyses previously conducted for the zone map prepared for the City of Oakland (DMG, 1999). This previous work incorporated evaluations of shear strength parameters for geologic units that do not occur within the Richmond Quadrangle. Nevertheless, because these other geologic units significantly controlled the development of the shear strength groups for formations that do occur in the Richmond Quadrangle, they were incorporated into the slope stability analyses and are shown on Table 2.1. Table 2.2 lists by strength

CALIFORNIA GEOLOGICAL SURVEY SHZR 070 34
group only those geologic units found in the Richmond Quadrangle. An average (mean or median) phi value for each geologic strength group was used in our slope stability analysis. A geologic material strength map was made based on the groupings presented in Tables 2.1 and 2.2, and this map provides a spatial representation of material strength for use in the slope stability analysis.
A number of geologic formations were subdivided further, as described below.
Adverse Bedding Conditions
Adverse bedding conditions are an important consideration in slope stability analyses. Adverse bedding conditions occur where the dip direction of bedded sedimentary rocks is roughly the same as the slope aspect, and where the dip magnitude is less than the slope gradient. Under these conditions, landslides can slip along bedding surfaces due to a lack of lateral support.
To account for adverse bedding in our slope stability evaluation, we used geologic structural data in combination with digital terrain data to identify areas with potentially adverse bedding, using methods similar to those of Brabb (1983). The structural data, derived from the geologic map database, was used to categorize areas of common bedding dip direction and magnitude. Our usual procedure is to compare the dip direction to the slope aspect and, if the same the dip magnitude and slope gradient categories are compared. If the dip magnitude category is less than or equal to the slope gradient category, but greater than 25% (4:1 slope), the area is marked as a potential adverse bedding area. This procedure was modified in the Richmond Quadrangle as discussed below.
The formations containing interbedded sandstone and shale were subdivided based on shear strength differences between coarse-grained (higher strength) and fine-grained (lower strength) lithologies. The favorable and adverse bedding shear strength parameters for the formations are shown in Table 2.1. With the exception of the Franciscan assemblage volcanic rocks and the surficial Quaternary units, most formations within the Richmond Quadrangle were found to have the stratigraphic and material strength characteristics conducive to adverse bedding conditions. Of these formations, however, only the Orinda Formation (Tor) was found to have the geologic structure conditions compatible with the potential for adverse bedding. The area where these structure conditions occur is a northwest-trending area approximately 2,000 feet long by 1,000 feet wide extending from Remillard Park on the northwest to Glendale-La Loma Park on the southeast, and bounded by Miller Street on the northeast and Keith Avenue on the southwest. This area appears to be underlain by the southwest-dipping limb of an anticline.
An attempt was made by the authors to refine the understanding of the geologic structure in this area by compiling strike and dip measurements in the field. The conclusion of this detailed field study was that, although measurements are difficult to obtain in this highly developed area, the overall bedding dip is generally to the southwest but varies from gentle to near-vertical in the span of a few hundred feet. Rather than perform our typical
2003 SEISMIC HAZARD ZONE REPORT FOR THE RICHMOND QUADRANGLE 35
adverse bedding analyses for a relatively small area with complicated structures and meager data, a simplified evaluation of adverse bedding was performed. Within the area defined above, slope and aspect maps were used to identify slope gradients greater than 25 percent (4:1 slope) with slope aspects from 180 to 270 degrees (slopes facing due south to due west). The geologic material strength map was modified by assigning the lower, fine-grained shear strength value of the Orinda Formation to those areas identified as having potential adverse bedding conditions by this evaluation.
Existing Landslides
As discussed later in this report, the criteria for landslide zone mapping state that all existing landslides that are mapped as definite or probable are automatically included in the landslide zone of required investigation. Therefore, an evaluation of shear strength parameters for existing landslides is not necessary for the preparation of the zone map. However, in the interest of completeness for the material strength map, to provide relevant material strength information to project plan reviewers, and to allow for future revisions of our zone mapping procedures, we have collected and compiled shear strength data considered representative of existing landslides within the quadrangle.
The strength characteristics of existing landslides (Qls) must be based on tests of the materials along the landslide slip surface. Ideally, shear tests of slip surfaces formed in each mapped geologic unit would be used. However, this amount of information is rarely available, and for the preparation of the earthquake-induced landslide zone map it has been assumed that all landslides within the quadrangle have the same slip surface strength parameters. We collect and use primarily “residual” strength parameters from laboratory tests of slip surface materials tested in direct shear or ring shear test equipment. Back-calculated strength parameters, if the calculations appear to have been performed appropriately, have also been used.
Within the Richmond Quadrangle no shear tests of landslide slip surface materials were available. Instead, 11 direct shear tests of slip surface materials were obtained from the adjacent Briones Valley and Oakland East quadrangles, and the results are summarized in Table 2.1.

CALIFORNIA GEOLOGICAL SURVEY SHZR 070 36
RICHMOND QUADRANGLE SHEAR STRENGTH GROUPS
Formation Name Number Tests
Mean/MedianPhi (deg)
Mean/Median Group Phi
(deg)
Mean/Median Group C
(psf)
No Data: Similar Lithology
Phi Values Used in Stability Analyses
GROUP 1 Tsm(fbc)* Tush(fbc)* KJfs(fbc)
5 2 3
40/41 40/40 43/50
41/41 535/500 Fs(fbc)
41
GROUP 2 Tcc(fbc)* Tes(fbc)* Tmb(fbc) Tor(fbc) Kfn(fbc)
Kjm(fbc)* Ko(fbc)* Kr(fbc)* Ksc(fbc)* Ku(fbc)
KJf(fbc)* KJfm(fbc)
Jgb* Jsv
4 1 2 37 11 28 14 3 1 15 4 11 17 28
33/30 31/31 35/37 32/31 33/33 33/33 34/35 34/33 32/32 32/31 33/32 35/35 31/32 31/33
33/33 628/450 Ta(fbc)* KJk(fbc)
33
GROUP 3 af Qhf
Qhms* Tcc(abc)*
Jb
40 32 9 3 3
28/28 27/26 27/28 29/30 28/27
28/27 491/315 ac, Qhbs, Qhc , Qop, Tush(abc)*
28
GROUP 4 Qhl Qmt* Qpf Qof
Ta(abc)* Tes(abc)* Tmb(abc) Tor(abc)
Tsm(abc)* Kfn(abc)
Kjm(abc)* Ko(abc)* Kr(abc)* Ksc(abc)* Ku(abc)
KJf(abc)* KJfm(abc) KJfs(abc) KJk(abc)
sp
2 3 42 11 2 2 4 28 12 10 20 13 10 4 51 1 21 5 7 4
23/23 21/21 24/24 24/23 25/25 25/25 24/23 21/21 24/23 21/20 21/23 22/23 21/22 24/21 22/21 25/25 23/22 21/18 24/26 24/25
23/22 656/315 afbm, Qhb sc,
fc(abc)*
23
GROUP 5 Qls 11 12/10 12/10 725/420 12 abc = adverse bedding condition, fine-grained material strength fbc = favorable bedding condition, coarse-grained material strength * = These formations do not occur in the mapped portion of Richmond Quadrangle but were used in the determination of the
material strength groups. Bedrock formation abbreviations for strength groups from Graymer (2000); Quaternary unit abbreviations from Knudsen and others (2000)
Table 2.1. Summary of the Shear Strength Statistics for the Richmond Quadrangle.

2003 SEISMIC HAZARD ZONE REPORT FOR THE RICHMOND QUADRANGLE 37
SHEAR STRENGTH GROUPS FOR THE RICHMOND 7.5-MINUTE QUADRANGLE
GROUP 1 GROUP 2 GROUP 3 GROUP 4 GROUP 5
KJfs(fbc) Tor(fbc) Tmb(fbc) KJk(fbc) Kfn(fbc) Ku(fbc)
KJfm(fbc) Jsv fs
af ac
Qhf Qhbs Qhc Qop
afbm alf Qhl Qhb Qpf Qof
Tmb(abc) Tor(abc) Kfn(abc) Ku(abc)
KJfm(abc) KJfs(abc) KJk(abc)
sp, sc
Qls
Table 2.2. Summary of Shear Strength Groups for Geologic Formations that Occur within the Mapped Portion of the Richmond Quadrangle.
PART II
EARTHQUAKE-INDUCED LANDSLIDE HAZARD POTENTIAL
Design Strong-Motion Record
To evaluate earthquake-induced landslide hazard potential in the study area, a method of dynamic slope stability analysis developed by Newmark (1965) was used. The Newmark method analyzes dynamic slope stability by calculating the cumulative down-slope displacement for a given earthquake strong-motion time history. As implemented for the preparation of earthquake-induced landslide zones, the Newmark method necessitates the selection of a design earthquake strong-motion record to provide the “ground shaking opportunity.”
Because the active Hayward Fault traverses the eastern portion of the Richmond Quadrangle, the selection of a strong motion record was based on the desire to simulate a large earthquake on the Hayward Fault. The Hayward Fault is a right-lateral strike-slip fault with a total length of approximately 86 km, and an estimated maximum moment magnitude of 7.1 (Petersen and others, 1996). The Berkeley Hills and Albany Hill, which would be susceptible to earthquake-induced landsliding, range from zero to less than 5 km from the seismic source. Strong-motion records considered in the selection include:

CALIFORNIA GEOLOGICAL SURVEY SHZR 070 38
the CGS Strong Motion Instrumentation Program (SMIP) Corralitos record from the 1989 Loma Prieta earthquake; the Southern California Edison (SCE) Lucerne record from the 1992 Landers earthquake; and the Japan Meteorological Agency (JMA) Kobe City record from the 1995 Hyogoken-Nambu (Kobe) earthquake. The significant parameters for each of these earthquakes are listed below:
Strong-Motion Record
Moment Magnitude
Source to Site Distance (km)
PGA (g)
SMIP Corralitos 6.9 5.1 0.64
SCE Lucerne 7.3 1.1 0.80
JMA Kobe 6.9 0.6 0.82
The Corralitos record was eliminated because the fault motion was oblique, rather than purely strike-slip, and because of the relatively short rupture length. The Kobe record was eliminated because of uncertainties regarding the effects of topographic and basin-edge amplification at the recording site. Despite the slightly higher than expected magnitude, the Lucerne record from the 1992 Landers earthquake was used because it has many tectonic similarities to an earthquake on the Hayward Fault.
The selected strong-motion record was not scaled or otherwise modified prior to analysis.
Displacement Calculation
The design strong-motion record was used to develop a relationship between landslide displacement and yield acceleration (ay), defined as the earthquake horizontal ground acceleration above which landslide displacements take place. This relationship was prepared by integrating the design strong-motion record twice for a given acceleration value to find the corresponding displacement, and the process was repeated for a range of acceleration values (Jibson, 1993). The resulting curve in Figure 2.1 represents the full spectrum of displacements that can be expected for the design strong-motion record. This curve provides the required link between anticipated earthquake shaking and estimates of displacement for different combinations of geologic materials and slope gradient, as described in the Slope Stability Analysis section below.
The amount of displacement predicted by the Newmark analysis provides an indication of the relative amount of damage that could be caused by earthquake-induced landsliding. Displacements of 30, 15 and 5 cm were used as criteria for rating levels of earthquake-induced landslide hazard potential based on the work of Youd (1980), Wilson and Keefer (1983), and a CGS pilot study for earthquake-induced landslides (McCrink and Real, 1996; McCrink, 2001). Applied to the curve in Figure 2.1, these displacements correspond to yield accelerations of 0.14, 0.18 and 0.24g. Because these yield

2003 SEISMIC HAZARD ZONE REPORT FOR THE RICHMOND QUADRANGLE 39
acceleration values are derived from the design strong-motion record, they represent the ground shaking opportunity thresholds that are significant in the Richmond Quadrangle.
0.1
1.0
10.0
100.0
1000.0
DIS
PLA
CEM
ENT
(cm
)
0.01 0.10 1.00 YIELD ACCELERATION (g)
NEWMARK DISPLACEMENTvs. YIELD ACCELERATION
SCE Lucerne Record - E-W Component
5 cm
15 cm
30 cm
0.142
0.1820.243
Figure 2.1. Yield Acceleration vs. Newmark Displacement for the Southern California Edison Lucerne Record.
Slope Stability Analysis
A slope stability analysis was performed for each geologic material strength group at slope increments of 1 degree. An infinite-slope failure model under unsaturated slope conditions was assumed. A factor of safety was calculated first, followed by the calculation of yield acceleration from Newmark’s equation:
ay = ( FS - 1 )g sin α
where FS is the Factor of Safety, g is the acceleration due to gravity, and α is the direction of movement of the slide mass, in degrees measured from the horizontal, when displacement is initiated (Newmark, 1965). For an infinite slope failure α is the same as the slope angle.
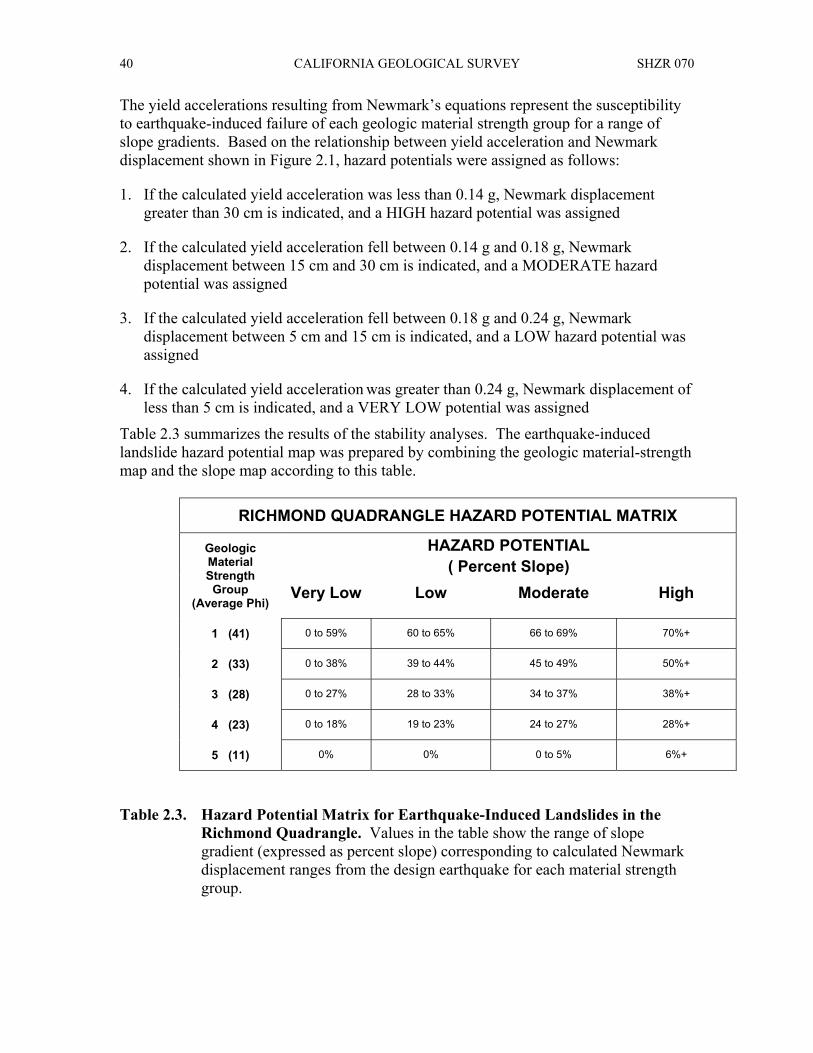
CALIFORNIA GEOLOGICAL SURVEY SHZR 070 40
The yield accelerations resulting from Newmark’s equations represent the susceptibility to earthquake-induced failure of each geologic material strength group for a range of slope gradients. Based on the relationship between yield acceleration and Newmark displacement shown in Figure 2.1, hazard potentials were assigned as follows:
1. If the calculated yield acceleration was less than 0.14 g, Newmark displacement greater than 30 cm is indicated, and a HIGH hazard potential was assigned
2. If the calculated yield acceleration fell between 0.14 g and 0.18 g, Newmark displacement between 15 cm and 30 cm is indicated, and a MODERATE hazard potential was assigned
3. If the calculated yield acceleration fell between 0.18 g and 0.24 g, Newmark displacement between 5 cm and 15 cm is indicated, and a LOW hazard potential was assigned
4. If the calculated yield acceleration was greater than 0.24 g, Newmark displacement of less than 5 cm is indicated, and a VERY LOW potential was assigned
Table 2.3 summarizes the results of the stability analyses. The earthquake-induced landslide hazard potential map was prepared by combining the geologic material-strength map and the slope map according to this table.
RICHMOND QUADRANGLE HAZARD POTENTIAL MATRIX
HAZARD POTENTIAL ( Percent Slope)
Geologic Material Strength Group
(Average Phi) Very Low Low Moderate High
1 (41) 0 to 59% 60 to 65% 66 to 69% 70%+
2 (33) 0 to 38% 39 to 44% 45 to 49% 50%+
3 (28) 0 to 27% 28 to 33% 34 to 37% 38%+
4 (23) 0 to 18% 19 to 23% 24 to 27% 28%+
5 (11) 0% 0% 0 to 5% 6%+
Table 2.3. Hazard Potential Matrix for Earthquake-Induced Landslides in the Richmond Quadrangle. Values in the table show the range of slope gradient (expressed as percent slope) corresponding to calculated Newmark displacement ranges from the design earthquake for each material strength group.

2003 SEISMIC HAZARD ZONE REPORT FOR THE RICHMOND QUADRANGLE 41
EARTHQUAKE-INDUCED LANDSLIDE HAZARD ZONE
Criteria for Zoning
Earthquake-induced landslide zones were delineated using criteria adopted by the California State Mining and Geology Board (DOC, 2000). Under these criteria, earthquake-induced landslide hazard zones are defined as areas that meet one or both of the following conditions:
1. Areas that have been identified as having experienced landslide movement in the past, including all mappable landslide deposits and source areas as well as any landslide that is known to have been triggered by historic earthquake activity.
2. Areas where the geologic and geotechnical data and analyses indicate that the earth materials may be susceptible to earthquake-induced slope failure.
These conditions are discussed in further detail in the following sections.
Existing Landslides
Existing landslides typically consist of disrupted soils and rock materials that are generally weaker than adjacent undisturbed rock and soil materials. Previous studies indicate that existing landslides can be reactivated by earthquake movements (Keefer, 1984). Earthquake-triggered movement of existing landslides is most pronounced in steep head scarp areas and at the toe of existing landslide deposits. Although reactivation of deep-seated landslide deposits is less common (Keefer, 1984), a significant number of deep-seated landslide movements have occurred during, or soon after, several recent earthquakes. Based on these observations, all existing landslides with a definite or probable confidence rating are included within the earthquake-induced landslide hazard zone.
Geologic and Geotechnical Analysis
Based on the conclusions of a pilot study performed by CGS (McCrink and Real, 1996; McCrink, 2001), it has been concluded that earthquake-induced landslide hazard zones should encompass all areas that have a High, Moderate or Low level of hazard potential (see Table 2.3). This would include all areas where the analyses indicate earthquake displacements of 5 centimeters or greater. Areas with a Very Low hazard potential, indicating less than 5 centimeters displacement, are excluded from the zone.
As summarized in Table 2.3, all areas characterized by the following geologic strength group and slope gradient conditions are included in the earthquake-induced landslide hazard zone:
1. Geologic Strength Group 5, consisting of all definite and probable landslide areas, is always included in the earthquake-induced landslide zone regardless of slope.
2. Geologic Strength Group 4 is included for all slopes steeper than 18 percent.

CALIFORNIA GEOLOGICAL SURVEY SHZR 070 42
3. Geologic Strength Group 3 is included for all slopes steeper than 27 percent.
4. Geologic Strength Group 2 is included for all slopes steeper than 38 percent.
5. Geologic Strength Group 1 is included for all slopes steeper than 59 percent.
This results in approximately 22 percent of the Alameda County land area in the Richmond Quadrangle lying within the earthquake-induced landslide hazard zone.
ACKNOWLEDGMENTS
The authors would like to thank the following individuals and organizations for their assistance in obtaining the data necessary to complete this project. At the City of Berkeley Jay Wilson and Glenn Carloss greatly facilitated the collection of shear strength information. Alan Kropp of Alan Kropp Associates generously allowed access to his archive of consultant report files and collection of historic landslide information. Paul Lai at Berlogar Geotechnical Consultants allowed access to his firm’s geotechnical reports. Data collection for the earlier Oakland zone map, which this study used extensively, was facilitated by Joan Curtis and Mario Millan from the City of Oakland; Vern Phillips and Chester Nakahora from the City of Piedmont; Peter Dilks and Gary Moore from Alameda County; Herb Lotter from the City of Berkeley; Jeff Gee, Ron Gaul, and Nico Sanchez from the University of California at Berkeley; Fred Angliss from the Lawrence Berkeley Laboratory; and, Mark Caruso and Ken Ferrone from Harza Engineering Company. The selection of a representative strong-motion seismic record was greatly facilitated by discussions with Charles Real, Mark Petersen, Chris Cramer and Paul Summerville, and the displacement calculations for the considered records were carried out by Jacob Summerhayes. At CGS, Terilee McGuire, Lee Wallinder and Bob Moscovitz provided GIS support. Anne Rosinski and Kevin Clahan assisted in the shear test data collection. Barbara Wanish and Ross Martin prepared the final landslide hazard zone maps and the graphic displays for this report.
REFERENCES
Brabb, E.E., 1983, Map showing direction and amount of bedding dip of sedimentary rocks in San Mateo County, California: U.S. Geological Survey Miscellaneous Investigations Series Map I-1257C, 1 sheet, scale 1:62,500.
California Department of Conservation, Division of Mines and Geology, 1997, Guidelines for evaluating and mitigating seismic hazards in California: California Division of Mines and Geology Special Publication 117, 74 p.
California Department of Conservation, Division of Mines and Geology, 1999, Seismic hazard evaluation of the Cities of Oakland and Piedmont, Alameda County, California, Open-File Report 99-11, 72 p.

2003 SEISMIC HAZARD ZONE REPORT FOR THE RICHMOND QUADRANGLE 43
California Department of Conservation, Division of Mines and Geology, 2000, Recommended criteria for delineating seismic hazard zones: California Division of Mines and Geology Special Publication 118, 12 p.
Dibblee, T.W., Jr., 1980, Preliminary geologic map of the Richmond Quadrangle, Alameda and Contra Costa counties, California: U.S. Geological Survey Open-File Report 80-1100, scale 1:24,000.
Graymer, R.W., 2000, Geologic map and map database of the Oakland metropolitan area, Alameda, Contra Costa, and San Francisco Counties, California: U.S. Geological Survey Miscellaneous Field Studies Map MF-2342.
Graymer, R.W., Jones, D.L. and Brabb, E.E., 1994, Preliminary geologic map emphasizing bedrock formations in Contra Costa County, California; A digital database: U.S. Geological Survey Open-File Report 94-622.
Hoexter, D.F., Levine, C.R., Hecht, Barry and Collier, George, 1982, Deformation along the Hayward Fault zone, north Berkeley: Fault creep and landsliding, in Hart, E.W., Herschfeld, S.E. and Schulz, S.S., editors, Proceedings of the conference of earthquake hazards in the eastern San Francisco Bay Area: California Division of Mines and Geology Special Publication 62, p. 217-226.
Hoexter, D.F., Knudsen, K., Hecht, B., Laduzinsky, D. and Fiedler, G., 1992, Creep and downslope movements in the Hayward Fault Zone in north Berkeley: Ten years later, in Borchardt, G., Hirschfeld, S.E., Lienkaemper, J.J., McClellen, P., Williams, P.L. and Wong, I.G., editors, Proceedings of the second conference on earthquake hazards in the eastern San Francisco Bay Area: California Division of Mines and Geology Special Publication 113, p. 121-128
Horn, B.K.P., 1981, Hill shading and the reflectance map: Proceedings of the IEEE, v. 69, no. 1, p. 14-47.
Jibson, R.W., 1993, Predicting earthquake-induced landslide displacements using Newmark’s sliding block analysis: Transportation Research Board, National Research Council, Transportation Research Record 1411, 17 p.
Jones, D.L. and Curtis, G.H., 1991, Guide to the geology of the Berkeley Hills, central Coast Ranges, California, in Sloan, Doris and Wagner, D.L., editors, Geologic excursions in northern California; San Francisco to the Sierra Nevada: California Division of Mines and Geology Special Publication 109, p. 63-74.
Keefer, D.K., 1984, Landslides caused by earthquakes: Geological Society of America Bulletin, v. 95, no. 4, p. 406-421.
Knudsen, K.L., Sowers, J.M., Witter, R.C., Wentworth, C.M., Helley, E.J., Nicholson, R.S., Wright, H.M. and Brown, K.H., 2000, Preliminary maps of Quaternary deposits and liquefaction susceptibility, nine-county San Francisco Bay region,

CALIFORNIA GEOLOGICAL SURVEY SHZR 070 44
California: a digital database: U.S. Geological Survey Open-File Report 00-444, scale 1:24,000.
Lienkaemper, J.J., 1992, Map showing recently active traces of the Hayward Fault, Alameda and Contra Costa counties, California: U.S. Geological Survey Miscellaneous Field Studies Map MF-2196, 13p., 1 sheet, scale 1:24,000.
McCrink, T.P., 2001, Mapping earthquake-induced landslide hazards in Santa Cruz County in Ferriz, H. and Anderson, R., editors, Engineering geology practice in northern California: California Geological Survey Bulletin 210 / Association of Engineering Geologists Special Publication 12, p.77-94.
McCrink, T.P. and Real, C.R., 1996, Evaluation of the Newmark method for mapping earthquake-induced landslide hazards in the Laurel 7-1/2 Minute Quadrangle, Santa Cruz County, California: California Division of Mines and Geology Final Technical Report for U.S. Geological Survey Contract 143-93-G-2334, U.S. Geological Survey, Reston, Virginia, 31 p.
Newmark, N.M., 1965, Effects of earthquakes on dams and embankments: Geotechnique, v. 15, no. 2, p. 139-160.
Petersen, M.D., Bryant, W.A., Cramer, C.H., Cao. T., Reichle, M.S., Frankel, A.D., Lienkaemper, J.J., McCrory, P.A. and Schwartz, D.P., 1996, Probabilistic seismic hazard assessment for the State of California: California Department of Conservation, Division of Mines and Geology, Open-File Report 96-08; also U.S. Geological Survey Open-File Report 96-706, 33 p.
Radbruch-Hall, D.H., 1974, Map showing recently active breaks along the Hayward Fault Zone and the southern part of the Calaveras Fault Zone, California: U.S. Geological Survey Miscellaneous Geologic Investigations Map I-813, scale 1:24,000.
Smith, T.C., 1980, Fault evaluation report FER-101, unpublished report: California Division of Mines and Geology, 30 p.
Smith, T.C., 1996, Preliminary maps of seismic hazard zones and draft guidelines for evaluating and mitigating seismic hazards: California Geology, v. 49, no. 6, p. 147-150.
Southern California Earthquake Center, 2002, Recommended procedures for implementation of DMG Special Publication 117 guidelines for analyzing and mitigating landslide hazards in California: Southern California Earthquake Center, University of Southern California, 108 p.
Wilson, R.C. and Keefer, D.K., 1983, Dynamic analysis of a slope failure from the 1979 Coyote Lake, California, earthquake: Bulletin of the Seismological Society of America, v. 73, p. 863-877.

2003 SEISMIC HAZARD ZONE REPORT FOR THE RICHMOND QUADRANGLE 45
Witter, R.C. unpublished Quaternary geologic mapping of the Oakland East 7.5-Minute Quadrangle, to be incorporated in revision to: Knudsen, K.L., Sowers, J.M., Witter, R.C., Wentworth, C.M., Helley, E.J., Nicholson, R.S., Wright, H.M. and Brown, K.H., 2000a, Preliminary maps of Quaternary deposits and liquefaction susceptibility, nine-county San Francisco Bay region, California: a digital database, U.S. Geological Survey, Open-File Report 00-444.
Youd, T.L., 1980, Ground failure displacement and earthquake damage to buildings: American Society of Civil Engineers Conference on Civil Engineering and Nuclear Power, 2d, Knoxville, Tennessee, 1980, v. 2, p. 7-6-2 to 7-6-26.
AIR PHOTOS
United States Department of Agriculture (USDA), dated 8-2-39, Flight or Serial number BUT, Photo numbers 289-65 through 70, scale 1:20,000±.
United States Department of Agriculture (USDA), dated 8-2-39, Flight or Serial number BUT, Photo numbers 289-94 through 101, scale 1:20,000±.
WAC Corporation, Inc, dated 3-18-84, Flight or Serial number WAC 84C, Photo numbers 4-34 through 4-37; scale 1:20,000±.
WAC Corporation, Inc, dated 4/99, Flight WAC-C-99CA , Photos 3-230 through 3-238, 11-145 through 11-148, 3-208 through 3-215, scale 1:24,000
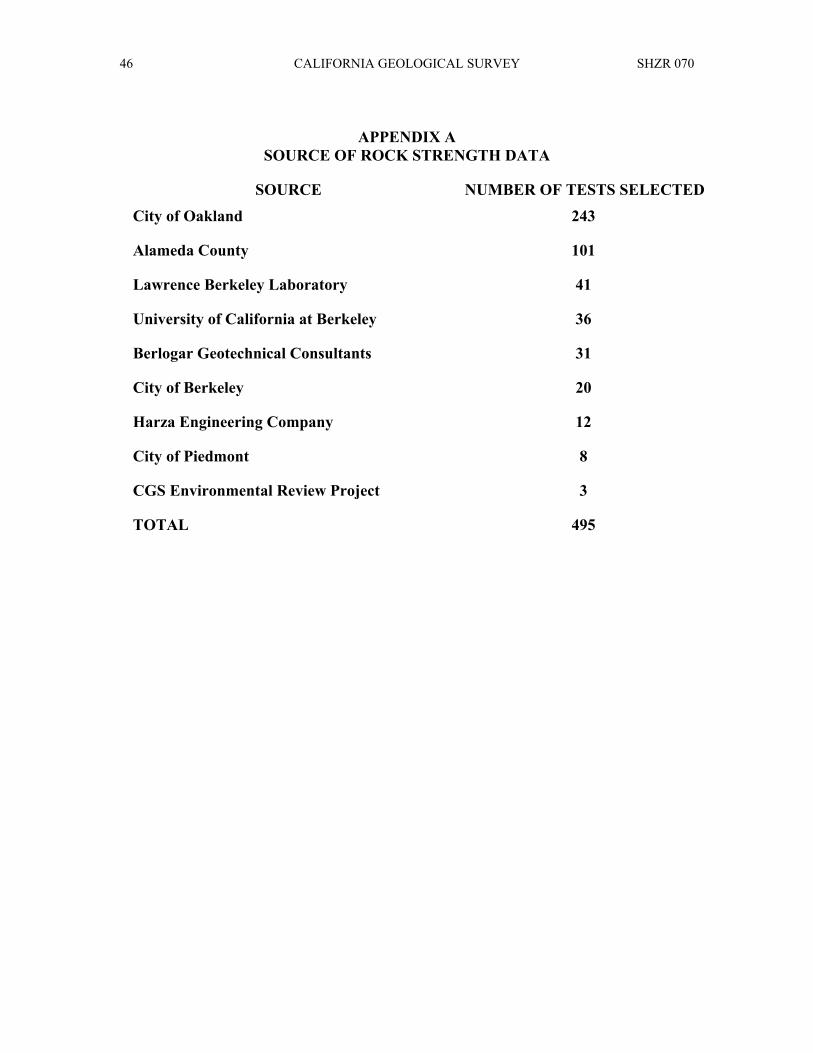
CALIFORNIA GEOLOGICAL SURVEY SHZR 070 46
APPENDIX A SOURCE OF ROCK STRENGTH DATA
SOURCE NUMBER OF TESTS SELECTED
City of Oakland 243
Alameda County 101
Lawrence Berkeley Laboratory 41
University of California at Berkeley
Berlogar Geotechnical Consultants
City of Berkeley
36
31
20
Harza Engineering Company 12
City of Piedmont
CGS Environmental Review Project
8
3
TOTAL 495
2003 SEISMIC HAZARD ZONE REPORT FOR THE RICHMOND QUADRANGLE 47
SECTION 3 GROUND SHAKING EVALUATION REPORT
Potential Ground Shaking in the
Richmond 7.5-Minute Quadrangle, Alameda County, California
By
Mark D. Petersen*, Chris H. Cramer*, Geoffrey A. Faneros, Charles R. Real, and Michael S. Reichle
California Department of Conservation
California Geological Survey *Formerly with CGS, now with U.S. Geological Survey
PURPOSE
The Seismic Hazards Mapping Act (the Act) of 1990 (Public Resources Code, Chapter 7.8, Division 2) directs the California Department of Conservation (DOC), Division of Mines and Geology (DMG) [now called California Geological Survey (CGS)] to delineate Seismic Hazard Zones. The purpose of the Act is to reduce the threat to public health and safety and to minimize the loss of life and property by identifying and mitigating seismic hazards. Cities, counties, and state agencies are directed to use the Seismic Hazard Zone Maps in their land-use planning and permitting processes. The Act requires that site-specific geotechnical investigations be performed prior to permitting most urban development projects within the hazard zones. Evaluation and mitigation of seismic hazards are to be conducted under guidelines established by the California State Mining and Geology Board (DOC, 1997). The text of this report is on the Internet at http://gmw.consrv.ca.gov/shmp/webdocs/sp117.pdf
This section of the evaluation report summarizes the ground motions used to evaluate liquefaction and earthquake-induced landslide potential for zoning purposes. Included are ground motion and related maps, a brief overview on how these maps were prepared, precautionary notes concerning their use, and related references. The maps provided

CALIFORNIA GEOLOGICAL SURVEY SHZR 070 48
herein are presented at a scale of approximately 1:150,000 (scale bar provided on maps), and show the full 7.5-minute quadrangle and portions of the adjacent eight quadrangles. They can be used to assist in the specification of earthquake loading conditions for the analysis of ground failure according to the “Simple Prescribed Parameter Value” method (SPPV) described in the site investigation guidelines (DOC, 1997). Alternatively, they can be used as a basis for comparing levels of ground motion determined by other methods with the statewide standard.
This section and Sections 1 and 2 (addressing liquefaction and earthquake-induced landslide hazards) constitute a report series that summarizes development of seismic hazard zone maps in the state. Additional information on seismic hazard zone mapping in California can be accessed on the California Geological Survey's Internet page: http://www.conservation.ca.gov/CGS/index.htm
EARTHQUAKE HAZARD MODEL
The estimated ground shaking is derived from the statewide probabilistic seismic hazard evaluation released cooperatively by the California Department of Conservation, Division of Mines and Geology [California Geological Survey], and the U.S. Geological Survey (Petersen and others, 1996). That report documents an extensive 3-year effort to obtain consensus within the scientific community regarding fault parameters that characterize the seismic hazard in California. Fault sources included in the model were evaluated for long-term slip rate, maximum earthquake magnitude, and rupture geometry. These fault parameters, along with historical seismicity, were used to estimate return times of moderate to large earthquakes that contribute to the hazard.
The ground shaking levels are estimated for each of the sources included in the seismic source model using attenuation relations that relate earthquake shaking with magnitude, distance from the earthquake, and type of fault rupture (strike-slip, reverse, normal, or subduction). The published hazard evaluation of Petersen and others (1996) only considers uniform firm-rock site conditions. In this report, however, we extend the hazard analysis to include the hazard of exceeding peak horizontal ground acceleration (PGA) at 10 percent probability of exceedance in 50 years on spatially uniform conditions of rock, soft rock, and alluvium. These soil and rock conditions approximately correspond to site categories defined in Chapter 16 of the Uniform Building Code (ICBO, 1997), which are commonly found in California. We use the attenuation relations of Boore and others (1997), Campbell (1997), Sadigh and others (1997), and Youngs and others (1997) to calculate the ground motions.
The seismic hazard maps for ground shaking are produced by calculating the hazard at sites separated by about 5 km. Figures 3.1 through 3.3 show the hazard for PGA at 10 percent probability of exceedance in 50 years assuming the entire map area is firm rock, soft rock, or alluvial site conditions respectively. The sites where the hazard is calculated are represented as dots and ground motion contours as shaded regions. The quadrangle of interest is outlined by bold lines and centered on the map. Portions of the eight

������������������������������������������������� ������������������������������������������������� ������������������������������������������������� ������������������������������������������������� ������������������������������������������������� �������������������������������������������������
������������������������������������������������� ������������������������������������������������� ������������������������������������������������� ������������������������������������������������� ������������������������������������������������� �������������������������������������������������
������������������������������������������������� ������������������������������������������������� ������������������������������������������������� ������������������������������������������������� ������������������������������������������������� �������������������������������������������������
������������������������������������������������� ������������������������������������������������� ������������������������������������������������� ������������������������������������������������� ������������������������������������������������� �������������������������������������������������
������������������������������������������������� ������������������������������������������������� ������������������������������������������������� ������������������������������������������������� ������������������������������������������������� �������������������������������������������������
0.460.460.460.460.460.460.460.460.46 0.440.440.440.440.440.440.440.440.44 0.460.460.460.460.460.460.460.460.46 0.540.540.540.540.540.540.540.540.54 0.740.740.740.740.740.740.740.740.74 0.670.670.670.670.670.670.670.670.67
0.440.440.440.440.440.440.440.440.44 0.460.460.460.460.460.460.460.460.46 0.510.510.510.510.510.510.510.510.51 0.660.660.660.660.660.660.660.660.66 0.660.660.660.660.660.660.660.660.66 0.540.540.540.540.540.540.540.540.54
0.450.450.450.450.450.450.450.450.45 0.520.520.520.520.520.520.520.520.52 0.660.660.660.660.660.660.660.660.66 0.740.740.740.740.740.740.740.740.74 0.540.540.540.540.540.540.540.540.54 0.460.460.460.460.460.460.460.460.46
0.520.520.520.520.520.520.520.520.52 0.630.630.630.630.630.630.630.630.63 0.750.750.750.750.750.750.750.750.75 0.590.590.590.590.590.590.590.590.59 0.480.480.480.480.480.480.480.480.48 0.450.450.450.450.450.450.450.450.45
0.570.570.570.570.570.570.570.570.57 0.720.720.720.720.720.720.720.720.72 0.650.650.650.650.650.650.650.650.65 0.530.530.530.530.530.530.530.530.53 0.460.460.460.460.460.460.460.460.46 0.470.470.470.470.470.470.470.470.47
RICHMOND 7.5 MINUTE QUADRANGLE AND PORTIONS OFADJACENT QUADRANGLES
10% EXCEEDANCE IN 50 YEARS PEAK GROUND ACCELERATION (g)1998
FIRM ROCK CONDITIONS
Department of ConservationCalifornia Geological Survey
Figure 3.1
0 1.5
Miles
3
Base map from GDT
SEISMIC HAZARD EVALUATION OF THE RICHMOND QUADRANGLE49 SHZR 070

������������������������������������������������� ������������������������������������������������� ������������������������������������������������� ������������������������������������������������� ������������������������������������������������� �������������������������������������������������
������������������������������������������������� ������������������������������������������������� ������������������������������������������������� ������������������������������������������������� ������������������������������������������������� �������������������������������������������������
������������������������������������������������� ������������������������������������������������� ������������������������������������������������� ������������������������������������������������� ������������������������������������������������� �������������������������������������������������
������������������������������������������������� ������������������������������������������������� ������������������������������������������������� ������������������������������������������������� ������������������������������������������������� �������������������������������������������������
�������������������������������������������������������������������������������������������������� ������������������������������������������������� ������������������������������������������������� ������������������������������������������������� �������������������������������������������������
0.510.510.510.510.510.510.510.510.51 0.490.490.490.490.490.490.490.490.49 0.510.510.510.510.510.510.510.510.51 0.590.590.590.590.590.590.590.590.59 0.780.780.780.780.780.780.780.780.78 0.710.710.710.710.710.710.710.710.71
0.490.490.490.490.490.490.490.490.49 0.510.510.510.510.510.510.510.510.51 0.560.560.560.560.560.560.560.560.56 0.710.710.710.710.710.710.710.710.71 0.710.710.710.710.710.710.710.710.71 0.590.590.590.590.590.590.590.590.59
0.500.500.500.500.500.500.500.500.50 0.570.570.570.570.570.570.570.570.57 0.710.710.710.710.710.710.710.710.71 0.770.770.770.770.770.770.770.770.77 0.580.580.580.580.580.580.580.580.58 0.500.500.500.500.500.500.500.500.50
0.570.570.570.570.570.570.570.570.57 0.680.680.680.680.680.680.680.680.68 0.780.780.780.780.780.780.780.780.78 0.640.640.640.640.640.640.640.640.64 0.530.530.530.530.530.530.530.530.53 0.490.490.490.490.490.490.490.490.49
0.620.620.620.620.620.620.620.620.62 0.770.770.770.770.770.770.770.770.77 0.710.710.710.710.710.710.710.710.71 0.580.580.580.580.580.580.580.580.58 0.510.510.510.510.510.510.510.510.51 0.510.510.510.510.510.510.510.510.51
RICHMOND 7.5 MINUTE QUADRANGLE AND PORTIONS OFADJACENT QUADRANGLES
10% EXCEEDANCE IN 50 YEARS PEAK GROUND ACCELERATION (g)
1998
SOFT ROCK CONDITIONS
Department of ConservationCalifornia Geological Survey
Figure 3.2
0 1.5
Miles
3
Base map from GDT
SEISMIC HAZARD EVALUATION OF THE RICHMOND QUADRANGLE2003 50
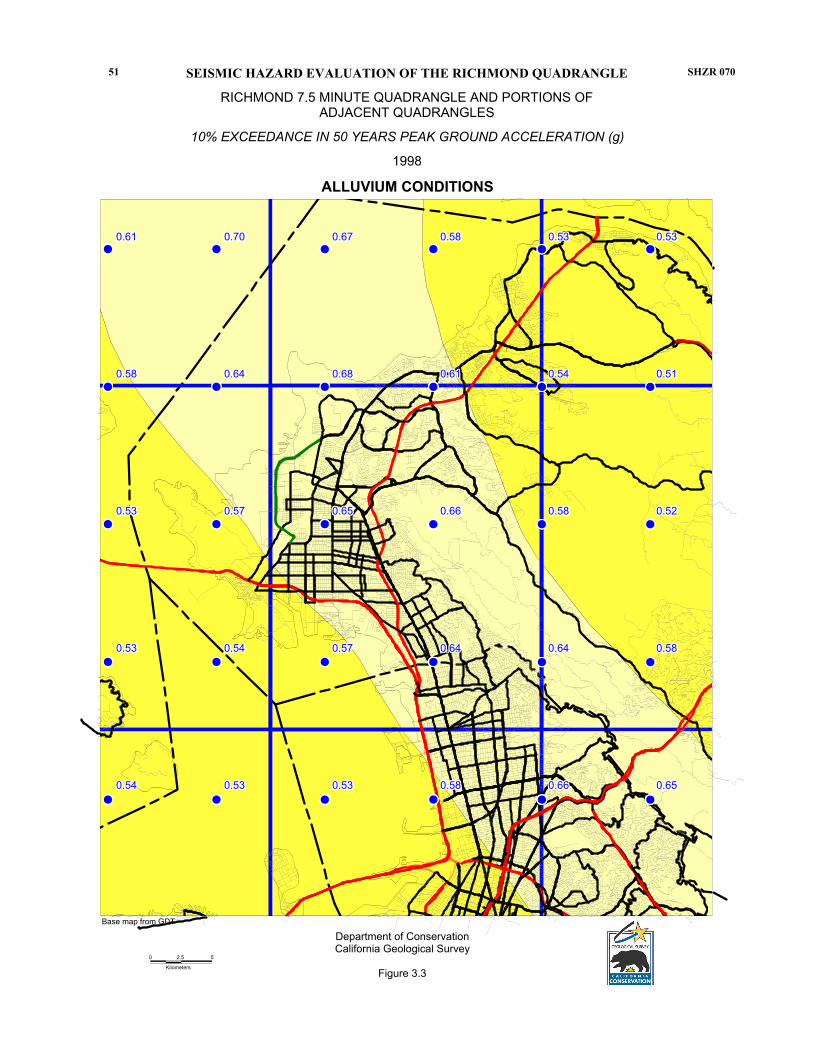
������������������������������������������������� ������������������������������������������������� ������������������������������������������������� ������������������������������������������������� ������������������������������������������������� �������������������������������������������������
������������������������������������������������� ������������������������������������������������� ������������������������������������������������� ������������������������������������������������� ������������������������������������������������� �������������������������������������������������
������������������������������������������������� ������������������������������������������������� ������������������������������������������������� ������������������������������������������������� ������������������������������������������������� �������������������������������������������������
������������������������������������������������� ������������������������������������������������� ������������������������������������������������� �������������������������������������������������
�������������������������������������������������������������������������������������������������� ������������������������������������������������� ������������������������������������������������� ������������������������������������������������� �������������������������������������������������
������������������������������������������������� �������������������������������������������������
0.540.540.540.540.540.540.540.540.54 0.530.530.530.530.530.530.530.530.53 0.530.530.530.530.530.530.530.530.53 0.580.580.580.580.580.580.580.580.58 0.660.660.660.660.660.660.660.660.66 0.650.650.650.650.650.650.650.650.65
0.530.530.530.530.530.530.530.530.53 0.540.540.540.540.540.540.540.540.54 0.570.570.570.570.570.570.570.570.57 0.640.640.640.640.640.640.640.640.64 0.640.640.640.640.640.640.640.640.64 0.580.580.580.580.580.580.580.580.58
0.530.530.530.530.530.530.530.530.53 0.570.570.570.570.570.570.570.570.57 0.650.650.650.650.650.650.650.650.65 0.660.660.660.660.660.660.660.660.66 0.580.580.580.580.580.580.580.580.58 0.520.520.520.520.520.520.520.520.52
0.580.580.580.580.580.580.580.580.58 0.640.640.640.640.640.640.640.640.64 0.680.680.680.680.680.680.680.680.68 0.610.610.610.610.610.610.610.610.61 0.540.540.540.540.540.540.540.540.54 0.510.510.510.510.510.510.510.510.51
0.610.610.610.610.610.610.610.610.61 0.700.700.700.700.700.700.700.700.70 0.670.670.670.670.670.670.670.670.67 0.580.580.580.580.580.580.580.580.58 0.530.530.530.530.530.530.530.530.53 0.530.530.530.530.530.530.530.530.53
RICHMOND 7.5 MINUTE QUADRANGLE AND PORTIONS OFADJACENT QUADRANGLES
10% EXCEEDANCE IN 50 YEARS PEAK GROUND ACCELERATION (g)
1998
ALLUVIUM CONDITIONS
Department of ConservationCalifornia Geological Survey
Figure 3.3Kilometers
0 2.5 5
Base map from GDT
SEISMIC HAZARD EVALUATION OF THE RICHMOND QUADRANGLE51 SHZR 070

CALIFORNIA GEOLOGICAL SURVEY SHZR 070 52
adjacent quadrangles are also shown so that the trends in the ground motion may be more apparent. We recommend estimating ground motion values by selecting the map that matches the actual site conditions, and interpolating from the calculated values of PGA rather than the contours, since the points are more accurate.
APPLICATIONS FOR LIQUEFACTION AND LANDSLIDE HAZARD ASSESSMENTS
Deaggregation of the seismic hazard identifies the contribution of each of the earthquakes (various magnitudes and distances) in the model to the ground motion hazard for a particular exposure period (see Cramer and Petersen, 1996). The map in Figure 3.4 identifies the magnitude and the distance (value in parentheses) of the earthquake that contributes most to the hazard at 10 percent probability of exceedance in 50 years on alluvial site conditions (predominant earthquake). This information gives a rationale for selecting a seismic record or ground motion level in evaluating ground failure. However, it is important to keep in mind that more than one earthquake may contribute significantly to the hazard at a site, and those events can have markedly different magnitudes and distances. For liquefaction hazard the predominant earthquake magnitude from Figure 3.4 and PGA from Figure 3.3 (alluvium conditions) can be used with the Youd and Idriss (1997) approach to estimate cyclic stress ratio demand. For landslide hazard the predominant earthquake magnitude and distance can be used to select a seismic record that is consistent with the hazard for calculating the Newmark displacement (Wilson and Keefer, 1983). When selecting the predominant earthquake magnitude and distance, it is advisable to consider the range of values in the vicinity of the site and perform the ground failure analysis accordingly. This would yield a range in ground failure hazard from which recommendations appropriate to the specific project can be made. Grid values for predominant earthquake magnitude and distance should not be interpolated at the site location, because these parameters are not continuous functions.
A preferred method of using the probabilistic seismic hazard model and the “simplified Seed-Idriss method” of assessing liquefaction hazard is to apply magnitude scaling probabilistically while calculating peak ground acceleration for alluvium. The result is a “magnitude-weighted” ground motion (liquefaction opportunity) map that can be used directly in the calculation of the cyclic stress ratio threshold for liquefaction and for estimating the factor of safety against liquefaction (Youd and Idriss, 1997). This can provide a better estimate of liquefaction hazard than use of predominate magnitude described above, because all magnitudes contributing to the estimate are used to weight the probabilistic calculation of peak ground acceleration (Real and others, 2000). Thus, large distant earthquakes that occur less frequently but contribute more to the liquefaction hazard are appropriately accounted for.
Figure 3.5 shows the magnitude-weighted alluvial PGA based on Idriss’ weighting function (Youd and Idriss, 1997). It is important to note that the values obtained from this map are pseudo-accelerations and should be used in the formula for factor of safety without any magnitude-scaling (a factor of 1) applied.
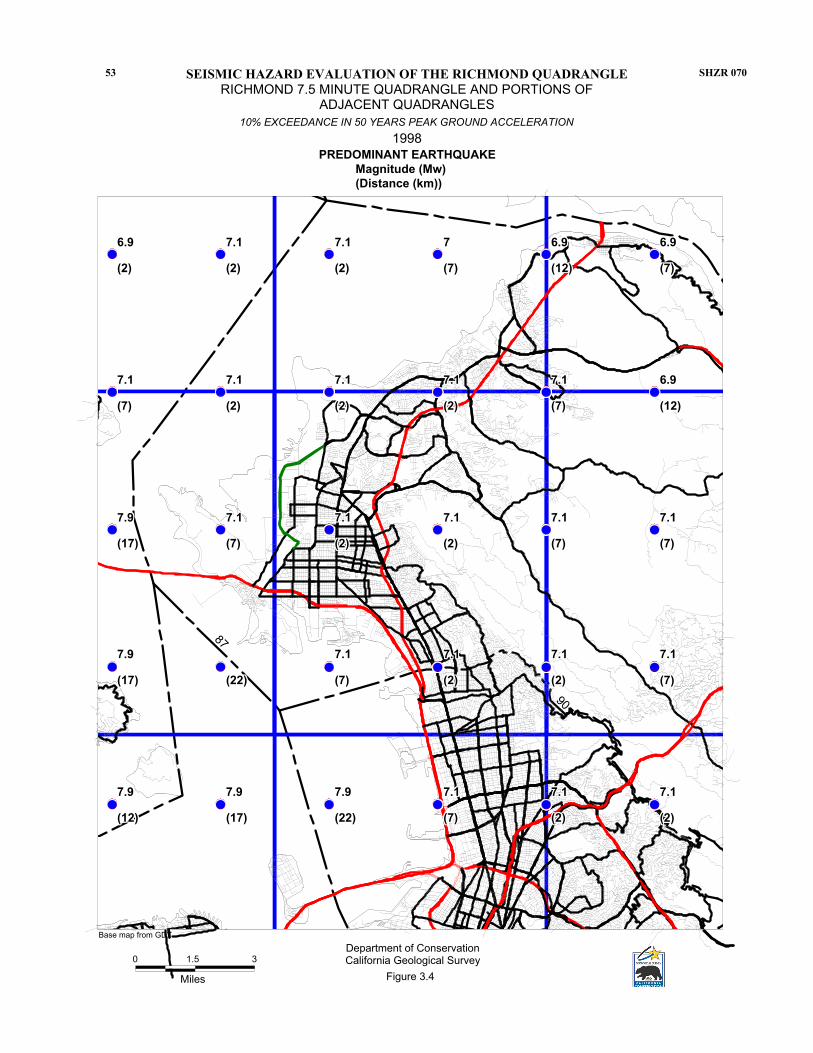
������������������������������������������������� ������������������������������������������������� ������������������������������������������������� ������������������������������������������������� ������������������������������������������������� �������������������������������������������������
������������������������������������������������� �������������������������������������������������
�������������������������������������������������������������������������������������������������� ������������������������������������������������� ������������������������������������������������� ������������������������������������������������� �������������������������������������������������
������������������������������������������������� ������������������������������������������������� ������������������������������������������������� ������������������������������������������������� ������������������������������������������������� �������������������������������������������������
������������������������������������������������� ������������������������������������������������� ������������������������������������������������� ������������������������������������������������� ������������������������������������������������� �������������������������������������������������
������������������������������������������������� ������������������������������������������������� ������������������������������������������������� �������������������������������������������������
87
90
7.97.97.97.97.97.97.97.97.9 7.97.97.97.97.97.97.97.97.9 7.97.97.97.97.97.97.97.97.9 7.17.17.17.17.17.17.17.17.1 7.17.17.17.17.17.17.17.17.1 7.17.17.17.17.17.17.17.17.1
7.97.97.97.97.97.97.97.97.9 7.17.17.17.17.17.17.17.17.1 7.17.17.17.17.17.17.17.17.1 7.17.17.17.17.17.17.17.17.1 7.17.17.17.17.17.17.17.17.1
7.97.97.97.97.97.97.97.97.9 7.17.17.17.17.17.17.17.17.1 7.17.17.17.17.17.17.17.17.1 7.17.17.17.17.17.17.17.17.1 7.17.17.17.17.17.17.17.17.1 7.17.17.17.17.17.17.17.17.1
7.17.17.17.17.17.17.17.17.1 7.17.17.17.17.17.17.17.17.1 7.17.17.17.17.17.17.17.17.1 7.17.17.17.17.17.17.17.17.1 7.17.17.17.17.17.17.17.17.1 6.96.96.96.96.96.96.96.96.9
6.96.96.96.96.96.96.96.96.9 7.17.17.17.17.17.17.17.17.1 7.17.17.17.17.17.17.17.17.1 777777777 6.96.96.96.96.96.96.96.96.9 6.96.96.96.96.96.96.96.96.9
(12)(12)(12)(12)(12)(12)(12)(12)(12) (17)(17)(17)(17)(17)(17)(17)(17)(17) (22)(22)(22)(22)(22)(22)(22)(22)(22) (7)(7)(7)(7)(7)(7)(7)(7)(7) (2)(2)(2)(2)(2)(2)(2)(2)(2) (2)(2)(2)(2)(2)(2)(2)(2)(2)
(17)(17)(17)(17)(17)(17)(17)(17)(17) (22)(22)(22)(22)(22)(22)(22)(22)(22) (7)(7)(7)(7)(7)(7)(7)(7)(7) (2)(2)(2)(2)(2)(2)(2)(2)(2) (2)(2)(2)(2)(2)(2)(2)(2)(2) (7)(7)(7)(7)(7)(7)(7)(7)(7)
(17)(17)(17)(17)(17)(17)(17)(17)(17) (7)(7)(7)(7)(7)(7)(7)(7)(7) (2)(2)(2)(2)(2)(2)(2)(2)(2) (2)(2)(2)(2)(2)(2)(2)(2)(2) (7)(7)(7)(7)(7)(7)(7)(7)(7) (7)(7)(7)(7)(7)(7)(7)(7)(7)
(7)(7)(7)(7)(7)(7)(7)(7)(7) (2)(2)(2)(2)(2)(2)(2)(2)(2) (2)(2)(2)(2)(2)(2)(2)(2)(2) (2)(2)(2)(2)(2)(2)(2)(2)(2) (7)(7)(7)(7)(7)(7)(7)(7)(7) (12)(12)(12)(12)(12)(12)(12)(12)(12)
(2)(2)(2)(2)(2)(2)(2)(2)(2) (2)(2)(2)(2)(2)(2)(2)(2)(2) (2)(2)(2)(2)(2)(2)(2)(2)(2) (7)(7)(7)(7)(7)(7)(7)(7)(7) (12)(12)(12)(12)(12)(12)(12)(12)(12) (7)(7)(7)(7)(7)(7)(7)(7)(7)
RICHMOND 7.5 MINUTE QUADRANGLE AND PORTIONS OFADJACENT QUADRANGLES
10% EXCEEDANCE IN 50 YEARS PEAK GROUND ACCELERATION1998
PREDOMINANT EARTHQUAKE Magnitude (Mw) (Distance (km))
Department of ConservationCalifornia Geological Survey0 1.5
Miles
3
Figure 3.4
Base map from GDT
SEISMIC HAZARD EVALUATION OF THE RICHMOND QUADRANGLE53 SHZR 070

������������������������������������������������� ������������������������������������������������� ������������������������������������������������� ������������������������������������������������� ������������������������������������������������� �������������������������������������������������
�������������������������������������������������
�������������������������������������������������������������������������������������������������� ������������������������������������������������� ������������������������������������������������� ������������������������������������������������� �������������������������������������������������
������������������������������������������������� ������������������������������������������������� ������������������������������������������������� ������������������������������������������������� ������������������������������������������������� �������������������������������������������������
������������������������������������������������� ������������������������������������������������� ������������������������������������������������� ������������������������������������������������� ������������������������������������������������� �������������������������������������������������
�������������������������������������������������������������������������������������������������� ������������������������������������������������� ������������������������������������������������� �������������������������������������������������
0.550.550.550.550.550.550.550.550.55 0.520.520.520.520.520.520.520.520.52 0.510.510.510.510.510.510.510.510.51 0.530.530.530.530.530.530.530.530.53 0.580.580.580.580.580.580.580.580.58 0.550.550.550.550.550.550.550.550.55
0.520.520.520.520.520.520.520.520.52 0.510.510.510.510.510.510.510.510.51 0.530.530.530.530.530.530.530.530.53 0.560.560.560.560.560.560.560.560.56 0.550.550.550.550.550.550.550.550.55 0.490.490.490.490.490.490.490.490.49
0.520.520.520.520.520.520.520.520.52 0.530.530.530.530.530.530.530.530.53 0.570.570.570.570.570.570.570.570.57 0.570.570.570.570.570.570.570.570.57 0.490.490.490.490.490.490.490.490.49 0.430.430.430.430.430.430.430.430.43
0.540.540.540.540.540.540.540.540.54 0.570.570.570.570.570.570.570.570.57 0.590.590.590.590.590.590.590.590.59 0.530.530.530.530.530.530.530.530.53 0.450.450.450.450.450.450.450.450.45 0.390.390.390.390.390.390.390.390.39
0.550.550.550.550.550.550.550.550.55 0.60.60.60.60.60.60.60.60.6 0.570.570.570.570.570.570.570.570.57 0.490.490.490.490.490.490.490.490.49 0.420.420.420.420.420.420.420.420.42 0.370.370.370.370.370.370.370.370.37
RICHMOND 7.5 MINUTE QUADRANGLE AND PORTIONS OFADJACENT QUADRANGLES
10% EXCEEDANCE IN 50 YEARS MAGNITUDE-WEIGHTED PSEUDO-PEAK ACCELERATION (g) FOR ALLUVIUM
1998LIQUEFACTION OPPORTUNITY
Department of ConservationCalifornia Geological Survey
Figure 3.5
0 1.5
Miles
3
Base map from GDT
SEISMIC HAZARD EVALUATION OF THE RICHMOND QUADRANGLE2003 54
2003 SEISMIC HAZARD ZONE REPORT FOR THE RICHMOND QUADRANGLE 55
USE AND LIMITATIONS
The statewide map of seismic hazard has been developed using regional information and is not appropriate for site specific structural design applications. Use of the ground motion maps prepared at larger scale is limited to estimating earthquake loading conditions for preliminary assessment of ground failure at a specific location. We recommend consideration of site-specific analyses before deciding on the sole use of these maps for several reasons.
1. The seismogenic sources used to generate the peak ground accelerations were digitized from the 1:750,000-scale fault activity map of Jennings (1994). Uncertainties in fault location are estimated to be about 1 to 2 kilometers (Petersen and others, 1996). Therefore, differences in the location of calculated hazard values may also differ by a similar amount. At a specific location, however, the log-linear attenuation of ground motion with distance renders hazard estimates less sensitive to uncertainties in source location.
2. The hazard was calculated on a grid at sites separated by about 5 km (0.05 degrees). Therefore, the calculated hazard may be located a couple kilometers away from the site. We have provided shaded contours on the maps to indicate regional trends of the hazard model. However, the contours only show regional trends that may not be apparent from points on a single map. Differences of up to 2 km have been observed between contours and individual ground acceleration values. We recommend that the user interpolate PGA between the grid point values rather than simply using the shaded contours.
3. Uncertainties in the hazard values have been estimated to be about +/- 50 percent of the ground motion value at two standard deviations (Cramer and others, 1996).
4. Not all active faults in California are included in this model. For example, faults that do not have documented slip rates are not included in the source model. Scientific research may identify active faults that have not been previously recognized. Therefore, future versions of the hazard model may include other faults and omit faults that are currently considered.
5. A map of the predominant earthquake magnitude and distance is provided from the deaggregation of the probabilistic seismic hazard model. However, it is important to recognize that a site may have more than one earthquake that contributes significantly to the hazard. Therefore, in some cases earthquakes other than the predominant earthquake should also be considered.
Because of its simplicity, it is likely that the SPPV method (DOC, 1997) will be widely used to estimate earthquake shaking loading conditions for the evaluation of ground failure hazards. It should be kept in mind that ground motions at a given distance from an earthquake will vary depending on site-specific characteristics such as geology, soil properties, and topography, which may not have been adequately accounted for in the regional hazard analysis. Although this variance is represented to some degree by the

CALIFORNIA GEOLOGICAL SURVEY SHZR 070 56
recorded ground motions that form the basis of the hazard model used to produce Figures 3.1, 3.2, and 3.3, extreme deviations can occur. More sophisticated methods that take into account other factors that may be present at the site (site amplification, basin effects, near source effects, etc.) should be employed as warranted. The decision to use the SPPV method with ground motions derived from Figures 3.1, 3.2, or 3.3 should be based on careful consideration of the above limitations, the geotechnical and seismological aspects of the project setting, and the “importance” or sensitivity of the proposed building with regard to occupant safety.
REFERENCES
Boore, D.M., Joyner, W.B. and Fumal, T.E., 1997, Empirical near-source attenuation relationships for horizontal and vertical components of peak ground acceleration, peak ground velocity, and pseudo-absolute acceleration response spectra: Seismological Research Letters, v. 68, p. 154-179.
California Department of Conservation, Division of Mines and Geology, 1997, Guidelines for evaluating and mitigating seismic hazards in California: Special Publication 117, 74 p.
Campbell, K.W., 1997, Attenuation relationships for shallow crustal earthquakes based on California strong motion data: Seismological Research Letters, v. 68, p. 180-189.
Cramer, C.H. and Petersen, M.D., 1996, Predominant seismic source distance and magnitude maps for Los Angeles, Orange and Ventura counties, California: Bulletin of the Seismological Society of America, v. 85, no. 5, p. 1645-1649.
Cramer, C.H., Petersen, M.D. and Reichle, M.S., 1996, A Monte Carlo approach in estimating uncertainty for a seismic hazard assessment of Los Angeles, Ventura, and Orange counties, California: Bulletin of the Seismological Society of America, v. 86, p. 1681-1691.
International Conference of Building Officials (ICBO), 1997, Uniform Building Code: v. 2, Structural engineering and installation standards, 492 p.
Jennings, C.W., compiler, 1994, Fault activity map of California and adjacent areas: California Department of Conservation, Division of Mines and Geology, California Geologic Data Map Series, map no. 8.
Petersen, M.D., Bryant, W.A., Cramer, C.H., Cao, T., Reichle, M.S., Frankel, A.D., Lienkaemper, J.J., McCrory, P.A. and Schwartz, D.P., 1996, Probabilistic seismic hazard assessment for the State of California: California Department of Conservation, Division of Mines and Geology Open-File Report 96-08; also U.S. Geological Survey Open-File Report 96-706, 33 p.

2003 SEISMIC HAZARD ZONE REPORT FOR THE RICHMOND QUADRANGLE 57
Real, C.R., Petersen, M.D., McCrink, T.P. and Cramer, C.H., 2000, Seismic Hazard Deaggregation in zoning earthquake-induced ground failures in southern California: Proceedings of the Sixth International Conference on Seismic Zonation, November 12-15, Palm Springs, California, EERI, Oakland, CA.
Sadigh, K., Chang, C.-Y., Egan, J.A., Makdisi, F. and Youngs, R.R., 1997, SEA96- A new predictive relation for earthquake ground motions in extensional tectonic regimes: Seismological Research Letters, v. 68, p. 190-198.
Wilson, R.C. and Keefer, D.K., 1983, Dynamic analysis of a slope failure from the 1979 Coyote Lake, California, Earthquake: Bulletin of the Seismological Society of America, v. 73, p. 863-877.
Youd, T.L. and Idriss I.M., 1997, Proceedings of the NCEER workshop on evaluation of liquefaction resistance of soils: Technical Report NCEER-97-0022, 40 p.
Youngs, R.R., Chiou, S.-J., Silva, W.J. and Humphrey, J.R., 1997, Stochastic point-source modeling of ground motions in the Cascadia Region: Seismological Research Letters, v. 68, p. 74-85.

(Unpublished mapping by R. Witter, William Lettis & Associates, Inc.)
B = Pre-Quaternary bedrock.
See "Bedrock and Surficial Geology" in Section 1 of report for descriptions of units.
Plate 1.1 Quaternary geologic map of the Richmond 7.5-Minute Quadrangle, California
Base map enlarged from U.S.G.S. 30 x 60-minute series
1 0
0
0
1
1000 1000 2000 3000 4000 5000 6000 7000 FEET
1 MILE
1 KILOMETER.5
.5
STATE OF CALIFORNIA-GRAY DAVIS, GOVERNORTHE RESOURCES AGENCY-MARY D. NICHOLS, SECRETARY
DEPARTMENT OF CONSERVATION-DARRYL W. YOUNG, DIRECTOR
NSCALE
CALIFORNIA GEOLOGICAL SURVEYJAMES F. DAVIS, STATE GEOLOGIST
RICHMOND QUADRANGLE
122˚15'37˚52' 30"
122˚22' 30"38˚00'
Richmond Quadrangle Plate 1.1SEISMIC HAZARD ZONE REPORT 070
area not evaluated
afaf
QpfQpf
H2OH2O
afbmafbm
QpfQpf
QhfQhf
QhfQhf
QhcQhc
QhlQhlafaf
QhcQhc
QhlQhl
QhfQhf
QhbsQhbs
afaf
QpfQpf
H2OH2O
afaf
QhfQhf
QopQop
afbmafbm
afbmafbm
B
B
B
H2OH2O
afbmafbm
SA
NF
RA
NC
ISC
OC
O

��
�
� ��
�
�
�
�
��
�
�
�
�
�
�
��
�
�
�
�
��
�
�
�
�
�
�
��
�
��
�
�
�
�
�
��
�
�
�
�
�
�
�
�
�
�
�
�
�
�
�
�
�
�
�
�
�
�
�
5
10�
�
��
�
�
�
�
�
��
�
�
�
�
�
�
�
�
�
�
�
�
�
�
�
�
�
�
�
�
�
�
�
��
�
�
�
�� � �
��
�
�
�
�
�
�
�
�
�
H2O
B
B
BSA
NF
RA
NC
ISC
OC
O
10�
B
area not evalated
Depth to ground water, in feetSee "Bedrock and Surficial Geology" in Section 1 of report for descriptions of units.
Pre-Quaternary bedrock.
Plate 1.2 Depth to historically highest ground water and location of boreholes used in this study, Richmond 7.5-Minute Quadrangle, California
Base map enlarged from U.S.G.S. 30 x 60-minute series
1 0
0
0
1
1000 1000 2000 3000 4000 5000 6000 7000 FEET
1 MILE
1 KILOMETER.5
.5
STATE OF CALIFORNIA-GRAY DAVIS, GOVERNORTHE RESOURCES AGENCY-MARY D. NICHOLS, SECRETARY
DEPARTMENT OF CONSERVATION-DARRYL W. YOUNG, DIRECTOR
NSCALE
Geotechnical borings used inliquefaction evaluation
CALIFORNIA GEOLOGICAL SURVEYJAMES F. DAVIS, STATE GEOLOGIST
122˚22' 30"38˚00'
122˚15'37˚52' 30"
RICHMOND QUADRANGLE
�
Richmond Quadrangle Plate 1.2SEISMIC HAZARD ZONE REPORT 070
Ground-water level data provided by the California State Water Resources Control Board.

��
�
� ��
�
�
�
�
��
�
�
�
�
�
�
��
�
�
�
�
��
�
�
�
�
�
�
��
�
��
�
�
�
�
�
��
�
�
�
�
�
�
�
�
�
�
�
�
�
�
�
�
�
�
�
�
�
�
�
5
10�
�
��
�
�
�
�
�
��
�
�
�
�
�
�
�
�
�
�
�
�
�
�
�
�
�
�
�
�
�
�
�
��
�
�
�
�� � �
��
�
�
�
�
�
�
�
�
�
H2O
B
B
BSA
NF
RA
NC
ISC
OC
O
10�
B
area not evalated
Depth to ground water, in feetSee "Bedrock and Surficial Geology" in Section 1 of report for descriptions of units.
Pre-Quaternary bedrock.
Plate 1.2 Depth to historically highest ground water and location of boreholes used in this study, Richmond 7.5-Minute Quadrangle, California
Base map enlarged from U.S.G.S. 30 x 60-minute series
1 0
0
0
1
1000 1000 2000 3000 4000 5000 6000 7000 FEET
1 MILE
1 KILOMETER.5
.5
STATE OF CALIFORNIA-GRAY DAVIS, GOVERNORTHE RESOURCES AGENCY-MARY D. NICHOLS, SECRETARY
DEPARTMENT OF CONSERVATION-DARRYL W. YOUNG, DIRECTOR
NSCALE
Geotechnical borings used inliquefaction evaluation
CALIFORNIA GEOLOGICAL SURVEYJAMES F. DAVIS, STATE GEOLOGIST
122˚22' 30"38˚00'
122˚15'37˚52' 30"
RICHMOND QUADRANGLE
�
Richmond Quadrangle Plate 1.2SEISMIC HAZARD ZONE REPORT 070
Ground-water level data provided by the California State Water Resources Control Board.

SA
NF
RA
NC
ISC
OC
O
area not evalated
�������
� ��
��� ��
����
��
��
�
� Landslide
Base map enlarged from U.S.G.S. 30 x 60-minute series
Plate 2.1 Landslide inventory and shear strength locations, Richmond 7.5-Minute Quadrangle, California.
STATE OF CALIFORNIA-GRAY DAVIS, GOVERNORTHE RESOURCES AGENCY-MARY D. NICHOLS, SECRETARY
DEPARTMENT OF CONSERVATION-DARRYL W. YOUNG, DIRECTOR SEISMIC HAZARD ZONE REPORT 070
NSCALE
1 0
0
0
1
1000 2000 4000
1 MILE
1 KILOMETER.5
.5
6000 FEET
CALIFORNIA GEOLOGICAL SURVEYJAMES F. DAVIS, STATE GEOLOGIST
RICHMOND QUADRANGLE
122˚22'30"
38˚00'
122˚15'
37˚52'30"
Richmond Quadrangle Plate 2.1
Shear Strength Test Location