probabilistic seismic hazard mapping of iceland - iit … · probabilistic seismic hazard mapping...
TRANSCRIPT

13th World Conference on Earthquake Engineering Vancouver, B.C., Canada
August 1-6, 2004 Paper No. 2337
Probabilistic Seismic Hazard Mapping Of Iceland
Proposed seismic zoning and de-aggregation mapping for EUROCODE 8
Julius SOLNES1, Ragnar SIGBJÖRNSSON2 and Jonas ELIASSON3
SUMMARY A few attempts of producing seismic zoning maps of Iceland have been carried out during the last few decades. The earlier efforts were mostly intuitive and based on iso-seismal maps produced from past earthquakes. In the mid 1990s, an attempt was made to produce an iso-acceleration map based on calculated peak acceleration from past earthquakes, using standard attenuation formulae. This map, which was wrought with many discrepancies, was produced as a National application document (NAD) in conjunction with adoption of Eurocode 8. It was clear, however, that the seismic zoning of the country was inadequate and much more research work was needed to provide a reliable earthquake risk map in the form of peak accelerations. The South Iceland earthquakes of the year 2000 provided a wealth of information regarding measured peak accelerations, earthquake source mechanism and attenuation of seismic waves. Moreover, an intensive study of past historical earthquakes has recently been carried out resulting in an upgraded earthquake catalogue for the whole country. Thus all the ingredients for producing a reliable earthquake risk map for Iceland are in place. In this study, the earthquake catalogue has been extended by generation of future earthquake events in order to prevent historical bias. Based on a new attenuation model for seismic waves, the peak accelerations for the whole country have been calculated for a selected subset of the extended catalogue based on Brune’s source spectrum. Thus a fairly stable earthquake zoning map for the whole country has been produced with 475-year peak accelerations. In addition, de-aggregation of this map has been carried out to produce a magnitude and a distance map describing the dominating 475-year event. These maps can be used as a basis for simulation of earthquake time histories at a certain site in concord with the requirements of the Eurocode 8.
1 Professor, Department of civil & environm. engineer., University of Iceland, 101 Reykjavík, Iceland. E-Mail: [email protected] 2 Professor, Earthquake Engineering Research Centre, ERI, University of Iceland, Selfoss, 800 Iceland 3 Professor, Engineering Research Institute, University of Iceland, 101 Reykjavik, Iceland

INTRODUCTION Iceland is a superstructural part of the Mid Atlantic Ridge. The Ridge marks the boundary between the North American and the Euro-Asian Plate and creates a belt of seismic activity from the Azores in the south towards Jan Mayen in the north. Across Iceland from southwest to the north, the plate boundary is displaced to the east through two major fracture zones, the South Iceland Seismic Zone (SISZ) in the lowlands of the south and the Tjörnes Fracture Zone in the north (NISZ), Figure 1. The largest historic earthquakes in Iceland have occurred within these zones and have exceeded magnitude 7, [1], [2], [3], [4], [5]. The focal mechanism of these earthquakes indicates a strike-slip faulting, which is consistent with transform fault interpretation in both zones. The clear topographic expression characteristic of fracture zones on the ocean floor is missing, however, and in neither zone is the transform motion taken up by a single major fault. The City of Reykjavík and surrounding townships are located close to the seismic delineation of the Reykjanes Peninsula where the Mid Atlantic ridge enters the peninsula from the southwest. The peninsula lies within the western volcanic branch, which creates earthquake activity of mixed tectonic and volcanic origin in the nearby Hengill area at the boundary of the SISZ to the East, and following the seismic delineation towards the western edge of the peninsula, Figure 2. Many historic earthquakes with origins in the SISZ and the Reykjanes Zone have been reported in ancient and contemporary chronicles in this area closest to the main urban concentration of the country, Tryggvason et al., [1]. Beside these three main regions of seismic activity, intraplate earthquakes have occurred in the western and northwestern part of the country and also off the East Coast. In Figure 3, a geographic distribution of larger magnitude earthquakes in Iceland is shown for the period 1896-2000, [4].
REVIEW OF THE SEISMICITY OF ICELAND
Through historical times since the settlement of the country in the ninth century, seismic activity has been observed and reported in all seismic zones and moderate to strong earthquakes have occurred. Very strong earthquakes of the order encountered at the Pacific plate boundaries, however, are unlikely to take place. Possibly the strongest earthquake in historic times is the 1784 earthquake in the SISZ, which caused severe damage to farmhouses in the area and three people were killed. Based on the extension of the damage zone with comparison with instrumental magnitudes of more recent events, its local surface wave magnitude has been assessed to be 7.2, [4]. Through ancient annals and chronicles, the earthquake history of Iceland is reasonably well established. From the eighteenth century and onwards the records are quite reliable with good description of damage zones and destruction of farmhouses. The first instrumental records were obtained during the 1896 earthquakes in the South Iceland Lowlands (SISZ), [6]. The most recent activity was manifested by the Year-2000 earthquakes in the SISZ, [7]. The South Iceland Seismic Zone (SISZ) Most destructive earthquakes in Iceland have occurred within the South Iceland Lowlands. The earthquake zone extends about 70 km in the E-W direction with almost perfect alignment of earthquakes in a 5-10 km broad band from the Hengill and Ölfus region in the West, closest to Reykjavík, towards Rangárvellir in the east. No major E-W striking faults can be found and the destruction zones of individual earthquakes tend to be elongated in a N-S direction, Figure 2. Major earthquake sequences have affected the sparsely populated farmlands through historical times with recurrence intervals between 45 to 112 years.

Figure 1: The Interrelationship between the Volcanic and Seismic Zones in Iceland The historic earthquakes in the Zone can thus be grouped according to their origin and type into three different categories. The relatively strong trigger earthquakes of the major sequences are placed in the first category. They occur in the eastern part of the zone, which seems to be the starting point of these sequences. The trigger earthquakes, which are the largest magnitude earthquakes to occur, are followed by a sequence of smaller earthquakes, which take place all over the Zone in a matter of days, weeks or months. Some sequences have lasted up to two even three years. The major sequences in this category occurred in 1294, 1339, 1389-91, 1630-33, 1732-34, 1784, 1896, and then the 2000 earthquakes with its two equally large earthquakes four days apart. The large interval including the fifteenth century may be due to poor historical records from that time of pest epidemic, diseases and chaos in the Country, the so-called historical gap, rather than scarcity of earthquakes. The second category classifies single earthquakes, which have occurred without any noteworthy aftershocks in the eastern part of the Zone, and the third category classifies similar single events in the western part, which are generally smaller. The Reykjanes Seismic Zone (RSZ) The Reykjanes Peninsula, which forms a transition zone from the Reykjanes Ridge to the west, across the western volcanic branch to the SISZ in the east, is an important region due to its proximity to the main industrial and population centre of Reykjavik and vicinity. The Mid-Atlantic plate boundary enters Iceland at the tip of Reykjanes and runs along the peninsula in easterly direction, delineating an area of high seismic activity less than 2 km wide in most places. The peninsula is also a region of active volcanism, which is manifested by the large post-glacial lava fields. The region thus encompasses a highly complex geophysical structure with interaction between volcanic and tectonic activity.
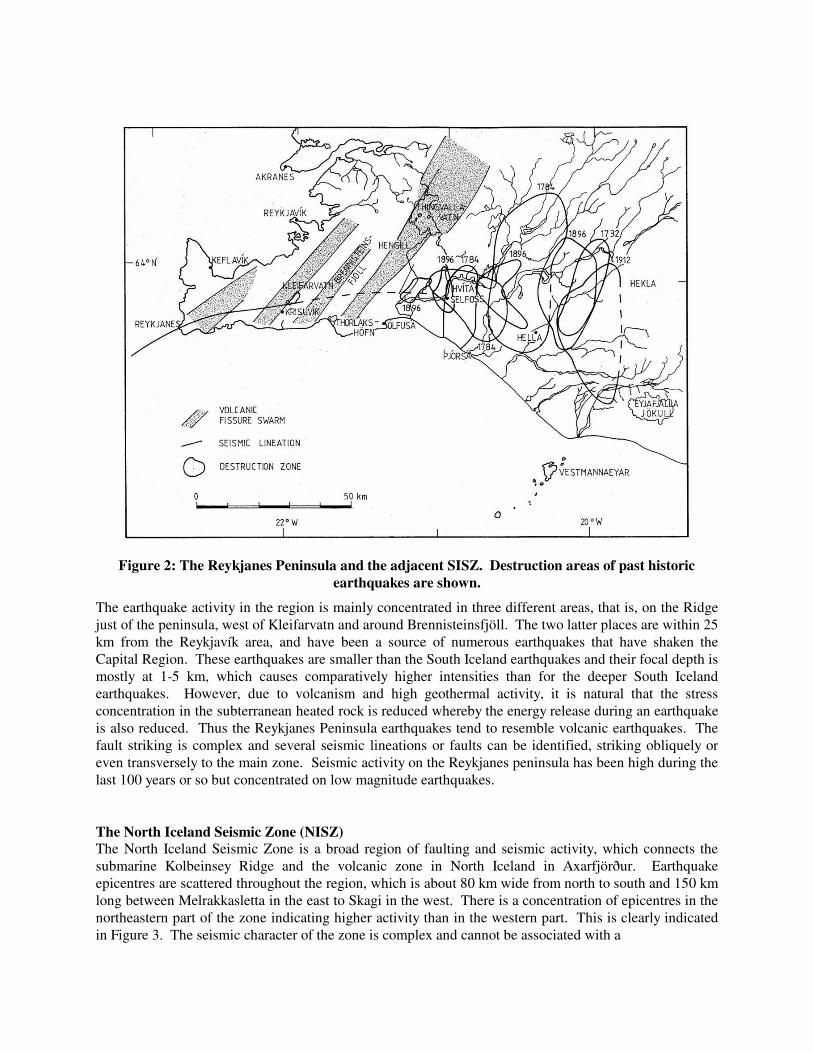
Figure 2: The Reykjanes Peninsula and the adjacent SISZ. Destruction areas of past historic earthquakes are shown.
The earthquake activity in the region is mainly concentrated in three different areas, that is, on the Ridge just of the peninsula, west of Kleifarvatn and around Brennisteinsfjöll. The two latter places are within 25 km from the Reykjavík area, and have been a source of numerous earthquakes that have shaken the Capital Region. These earthquakes are smaller than the South Iceland earthquakes and their focal depth is mostly at 1-5 km, which causes comparatively higher intensities than for the deeper South Iceland earthquakes. However, due to volcanism and high geothermal activity, it is natural that the stress concentration in the subterranean heated rock is reduced whereby the energy release during an earthquake is also reduced. Thus the Reykjanes Peninsula earthquakes tend to resemble volcanic earthquakes. The fault striking is complex and several seismic lineations or faults can be identified, striking obliquely or even transversely to the main zone. Seismic activity on the Reykjanes peninsula has been high during the last 100 years or so but concentrated on low magnitude earthquakes. The North Iceland Seismic Zone (NISZ) The North Iceland Seismic Zone is a broad region of faulting and seismic activity, which connects the submarine Kolbeinsey Ridge and the volcanic zone in North Iceland in Axarfjörður. Earthquake epicentres are scattered throughout the region, which is about 80 km wide from north to south and 150 km long between Melrakkasletta in the east to Skagi in the west. There is a concentration of epicentres in the northeastern part of the zone indicating higher activity than in the western part. This is clearly indicated in Figure 3. The seismic character of the zone is complex and cannot be associated with a

22° W 16° W 14° W
63° N
64° N
65° N
66° N
67° N
24° W 18° W 20° W
Figure 3: Earthquakes in Iceland 1896-2000 with surface wave magnitudes Ms>4, [4] single fault or plate boundary. Studies of recent earthquakes show that a considerable part of the seismicity is associated with possibly three parallel WNW trending lineaments, which originate in the volcanic belt, Figure 4. The Grimsey seismic lineament runs slightly north of Grimsey and joins the Krafla fissure swarm in Axarfjörður. It has no clear trace in the topography. Instead, the surface structure is characterized by northerly trending troughs and ridges. In some respect this resembles the structure in the SISZ where the epicentral belt lacks clear surface manifestation. Along the second seismic lineament, which runs NWN from Husavik across Flatey and the mouth of Eyjafjörður, the 1872 magnitude 6.5 earthquake caused widespread damage in Husavik, Flatey and Flateyjardalur. The third speculative seismic lineament also runs NWN from Krafla across Eyjafjörður near Dalvik and to the mouth of Skagafjörður. Finally, a magnitude 7 earthquake occurred in the mouth of Skagafjörður on the third speculative lineament in 1963. As is the case with most historic earthquakes in the NISZ, the epicentre was off the coast in the ocean and the land intensity therefore low. The earthquake caused alarm and some slight damage in the nearby town of Sauðárkrókur where the MM Intensity was VII. Other regions Intraplate earthquakes, which originate away from the plate boundaries, are rare in Iceland. Historic records mention seismic activity near Öræfajökull in the Vatnajökull region during the 1727 volcanic eruption there. Earthquake swarms with low to moderate magnitude singular earthquakes have occasionally been registered locally in the Borgarfjörður area in the mid western past of the country. The focal mechanism

Figure 4: Main tectonic features of the NISZ with lines of seismic activity
of these earthquakes indicates a slip-dip motion due to horizontal strain in the crust, [5]. Finally, smaller earthquakes near the margin of the insular shelf east of Iceland are known to occur. Damage in such “off the coast” earthquakes has never been reported.
THE EARTHQUAKE CATALOGUE
Although the earthquake history of the country is reasonably well covered since the settlement of Iceland in the ninth century, the earthquake catalogue is not precise and several historical events may have been missed altogether, [1], [3]. The so-called historical gap in the 14th century, when writing of chronicles and annals seems to have waned, may have resulted in large events not being reported. It is only recently, that uniform retrieval and assessment of teleseismic data has been used as a basis for earthquake catalogues, and instrumental records of Icelandic earthquakes are only available since 1912. The magnitudes of events before 1896 are speculative whereas the magnitudes after 1896 are instrumental (cf. [6]). The problem with basing the earthquake hazard on the few historical earthquakes available is evident. The historical catalogue is both unreliable and does not take into account future events that may occur in different locations within the zone. Therefore, attempts have been made to simulate or generate artificial catalogues, which are based on the inter-arrival times of past events and known geophysical characteristics of the seismic zones, [8], [9], [10], [11]. Thus the historical catalogue can be extended into the future in order to produce more consistent hazard maps and test the sensitivity of existing maps to different earthquake scenarios, [10]. A comprehensive revision and re-appraisal of the seismicity of Iceland, with a list of all historical and recorded earthquakes since 1896, has been presented by Ambraseys and Sigbjörnsson, [4].

Future earthquake events that will cause noticeable accelerations can be generated as singular random events, which occur in space and time with different magnitudes. These characteristics can be described by a stochastic process of the Klondike type, [10]. Let X(λ,φ,h,m,t) be a stochastic point process where (Λ,Φ,H) are the random latitude, longitude and focal depth of the earthquake event. M is a random magnitude, and T is the random year of occurrence calculated as the time of the last event plus the inter-arrival time. The event generation is produced stepwise by a simple Monte Carlo technique as follows:
1. The inter-arrival times T are generated based on the density pT(t), which can be obtained from past earthquake events using the kernel technique, [10].
2. The magnitudes M can either be simulated using the exponential density or by fitting a second
order polynomial through the cumulative magnitude distribution of past earthquakes, [10], [11]. Other seismic zones are defined in similar way, even though more complex geometry is needed.
3. The epicentral location (Λ,Φ) is simulated using a conditional density pΛΦ?M(λ,φ|m). For the
SISZ, the latitude has been fixed as 63.950N, whereas the longitude is simulated between 19.50W and 21.50W, conditional on the magnitude, where the strongest earthquakes occur between 19.90W and 20.50W, [11].
4. The focal depth H is simulated using the conditional density pH|ΛΦ(h|λ,φ). For the SISZ, the
depth is gradually changing from east towards west, with the shallowest earthquakes in the west, [11]. For other zones the depth model reflects the available information outlined above.
The implied assumption of independent M and T’s can be relaxed by introducing the conditional density pM|T(m|t) that would represent a slip-predictable earthquake. By interchanging steps 1 and 2, the conditional density pT|M(t|m) would, on the other hand, represent a time-predictable earthquake. Other parameters such as the fault length L, the depth of the breaking zone D, and the strike Θ of the fault in each earthquake can also be estimated along with the seismic moment M0 and the coseismic slip u=M0/(µ•L•D), µ being the rigidity of the bedrock (about 3.97•1011 dyn/cm2 for the area, [11]). Using the above methodology, a synthetic earthquake catalogue can be produced for the whole country. Examples of synthetic catalogues generated for the SISZ can be found in [10].
METHODOLOGY
In order to calculate the earthquake hazard for a certain region, the standard procedure is to subdivide the region, using a grid of mxn points and calculate the effects of earthquakes affecting the region at each grid point, (see for instance, [10]). There are several ways of setting up a procedure for this exercise. For instance, following Lomnitz [12], a risk function RT can be defined as the probability of occurrence of an earthquake of magnitude MT or more in a period of T years, that is, RT =1-exp[-T•exp(α-βMT)] (5) where the coefficients α and β are related to the magnitude-frequency relation coefficients a and b as follows log10N(m) = a-b•m=(α•log10e)-(β•log10e)m (6)
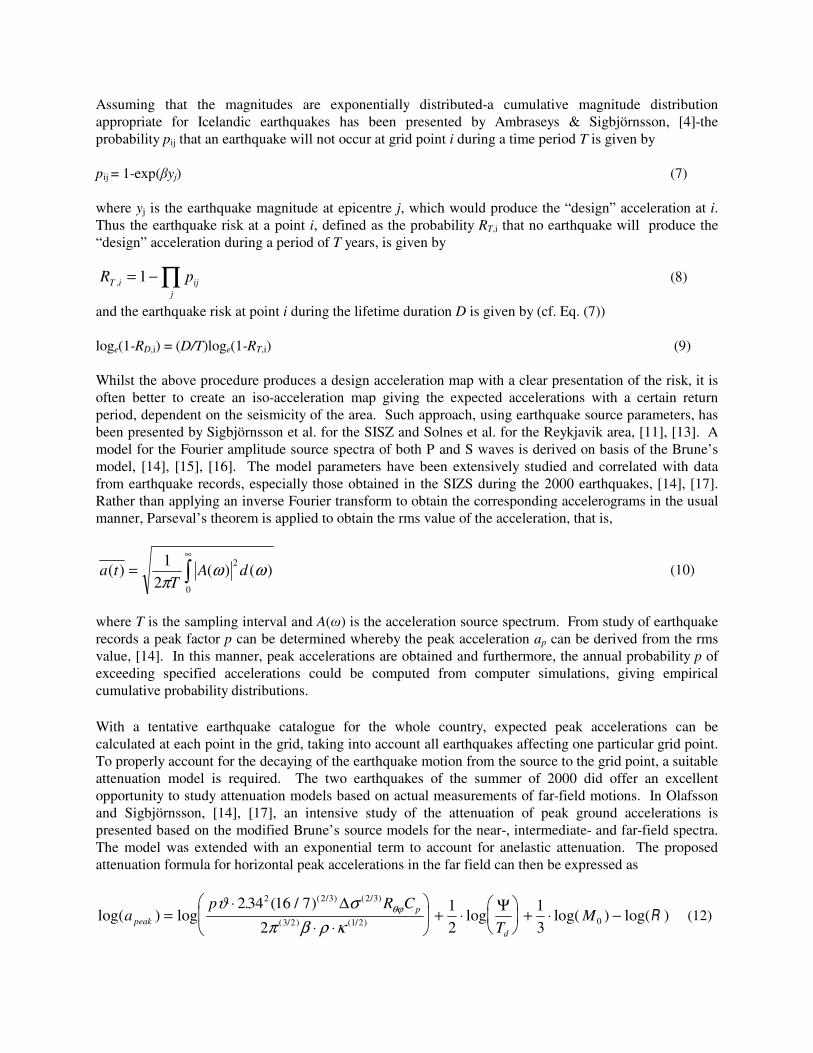
Assuming that the magnitudes are exponentially distributed-a cumulative magnitude distribution appropriate for Icelandic earthquakes has been presented by Ambraseys & Sigbjörnsson, [4]-the probability pij that an earthquake will not occur at grid point i during a time period T is given by pij = 1-exp(βyj) (7) where yj is the earthquake magnitude at epicentre j, which would produce the “design” acceleration at i. Thus the earthquake risk at a point i, defined as the probability RT,i that no earthquake will produce the “design” acceleration during a period of T years, is given by (8) and the earthquake risk at point i during the lifetime duration D is given by (cf. Eq. (7)) loge(1-RD,i) = (D/T)loge(1-RT,i) (9) Whilst the above procedure produces a design acceleration map with a clear presentation of the risk, it is often better to create an iso-acceleration map giving the expected accelerations with a certain return period, dependent on the seismicity of the area. Such approach, using earthquake source parameters, has been presented by Sigbjörnsson et al. for the SISZ and Solnes et al. for the Reykjavik area, [11], [13]. A model for the Fourier amplitude source spectra of both P and S waves is derived on basis of the Brune’s model, [14], [15], [16]. The model parameters have been extensively studied and correlated with data from earthquake records, especially those obtained in the SIZS during the 2000 earthquakes, [14], [17]. Rather than applying an inverse Fourier transform to obtain the corresponding accelerograms in the usual manner, Parseval’s theorem is applied to obtain the rms value of the acceleration, that is, (10) where T is the sampling interval and A(ω) is the acceleration source spectrum. From study of earthquake records a peak factor p can be determined whereby the peak acceleration ap can be derived from the rms value, [14]. In this manner, peak accelerations are obtained and furthermore, the annual probability p of exceeding specified accelerations could be computed from computer simulations, giving empirical cumulative probability distributions. With a tentative earthquake catalogue for the whole country, expected peak accelerations can be calculated at each point in the grid, taking into account all earthquakes affecting one particular grid point. To properly account for the decaying of the earthquake motion from the source to the grid point, a suitable attenuation model is required. The two earthquakes of the summer of 2000 did offer an excellent opportunity to study attenuation models based on actual measurements of far-field motions. In Olafsson and Sigbjörnsson, [14], [17], an intensive study of the attenuation of peak ground accelerations is presented based on the modified Brune’s source models for the near-, intermediate- and far-field spectra. The model was extended with an exponential term to account for anelastic attenuation. The proposed attenuation formula for horizontal peak accelerations in the far field can then be expressed as
log( ) log. ( / )
log log( ) log( )( / ) ( / )
( / ) (1/ )ap R C
TMpeak
p
d
=⋅
⋅ ⋅
+ ⋅
+ ⋅ −
ϑ σπ β ρ κ
θϕ2 34 16 7
2
1
2
1
3
2 2 3 2 3
3 2 2 0
∆ ΨR (12)
∏−=j
ijiT pR 1,
∫∞
=0
2)()(
21
)( ωωπ
dAT
ta

in which p is the peak factor, ϑ is a site dependent magnification factor, ∆σ denotes the stress drop, Rθϕ is the radiation pattern, Cp is a reduction factor accounting for partitioning of the motion into two horizontal components, β is the shear wave velocity, ρ is the density of the fracturing rock, κ is the spectral attenuation, Ψ is a normalised spreading value defined below, Td denotes the duration of the motion, M0 is the seismic moment of the earthquake and R denotes the geometrical spreading function. Similar formulas are available for the near field, [20]. In this manner, a series of peak acceleration values were obtained at all grid points for the entire country. The probability distribution function of the acceleration can then formally be defined as
( ) ( )Pr maxkA t T kF a A t a∈ = ≥ (13)
where the index k is the event number, tk is the time, A(⋅) is the sample acceleration and a is a corresponding state variable. The distribution is estimated from the sample by introducing the following indicator function
( )1
0 elsewherek
j kt Tj
A t aU ∈
∀ ≥= (14)
Then the distribution is estimated as
( ) ( )1
1Pr max
k
N
A t T k jj
F a A t a UN∈
=
= ≥ = ∑ (15)
where N refers to total number of earthquakes in the synthetic catalogue used as a basis for the simulation. To conform with the Eurocode 8 requirements, fractile values of the peak acceleration ap were extracted from the numerical data, using suitable extreme value distribution procedure (cf. Eqs. (13)-(15)), corresponding to the 475 year return period or values that have 10% probability of being exceeded in 50 years. Actually, if the acceleration value AE has the return period TE, the probability of having a larger acceleration in TL years, the lifetime of a structure say, is given by the following conditional probability,
[ ] 475
50
)10.01ln(exp1
1
)1ln(exp1
1111 =
−−=
−−=↔
−−===>
L
L
E
T
ELLE
T
pT
TpTtAAP
L
Thus, the numerical data was ordered and the maximum values used to extract the 475-year values through interpolation. A map showing the expected 475-year peak acceleration values by coloured areas is presented in Figure 5.

24° W 22° W 20° W 18° W 16° W 14° W 63° N
64° N
65° N
66° N
67° N
> 40% g20-40% g10-20% g5-10% g2-5% g< 2% g
Figure 5: Probabilistic seismic hazard map for the 475-year peak acceleration
DE-AGGREGATION OF THE HAZARD MAP
Aseismic codes have traditionally been based on a static approach where the dynamic earthquake action is transformed into “statically equivalent loads”. Such format is often called prescriptive, referring to the prescribed static forces in contrast with performance-based codes where clear design objectives and corresponding structural behaviour is the central issue. Under certain circumstances, both approaches require full dynamical approach, especially in the case of highly irregular structures. Thus, in the design provisions of EUROCODE 8, a multi-modal dynamical analysis is required for all but simple regular structures, and full dynamical approach based on time series analysis is now an integral and recommended part of the provisions. In Eurocode 8 (January 2003 version), real, recorded earthquake accelerograms, artificial records and simulated records are permitted for the analysis. In all cases the average 5% response spectra from all time histories should match the linear elastic response spectrum in the code with no spectral value less than 90% of the code values. This may seem a sound approach at first sight, but as pointed out by many researchers it has different shortcomings and can not be recommended, especially for non-linear analysis. The main reason is that the response spectrum as defined by the code is a uniform hazard spectrum, which can be visualised as an envelope of response spectra from different seismic sources. Hence the resulting time series do not represent real accelerograms and in general have quite different appearance, reflecting unrealistic spectral content. The simulated or synthetic time series based on theoretical and/or empirical models of the fault ruptures and focal mechanism do better reflect the real behaviour of the earthquake motion. The use of such models is especially recommended for non-linear structural analysis along with real accelerograms. In the so-called National Application Documents or National Annexes to the code provisions, hazard maps are presented in the form of 475-year peak acceleration maps. However, no guidelines for

producing artificial or simulated acceleration records other than the matching of the response spectra are given. The main parameters, however, in shaping the motion will be the distance to the source and the magnitude of the earthquake. Through de-aggregation of the hazard map such information can be provided in the form of earthquake source and distance maps. By de-aggregation is meant the act of tracing back for each grid point the (most probable) event producing the dominant hazard, in this case the peak ground acceleration. The event is described by magnitude and distance to the source along with other variables, which generate the peak acceleration. The de-aggregation is performed by indexing each simulated event that enters the distribution of grid point acceleration values and then using the indices to back-track the event producing the dominant hazard. After this has been done for each grid point, the dominant hazard is contoured and displayed in an appropriate map. By applying this procedure, two maps can be produced. Firstly, the contour map of magnitudes, which underly the peak acclerations, is shown in Figure 6, and secondly, a contour map of source distances is displayed in Figure 7. Whereas the interpretation of the source distance map, Figure 7, is straightforward, the magnitude map, Figure 6, is interpreted such that the earthquake having the largest effect at a certain location has the magnitude given by the map at that location. Thus in the eastern and western parts of the country, where the seismicity is negligent, only the largest earthquakes with great epicentral distance will produce any effect. The maps presented in Figures 6 and 7 are applied as follows. For a particular location (a building site), the source distance and magnitude appropriate for the location are selected from the maps. A potential earthquake source can be defined by applying the earthquake catalogue for Iceland (Ambraseys and Sigbjörnsson, [4]). Often this will result in two probable earthquake scenarios, which is for instance the case for Reykjavik. In that case the first scenario is an earthquake on the Reykjanes Peninsula and the second scenario is an earthquake with origin in the SISZ. Real earthquake data can be applied along with synthetic accelerograms.
24° W 20° W 18° W 16° W 14° W
63° N
64° N
65° N
66° N
67° N
22° W
> 6.56.0-6.55.5-6.0< 5.5
Figure 6: Magnitude of the earthquake that causes the dominant hazard for the 475-year peak ground acceleration

All member countries of the CEN, which is the body in charge of the EUROCODE programme, are busy preparing their hazard maps for the national annexes of EUROCODE 8. The final vote draft of Part 1 of the code was submitted in December of 2003 and is expected to be approved by May of this year. Thus the earthquake design provisions with annexed hazard maps for all European member countries of the CEN should gradually be implemented and become valid for use by the end of this year. However, the national annexes are probably in come cases not up to par with the progress of the code itself. An overview of the earthquake hazard mapping of most European member countries of the CEN is presented in Bollettino di Geofisica, [18].
MODELLING OF UNCERTAINTIES
It is well known that uncertainties in the characterisation of the strong-motion data play a significant role in the hazard assessment, [19]. In this study the uncertainties have been accounted for by introducing the basic variables constituting the strong-motion model as independent stochastic variables. The statistical distributions describing the basic variables are based on available strong-motion data and geophysical information. Details of the adopted procedure are outlined in [19].
PRIORITISATION
The hazard maps that have been presented in this paper are not appropriate or adequate as building code zoning maps for towns and urban regions. Also, special maps are required for buildings within or close to epicentral regions where special conditions due to active surface faults may apply. Preparation of such special maps is beyond the scope of this work but a few remarks regarding the fundamental approach to
67° N
22° W 20° W 18° W 16° W 14° W 63° N
64° N
65° N
66° N
24° W
< 10 km10-20 km20-50 km50-100 km> 100 km
Figure 7: Distance of the earthquake that causes the dominant hazard for the 475-year peak ground acceleration
this undertaking are in place. Firstly, the overall earthquake risk should be assessed and areas for more detailed zoning maps selected on the basis of the economical benefits obtained. This work should becarried out with due consideration of the location, composition and integrity of the building park in the chosen area, which should be classified into building type categories. A damage index for each category should be determined and the valuation of fixed assets based on official records. Thus, damage scenarios for each county or community can be visualised and quantified. On this basis, the special zoning maps should be prepared according to maximum economical benefits. Obviously, the Reykjavik area would be first in line. A special zoning map for Reykjavik has already been prepared and published, [13].
CONCLUSION
Based on a revised historical earthquake catalogue for Iceland extended into the future with simulated earthquake events based on the Klondike process, a probabilistic hazard map has been calculated and presented in the form of 475-year peak accelerations. The main factors behind the map are the earthquake sources and magnitudes and the attenuation of the earthquake motion. The attenuation model applied seems to work well with the instrumental data obtained during the year 2000 earthquakes in the Southern Lowlands. It can be questioned whether it is also applicable in other parts of the country. However, for lack of instrumental data and since similar geophysical characteristics are prevalent in all earthquake zones, its general use seems warranted. The simulated catalogue extension is deemed to be important in order to prevent single historical earthquake events from distorting the earthquake hazard and therefore to produce more stable and realistic hazard maps. The 475-year peak acceleration map thus conforms well to the earthquake sources and the perceived risk. By using data information from each grid point to backtrack the event producing the hazard, de-aggregation maps have been produced to provide a basis for setting up proper design accelerations at a desired location. In modern building codes such as Eurocode 8, emphasis is being placed on time history analysis based on realistic acceleration records. Therefore, the national annexes should also contain de-aggregation maps as basis for simulation of earthquake records.
REFERENCES 1. Tryggvason ES, Thoroddsen S & Thorarinsson S. “Report on Earthquake Risk in Iceland (in
Icelandic), Bull. Assoc. Chart. Engrs. in Iceland”, 43 (1-9), 1959. 2. Björnsson S, & Einarsson P. “Seismicity of Iceland”. In: Geodynamics of Iceland and the North
Atlantic Area, Kristjánsson, Leo (Ed.), Nato ASI Series, C.D. Reidel, Holland, 1974. 3. Solnes J. “The Seismicity and Earthquake Hazard in Iceland”, Reunión Unión Geofísica Mexicana,
Puerto Vallarta, 1991. 4. Ambraseys NN & Sigbjörnsson R. “Re-Appraisal of the Seismicity of Iceland”. Polytechnica-
Engineering Seismology, No. 3, Earthquake Engineering Research Centre, University of Iceland, 2000.
5. Björnsson S & Einarsson P. “Earthquakes” (in Icelandic). In: “Nattura Islands” (121-155), Almenna Bokafelagið, Reykjavik, 1980.
6. Newby JR. “The earthquakes in Iceland 1896”, Journal of Manchester Geographical Society, 12 (174-182), 1896
7. Sigbjörnsson R et al. “Earthquakes in South Iceland-17th and 21st June 2000” (in Icelandic), Earthquake Engineering Research Centre, University of Iceland, Report No. 00001, 2000.

8. Solnes J, Sigbjörnsson R & Halldorsson B. “Assessment of Seismic Risk and Earthquake Hazard Based on Simulated and Upgraded Earthquake Catalogues”, Proc. 9th International Seminar on Earthquake Prognostics, San José, Costa Rica, 1994.
9. Solnes J & Halldorsson B. “Generation of Synthetic Earthquake Catalogues: Applications in Earthquake Hazard and Seismic Risk Assessment”, Proc. 5th International Conference on Seismic Zonation, Nice, France, Oest Éditions, Presses Académiques, (1131-1140), Nantes 1995.
10. Solnes J. “Earthquake Hazard and Seismic Risk Analysis”, Chapter 8 in “Stochastic Processes and Random Vibration: Theory and Practice”, John Wiley & Sons Ltd., 1997.
11. Sigbjörnsson R, Baldvinsson GI. & Thrainsson H. “A stochastic simulation approach for assessment of seismic hazard maps in “European Seismic Design Practice”, Elnashai, A. (Ed.), Balkema, Rotterdam, 1995.
12. Lomnitz Cinna, “Global tectonics and earthquake risk”, Developments in Geotectonics, 5, Elsevier, 1974.
13. Solnes J, Sigbjörnsson R & Eliasson J. “Earthquake Hazard Mapping and Zoning of Reykjavik”, 12ECEE, 2000.
14. Olafsson S & Sigbjörnsson R “Attenuation of Strong Ground Acceleration: A Study of the South Iceland Earthquakes 2000”, 12ECEE, 2000.
15. Brune JN. “Tectonic stress and the spectra of seismic shear waves from earthquakes”, Journal of Geophysical Research, 75 (4997-5009), 1970.
16. Anderson JG & Hough SE. “A model for the shape of the Fourier amplitude spectrum of acceleration at high frequencies”, Bulletin of the Seismological Society of America, 74 (1969-1993), 1984.
17. Olafsson S & Sigbjörnsson R. “A theoretical attenuation model earthquake-induced ground motion”, Journal of Earthquake Engineering, Imperial College Press, 3 (287-315), 1999.
18. Cecic I, García-Fernández M and Slejko D. “Advances in Seismic Hazard”, Bollettino di Geofisica; teorica ed applicata, 42, 1-2, 2001.
19. Sigbjörnsson R & Ambraseys NN. “Uncertainty analysis of strong-motion and seismic hazard”, Bulletin of Earthquake Engineering 2004 (in press)
20. Sigbjörnsson R, Olafsson S. “On the South Iceland earthquakes in June 200: Strong-motion effects and damage”. Bolletino di Geofisica; teoria ed applicata, 2004 (in press).