seismic performance of reinforce concrete buildings...
TRANSCRIPT

Contents lists available at ScienceDirect
Engineering Structures
journal homepage: www.elsevier.com/locate/engstruct
Seismic performance of reinforce concrete buildings designed according tocodes in Bangladesh, India and U.S.
Muhammad Mostafijur Rahman, Sagar M. Jadhav, Bahram M. Shahrooz⁎
Department of Civil and Architectural Engineering and Construction Management, University of Cincinnati, USA
A R T I C L E I N F O
Keywords:ASCE 7-10BNBC-1993IS-1893Building codeNonlinear response history analysisReinforced concrete frameSeismic performance
A B S T R A C T
This paper focuses on the comparison of seismic design provisions in Bangladesh (BNBC-1993), India (IS-1893),and the U.S. (ASCE 7-10) in relation to analysis, design, and seismic performance of reinforced concretebuildings on the basis of the type of allowable analysis procedures, zoning system, site classification, funda-mental vibration period of the structure, response reduction factor, importance factor, minimum design lateralforce, allowable story drifts, and design response spectra.
Three geometrically similar commercial reinforced concrete buildings in high seismic regions of Bangladesh,India, and U.S. were designed and detailed per the respective codes. Three-dimensional nonlinear dynamicanalyses of the designed structures were conducted. Each structure was subjected to a pair of orthogonallyapplied artificial ground motions compatible with the design response spectrum for each building code. Thestructural performance of each building was compared in terms of roof displacements, inter-story drifts, load-carrying capacity of beams and columns, and overall energy dissipation characteristics. The comparisons al-lowed an in-depth evaluation of the differences in the seismic performance of buildings designed according toASCE 7-10, BNBC-1993, and IS-1893 codes. The Indian code performed better when subjected to the groundmotion that is intended to represent the Indian design response spectrum.
1. Introduction
Major earthquakes have been recorded in Bangladesh, India, andthe U.S. Bangladesh has experienced seven major earthquakes ofmagnitude over 7.0 during the last two hundred and fifty years, e.g.,Bengal Earthquake of 1885 and Srimongol Earthquake of 1918. TheBhuj earthquake (M 7.7) of 2001 in India resulted in the loss of nearly20,000 lives and severe damage to 339,000 houses. The 1989 LomaPrieta and 1994 Northridge earthquakes led to a loss of 120 lives andmajor damage to buildings and infrastructure. The situation is direr dueto poorly constructed buildings and over population in Bangladesh andIndia. To minimize damage and loss of life, seismic design codes havebeen developed.
Design codes in the U.S. are refined and updated approximatelyevery 3–5 years in order to keep up with advances in earthquake en-gineering and to incorporate research findings, and are reflected inAmerican Society of Civil Engineers, ASCE 7-10 [2]. The Indian seismiccode (IS-1893), first published in 1962, has been revised only five timesin the last 50 years; the most recent revision being in 2002 after thedevastating Bhuj earthquake. Bangladesh National Building Code
(BNBC), developed in 1993, was officially enacted in 2006 withoutchanging the code ([3]). According to Bari and Das [4], the value ofdesign base shear is the least in BNBC-1993 in comparison to ASCE 7-10and IS-1893. Some studies have pointed out a number of limitations ofthe code in terms of seismic hazard protection. Reinforced concreteframe buildings were heavily damaged in Bhuj earthquake, and themajority of them collapsed completely according to a reconnaissancereport prepared by World Seismic Safety Initiative ([13]). Based on theobservations and lessons learned from Bhuj earthquake, most of theweaknesses in the 1984 edition of IS-1893 were removed in the 2002version of the code. Buildings designed according to the U.S. seismicprovisions are generally expected to perform well.
Although the three design codes share some commonalities, it isunclear whether a building designed according to ASCE 7-10, BNBC-1993, and IS-1893 codes would perform as intended when the buildingis subjected to a design level ground motion that has a response spec-trum comparable to the one used in design. For example, are the driftlimits met? is week girder-strong column design methodologyachieved? The focus of the reported research was to answer these andother questions by comparing the seismic performances of reinforced
https://doi.org/10.1016/j.engstruct.2018.01.010Received 5 June 2017; Received in revised form 6 November 2017; Accepted 4 January 2018
⁎ Corresponding author at: University of Cincinnati, Department of Civil and Architectural Engineering and Construction Management, 765 Baldwin Hall, Cincinnati, OH 45221-0071,USA.
E-mail addresses: [email protected] (M. Mostafijur Rahman), [email protected] (S.M. Jadhav), [email protected] (B.M. Shahrooz).
Engineering Structures 160 (2018) 111–120
0141-0296/ © 2018 Elsevier Ltd. All rights reserved.
T

concrete buildings designed according to the codes from Bangladesh,India, and the U.S. For this purpose, geometrically similar reinforcedconcrete moment-resisting frames, used as commercial buildings, wereselected and designed. The three codes were compared on the basis ofthe type of allowable analysis procedures, zoning system, site classifi-cation, fundamental vibration period of the structure, response reduc-tion factor, importance factor, minimum design lateral force, allowable
story drifts, and design response spectra. Nonlinear response historyanalysis of each structure was conducted, and a number of key metricswere used to compare the performances of the three structures.
2. Comparison of seismic provisions
ASCE 7-10 utilizes seismic design category (SDC) concept to
Table 1Comparison of seismic provisions of ASCE 7 [2], IS 1893 [9] and BNBC 1993.
ASCE 7 [7] IS 1893 [9] BNBC 1993
(a) Zoning systemi. Each region is assigned a location specific mappedspectral acceleration parameter (SS, short periodand S1, 1 sec).
ii. SS & S1 are modified for Site Class effects to getMaximum Considered Earthquake (MCE) spectralresponse acceleration parameters (SMS and SM1).
iii. The design spectral acceleration SDS and SD1parameters can be obtained by dividing SMS andSM1 parameters by 1.5.
i. The country is divided into 4 zones (II, III, IV and V).ii. Each zone is assigned a factor (Z), which is used to obtain the
response spectrum depending on the perceived seismichazard in that zone corresponding to MCE.
i. The country is divided into 3 zones (1, 2, 3)ii. Each zone is assigned a coefficient (Z).
(b) Site classificationi. Average shear wave velocity (vs), average fieldstandard penetration resistance (N ), and averageundrained shear strength (su) for the top 30.5m areused to classify different sites.
i. Site classification depends only on the standard penetrationvalue (N).
i. Site classification depends on shear-wavevelocity and soil profile depth. Site soils areclassified into four types: S1, S2, S3, and S4.
(c) Approximate fundamental periodi. Approximate fundamental period for “ReinforcedConcrete (RC) Moment Resisting Frame” is
Ta=0.0466hn0.9, hn in m.
i. Approximate fundamental period for “Reinforced ConcreteMoment Resisting Frame”,
Ta=0.075hn0.75, hn in meter.
i. Approximate fundamental period for“Reinforced Concrete Moment Resisting Frame”,
Ta=0.073 hn 0.75, hn in meter.
(d) Response reduction factor (R)Classification of RC moment resisting frames:i. Ordinary Moment Resisting Frame (OMRF), R=3.ii. Intermediate Moment Resisting Frames (IMRF),
R=5.iii. Special Moment Resisting Frame (SMRF), R=8.
Classification of RC moment resisting frames:i. Ordinary Moment Resisting Frame (OMRF), R=3.ii. Special Moment Resisting Frame (SMRF), R=5.
Classification of RC moment resisting frames:i. Ordinary Moment Resisting Frame (OMRF),R=5.
ii. Intermediate Moment Resisting Frames (IMRF),R=8.
iii. Special Moment Resisting Frame (SMRF), R=12.
(e) Importance factori. Based on the four risk categories (I, II, III, & IV),ASCE 7 has four seismic importance factors (Ie):1.0, 1.0, 1.25, and 1.5, respectively
i. Based on the functional use and the occupancy of thebuildings, IS 1893 has two importance factors (I): 1.0 and 1.5
i. Based on the five risk categories (I, II, III, IV, &V), BNBC has five seismic importance factors:1.25, 1.25, 1.0, 1.0, 1.0, respectively.
(f) Drift criterioni. Allowable “inelastic” story drifts are limited to0.020Hstorey for commercial buildings having Riskcategory I or II.
ii. The allowable limits decrease as the risk categoryincreases. Refer to Table 12.12.1, ASCE7-10.
i. Allowable “elastic” story drifts are 0.004Hstorey for all thestructures irrespective of any structural or risk category.
Refer to clause 7.11.1, IS 1893(Part 1): 2002.
Story Drift, Δ, shall be limited as follows:i. Δ≤ 0.04h/R≤ 0.005h for T≤ 0.7 sec.ii. Δ≤ 0.03h/R≤ 0.004h for T≥ 0.7 sec.iii. Δ≤ 0.0025h for unreinforced masonry structureswhere h=height of the buildingRefer to Section 1.5.6.1 BNBC.
(g) Minimum design lateral forcei. Design lateral force calculated from static analysisis
= ×V C Wswhere Cs=the seismic response coefficient
=⎜ ⎟⎛⎝
⎞⎠
CsSDS
RIe
and W=the seismic weight of the building
i. Design lateral force calculated from static analysis is= × × ×V WS
gIR
12
where (S/g)= spectral response acceleration parameter for MCEresponse spectrum corresponding to Ta, and W=the seismicweight of the building
i. Design lateral force calculated from staticanalysis is
= ×× ×V WZ I CR
where Z=Seismic zone coefficient, C=1.25S/T2/3,and W=the seismic weight of the building
(h) Response spectrumi. Spectral Acceleration, For T < T0,
= +S S (0.4 0.6 )a DSTT0
T0= 0.2.SD1/SDSii. T0 > T > TS, Sa= SDS,TS= SD1/SDSiii. TS > T > TL,
=SaSDT
1
where TL= long period transition periodiv. T > TL,
=SaSD TL
T12
i. For rocky or hard soil sites,
=⎧
⎨⎩
+ < << << <
S gT T
TT T
/1 15 , (0.0 0.10)2.5, (0.1 0.40)1/ , (0.4 4.0)
a
ii. For medium soil sites,
=⎧
⎨⎩
+ < << <
< <S g
T TT
T T/
1 15 , (0.0 0.10)2.5, (0.1 0.55)1.36/ , (0.55 4.0
a
iii. For soft soil sites,
=⎧
⎨⎩
+ < << <
< <S g
T TT
T T/
1 15 , (0.0 0.10)2.5, (0.1 0.67)1.67/ , (0.67 4.0)
a
iv. To get a site-specific design response spectrum, a factor (Z/2)is to be multiplied.
i. According to Section 2.5.7.1 in BNBC 93, “a site-specific response spectra shall be developedbased on the geologic, tectonic, seismologic, andsoil characteristics associated with specific site.The spectra shall be developed for a dampingratio of 0.05 unless a different value is found.”
ii. “In absence of a site-specific response spectrum,the normalized response spectra given inFig. 6.2.11 BNBC 93 shall be used with theprocedure described in Section 2.5.7.2 BNBC 93”.
M. Mostafijur Rahman et al. Engineering Structures 160 (2018) 111–120
112

categorize the structures according to seismic risk level. The SDC of astructure depends on the soil characteristics, geographical location,occupancy category, geometry, structural system, and vibration periodof the structure. Based on the SDC, one or more of the following ana-lysis options is permitted: (a) Equivalent Lateral Force (ELF) analysis,(b) Modal Response Spectrum analysis, and (c) Seismic ResponseHistory procedures. Reinforced concrete structures are designed anddetailed in accordance with Building Code Requirements for StructuralConcrete (ACI 318-14).
The structures designed in India must conform to the seismic designrequirements of Indian Standard, Criteria for Earthquake ResistantDesign of Structures, Part 1, General Provisions and Buildings, IS-1893[9]. A seismic zoning system, consisting of four seismic zones, is thebasis of the approach used in the Indian code. Based on height, con-figuration, and zone factor, either static or dynamic analysis is specifiedby the code. Reinforced concrete structures are designed based on In-dian Standard, Plain, and Reinforced Concrete-Code of Practice, IS-456[11]. Seismic detailing of concrete structures is performed in ac-cordance with Indian Standard, Code of Practice for Ductile Detailing ofReinforced Concrete Structures subjected to Seismic forces, IS-13920[10].
Seismic loadings and provisions are discussed in Chapter 2 (Part 6)of Bangladesh National Building Code, BNBC-1993 [3]. Based on theprobable intensity of seismic ground motion and potential damage,Bangladesh is divided into three seismic zones (Zones 1, 2, and 3) withthe northeast part of the country being the most vulnerable andsouthwest the least. According to BNBC-1993, seismic lateral forces onstructures are determined by using either Equivalent Static ForceMethod or Dynamic Response Method. Buildings are classified into fivestructural importance categories from category (I) to (V). Reinforcedconcrete structures are designed and detailed in accordance with BNBC-1993.
Some of the common aspects of ASCE 7-10, BNBC-1993, and IS-1893 include: (a) Zoning system, (b) Site classification, (c) Equationsfor calculating the fundamental vibration period of the structure, (d)Minimum design lateral force, (e) Response reduction factor, (f)Importance factor, (g) Allowable story drifts, and (h) Design responsespectrum. The most important aspects of the three codes are comparedin Table 1.
3. Analysis and design
A geometrically similar 12-story, 3-bay by 5-bay reinforced concretespecial moment resisting frame was considered for all the codes (seeFig. 1). The height of the bottom story was taken as 4.27m and theremaining stories were 3.66m each, resulting in a 44.5 m tall building.The width and length of the structure was 21.9m and 36.6 m, respec-tively with column spacing of 7.32m in both directions. The selectedstructure was to represent a commercial/office building. Seismic Im-portance Factor (I) was taken as 1.0 according to the three codes.
The buildings were assumed to be located in high seismic regions:San Francisco (USA), Sylhet (Bangladesh), and Bhuj (India). The sitesoil classification and the spectral response acceleration parameters orzone factors for these buildings are shown in Table 2.
The dead load consisted of the self-weight, floors, roof, built-inpartitions, cladding, and mechanical loadings. The values of gravityloads shown in Table 3 were selected according to the governing codesin each country.
Based on the calculated short period (SDS=1.22 g atTo= 0.139 sec) and 1− S (SD1= 0.85 g at 1 sec) response accelerationparameters, the structure was classified as Risk Category II with seismicdesign category E in accordance with ASCE 7-10. Considering that thebuilding is not irregular and its height is less than 48.8 m, EquivalentLateral Force (ELF) analysis is permitted by ASCE 7-10, and this methodwas selected for design of the building as a special reinforced concreteframe with response modification R=8 and deflection amplificationCd=5.5. Using the dead load as the only effective seismic weight, thebase shear was determined (5528 kN) and distributed according to
Fig. 1. Plan view of the structure.
Table 2Site locations and classifications.
Code Location Zone coefficient/response acceleration parameters Site class
ASCE 7-10 San Francisco, USA Spectral response acceleration parameters: SS =1.83, S1= 0.85 Site class D, stiff soilBNBC (1993) Sylhet, Bangladesh Seismic Zone: 3, Zone factor (Z)= 0.25 Type S3 (soft to medium stiff clay), S=1.5IS 1893 Bhuj, Gujarat, India Seismic Zone: V, Zone factor (Z)= 0.36 Type II (Medium soils)
Table 3Dead and live loads.
Loads ASCE 7-10 BNBC (1993) IS 875 (1987)
Live load Floor: 2.4 kN/m2 Floor: 3.0 kN/m2 Floor: 2.50 kN/m2
Roof: 1 kN/m2 Roof: 1.5 kN/m2 Roof: 1.5 kN/m2
Concrete unit weight 23.6 kN/m3 25.0 kN/m3 25.0 kN/m3
Mechanical loading 0.24 kN/m2 0.24 kN/m2 0.24 kN/m2
Partition wall loads 0.72 kN/m2 1.2 kN/m2 1.2 kN/m2
Cladding 4.38 kN/m 4.5 kN/m 4.5 kN/m
Fig. 2. Comparison of equivalent lateral forces from ASCE 7-10 and BNBC-93.
M. Mostafijur Rahman et al. Engineering Structures 160 (2018) 111–120
113

ASCE 7-10. The lateral force distribution over the building height isshown in Fig. 2.
For the structure located in Bangladesh, the Equivalent Static ForceMethod was used to determine the seismic lateral forces as the structureis regular and under 75m in height in accordance with BNBC-1993. Thetotal base shear in a given direction was determined from the equationdescribed in Table 1. The response modification coefficient (R) forspecial moment resisting concrete frames was taken as 12. The baseshear was equal to 3808 kN. The distribution of the lateral forces isshown in Fig. 2.
According to IS-1893, regular buildings of height greater than 40min Zone IV or V have to be analyzed by dynamic analysis, i.e., responsespectrum method or response history method, but guidelines to theformer are only provided in the code. A special moment resisting framewith R=5 was selected. The structure was analyzed for the designresponse spectrum in ETABS NL ([6]). The design base shear calculatedby this method was 3594 kN.
3.1. Modeling and analysis of structure for design
The structures were modeled three dimensionally in the commercialstructural analysis and design software ETABS NL (Version 9.6). Thecolumns were assumed to be fixed at the foundation. Rigid diaphragmaction of the slab was simulated. Dead load, live load, and seismic loadswere applied as static load on the structure according to the U.S. andBangladesh codes. Based on the Indian code, the seismic load was takeninto account through response spectrum analysis method.
3.2. Design of structures
Using the calculated design forces, the columns and beam memberswere designed and detailed as per the applicable provisions of the ACI318-14 [1], IS-456, and BNBC-1993 for the most severe load combi-nations, as described elsewhere ([12,17]). The materials used were: (a)concrete compressive strength, f′c, = 48MPa and ASTM Gr. 60 re-inforcing steel (yield strength, fy, = 414MPa) conforming to ACI 318-14; (b) M50 concrete (fck=50MPa) confirming to IS-456 [11] and Fe415 Grade reinforcement (fy=415MPa) confirming to IS-456 [11]; and(c) concrete with f′c=32MPa and Grade 400 reinforcing bars
Table 4Summary of design.
Story Code Dimensions b× h (mm) Reinforcement
Longitudinal Transverse
No. of bars Size (mm) ρ (%)
(a) Columns1 ASCE 7 762×762 24 22.2 1.6 12.7mm @ 60mm (plastic hinge) and @100mm (other locations)
BNBC 750×750 28 2.6 12mm @ 125mm (plastic hinge) and @ 300mm (other locations)IS 875 600×600 32 5.4 12mm @ 100mm (plastic hinge) and @ 300mm (other locations)
2–3 ASCE 7 762×762 22.2 1.6 12.7mm @ 60mm (plastic hinge) and @ 100mm (other locations)BNBC 750×750 28 2.6 12mm @ 125mm (plastic hinge) and @ 300mm (other locations)IS 875 600×600 25 3.3 12mm @ 100mm (plastic hinge) and @ 300mm (other locations)
4–6 ASCE 7 762×762 22.2 1.6 12.7mm @ 60mm (plastic hinge) and @ 100mm (other locations)BNBC 625×625 28 3.8 10mm @ 125mm (plastic hinge) and @ 300mm (other locations)IS 875 600×600 16 1.3 12mm @ @ 90mm (plastic hinge) and @ 150mm (other locations)
7–12 ASCE 7 762×762 19.1 1.6 12.7mm @ 60mm (plastic hinge) and @ 100mm (other locations)BNBC 500×500 22 3.6 10mm @ 125mm (plastic hinge) and @ 300mm (other locations)IS 875 600×600 16 1.3 12mm @ @ 90mm (plastic hinge) and @ 150mm (other locations)
(b) BeamsAll ASCE 7 556×762 Top: 5 28.7 0.76 9.5mm @ 100mm (plastic hinge) and @ 200mm (other locations)
BNBC 400×625 25 0.98 10mm @ 125mm (plastic hinge) and @ 200mm (other locations)IS 875 400×625 Bottom: 5 32 1.6 8mm @ 125mm (plastic hinge) and @ 250mm (other locations)
Fig. 3. 3-D structural model.
Fig. 4. Modified takeda hysteresis model (Adapted from Ruaumoko Manual (Carr,2016)).
M. Mostafijur Rahman et al. Engineering Structures 160 (2018) 111–120
114

Fig. 5. Design and artificial spectra.
Fig. 6. Artificial accelerograms.
M. Mostafijur Rahman et al. Engineering Structures 160 (2018) 111–120
115

(fy=400MPa) conforming to BNBC-1993. These values are consistentwith common practice in the U.S., Bangladesh, and India. The selectedbeam and column dimensions and reinforcement are summarized inTable 4.
4. Nonlinear dynamic response history analysis
Ruaumoko nonlinear dynamic analysis program ([5]) is a suite ofapplications specifically designed for dynamic inelastic analysis ofstructures subjected to earthquake loading. Ruaumoko 3D, which is acore program of Ruaumoko suite, was used to conduct three-dimen-sional nonlinear response history analysis of each structure in an effortto compare the global responses and performance of various members.
4.1. Geometry
The analytical model (Fig. 3) consisted of a total of 312 nodes and744 members (456 beams and 288 columns). The column bases werefixed (i.e., all 6 DOFs were restrained) based on the assumption that thefoundation system is adequate and does not fail when subjected toseismic loading. To simulate rigid floor diaphragm action, all the
horizontal degrees of freedom in a given floor were slaved to a singlenode; hence, all the nodes in a given floor would have identical hor-izontal displacements.
4.2. Member hysteretic models
Inelastic sectional response of a member (in particular reinforcedconcrete members) depends not only on its cross-sectional geometry butalso on its material characteristics, which are affected by the con-stitutive relationships for unconfined concrete, confined concrete, andsteel reinforcement. The following material models were selected: (a)Hognestad [8] stress-strain model for unconfined concrete; (b) Mander,Priestly, and Park model [14] for confined concrete; and (c) bilinearstress-strain curve with strain hardening for reinforcing steel. Sectionalanalysis software XTRACT ([18]) was used to generate moment-cur-vature relationships (M-ϕ diagrams) and axial load-moment interactiondiagrams (P-M diagrams) to determine the various parameters neededfor the selected hysteretic models.
The modified Takeda model ([16]) was used to model the hystereticcharacteristics of the beams and columns (see Fig. 4). The bilinearfactor (r) for this model was determined by moment-curvature re-lationships that were idealized as bilinear curves. The values of α, β,and displacement ductility factors were selected based on the experi-ence of the authors ([12]) and others ([7]).
The capacity of the columns subjected to bi-directional momentswas found by generating three-dimensional axial load-bending momentinteraction surfaces. The columns in the reported study were squarecolumns; hence, the moment capacities about both axes of bendingwere the same. The capacity surface was an ensemble of slices of the P-M capacity diagrams about the full range of bending axes (0–180°) thatwere calculated from XTRACT. A MATLAB [15] code was written toconstruct the capacity surface and check whether the demands (axial
Fig. 7. Normalized base shear history.
Table 5Peak normalized base shears and time.
Direction Building Vmax/Vdesign Time (sec.)
E-W ASCE 2.2 17.35BNBC 2.4 4.15IS 2.0 11.60
N-S ASCE 2.8 4.93BNBC 3.5 4.95IS 3.9 4.33
M. Mostafijur Rahman et al. Engineering Structures 160 (2018) 111–120
116

load and moments about both axes of bending) obtained from thenonlinear analyses are within the surface (i.e., having adequate capa-city) or fall outside the surface (corresponding to failure).
4.3. Selection of artificial ground motions
Considering the paucity of recorded ground motions in Bangladesh,response-spectrum compatible artificial ground motions were gener-ated and used for dynamic analyses by SIMQKE, which is a part ofRuaumoko software suite. Generation of artificial ground motions wasbased on matching the design response spectra. As evident from Fig. 5,the 5% damped response spectra of the artificially generated groundmotions reasonably match the target design spectra.
The artificially generated ground motions were 25 sec long, seeFig. 6. The peak accelerations for ASCE, BNBC, and IS response spec-trum compatible records were 0.51 g, 0.57 g, and 0.53 g, respectively.
The buildings were subjected to ground motions in both directions.Considering that the building is “weaker” in the N-S direction than theE-W direction (3 vs. 5 bays), 100% of the ground motion was applied inthe N-S direction plus 30% of the ground motion in the E-W direction tosimulate the most critical loading scenario. The same artificial groundmotion was used in both directions, but the acceleration amplitudeswere multiplied by 0.30 for the E-W direction.
5. Results and discussions
The performance of each of the structures was evaluated in terms of(a) normalized base shear, (b) roof and inter-story drifts, (c) yielding ofbeams and failure of columns, and (d) overall energy dissipation. Eachof these metrics is discussed separately. In the following discussion, thestructure in Bhuj, India; San Francisco, U.S.; and Sylhet, Bangladesh arereferred to as IS, ASCE, and BNBC building, respectively.
Fig. 8. Roof drift history.
Fig. 9. Inter-story drifts.
M. Mostafijur Rahman et al. Engineering Structures 160 (2018) 111–120
117
5.1. Base shear
The calculated base shear history for each building was normalizedwith respect to its respective design value. The normalized base shearhistory is shown in Fig. 7. The peak normalized shear and the corre-sponding time are summarized in Table 5. The three acceleration re-cords (Fig. 6) had generally similar frequency characteristics; however,the base shear histories are noticeably different. In the N-S direction,
the peak values occurred within the first 5 sec for all the buildings, butthe time corresponding to the peak values are above 10 sec for the ASCEand IS buildings in the E-W direction. As explained previously, 100% ofthe ground motion was applied in the “weak direction” (N-S) in con-junction with 30% of the ground motion in the other direction.Therefore, the base shears in the N-S direction are larger than theircounterparts in the E-W direction: 1.27, 1.46, and 1.95 times larger forthe ASCE, BNBC, and IS building, respectively. All the buildings were
(a) ASCE
(b) BNBC
(c) IS
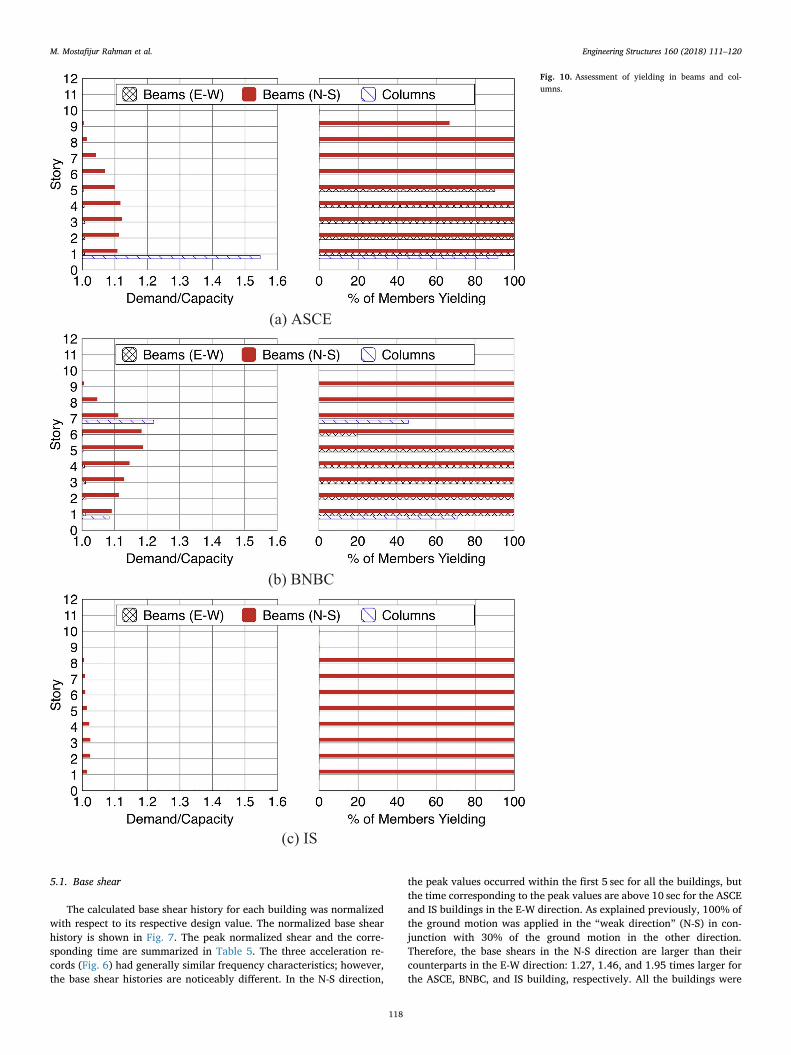
Fig. 10. Assessment of yielding in beams and col-umns.
M. Mostafijur Rahman et al. Engineering Structures 160 (2018) 111–120
118

subjected to at least twice the design base shear in either direction,which is noteworthy when comparing different design codes.
5.2. Drifts
Fig. 8. illustrates the roof drift normalized with respect to the totalbuilding height. The largest drift of 1.3% is in the N-S direction of theBNBC building. In either the N-S or E-W direction, the ASCE buildingexperienced the least roof drift. The roof drifts of all the buildings areacceptable (i.e., < 2%). The inter-story drifts are plotted in Fig. 9. Withthe exception of floors 3-6 in the N-S direction of the BNBC building, allthe inter-story drifts are smaller than 2%. The maximum inter-storydrift of 2.46% for floors 4 and 5 in the BNBC building does not meet thetarget limit of 2%.
5.3. Failure/yielding
In an effort to assess the performance of the beams and columns, themaximum demand-to-capacity ratios (abbreviated as D/C) are plottedin each floor in Fig. 10. In the same figure, the percentage of themembers in a given floor with D/C exceeding 1 is also plotted. Thelargest D/C (1.55) occurred in the first-floor columns of the ASCEbuilding, where the moments in 22 out of the 24 columns exceeded theboundaries of the P-M interaction diagram. Failure of 92% of the col-umns in the first floor of the ASCE building suggests story-level hingingwould likely occur in the first floor. In the case of the BNBC building,the columns in floors 1 and 7 failed with D/C of 1.08 and 1.22, re-spectively. Out of a total of 24 columns in each floor, 11 and 17 col-umns in floors 1 and 7 failed, respectively, corresponding to 71% and46% of the total number of columns. Column failure was concentratedin the first floor of the ASCE building, but it was spread over two floorsin the BNBC building. The likelihood of story-level hinging in the BNBCbuilding is less than the ASCE building. None of the columns in the ISbuilding failed.
The difference between the performance of the columns in the threebuildings is attributed to the characteristics of the ground motions.Although the peak accelerations of the three artificially generatedground motions are comparable (ASCE: 0.51 g, BNBC: 0.57 g, and IS:0.53 g), their acceleration response spectra are different. In Fig. 11, the
pseudo acceleration (PSA) response spectra, and the vibration periodsof the first six modes and the corresponding values of PSA are com-pared. The ground motion used to analyze the ASCE building has thelargest PSA for all the six modes – on average 25% and 18% larger thanIS and BNBC, respectively. Had the IS building been subjected to theASCE compatible ground motion, all the columns in the first floor of theIS building would have also failed.
Considering the larger accelerations applied in the N-S direction, thebeams in this direction yielded (D/C > 1) more significantly than thebeams in the E-W direction. For all the buildings, 100% of the N-Sbeams in the first 9 floors yielded (see Fig. 10). The largest D/C (1.19)was found to be in floor 5 of the BNBC building, and the least D/C of1.02 occurred in the 4th floor of the IS building. In the case of the ASCEbuilding, the largest level of yielding of the N-S beams occurred in floor3 with D/C being 1.12. None of the E-W beams in the IS building ex-perienced yielding. The level of yielding for the beams in the E-W di-rection was minimal for the other two buildings, the largest D/C wasequal to 1.01.
5.4. Energy dissipation
To capture the overall energy dissipation characteristics of the threebuildings, the area under the roof drift vs. the base shear was computed.This area represents an aggregate measure
of the total energy dissipated through yielding of the beams andcolumns. From Table 6, it is evident that the level of energy dissipationin the E-W direction is significantly smaller than that in the N-S di-rection because of the smaller level of inelasticity in the strong direction
Fig. 11. Comparison of pseudo acceleration responsespectra.
Table 6Dissipated Energy.
Direction Building Energy (kJ)
E-W ASCE 1537BNBC 1432IS 723
N-S ASCE 25,368BNBC 24,948IS 10,988
M. Mostafijur Rahman et al. Engineering Structures 160 (2018) 111–120
119

(i.e., E-W). In both directions, the amount of dissipated energy for the ISbuilding is approximately one-half of the energy that the ASCE andBNBC buildings dissipated, which is consistent with no yielding of thecolumns and smaller level of yielding in the beams. Energy dissipationof the ASCE and BNBC buildings is fairly close.
6. Conclusion
When subjected to response-spectrum-compatible artificial groundmotions, the buildings designed according to the practice inBangladesh, India, and the U.S. experienced base shears several timeslarger than their design base shears. Therefore, it was possible tocompare the building codes under scenarios for which large levels ofinelastic deformations are expected.
The building designed according to ASCE 7-10 exhibited the largeststiffness in terms of roof and inter-story drifts. The building inBangladesh designed per BNBC-1993 was generally the most flexiblestructure, with a number of the floors not meeting the 2% inter-storydrift limit. As designed, the beams in the first 9 floors of the threebuildings yielded. The beams in the BNBC building had the mostamount of yielding, as evident from having the largest moment de-mand/capacity ratio. The frames were designed based on strongcolumn-weak beam design methodology. Nevertheless, 92% of thecolumns in the first floor of the ASCE building exceeded their capacity(i.e., axial load and bending moment were extended beyond the P-Mdiagram boundaries), suggesting a story-level hinging, while the re-maining columns did not yield. For the BNBC building, there was lesslikelihood of story-level hinging as column yielding was spread be-tween two floors. All of the columns in the IS building performed asintended, i.e., they did not yield while the beams developed and ex-ceeded their flexural capacities. The difference in the performance ofthe columns is attributed to the characteristics of the three artificiallygenerated ground motions, for instance, all the columns in the ISbuilding would have also failed if it had been subjected to the groundmotion used to evaluate the ASCE building. The level of overall energydissipation in the ASCE and BNBC buildings was comparable, which isconsistent with yielding in the beams and columns of these twobuildings. The IS building had the smallest energy dissipation because alarge percentage of its members did not yield and the demand/capacityratios were smaller than the other two buildings.
Aggregating the above results from different metrics, it can beconcluded that the structure designed according to the Indian codeperformed better when subjected to the ground motion that is intendedto represent the Indian design response spectrum. Although the driftlimits were met, slightly larger members would have made the stiffness
of the IS building comparable to the ASCE building. Additional studiesare needed to evaluate these codes for a suite of ground motions andother structural systems.
Acknowledgments
The University of Cincinnati – United States is acknowledged forsupporting the research presented in this paper.
References
[1] ACI Committee 318. ACI 318-14/ACI 318R-14, building code requirements forstructural concrete and commentary. Farmington Hills, MI: American ConcreteInstitute; 2014.
[2] ASCE/SEI 7-10. Minimum design loads for buildings and other structures. Reston,VA: American Society of Civil Engineers; 2010.
[3] Bangladesh National Building Code (BNBC)-1993. Housing and Building ResearchInstitute, Bangladesh Standards and Testing Institution; 2006.
[4] Bari MS, Das T. A comparative study on seismic analysis of Bangladesh NationalBuilding Code (BNBC) with other building codes. J. the Inst. Eng. (India): Ser. A2013;97(3):131–7.
[5] Carr AJ. RUAUMOKO. Christchurch, New Zealand: University of Canterbury; 2015.[6] ETABS Nonlinear version 9.6, copyright 1984-2009, Computers and Structures Inc.
Berkeley, CA.[7] Harries KA, Mitchell D, Redwood RG, Cook WD. Nonlinear seismic response pre-
dictions of walls coupled with steel and concrete beams. Can J Civ Eng1998;25:803–18.
[8] Hognestad E. A study of combined bending and axial load in reinforced concretemembers. University of Illinois Engineering Experiment Station, Bulletin Series No.399, Bulletin No. 1; 1951.
[9] IS-1893 Part 1. Criteria for earthquake resistant design of structures, Part 1, Generalprovisions and buildings, Rev. 5, Bureau of Indian Standards, Manak Bhawan, NewDelhi, India; 2002.
[10] IS-13920. Code of practice for ductile detailing of reinforced concrete structuressubjected to seismic forces. Manak Bhawan, New Delhi, India: Bureau of IndianStandards; 1993.
[11] IS-456. Plain and reinforced concrete-code of practice, rev 4. Manak Bhawan, NewDelhi: Bureau of Indian Standards; 2000.
[12] Jadhav SM. Comparative study of seismic performance of reinforced concretebuildings designed in accordance with the seismic provisions of ASCE 7-10 and IS1893-2002. Cincinnati, OH, U.S.: University of Cincinnati; 2012.
[13] Mistry R, Dong W, Shah H. Interdisciplinary observations on the January 2001,Bhuj, Gujarat Earthquake. World seismic safety initiative and earthquakes andmegacities initiative. Singapore: Nanyang Technological Institute; 2001. p. 127.
[14] Mander JB, Priestley MJN, Park R. Theoretical stress-strain model for confinedconcrete. J. Struct. Eng. ASCE 1988;114(8):1804–26.
[15] MATLAB version R2012a, copyright 1984–2012, The Math Works Inc., Natick, MA.[16] Otani S. Hysteresis models of reinforced concrete for earthquake response analysis.
J. Faculty Eng. Univ. Tokyo 1981;36(2):407–41.[17] Rahman MM. Seismic design of reinforced concrete buildings using bangladesh
national building code (BNBC 1993) and comparison with other Codes (ASCE 7-10and IS 1893-2002). Cincinnati, OH, U.S.: University of Cincinnati; 2017.
[18] XTRACT – Cross-sectional structural analysis of components version 3.0.5, copy-right 2007.
M. Mostafijur Rahman et al. Engineering Structures 160 (2018) 111–120
120