seismic performance of steel fiber reinforced concrete ... · seismic performance of steel fiber...
TRANSCRIPT

Seismic Performance of Steel Fiber Reinforced
Concrete Beam-Column Joints under the
Variation of Column Axial Load
Musitefa Adem Yimer 1* , Temesgen Wondimu Aure 2a
1Department of Civil Engineering, Samara University, Samara, Ethiopia 2Department of Civil Engineering, Addis Ababa Science and Technology University,
Addis Ababa, Ethiopia
Abstract:- This study presents a finite element investigation of steel fiber reinforced concrete beam-column joints under cyclic loading
with the variation of axial load. The aim of the study is to investigate the influence of axial load variations on the seismic behavior of
steel fiber-reinforced concrete (SFRC) beam-column joints. Nonlinear finite element analysis with a damaged plasticity model in
ABAQUS/Standard is adopted. The finite element model is verified using experimental results conducted by other researchers. Six
SFRC specimens with different column axial load ratios and a 2% volume fraction of steel fiber were simulated under reversed cyclic
loading. The parameters investigated are maximum load-carrying capacity, stiffness degradation, energy dissipation and failure mode.
The results indicated that an increase of column axial load has a valuable influence to delay the initiation of cracks and damage
accumulation, slightly improvement of the joint stiffness and improves the energy dissipation of joints at the initial stage of loading.
Moreover, when the axial load level increases up to 50% of the column capacity, no cracks observed in the joint area and no change in
the maximum load-carrying capacity. However, when the axial load level of more than 50% of the column capacity, the cyclic stiffness
decreased slightly due to the deterioration caused by crushing of concrete in column. Thus, the results revealed that the increase of
column axial load improves the confinement of steel fiber reinforced concrete beam-column joints, however, a threshold limit could be
required.
Keywords: Beam-column joints; Steel fiber-reinforced concrete; Cyclic loading; Axial load variation; Nonlinear finite element analysis
1. INTRODUCTION
Moment resisting reinforced concrete frames are assemblies of beams and columns connected by beam-column joints. These
frames should be adequate ductility, strength, energy dissipation and stiffness to resist the seismic loading without collapse [1].
Several studies [2–7] have established that SFRC is capable of improving the seismic behavior of reinforced concrete structural
members, such as shear walls, beam-column joints, and flexural members subjected to seismic loads. Based on earlier studies, the
application of SFRC considerably improve the shear strength [8,9], the flexural strength and ductility [10–12] and fracture
toughness [13] of the reinforced concrete members. The use of SFRC as a minimum shear reinforcement for beams has been
permitted in ACI 318 [14] following the research study by Parra-Montesinos [15]. An experimental study of such joint behavior
is not feasible to assess the effect of several parameters involved in joint behavior. Furthermore, because of the difficulties in
integrating the compressive column axial loading in the experimental setup, it is common practice to assume the column axial
load to be zero or constant in most of the researchs [16]. Nonlinear finite element analysis, however, can be viewed as one of a
convenient and reliable solution to investigate such effects. In this study, the seismic behavior of SFRC beam-column joints under
the variation of axial load is carried out using the finite element software ABAQUS/Standard. The finite element model is
validated against existing SFRC beam-column joints tested by Choi and Bae [12]. After validation of the model, eight SFRC
beam-column joint specimens under cyclic loading is investigated by varying the column axial load ratio.
2. RESEARCH SIGNIFICANCE
The use of steel fibers in RC members can offer a positive influence. However, due to the high expenses and restrictions of
specimen fabrication, experimental tests for reinforced concrete structures need spending a great amount of time and money,
especially countries not have advanced laboratories. Moreover, due to the complexity of incorporating the column axial load in
the experimental test setup, it is common to assume the column axial load to be zero or constant in most of the investigations [16].
Hence, further study needs on SFRC beam-column joints with the variation of axial load. This study provides the finite element
results on the seismic performance of SFRC beam-column joints with the variation of compressive column axial load.
3. FINITE ELEMENT MODEL
A three dimensional (3D) nonlinear finite element model of SFRC beam-column joints are developed using ABAQUS/Standard
[17] by considering both geometric and material nonlinearities.
3.1 Element types, meshes and boundary conditions
A three-dimensional linear 8-node brick elements (C3D8R) were employed for modeling of steel fiber reinforced concrete and
steel plate. Two-node linear three-dimensional truss elements (T3D2) was used to model steel reinforcements. A mesh size of 40
International Journal of Engineering Research & Technology (IJERT)
ISSN: 2278-0181http://www.ijert.org
IJERTV9IS020110(This work is licensed under a Creative Commons Attribution 4.0 International License.)
Published by :
www.ijert.org
Vol. 9 Issue 02, February-2020
206

mm is used for the whole geometry for all elements. To apply the boundary conditions identical to the reference experimental test
setup, the nodes at the surfaces of the lower and upper column ends are attached to a reference point using the coupling constraint.
The loading steel plate at the tip of the beam was constrained in y-direction for the cyclic loading application. The boundary
conditions, mesh and were set in the model as shown in Fig. 1.
(a) (b) (c)
Fig. 1-Boundary conditions, meshing and loading of the FE model
3.2 Interactions between Components
The embedded approach was adopted for the interaction between the SFRC and the steel reinforcement, which enforces
displacement continuity and the perfect bond between the two elements. The interaction between concrete and reinforcement after
cracking was incorporated only in a simplified way using the tension stiffening in the concrete model. This was adopted to
approximately simulate load transfer between cracks over the rebar [18,19]. The interactions between the surfaces of the inelastic
and elastic solid bodies representing the concrete material and the loading steel plate is modelled using tie constraints.
3.3 Load Application Method and Cyclic Loading Protocol
In this study, the loading on the beam tip is adopted as in the experimental setup by Choi and Bae [12]. Additionally, the ACI 374
[20] recommendation for reverse cyclic loading protocol is used with the same loading history as reported in the experimental
study, as showed in Fig. 2. The reversed cyclic load is applied in terms of displacement-controlled step, where the displacement
is determined from the drift ratio (%) based on the following expression:
Drift ratio (%) =∆𝑙
𝑙𝑏× 100 (1)
Where ∆𝑙 and 𝑙𝑏 are the applied displacement at the beam tip and length of the beam from column face to the application point
of the cyclic displacement, respectively. Analogous to the test loading condition, two loading steps are defined in the finite element
modeling. The first step is the axial load step where the axial load is applied at the column top surface as a pressure load in a load-
controlled mode and kept constant in the second step. Then, the reverse cyclic loading is applied in the second step on the beam
end at a distance of 1800 mm from the beam-column interface.
International Journal of Engineering Research & Technology (IJERT)
ISSN: 2278-0181http://www.ijert.org
IJERTV9IS020110(This work is licensed under a Creative Commons Attribution 4.0 International License.)
Published by :
www.ijert.org
Vol. 9 Issue 02, February-2020
207
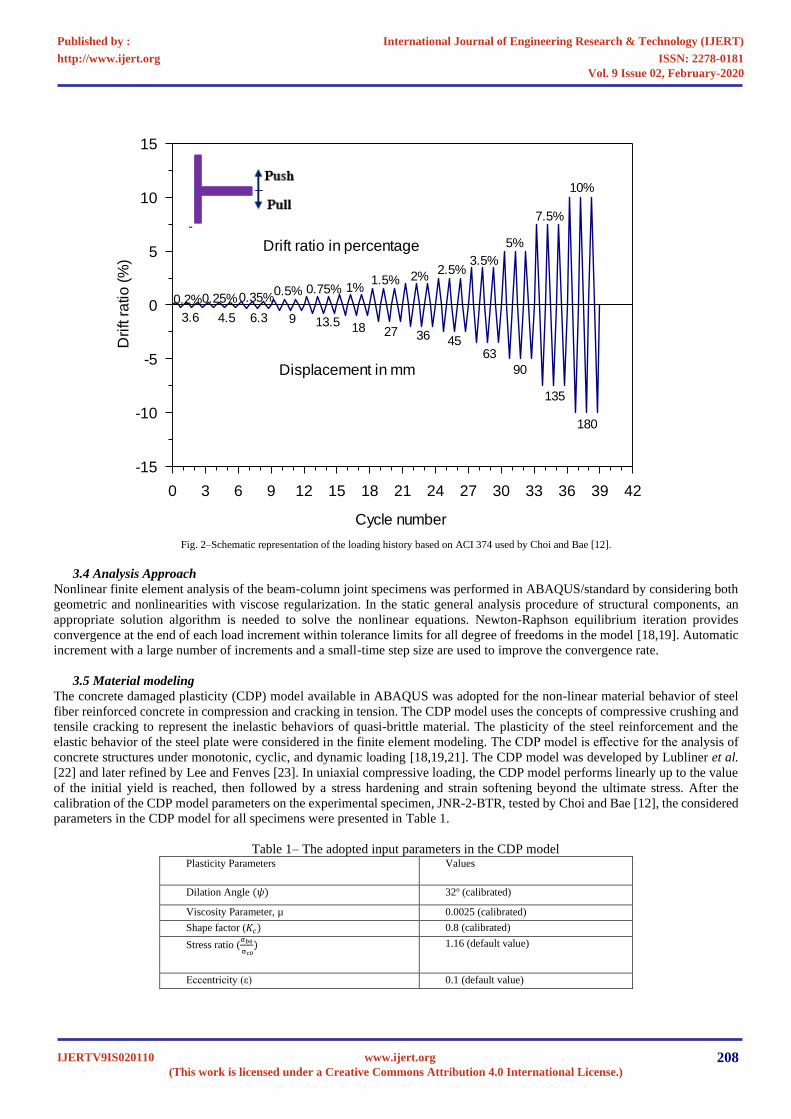
Fig. 2–Schematic representation of the loading history based on ACI 374 used by Choi and Bae [12].
3.4 Analysis Approach
Nonlinear finite element analysis of the beam-column joint specimens was performed in ABAQUS/standard by considering both
geometric and nonlinearities with viscose regularization. In the static general analysis procedure of structural components, an
appropriate solution algorithm is needed to solve the nonlinear equations. Newton-Raphson equilibrium iteration provides
convergence at the end of each load increment within tolerance limits for all degree of freedoms in the model [18,19]. Automatic
increment with a large number of increments and a small-time step size are used to improve the convergence rate.
3.5 Material modeling
The concrete damaged plasticity (CDP) model available in ABAQUS was adopted for the non-linear material behavior of steel
fiber reinforced concrete in compression and cracking in tension. The CDP model uses the concepts of compressive crushing and
tensile cracking to represent the inelastic behaviors of quasi-brittle material. The plasticity of the steel reinforcement and the
elastic behavior of the steel plate were considered in the finite element modeling. The CDP model is effective for the analysis of
concrete structures under monotonic, cyclic, and dynamic loading [18,19,21]. The CDP model was developed by Lubliner et al.
[22] and later refined by Lee and Fenves [23]. In uniaxial compressive loading, the CDP model performs linearly up to the value
of the initial yield is reached, then followed by a stress hardening and strain softening beyond the ultimate stress. After the
calibration of the CDP model parameters on the experimental specimen, JNR-2-BTR, tested by Choi and Bae [12], the considered
parameters in the CDP model for all specimens were presented in Table 1.
Table 1– The adopted input parameters in the CDP model Plasticity Parameters Values
Dilation Angle (𝜓) 32o (calibrated)
Viscosity Parameter, µ 0.0025 (calibrated)
Shape factor (𝐾𝑐) 0.8 (calibrated)
Stress ratio (σ𝑏0
σ𝑐0) 1.16 (default value)
Eccentricity (ε) 0.1 (default value)
Dri
ft r
atio
(%
)
-15
-10
-5
0
5
10
15
Cycle number
0 3 6 9 12 15 18 21 24 27 30 33 36 39 42
10%
7.5%
5%
3.5%2.5%
2%1.5%1%0.75%0.5%
0.35%0.25%0.2%
180
135
90
634536271813.596.34.53.6
Displacement in mm
Drift ratio in percentage
International Journal of Engineering Research & Technology (IJERT)
ISSN: 2278-0181http://www.ijert.org
IJERTV9IS020110(This work is licensed under a Creative Commons Attribution 4.0 International License.)
Published by :
www.ijert.org
Vol. 9 Issue 02, February-2020
208

According to ACI 544.3R-93 [24] report, normal weight SFRC with a fiber content up to 2% by volume has a density in the same
range as normal concrete of 2306 to 2403 kg/m3. Also, according to the ACI 544.1R-96 [25] report, the density and Poisson’s
ratio of SFRC are generally taken as same range as to those of normal concrete when the volume percentage of steel fiber is up to
2%. In this study, the Poisson's ratio and density were taken as 0.2 and 2400 kg/m³, respectively, for steel fiber reinforced concrete
material modeling based on the above recommendations.
3.5.1 Modeling of SFRC in Compression
Several investigators have proposed models for the characterization of the compressive stress-strain behavior of SFRC [26–31]
all have relatively similar approximations of the SFRC behavior under uniaxial compression. Generally, steel fibers only have
minor effects on the ultimate compressive strength of concrete, slightly increasing or decreasing its magnitude, depending on the
characteristics of the fibers [25,32]. However, the use of steel fiber in concrete significantly enhances the descending branch of
the compressive stress-strain curve. Due to this, a compressive constructive model of SFRC differs other than normal concrete
compressive model was still employed. In this study an attempt was made in the validation section from different SFRC
compressive stress-strain model and the model proposed by Lee et al. [31] was adopted. Based on this constitutive model, the
behavior of the SFRC was assumed to be elastic linear up to reaching 0.4𝑓𝑐𝑠′ . After this point, the plastic behavior was defined
using the following equations.
𝑓𝑐𝑠 = 𝑓𝑐𝑠′ [
𝐴(𝜀𝑐𝑠 /𝜀0
)
𝐴−1+(𝜀𝑐𝑠 /𝜀0
)𝐵] (2)
Where; for pre-peak: 𝐴 = 𝐵 = 1
1−(𝑓𝑐𝑠
′
𝜀0 𝐸𝑐𝑠
)
𝑓𝑜𝑟 𝜀𝑐𝑠 /𝜀0
≤ 1.0 (3)
For post-peak: 𝐵 = (𝑓𝑐𝑠
′
𝜀0 𝐸𝑐𝑠
)0.064
[1 + 0.882 (𝑉𝑓𝑙𝑓
𝑑𝑓
)
−0.882
] ≥ 𝐴 (4)
A= 1 + 0.723 (𝑉𝑓𝑙𝑓
𝑑𝑓
)
−0.957
𝑓𝑜𝑟 𝜀𝑐𝑠 /𝜀0
> 1.0 (5)
Where; 𝜀0 = (0.0003𝑉𝑓
𝑙𝑓
𝑑𝑓
+ 0.0018) 𝑓𝑐𝑠 0.12 (6)
𝐸𝑐𝑠 = (−367𝑉𝑓𝑙𝑓
𝑑𝑓
+ 5520) 𝑓𝑐𝑠′ 0.41 (7)
Where 𝑓𝑐𝑠 is the uniaxial compressive stress of SFRC, 𝑓𝑐𝑠′ is compressive strength of SFRC, 𝐸𝑐𝑠 is the initial elastic modulus of
SFRC, 𝜀𝑐𝑠 is the uniaxial compressive strain of SFRC, 𝜀0
is strain of SFRC at peak stress, 𝑉𝑓 is the volume fraction of steel fiber,
𝑙𝑓 is length steel fiber and 𝑑𝑓
is the diameter of steel fiber. As mentioned in previous section, hooked steel fiber with a length of
30 mm and a diameter of 0.5 mm was used in this study for consistency of the referenced experimental study by Choi and Bae
[12]. Equation (8) which is proposed by Ou et al. [33] was used to estimate the compressive strength of SFRC because it gives an
approximately equal value with the referenced experimental test data reported by [12].
𝑓𝑐𝑠′ = 𝑓𝑐
′ + 2.35𝑅𝐼 (8)
Where, 𝑓𝑐′ is the compressive strength of normal concrete; 𝑓𝑐𝑠
′ is compressive strength of SFRC and 𝑅𝐼 is the fiber reinforcing
index which expressed as:
𝑅𝐼 = 𝑉𝑓𝑙𝑓
𝑑𝑓
(9)
The ultimate strain for SFRC was set to the value 𝜀𝑢 = 0.02 according to the work reported by Wang [34] for 𝑉𝑓 > 0.5%.
3.5.2 Modeling of SFRC in Tension
There are a number of different constitutive models developed by researchers to represent the tensile behavior of SFRC [27,35–
37]. In this study, the model proposed by Lok and Xiao [36] was employed to represent the tensile behavior of SFRC. Furthermore,
a number of researchers [38,39] conducted a non-linear finite element analysis of fiber reinforced concrete elements by using this
model and found the Lok and Xiao [36] for SFRC material behavior in tension resulted in precise predictions. The uniaxial tensile
stress-strain relationships of SFRC by Lok and Xiao [36] model shown in Fig.3 and which expressed by Eqs. (10)-(11):
𝜎 = 𝑓𝑡 [2 (
𝜀
𝜀𝑡0 )
− (𝜀
𝜀𝑡0 )
2
] for 0 ≤ 𝜀 ≤ 𝜀𝑡0 (10)
𝜎 = 𝑓𝑡 [1 − (1 −
𝑓𝑡𝑢
𝑓𝑡 ) (
𝜀 −𝜀𝑡0
𝜀𝑡1 −𝜀𝑡0
)
] for 𝜀𝑡0 ≤ 𝜀 ≤ 𝜀𝑡1
(11)
𝜎 = 𝑓𝑡𝑢 for 𝜀𝑡0
≤ 𝜀 ≤ 𝜀𝑡𝑢 (12)
Where; 𝑓𝑡 is the ultimate uniaxial tensile strength of SFRC, 𝜀𝑡0 is the corresponding ultimate tensile strain, 𝑓𝑡𝑢
is the residual
strength from the strain, 𝜀𝑡1 , as shown in Fig. 3. These values are defined by [40] as follows:
𝑓𝑡𝑢 = 𝜂𝑣𝑓 𝜏𝑑
𝑙𝑓
𝑑𝑓 (13)
𝜀𝑡1 = 𝜏𝑑
𝑙𝑓
𝑑𝑓
1
𝐸𝑠𝑓 (14)
International Journal of Engineering Research & Technology (IJERT)
ISSN: 2278-0181http://www.ijert.org
IJERTV9IS020110(This work is licensed under a Creative Commons Attribution 4.0 International License.)
Published by :
www.ijert.org
Vol. 9 Issue 02, February-2020
209

Where 𝜂 is the fiber orientation factor in a three dimensional (3D) case. Hannant [41] used the value of 𝜂 as 0.50, Soroushian and
Lee [42] taken as 0.405 and Lok and Xiao [36] taken as 0.50 for slabs and 0.405 for beams. In the present work, 𝜂 is taken as
0.50. The value of modulus elasticity of steel fiber (𝐸𝑠𝑓 ) 200 GPa used in this study recommended by Amin and Gilbert [43].
According to Lok and Xiao [40], the initial tangent modulus of SFRC in tension and in compression is assumed to be equal, and
the ultimate tensile strain 𝜀𝑡0 , corresponding to 𝑓𝑡
expressed as:
𝜀𝑡0 =
2𝑓𝑡
𝐸𝑡0 (15)
where, 𝐸𝑡0 is the initial tangent modulus of steel fiber reinforced concrete.
For hooked-type steel fibers, the value of bond stress (𝜏𝑑 ) 6.8 MPa is used in this study as suggested by Lim et al [44].
Equation (16) which is the correlation between splitting tensile strength (𝑓𝑠𝑝𝑡) and compressive strength (𝑓𝑐𝑠) of SFRC proposed
by [45] was used to estimate the splitting tensile strength (𝑓𝑠𝑝𝑡) of SFRC:
𝑓𝑠𝑝𝑡 = 0.21(𝑓𝑐𝑠)0.83 (16)
However, the CDP model requires the uniaxial tensile strength as an input. Therefore, the relation is given in Eq. (17) based on
Eurocode 2 [46] recommendation was used to convert the splitting tensile strength into a uniaxial one.
𝑓𝑐𝑡 = 0.9𝑓𝑠𝑝𝑡 (17)
Fig. 3–Tensile stress-strain behavior of SFRC used in FE model by Lok and Xiao [36].
3.5.3 Steel Reinforcement and Steel Plate Modelling
The mechanical properties of reinforcing bars were employed to represent the longitudinal reinforcement and shear stirrups in
numerical modeling were exactly the same as the material properties reported by Choi and Bae [12] as presented in Table 2 and
Poisson’s ratio of 0.3.
Table 2– Mechanical properties of reinforcing bars used by Choi and Bae [12].
Note: 𝑓𝑦 is specified minimum yield strength, 𝑓𝑦𝑚 is measured yield strength, 𝜀𝑦 is yield strain, and 𝑓𝑢 is ultimate tensile stress.
The tensile stress-strain of reinforcing bars was assumed to be elastic with corresponding Young’s modulus and Poisson’s ratio.
The nonlinear behavior of steel bars was modeled as a bilinear elastic-plastic material using a strain hardening ratio of 0.01, as
recommended by Kachlakev and Miller [47] and it is used by many researchers [48,49]. The typical bilinear stress-strain model
of reinforcement bars is shown in Fig. 4. In order to avoid the concentration of stresses on the concrete, premature failure or
cracking at the cyclic loading point a 20 mm thick steel plates were used at this loading point. This loading steel plate is modeled
with elastic properties steel material having an elastic modulus (Es) of 200 GPa, Poisson’s ratio of 0.3, and no yielding strength
to avoid any premature failure in the steel plates.
Bar ID
𝑓𝑦 (𝑀𝑃𝑎)
𝑓𝑦𝑚 (𝑀𝑃𝑎)
𝜀𝑦 (𝑚𝑚/𝑚𝑚)
𝑓𝑢 (𝑀𝑃𝑎)
D10 400 436.9 0.0022 517.0
D13 400 400.0 0.0020 472.3
D13 500 505.8 0.0025 521.8
D19 500 558.7 0.0028 656.1
D25 400 471.7 0.0024 587.6
International Journal of Engineering Research & Technology (IJERT)
ISSN: 2278-0181http://www.ijert.org
IJERTV9IS020110(This work is licensed under a Creative Commons Attribution 4.0 International License.)
Published by :
www.ijert.org
Vol. 9 Issue 02, February-2020
210

Fig. 4– Bilinear stress-strain model for reinforcing steel bars by Kachlakev and Miller [47].
4. MODEL VALIDATION
Existing steel fiber reinforced concrete beam-column joint specimen which experimentally tested by other researchers was used
for model validation.
4.1. Details of experimental specimen used for validation
To investigate the behavior of SFRC beam-column joints numerically, the performance of the nonlinear finite element models
developed in this paper are validated against experimental specimen tested by Choi and Bae [12], namely JNR-2-BTR was
selected. According to their study, the specimen represented the first-floor exterior beam-column joint (at a scale of two-third)
subassemblies of a 10-story office building. The specimen, JNR-2-BTR, is designed without any hoops in the joint panel region
and made with a 2% volume fraction of steel fiber in concrete, but the beam and column are reinforced by hoops based on ACI-
ASCE Committee 352 [50]. Hooked steel fiber with a length of 30 mm and a diameter of 0.5 mm was used in the experimental
study in consistence with ACI 318 [51] as shown in Fig. 5. The columns had a cross-section of 300 mm × 300 mm, with a height
of 3000 mm. The beam had a cross-sectional dimension of 250 mm × 375 mm with lengths of 1900 mm up to the contra-flexure
point in all sub-assemblages. The reinforcement details and geometry of the validated specimen is displayed in Fig. 6.
Fig. 5–Size and shape of steel fiber used in an experimental study by Choi and Bae [12].
International Journal of Engineering Research & Technology (IJERT)
ISSN: 2278-0181http://www.ijert.org
IJERTV9IS020110(This work is licensed under a Creative Commons Attribution 4.0 International License.)
Published by :
www.ijert.org
Vol. 9 Issue 02, February-2020
211

Fig. 6–Details of the specimen JNR-2-BTR tested by Choi and Bae [12].
Furthermore, the geometrical properties, variables and details as presented in Table 3. The compressive and indirect splitting
tensile strength for the SFRC reported in the experimental study are presented in Table 4. In experimental study, beam-column
joint specimens were loaded using a hydraulic actuator under cyclic loading applied tip of the beam as a displacement controlled.
The axial load was applied on the top of the column.
Table 3– Cross-sections, variables and details of specimens tested by Choi and Bae [12].
Note: P is the applied axial load to column, 𝑓𝑐𝑠′ is the cylindrical compressive strength of the concrete steel fiber concrete, 𝐴𝑔 is
the area of the column, 𝐷 is the diameter of reinforcement bar; 𝑏𝑏 is width of beam, ℎ𝑏 is overall depth of beam, 𝑏𝑐 is width of
column, ℎ𝑐 is overall depth of column, and 𝑉𝑓 is volume fraction of steel fiber. (Note: 1 mm = 0.0394 in.)
Table 4–Mechanical properties of concrete tested by Choi and Bae [12]
Note: 𝑉𝑓 is volume fraction of steel fiber, 𝐸𝑐𝑠 is the modulus of elasticity of SFRC, 𝑓𝑐𝑠′ is compressive strength of cylinder and
𝑓𝑠𝑝 is splitting tensile strength of SFRC.
4.2 Finite element model predictions
As described before in the summary of experimental work the specimen, JNR-2-BTR, which were experimentally tested by Choi
and Bae [12], was selected to validate the developed finite element model. The accuracy of the nonlinear finite element model
Specimen 𝑃
𝑓𝑐𝑠′𝐴𝑔
Beam Column
𝑉𝑓 (%) Cross-section
(mm)
Bars (mm)
(top & bottom)
Stirrups
(mm)
Cross-
section (mm)
Bars (mm) Stirrups
(mm)
𝑏𝑏 × ℎ𝑏 𝑏𝑐 × ℎ𝑐
JNR-2-BTR 0.1 250 X 375 4D25 D10@70 300 X 300 4D19+2D13 D13@60 2
Concrete ID 𝑉𝑓 (%)
𝐸𝑐𝑠(𝑀𝑃𝑎)
𝑓𝑐𝑠′ (𝑀𝑃𝑎)
𝑓𝑠𝑝 (𝑀𝑃𝑎)
SFRC2 2 31826 54.7 6.5
International Journal of Engineering Research & Technology (IJERT)
ISSN: 2278-0181http://www.ijert.org
IJERTV9IS020110(This work is licensed under a Creative Commons Attribution 4.0 International License.)
Published by :
www.ijert.org
Vol. 9 Issue 02, February-2020
212
was evaluated by comparing the nonlinear finite element analysis (NLFEA) results of this specimens with experimental result in
terms of load-displacement response and failure pattern.
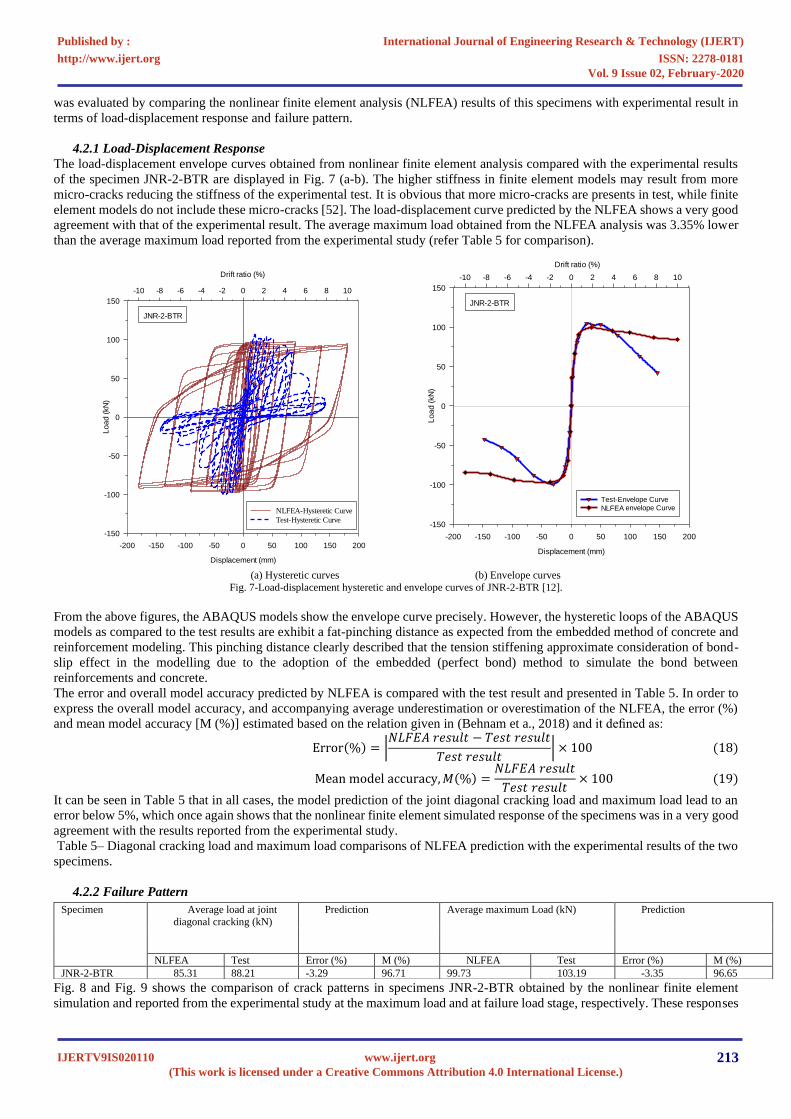
4.2.1 Load-Displacement Response
The load-displacement envelope curves obtained from nonlinear finite element analysis compared with the experimental results
of the specimen JNR-2-BTR are displayed in Fig. 7 (a-b). The higher stiffness in finite element models may result from more
micro-cracks reducing the stiffness of the experimental test. It is obvious that more micro-cracks are presents in test, while finite
element models do not include these micro-cracks [52]. The load-displacement curve predicted by the NLFEA shows a very good
agreement with that of the experimental result. The average maximum load obtained from the NLFEA analysis was 3.35% lower
than the average maximum load reported from the experimental study (refer Table 5 for comparison).
(a) Hysteretic curves (b) Envelope curves
Fig. 7-Load-displacement hysteretic and envelope curves of JNR-2-BTR [12].
From the above figures, the ABAQUS models show the envelope curve precisely. However, the hysteretic loops of the ABAQUS
models as compared to the test results are exhibit a fat-pinching distance as expected from the embedded method of concrete and
reinforcement modeling. This pinching distance clearly described that the tension stiffening approximate consideration of bond-
slip effect in the modelling due to the adoption of the embedded (perfect bond) method to simulate the bond between
reinforcements and concrete.
The error and overall model accuracy predicted by NLFEA is compared with the test result and presented in Table 5. In order to
express the overall model accuracy, and accompanying average underestimation or overestimation of the NLFEA, the error (%)
and mean model accuracy [M (%)] estimated based on the relation given in (Behnam et a., 2018) and it defined as:
Error(%) = |𝑁𝐿𝐹𝐸𝐴 𝑟𝑒𝑠𝑢𝑙𝑡 − 𝑇𝑒𝑠𝑡 𝑟𝑒𝑠𝑢𝑙𝑡
𝑇𝑒𝑠𝑡 𝑟𝑒𝑠𝑢𝑙𝑡| × 100 (18)
Mean model accuracy, 𝑀(%) =𝑁𝐿𝐹𝐸𝐴 𝑟𝑒𝑠𝑢𝑙𝑡
𝑇𝑒𝑠𝑡 𝑟𝑒𝑠𝑢𝑙𝑡× 100 (19)
It can be seen in Table 5 that in all cases, the model prediction of the joint diagonal cracking load and maximum load lead to an
error below 5%, which once again shows that the nonlinear finite element simulated response of the specimens was in a very good
agreement with the results reported from the experimental study.
Table 5– Diagonal cracking load and maximum load comparisons of NLFEA prediction with the experimental results of the two
specimens.
4.2.2 Failure Pattern
Fig. 8 and Fig. 9 shows the comparison of crack patterns in specimens JNR-2-BTR obtained by the nonlinear finite element
simulation and reported from the experimental study at the maximum load and at failure load stage, respectively. These responses
Specimen Average load at joint
diagonal cracking (kN)
Prediction Average maximum Load (kN) Prediction
NLFEA Test Error (%) M (%) NLFEA Test Error (%) M (%)
JNR-2-BTR 85.31 88.21 -3.29 96.71 99.73 103.19 -3.35 96.65
Displacement (mm)
-200 -150 -100 -50 0 50 100 150 200
Lo
ad
(kN
)
-150
-100
-50
0
50
100
150
Drift ratio (%)
-10 -8 -6 -4 -2 0 2 4 6 8 10
NLFEA-Hysteretic Curve
Test-Hysteretic Curve
JNR-2-BTR
Drift ratio (%)
-10 -8 -6 -4 -2 0 2 4 6 8 10
Lo
ad
(kN
)
-150
-100
-50
0
50
100
150
Displacement (mm)
-200 -150 -100 -50 0 50 100 150 200
Test-Envelope Curve
NLFEA envelope Curve
JNR-2-BTR
International Journal of Engineering Research & Technology (IJERT)
ISSN: 2278-0181http://www.ijert.org
IJERTV9IS020110(This work is licensed under a Creative Commons Attribution 4.0 International License.)
Published by :
www.ijert.org
Vol. 9 Issue 02, February-2020
213

clearly demonstrate that there is a very good agreement between the experimental and nonlinear finite element prediction crack
patterns. This numerical result also further approves the accuracy of the nonlinear finite element model and shows strong
capability in predicting the general behavior of both the reinforced concrete and steel fiber reinforced concrete specimens.
Therefore, the model can be used as an effective and reliable numerical tool for further studies on SFRC beam-column joints.
Based on the comparisons, it can be concluded that the developed finite element model can successfully predict the seismic
behavior of SFRC beam-column joints with high accuracy.
(a) Experimental (b) NLFEA (ABAQUS)
Fig.8–Comparison of crack patterns at maximum load stage of JNR-2-BTR [12].
(a) Experimental (b) NLFEA (ABAQUS) Fig. 9–Comparison of crack at the failure stage of specimen JNR-2-BTR [12].
International Journal of Engineering Research & Technology (IJERT)
ISSN: 2278-0181http://www.ijert.org
IJERTV9IS020110(This work is licensed under a Creative Commons Attribution 4.0 International License.)
Published by :
www.ijert.org
Vol. 9 Issue 02, February-2020
214
5. PARAMETRIC STUDY
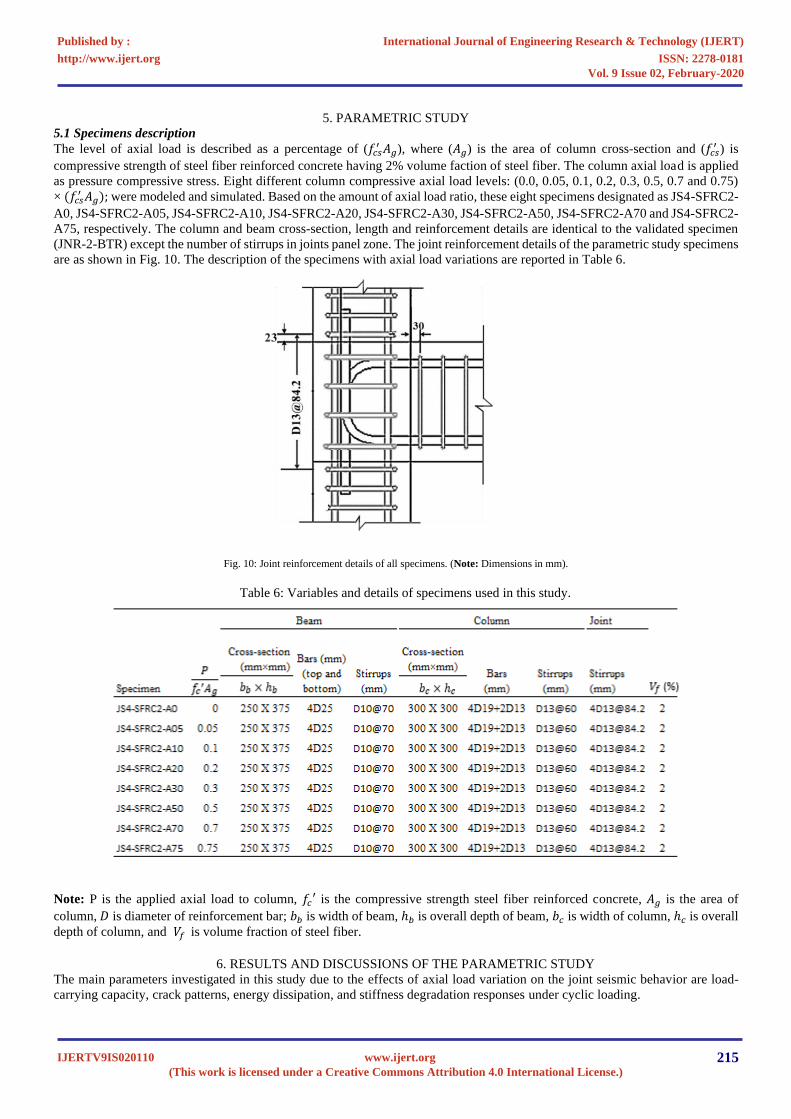
5.1 Specimens description
The level of axial load is described as a percentage of (𝑓𝑐𝑠′ 𝐴𝑔
), where (𝐴𝑔 ) is the area of column cross-section and (𝑓𝑐𝑠
′ ) is
compressive strength of steel fiber reinforced concrete having 2% volume faction of steel fiber. The column axial load is applied
as pressure compressive stress. Eight different column compressive axial load levels: (0.0, 0.05, 0.1, 0.2, 0.3, 0.5, 0.7 and 0.75)
× (𝑓𝑐𝑠′ 𝐴𝑔
); were modeled and simulated. Based on the amount of axial load ratio, these eight specimens designated as JS4-SFRC2-
A0, JS4-SFRC2-A05, JS4-SFRC2-A10, JS4-SFRC2-A20, JS4-SFRC2-A30, JS4-SFRC2-A50, JS4-SFRC2-A70 and JS4-SFRC2-
A75, respectively. The column and beam cross-section, length and reinforcement details are identical to the validated specimen
(JNR-2-BTR) except the number of stirrups in joints panel zone. The joint reinforcement details of the parametric study specimens
are as shown in Fig. 10. The description of the specimens with axial load variations are reported in Table 6.
Fig. 10: Joint reinforcement details of all specimens. (Note: Dimensions in mm).
Table 6: Variables and details of specimens used in this study.
Note: P is the applied axial load to column, 𝑓𝑐′ is the compressive strength steel fiber reinforced concrete, 𝐴𝑔 is the area of
column, 𝐷 is diameter of reinforcement bar; 𝑏𝑏 is width of beam, ℎ𝑏 is overall depth of beam, 𝑏𝑐 is width of column, ℎ𝑐 is overall
depth of column, and 𝑉𝑓 is volume fraction of steel fiber.
6. RESULTS AND DISCUSSIONS OF THE PARAMETRIC STUDY
The main parameters investigated in this study due to the effects of axial load variation on the joint seismic behavior are load-
carrying capacity, crack patterns, energy dissipation, and stiffness degradation responses under cyclic loading.
International Journal of Engineering Research & Technology (IJERT)
ISSN: 2278-0181http://www.ijert.org
IJERTV9IS020110(This work is licensed under a Creative Commons Attribution 4.0 International License.)
Published by :
www.ijert.org
Vol. 9 Issue 02, February-2020
215
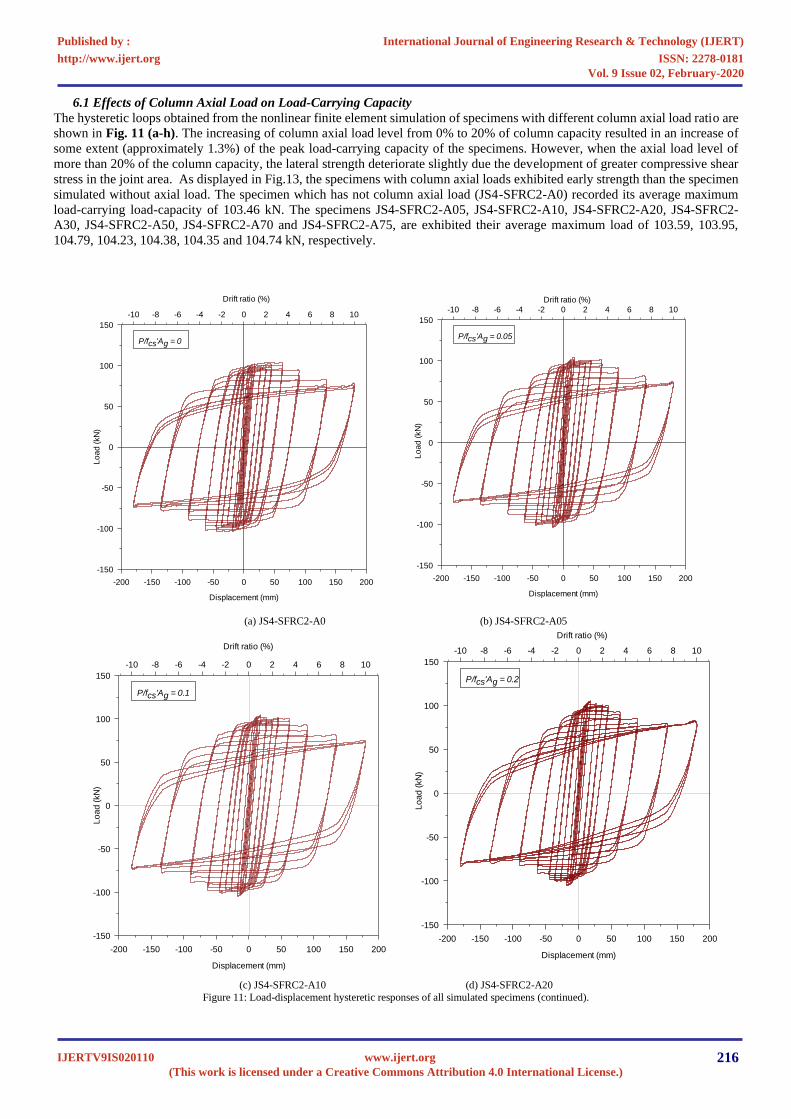
6.1 Effects of Column Axial Load on Load-Carrying Capacity
The hysteretic loops obtained from the nonlinear finite element simulation of specimens with different column axial load ratio are
shown in Fig. 11 (a-h). The increasing of column axial load level from 0% to 20% of column capacity resulted in an increase of
some extent (approximately 1.3%) of the peak load-carrying capacity of the specimens. However, when the axial load level of
more than 20% of the column capacity, the lateral strength deteriorate slightly due the development of greater compressive shear
stress in the joint area. As displayed in Fig.13, the specimens with column axial loads exhibited early strength than the specimen
simulated without axial load. The specimen which has not column axial load (JS4-SFRC2-A0) recorded its average maximum
load-carrying load-capacity of 103.46 kN. The specimens JS4-SFRC2-A05, JS4-SFRC2-A10, JS4-SFRC2-A20, JS4-SFRC2-
A30, JS4-SFRC2-A50, JS4-SFRC2-A70 and JS4-SFRC2-A75, are exhibited their average maximum load of 103.59, 103.95,
104.79, 104.23, 104.38, 104.35 and 104.74 kN, respectively.
(a) JS4-SFRC2-A0 (b) JS4-SFRC2-A05
(c) JS4-SFRC2-A10 (d) JS4-SFRC2-A20
Figure 11: Load-displacement hysteretic responses of all simulated specimens (continued).
Displacement (mm)
-200 -150 -100 -50 0 50 100 150 200
Lo
ad
(kN
)
-150
-100
-50
0
50
100
150
Drift ratio (%)
-10 -8 -6 -4 -2 0 2 4 6 8 10
P/fcs'Ag = 0
Displacement (mm)
-200 -150 -100 -50 0 50 100 150 200
Lo
ad
(kN
)
-150
-100
-50
0
50
100
150
Drift ratio (%)
-10 -8 -6 -4 -2 0 2 4 6 8 10
P/fcs'Ag = 0.05
Displacement (mm)
-200 -150 -100 -50 0 50 100 150 200
Lo
ad
(kN
)
-150
-100
-50
0
50
100
150
Drift ratio (%)
-10 -8 -6 -4 -2 0 2 4 6 8 10
P/fcs'Ag = 0.1
Displacement (mm)
-200 -150 -100 -50 0 50 100 150 200
Lo
ad
(kN
)
-150
-100
-50
0
50
100
150
Drift ratio (%)
-10 -8 -6 -4 -2 0 2 4 6 8 10
P/fcs'Ag = 0.2
International Journal of Engineering Research & Technology (IJERT)
ISSN: 2278-0181http://www.ijert.org
IJERTV9IS020110(This work is licensed under a Creative Commons Attribution 4.0 International License.)
Published by :
www.ijert.org
Vol. 9 Issue 02, February-2020
216

(e) JS4-SFRC2-A30 (f) JS4-SFRC2-A50
(g) S4-SFRC2-A70 (h) S4-SFRC2-A75
Figure 13: Load-displacement hysteretic responses of all simulated specimens.
The average maximum load-carrying capacity of the specimens under different column axial load levels are exhibited in Fig.12.
Displacement (mm)
-200 -150 -100 -50 0 50 100 150 200
Lo
ad
(kN
)
-150
-100
-50
0
50
100
150
Drift ratio (%)
-10 -8 -6 -4 -2 0 2 4 6 8 10
P/fcs'Ag = 0.3
Displacement (mm)
-200 -150 -100 -50 0 50 100 150 200L
oa
d (
kN
)
-150
-100
-50
0
50
100
150
Drift ratio (%)
-10 -8 -6 -4 -2 0 2 4 6 8 10
P/fcs'Ag = 0.5
Displacement (mm)
-200 -150 -100 -50 0 50 100 150 200
Lo
ad
(kN
)
-150
-100
-50
0
50
100
150
Drift ratio (%)
-10 -8 -6 -4 -2 0 2 4 6 8 10
P/fcs'Ag = 0.7
Displacement (mm)
-200 -150 -100 -50 0 50 100 150 200
Lo
ad
(kN
)
-150
-100
-50
0
50
100
150
Drift ratio (%)
-10 -8 -6 -4 -2 0 2 4 6 8 10
P/fcs'Ag = 0.75
International Journal of Engineering Research & Technology (IJERT)
ISSN: 2278-0181http://www.ijert.org
IJERTV9IS020110(This work is licensed under a Creative Commons Attribution 4.0 International License.)
Published by :
www.ijert.org
Vol. 9 Issue 02, February-2020
217

Fig.12: Average maximum load of simulated specimens. (Note: Average value of the maximum load in the push and pull direction are considered).
6.2 Influence of Column Axial Load Level on Damage and Failure Pattern
6.2.1 Joint Cracking Behavior
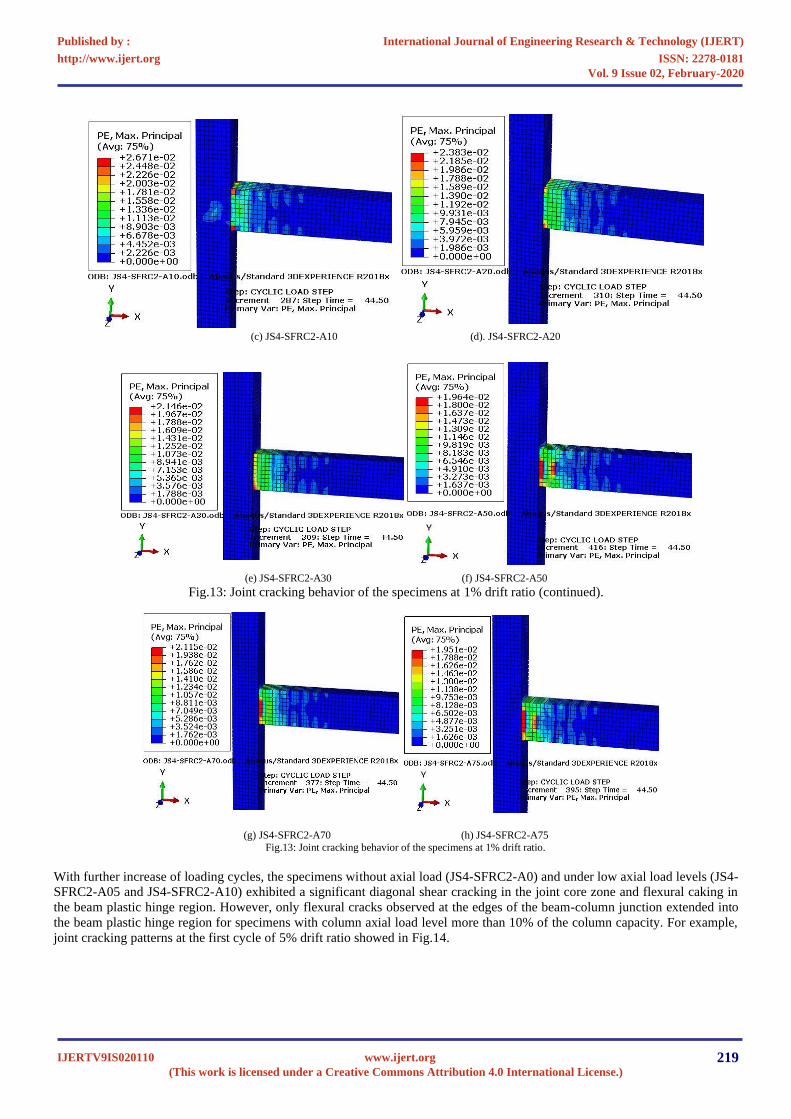
Fig.13 to Fig.14 shows the cracking pattern in the joint observed at different stages of loading for specimens with different axial
load ratio. The specimens with higher column compressive axial load level were established to delay and reduce the occurrence
of cracking in the beam-column joint area in compared to the specimens simulated without column axial load and under low
column axial load. Fig.13 illustrates the joint cracks observed in the specimens at the first loading cycle of 1.0 % drift. In specimens
under low axial load (JS4-SFRC2-A05 and JS4-SFRC2-A10), the diagonal cracks appeared in this loading stage were very low
intensity compared to the specimen without axial load (JS4-SFRC2-A0). However, no joint cracking was observed in the
specimens under axial load levels more than 10% of the column axial capacity (> 0.1𝑓𝑐𝑠′ 𝐴𝑔
). This confirmed that high axial load
would delay the formation of joint cracks and it was beneficial for joint confinement.
(a). JS4-SFRC2-A0 (b). JS4-SFRC2-A05
Axial load ratio (%)
0 10 20 30 40 50 60 70 80
Avera
ge m
axim
um
load (
kN
)
0
30
60
90
120
International Journal of Engineering Research & Technology (IJERT)
ISSN: 2278-0181http://www.ijert.org
IJERTV9IS020110(This work is licensed under a Creative Commons Attribution 4.0 International License.)
Published by :
www.ijert.org
Vol. 9 Issue 02, February-2020
218
(c) JS4-SFRC2-A10 (d). JS4-SFRC2-A20
(e) JS4-SFRC2-A30 (f) JS4-SFRC2-A50
Fig.13: Joint cracking behavior of the specimens at 1% drift ratio (continued).
(g) JS4-SFRC2-A70 (h) JS4-SFRC2-A75
Fig.13: Joint cracking behavior of the specimens at 1% drift ratio.
With further increase of loading cycles, the specimens without axial load (JS4-SFRC2-A0) and under low axial load levels (JS4-
SFRC2-A05 and JS4-SFRC2-A10) exhibited a significant diagonal shear cracking in the joint core zone and flexural caking in
the beam plastic hinge region. However, only flexural cracks observed at the edges of the beam-column junction extended into
the beam plastic hinge region for specimens with column axial load level more than 10% of the column capacity. For example,
joint cracking patterns at the first cycle of 5% drift ratio showed in Fig.14.
International Journal of Engineering Research & Technology (IJERT)
ISSN: 2278-0181http://www.ijert.org
IJERTV9IS020110(This work is licensed under a Creative Commons Attribution 4.0 International License.)
Published by :
www.ijert.org
Vol. 9 Issue 02, February-2020
219
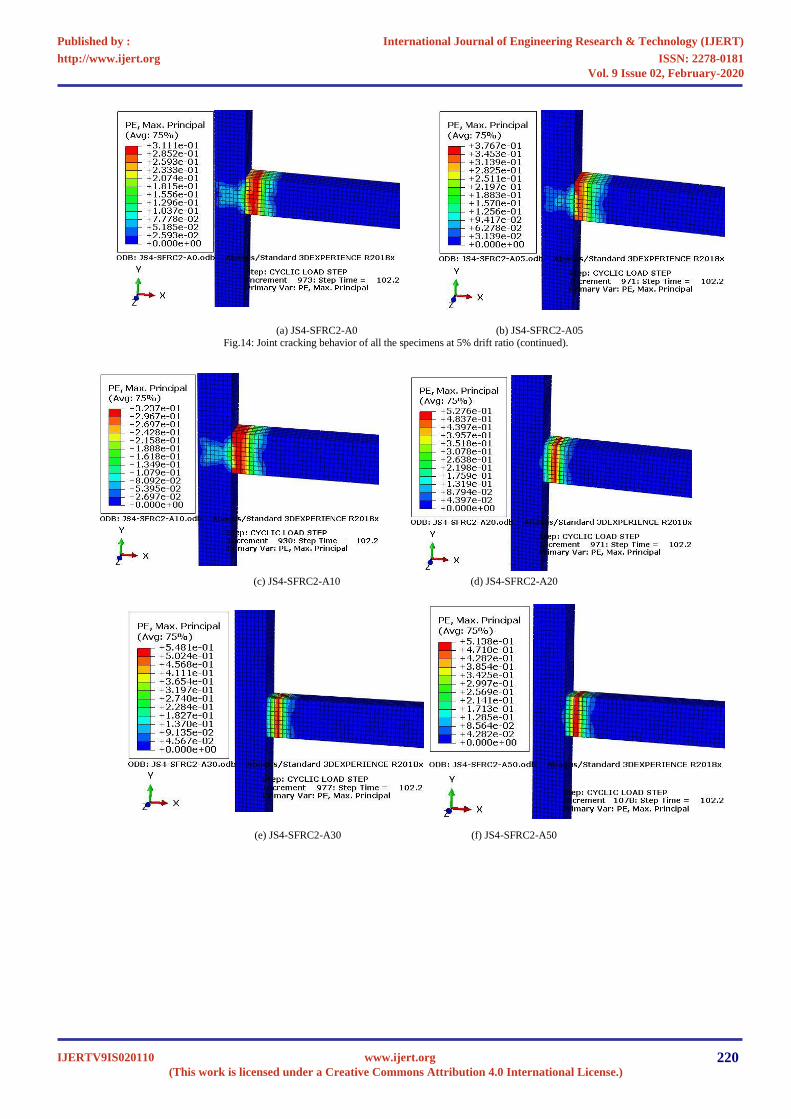
(a) JS4-SFRC2-A0 (b) JS4-SFRC2-A05
Fig.14: Joint cracking behavior of all the specimens at 5% drift ratio (continued).
(c) JS4-SFRC2-A10 (d) JS4-SFRC2-A20
(e) JS4-SFRC2-A30 (f) JS4-SFRC2-A50
International Journal of Engineering Research & Technology (IJERT)
ISSN: 2278-0181http://www.ijert.org
IJERTV9IS020110(This work is licensed under a Creative Commons Attribution 4.0 International License.)
Published by :
www.ijert.org
Vol. 9 Issue 02, February-2020
220

(g) JS4-SFRC2-A70 (h) JS4-SFRC2-A75
Fig.14: Joint cracking behavior of all the specimens at 5% drift ratio.
6.5 Effects of Column Axial Load on Stiffness Degradation
Fig. 15 illustrates the peak-to-peak stiffness of all specimens from each first cycle out of three loading cycles at each drift ratio.
The specimens with higher axial load ratios were found to have a higher peak-to-peak stiffness than specimens with low axial
load ratios in early drift ratios. It was observed that stiffness degradation of specimens had a critical influence only in the initial
loading cycles and the stiffness values after a 2.5% drift ratio of loading were approximately in the same value in specimens with
different axial load ratios, but specimens under very high axial load are slightly greater stiffness degradation than specimens with
low axial load.
Fig. 15: Stiffness degradation of specimens.
Drift ratio (%)
0 1 2 3 4 5 6 7 8 9 10 11 12
Stiff
ness
(kN
/mm
)
0
1
2
3
4
5
6
7
8
9
10
JS4-SFRC2-A0JS4-SFRC2-A05
JS4-SFRC2-A10
JS4-SFRC2-A20
JS4-SFRC2-A30
JS4-SFRC2-A50
JS4-SFRC2-A70
JS4-SFRC2-A75
International Journal of Engineering Research & Technology (IJERT)
ISSN: 2278-0181http://www.ijert.org
IJERTV9IS020110(This work is licensed under a Creative Commons Attribution 4.0 International License.)
Published by :
www.ijert.org
Vol. 9 Issue 02, February-2020
221
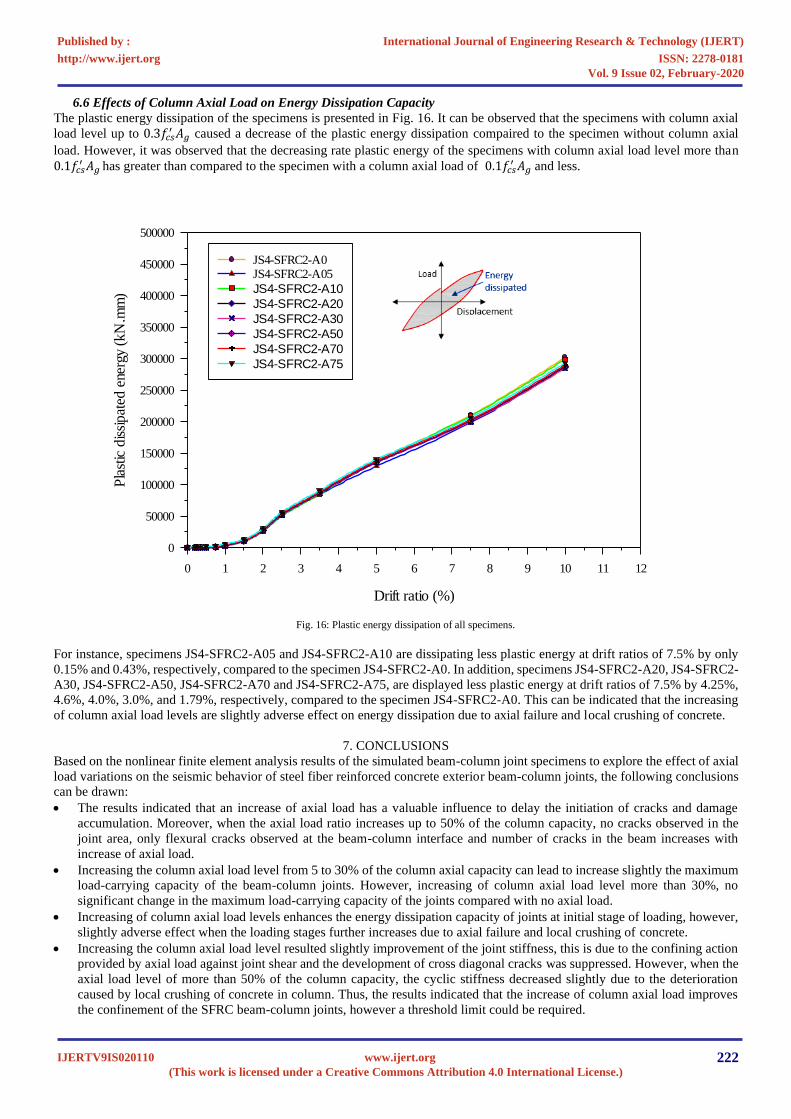
6.6 Effects of Column Axial Load on Energy Dissipation Capacity
The plastic energy dissipation of the specimens is presented in Fig. 16. It can be observed that the specimens with column axial
load level up to 0.3𝑓𝑐𝑠′ 𝐴𝑔
caused a decrease of the plastic energy dissipation compaired to the specimen without column axial
load. However, it was observed that the decreasing rate plastic energy of the specimens with column axial load level more than
0.1𝑓𝑐𝑠′ 𝐴𝑔
has greater than compared to the specimen with a column axial load of 0.1𝑓𝑐𝑠′ 𝐴𝑔
and less.
Fig. 16: Plastic energy dissipation of all specimens.
For instance, specimens JS4-SFRC2-A05 and JS4-SFRC2-A10 are dissipating less plastic energy at drift ratios of 7.5% by only
0.15% and 0.43%, respectively, compared to the specimen JS4-SFRC2-A0. In addition, specimens JS4-SFRC2-A20, JS4-SFRC2-
A30, JS4-SFRC2-A50, JS4-SFRC2-A70 and JS4-SFRC2-A75, are displayed less plastic energy at drift ratios of 7.5% by 4.25%,
4.6%, 4.0%, 3.0%, and 1.79%, respectively, compared to the specimen JS4-SFRC2-A0. This can be indicated that the increasing
of column axial load levels are slightly adverse effect on energy dissipation due to axial failure and local crushing of concrete.
7. CONCLUSIONS
Based on the nonlinear finite element analysis results of the simulated beam-column joint specimens to explore the effect of axial
load variations on the seismic behavior of steel fiber reinforced concrete exterior beam-column joints, the following conclusions
can be drawn:
• The results indicated that an increase of axial load has a valuable influence to delay the initiation of cracks and damage
accumulation. Moreover, when the axial load ratio increases up to 50% of the column capacity, no cracks observed in the
joint area, only flexural cracks observed at the beam-column interface and number of cracks in the beam increases with
increase of axial load.
• Increasing the column axial load level from 5 to 30% of the column axial capacity can lead to increase slightly the maximum
load-carrying capacity of the beam-column joints. However, increasing of column axial load level more than 30%, no
significant change in the maximum load-carrying capacity of the joints compared with no axial load.
• Increasing of column axial load levels enhances the energy dissipation capacity of joints at initial stage of loading, however,
slightly adverse effect when the loading stages further increases due to axial failure and local crushing of concrete.
• Increasing the column axial load level resulted slightly improvement of the joint stiffness, this is due to the confining action
provided by axial load against joint shear and the development of cross diagonal cracks was suppressed. However, when the
axial load level of more than 50% of the column capacity, the cyclic stiffness decreased slightly due to the deterioration
caused by local crushing of concrete in column. Thus, the results indicated that the increase of column axial load improves
the confinement of the SFRC beam-column joints, however a threshold limit could be required.
Drift ratio (%)
0 1 2 3 4 5 6 7 8 9 10 11 12
Pla
stic
dis
sipat
ed e
nerg
y (k
N.m
m)
0
50000
100000
150000
200000
250000
300000
350000
400000
450000
500000
JS4-SFRC2-A0JS4-SFRC2-A05
JS4-SFRC2-A10
JS4-SFRC2-A20
JS4-SFRC2-A30
JS4-SFRC2-A50
JS4-SFRC2-A70
JS4-SFRC2-A75
International Journal of Engineering Research & Technology (IJERT)
ISSN: 2278-0181http://www.ijert.org
IJERTV9IS020110(This work is licensed under a Creative Commons Attribution 4.0 International License.)
Published by :
www.ijert.org
Vol. 9 Issue 02, February-2020
222

REFERENCES
[1] T. Paulay and M. J. N. Priestley, Seismic design of reinforced concrete and masonry buildings. New York: Wiley. 1992.
[2] Y. Jiuru, T.; Chaobin, H.; Kaijian, Y.; and Yongcheng, “Seismic Behavior and Shear Strength of Framed Joint Using Steel Fiber Reinforced Concrete,”
Journal of Structural Engineering, vol. 118, no. 2, pp. 341–358, 1992. [3] J. Gustavo, Parra-Montesinos, S. Peterfreund, and S. Chao, “Highly damage-tolerant beam-column joints through use of high-performance fiber-
reinforced cement composites,” ACI Structural Journal, vol. 102, no. 3, pp. 487–495, 2005.
[4] N. Ganesan, P. V. Indira, and M. V. Sabeena, “Behaviour of hybrid fibre reinforced concrete beam-column joints under reverse cyclic loads,” Materials and Design, vol. 54, pp. 686–693, 2014.
[5] D. Kheni, R. H. Scott, and A. Deb, S. K. and Dutta, “Ductility enhancement in beam-column connections using hybrid fiber-reinforced concrete,” ACI
Structural Journal, vol. 112, no. 2, pp. 167–178, 2015. [6] R. . Chidambaram and P. Agarwal, “Seismic behavior of hybrid fiber reinforced cementitious composite beam-column joints,” Materials and Design,
vol. 86, pp. 771–781, 2015.
[7] M. hossein Saghafi and H. Shariatmadar, “Enhancement of seismic performance of beam-column joint connections using high performance fiber reinforced cementitious composites,” Construction and Building Materials, vol. 180, pp. 665–680, 2018.
[8] S. H. Cho and Y. I. Kim, “Effects of Steel Fibers on Short Beams Loaded in Shear,” ACI Structural Journal, vol. 100, no. 6, pp. 765–774, 2003.
[9] and J. K. W. Hai H. Dinh, Gustavo J. Parra-Montesinos and Results, “Shear Behavior of Steel Fiber-Reinforced Concrete Beams without Stirrup Reinforcement,” vol. 107, no. 5, pp. 597–606, 2010.
[10] P. S. Song and S. Hwang, “Mechanical properties of high-strength steel fiber-reinforced concrete,” Construction and Building Materials, vol. 18, no. 9,
pp. 669–673, 2004. [11] A. Thomas, J; Ramaswamy, “Mechanical properties of steel fibre concrete,” Journal of Materials in Civil Engineering, vol. 19, no. 5, pp. 385–392, 2007.
[12] C. S. Choi andBae.-II, “Effectiveness of steel fibers as hoops in exterior beam-to-column joints under cyclic loading,” ACI Structural Journal, vol. 116,
no. 2, pp. 205–219, 2019. [13] P. H. Bischoff, “Tension Stiffening and Cracking of Steel Fiber-Reinforced Concrete,” Journal of Materials in Civil Engineeringrials in Civil
Engineering, vol. 15, no. 2, pp. 174–182, 2003.
[14] ACI Committee 318, Building Code Requirements for Structural Concrete and Commentary (ACI 318R-08). 2008. [15] G. Parra-Montesinos, “Shear strength of beams with deformed steel fibers,” Concrete International-Detroit-, vol. 28, no. 11, p. 57, 2006.
[16] Li and Leong, “Experimental and Numerical Investigations of the Seismic Behavior of High-Strength Concrete Beam-Column Joints with Column Axial
Load,” ASCE Journal of Structural Engineering, 2014. [17] Simulia, “ABAQUS Version 2018: Dassault Systemes Simulia Corp: 2017.” 2017.
[18] M. A. Najafgholipour, S. M. Dehghan, A. Dooshabi, and A. Niroomandi, “Finite element analysis of reinforced concrete beam-column connections with
governing joint shear failure mode,” Latin American Journal of Solids and Structures, vol. 14, no. 7, pp. 1200–1225, 2017. [19] H. Behnam, J. S. Kuang, and B. Samali, “Parametric finite element analysis of RC wide beam-column connections,” Computers and Structures, vol. 205,
pp. 28–44, 2018.
[20] ACI Committee 374, “Guide for testing reinforced concrete structural elements under slowly applied simulated seismic loads (ACI 374.2R-13),” American Concrete Institute, Farmington Hills, MI, p. 22, 2013.
[21] J. G. Stoner, “Finite element modelling of GFRP reinforced concrete beams,” 2015.
[22] J. Lubliner, J. Oliver, S. Oller, and E. Onate, “A Plastic-Damage Model for Concrete,” International Journal of Solids and Structures, vol. 25, no. 3, pp. 299–326, 1989.
[23] J. Lee and G. L. Fenves, “Plastic-damage model for cyclic loading of concrete structures,” Journal of Engineering Mechanics, vol. 124, no. 8, pp. 892–900, 1998.
[24] ACI Committee 544, “Design Considerations for Steel Fiber Reinforced Concrete,” ACI Structural Journal, vol. 88, no. Reapproved 1999, 1988.
[25] ACI Committee 544.1R-96, “State-of-the-Art Report on Fiber Reinforced Concrete. (ACI 544.1R-96),” C American Concrete Institute, Farmington Hills, MI, p. 66, 2002.
[26] P. Ezeldin, A. and Balagurur, “Normal- and h i g h - s t r e n g t h fiber-reinforced concrete under compression,” Journal of Materials in Civil Engineering,
vol. 4, no. 4, pp. 415–429, 1992. [27] J. Barros, J.A.O. & Figueiras, “Flexural Behaviour of Steel Fibre Reinforced Concrete: Testing and Modelling,” Journal of Materials in Civil Engineering,
vol. 11, no. 4, pp. 331–339, 1999.
[28] M. C. Nataraja, N. Dhang, and A. P. Gupta, “Stress-Strain Curve for Steel Fibre Reinforced Concrete Under Compression,” Cement and Concrete Composites, vol. 21, pp. 383–390, 1999.
[29] D. Dupont, “Modelling and experimental validation of the constitutive law and cracking behavior of Steel Fiber Reinforced Concrete,” Heverlee, Catholic
Universty of Leuven, 2003. [30] R. N. Bencardino, F., Rizzuti, L., Spadea, G. & Swamy, “Stress-strain behavior of steel fiber-reinforced concrete in compression,” ASCE Journal of
Materials in Civil Engineering, vol. 20, no. 3, pp. 255–263, 2008.
[31] J. H. Lee, S.C., Oh and J. Y. Cho, “Compressive behavior of fiber-reinforced concrete with end-hooked steel fibers,” Materials, vol. 8, no. 4, pp. 1442–
1458, 2015.
[32] ACI Committee 544.3R-93, “Guide for Specifying, Proportioning, Mixing, Placing, and Finishing Steel Fiber Reinforced Concrete (ACI 544.3R-93),”
American Concrete Institute, Farmington Hills, MI, p. 10, 1998. [33] K. C. Ou, Y.C., Tsai, M.S., Liu, K.Y., Chang, “Compressive Behavior of Steel-Fiber-Reinforced Concrete with a High Reinforcing Index,” Journal of
Materials in Civil Engineering, vol. 24, no. 2, pp. 207–215, 2012.
[34] C. Wang, “Eperimental Investigation of the Behavior of Steel Fiber Reinforced Concrete,” Masters Thesis, University of Canterbury, p.165, 2006. [35] J. A. O. Barros and J. A. Figueiras, “Model for the analysis of steel fibre reinforced concrete slabs on grade,” Computers and Structures, vol. 79, no. 1,
pp. 97–106, 2001.
[36] T. S. Lok and J. R. Xiao, “Flexural strength assessment of steel fiber-reinforced concrete,” Journal of Materials in Civil Engineering, vol. 11, no. 3, pp. 188–196, 1999.
[37] H. Tlemat, K. Pilakoutas, and K. Neocleous, “Modelling of SFRC using inverse finite element analysis,” RILEM Materials and Structures, vol. 39, no.
286, pp. 221–233, 2006. [38] S. M. B. S. Mohsin, “Behaviour Of Fibre-Reinforced Concrete Structures Under Seismic Loading,” Department of Civil and Environmental Engineering
Imperial College London, no. April, p. 340, 2012.
[39] A. Abbas and S. S. Mohsin, “Numerical modeling of fibre-reinforced concrete,” no. 2006, pp. 2005–2006, 2010. [40] T. S. Lok and J. R. Xiao, “Tensile behaviour and moment-curvature relationship of steel fibre reinforced concrete,” Magazine of Concrete Research, vol.
50, no. 4, pp. 359–368, 1998.
[41] D. J. Hannant, Fibre cements and fibre concretes. 1979.
[42] P. Soroushian and C. D. Lee, “Distribution and orientation of fibers in steel fiber reinforced concrete,” ACI Materials Journal, vol. 87, no. 5, pp. 433–
439, 1990.
International Journal of Engineering Research & Technology (IJERT)
ISSN: 2278-0181http://www.ijert.org
IJERTV9IS020110(This work is licensed under a Creative Commons Attribution 4.0 International License.)
Published by :
www.ijert.org
Vol. 9 Issue 02, February-2020
223
[43] A. Amin and R. I. Gilbert, “Steel fiber-reinforced concrete beams-Part I: Material characterization and in-service behavior,” ACI Structural Journal, vol.
116, no. 2, pp. 101–111, 2019.
[44] T. Y. Lim, P. Paramasivam, and S. L. Lee, “Analytical Model for Tensile Behavior of Steel-Fiber Concrete,” ACI Materials Journal, vol. 84, no. 4, pp.
286–298, 1987. [45] B. W. Xu and H. S. Shi, “Correlations among mechanical properties of steel fiber reinforced concrete,” Construction and Building Materials, vol. 23, pp.
3468–3474, 2009.
[46] Eurocode 2, “Design of Concrete Structures: Part 1-1: General Rules and Rules for Buildings,” CEN, London, 2004. [47] T. Kachlakev, D. I.; Miller, “Finite Element Modeling of Reinforced Concrete Structures Strengthened with FRP Laminates,” Oregon Department of
Transportation Research Group & Federal Highway Administration, Washington, DC, USA, p. 113, 2001.
[48] A. M. A. Ibrahim, M. F. M. Fahmy, and Z. Wu, “3D finite element modeling of bond-controlled behavior of steel and basalt FRP-reinforced concrete square bridge columns under lateral loading,” Composite Structures, vol. 143, pp. 33–52, 2016.
[49] A. Raza, Q. U. Z. Khan, and A. Ahmad, “Numerical investigation of load-carrying capacity of GFRP-reinforced rectangular concrete members using
CDP model in abaqus,” Advances in Civil Engineering, vol. 2019, 2019. [50] ACI-ASCE Committee 352, “Recommendations for Design of Beam-Column Joints in Monolithic Reinforced Concrete Structures (ACI 352R-02),”
American Concrete Institute, Farmington Hills, MI, p. 37, 2002.
[51] ACI Committee 318, “Building Code Requirements for Structural Concrete (ACI 318-14) and Commentary (ACI 318R-14),” American Concrete Institute, Farmington Hills, MI, p. 520, 2014.
[52] A. R. Mohamed, M. S. Shoukry, and J. M. Saeed, “Prediction of the behavior of reinforced concrete deep beams with web openings using the finite ele
ment method,” Alexandria Engineering Journal, vol. 53, no. 2, pp. 329–339, 2014.
[53] V. G. Haach, A. Lúcia Homce De Cresce El Debs, and M. Khalil El Debs, “Evaluation of the influence of the column axial load on the behavior of
monotonically loaded R/C exterior beam-column joints through numerical simulations,” Engineering Structures, vol. 30, no. 4, pp. 965–975, 2008.
International Journal of Engineering Research & Technology (IJERT)
ISSN: 2278-0181http://www.ijert.org
IJERTV9IS020110(This work is licensed under a Creative Commons Attribution 4.0 International License.)
Published by :
www.ijert.org
Vol. 9 Issue 02, February-2020
224