seismic vulnerability assessment of continuous multi-span
TRANSCRIPT

3rd Specialty Conference on Disaster Prevention and Mitigation 3e Conférence spécialisée sur la prévention et la mitigation des désastres naturels
Montréal, Québec
May 29 to June 1, 2013 / 29 mai au 1 juin 2013
DIS-82-1
Seismic Vulnerability Assessment of Continuous Multi-Span Bridges in Quebec Retrofitted with Natural Rubber Seismic Isolation
Gustavo Henrique Siqueira, Adamou Saidou Sanda, and Patrick Paultre
Abstract: The damage caused by the disruption of transportation networks after recent earthquakes highlights the need of seismic risk assessment and retrofit prioritization plans for the existing bridge network. Generally, these structures are the weak link in the transportation network and, in the case of Quebec, where a significant part of the provincial product is transported along highways, closure of the bridge network can lead to an economic crisis, in addition to the potential loss of life. An estimated 75% of Quebec bridges are more than 30 years old and were designed without important seismic details adopted in current codes. Consequently, they do not comply with the new uniform hazard spectrum (UHS) having a 2% chance of being exceeded in 50 years, adopted across Canada in 2005. Therefore, it is necessary to develop reliable methods to assess the structural capacity of Quebec bridges—before and after an earthquake—and to assess effective retrofit techniques for the most vulnerable structures. This paper uses with fragility curves to assess the seismic vulnerability of multi-span continuous concrete bridges in Quebec. A comparison between as-built and retrofitted bridges with natural-rubber seismic isolation devices was performed to assess the impact of seismic isolation on the vulnerability of bridge key components and system fragility. The results show the significance of this type of retrofit measure to protect Quebec’s concrete-bridge network from earthquake damage.
1 Introduction
Recent earthquake damage has demonstrated that bridges are the most vulnerable element in a highway system. In Quebec, where a significant part of the provincial product is transported along highways (ISQ 2009), bridge closures after an earthquake could lead to an economic crisis, in addition to the potential loss of life. Furthermore, about 75% of Quebec bridges are 30 or more years old (TQ 1995). Consequently, they were designed without important seismic improvements adopted in recent decades and do not comply with the region’s new seismic hazard. This underlines the need to develop reliable procedures to assess the structural capacity of bridges in Quebec—before and after an earthquake—and to assess effective techniques for retrofitting deficient bridges (Roy et al. 2010).
Fragility curves are useful tools for assessing bridge vulnerability and describing the probability of structural damage over a range of potential earthquake ground-motion intensities. In addition, fragility curves provide an effective way to assess alternative retrofit measures. They can be derived from empirical data (Basöz and Kiremidjian 1998; Shinozuka et al. 2000) or analytical approaches (Nielson and DesRoches 2007a; Pan et al. 2007; Padgett and DesRoches 2009; Agrawal et al. 2012). Moreover, they can be used to develop a post-event action plan (HAZUS 2003). Tavares et al. (2012) have assessed the seismic vulnerability of typical as-built bridges—particularly in eastern Canada—using analytical fragility curves. The results demonstrate that a large number of bridges may be damaged and unsafe after an extreme event.

2
Based on the analysis of the Quebec’s Department of Transportation (MTQ) bridge inventory, Tavares et al. (2012) showed that 21.07% the province’s bridges are of the multi-span concrete-deck (MSC) type supported on concrete girders. Due to number, importance, and susceptibility to seismic events of this bridge type, this study proposes that the elastomeric bearings typically used in Quebec be replace with natural-rubber seismic isolator devices. A comparative study using detailed three-dimension nonlinear models was performed to assess the seismic vulnerability of MSC concrete bridges in their as-built and retrofitted configurations, using different artificial ground motions for the eastern Canada. Experimental results for square bearings of different sizes and shape factors were used to account for the uncertainty concerning the mechanical properties of seismic isolation bearings. Fragility curves for key components of MSC bridges were developed and involve a systems-level abstraction with a Monte-Carlo simulation to assess the fragility of the entire bridge system.
2 MSC-Bridge-Model Simulation and Uncertainty Parameters
The normal configuration of MSC concrete-girder bridges is a concrete deck supported by four reinforced or prestressed concrete girders. Most bridges have three spans and are supported on concrete bents with shallow footings and seat-type abutments with shallow footing foundations. The bridge bents have three circular columns and a transverse beam on the top of the columns. These bridge models are composed of elements that may exhibit highly nonlinear behavior, such as columns, abutments, and elastomeric bearings. In this study, the elastomeric bearings—the typical connection between a superstructure and bents or abutments in as-built configurations—were replaced with natural-rubber seismic isolator devices. No skew angle was considered (Tavares et al. 2012). For the MSC bridge portfolio, eight geometric configurations were defined as representative of actual bridge configurations and are presented in Table 1. The geometric parameters were treated as macro-variables. A statistical distribution was attributed to the histograms of actual geometrical data for each parameter. Using a Latin hypercube sampling (LHS) technique, these distributions were sampled to develop the geometric blocks. The composition of these blocks was chosen so that the influence of other parameters and the importance of geometry were not neglected.
Table 1: Geometric configurations of MSC concrete-girder bridges.
MSC_Concrete Spans Total Deck Column *Lmr Length (m) Width (m) Height (m)
Block 1 3 100.98 13.04 6.72 0.30 Block 2 3 64.79 8.35 8.35 0.52 Block 3 3 54.61 23.43 9.78 0.36 Block 4 3 75.27 17.65 4.73 0.47 Block 5 3 45.93 10.72 3.77 0.46 Block 6 3 114.49 15.23 7.8 0.32 Block 7 3 67.96 11.8 6.15 0.43 Block 8 3 89.27 16.16 4.24 0.39
* Ratio between middle span length and total length of the bridge
Generic finite-element models were generated in OpenSees (Mazzoni et al. 2007) for each bridge class. The generic FEM was parameterized to enable variation in geometric features (e.g., total length or deck width) and component modeling (e.g., isolator stiffness or concrete strength) and is presented in Figure 1. The superstructure, corresponding to the deck and concrete girders, was modeled with elastic beam–column elements represented by a single element in the center of the deck cross section. The middle span was divided into 20 elements with a lumped mass; the other two spans were divided into 10 superstructure elements. Their mechanical properties include the compound cross-sectional area (A), Young’s modulus (E), shear modulus (G), and the moments of inertia about the three main directions (torsion J, Iy, and Iz). In order to properly transfer efforts in the transverse direction, rigid connections were considered at the abutments and bents. The transverse beams and columns were modeled using nonlinear beam–column elements. These elements can be defined as force-based elements with spread plasticity (Neuenhofer and Filippou 1998). For each fiber element, a singular stress–strain relationship

3
can be developed and thus precisely delineate the regions of confined and unconfined concrete as well as the longitudinal reinforcing-steel layers. The stress–strain relationship for confined and unconfined concrete was defined using the law presented by Cusson and Paultre (1995). Each column was divided into five nonlinear elements in their height direction. Seven Gauss-Lobatto integration points were used within each finite element in the plastic-hinge regions. Column diameter was defined to allow bridge weight to account for 10% of axial capacity, and was limited to between 0.75 and 2.5 m to avoid unrealistic dimensions.
Figure 1: Analytical model of MSC bridges: (a) 3-D model and parameter uncertainties (N = normal distribution; LN = lognormal distribution; U = uniform distribution); (b) nonlinear beam–column elements;
(c) zero-length elements representing seismic isolation bearings.
Zero-length elements were used to represent the behavior of connections between the superstructure and bents or abutments, foundation, and impact elements. Pounding between decks or deck abutments were modeled using a bilinear element, which accounts for the energy dissipated during the contact, in series with a gap element. Analytical properties of the shallow foundations were obtained using the frequency-independent spring-dashpot model proposed by Clough and Penzien (1975). The soil–structure interaction effect was taken into account with six compliance springs and dampers (for the six degrees of freedom) that were uncoupled from each other, according to the recommendations of CSA S6-06 (2006). Lumped mass was applied to the center of footing height. The behavior of the seat-type abutments was also incorporated into the model through the use of translational and rotational springs based on a linear elastic half-space theory and their stiffness was calculated based in the analytical model proposed by Wilson (1988). The analytical model accounts for the back-wall and backfill stiffness

4
as well as the spread footing in the longitudinal direction, and the embankment and wing-wall stiffness in the transverse direction. Further details about these modeling assumptions can be found in Suescun (2010) and Tavares et al. (2012).
3 Retrofit with Natural-Rubber Seismic Isolators
The seismic isolation bearings were modeled with a bilinear element according to the indications proposed by Naeim and Kelly (1999). They were designed to target periods of vibration varying from 1.85 s to 2.5 s for the first two natural periods of vibration in the longitudinal and transverse directions. A median displacement of 100 mm was adopted considering a median hazard spectrum (with ± one standard deviation) compatible with eastern Canada and the range of periods of vibration presented above. The mechanical properties for the seismic isolators were determined from a series of experimental tests on square bearings. Different specimens with sides varying from 100 to 450 mm and shape factors varying from 4.2 to 12.5 of a low damping 55 hard natural rubber were tested. Two different setup configurations were used and presented in Figure 2. The small-bearing test setup (Fig. 2a) was designed to test a specimen of two parallel small bearing samples with a length of 100 mm at 0.5 Hz. The maximum available horizontal and axial forces were ±100 kN, and maximum horizontal displacement of ±100 mm. The large-bearing test setup (Fig. 2b) was designed to test single square-bearing samples of sizes varying from 250 mm to 600 mm. The maximum available horizontal force was ±500 kN and the maximum horizontal displacements were ±250 mm at 0.1 Hz for harmonic loading or 500 mm for quasi-static tests in one direction. Axial compressive forces were applied by an MTS press with a capacity of up to 13,000 kN.
Figure 2: Experimental setups used for material characterization tests.
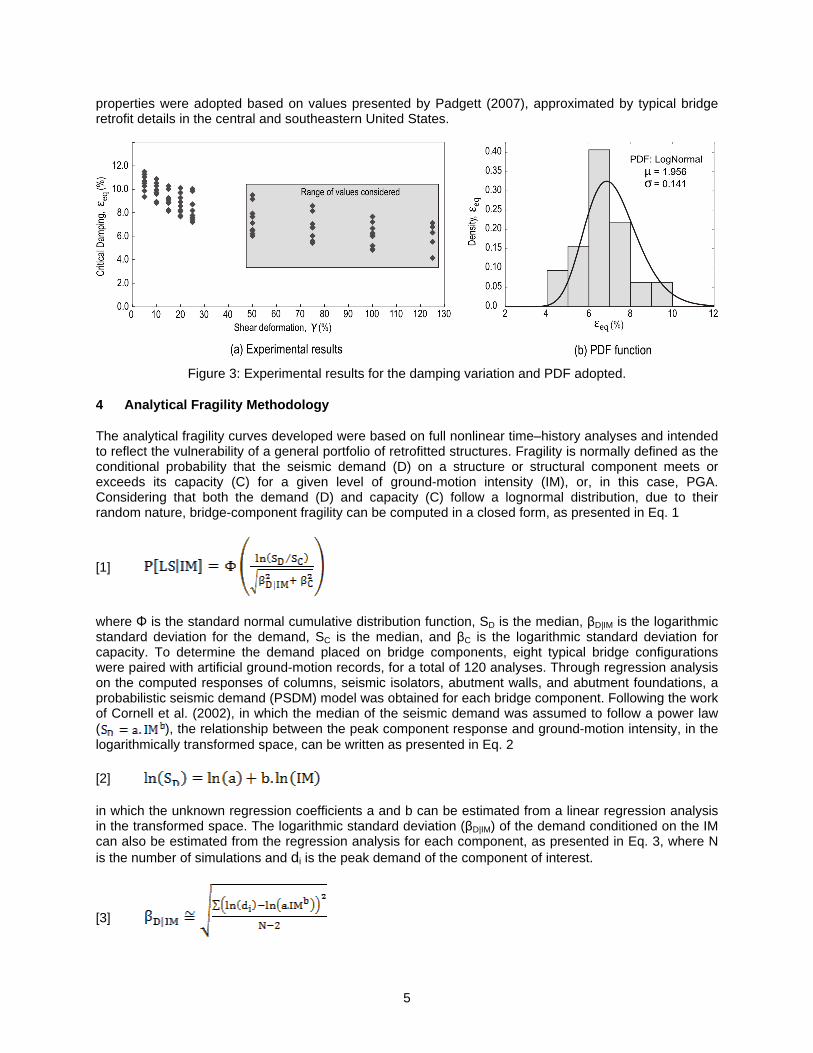
To account for the incertitude in mechanical properties, values of shear modulus and damping for shear deformations varying from 50% to 125% and for pressures varying from 5.0 MPa to 7.5 MPa were considered. These results were plotted as histograms and a probability density function (PDF) applied to represent statistically significant variations in mechanical properties. An example of the procedure is presented in Figure 3 for damping variation. In the case of shear modulus, a lognormal PDF with a median (μ) of -0.203 (0.816 MPa) and a standard deviation (σ) of 0.141 were adopted. The values of shear modulus samples used in analysis, which controlled the horizontal stiffness of the seismic isolators, which varied from 0.65 MPa to 1.03M Pa for a cumulative probability distribution between 5% and 95%. For the damping variation, a lognormal PDF median (μ) of 1.956 (7.075%) and standard deviation (σ) of 0.176 provided a better representation of the experimental results. In this case, the values of the damping samples varied from 5.3% to 9.5% (cumulative probability distribution between 5% to 95%). The range of property values for samples of shear modulus and damping varied from 0.65 to 1.30 around the median value. Therefore, this range of variation covers the changes in mechanical properties due to environmental effects (e.g., temperature, aging, etc.). More details about the experimental tests of seismic isolators can be found elsewhere (Siqueira 2013). For abutment isolators, a keeper plate was considered in the transverse direction to reduce the demand applied to the wing walls. Keeper-plate
(a) Small bearing test setup (b) Large bearing test setup
5
properties were adopted based on values presented by Padgett (2007), approximated by typical bridge retrofit details in the central and southeastern United States.
Figure 3: Experimental results for the damping variation and PDF adopted.
4 Analytical Fragility Methodology
The analytical fragility curves developed were based on full nonlinear time–history analyses and intended to reflect the vulnerability of a general portfolio of retrofitted structures. Fragility is normally defined as the conditional probability that the seismic demand (D) on a structure or structural component meets or exceeds its capacity (C) for a given level of ground-motion intensity (IM), or, in this case, PGA. Considering that both the demand (D) and capacity (C) follow a lognormal distribution, due to their random nature, bridge-component fragility can be computed in a closed form, as presented in Eq. 1
[1]
where Φ is the standard normal cumulative distribution function, SD is the median, βD|IM is the logarithmic standard deviation for the demand, SC is the median, and βC is the logarithmic standard deviation for capacity. To determine the demand placed on bridge components, eight typical bridge configurations were paired with artificial ground-motion records, for a total of 120 analyses. Through regression analysis on the computed responses of columns, seismic isolators, abutment walls, and abutment foundations, a probabilistic seismic demand (PSDM) model was obtained for each bridge component. Following the work of Cornell et al. (2002), in which the median of the seismic demand was assumed to follow a power law ( ), the relationship between the peak component response and ground-motion intensity, in the logarithmically transformed space, can be written as presented in Eq. 2
[2]
in which the unknown regression coefficients a and b can be estimated from a linear regression analysis in the transformed space. The logarithmic standard deviation (βD|IM) of the demand conditioned on the IM can also be estimated from the regression analysis for each component, as presented in Eq. 3, where N is the number of simulations and di is the peak demand of the component of interest.
[3]

6
Capacity estimates of bridge components have been traditionally defined to correspond to qualitative descriptions such as slight, moderate, extensive, and complete, as presented in HAZUS (2003). Specific measurable metric values (in terms of a median SC and a lognormal standard deviation βC) were attributed to each of the qualitative damage descriptions and bridge components to generate a limit state (LS), which corresponds to a particular level of anticipated bridge functionality. These limit-state capacities were also considered to follow a lognormal distribution. The actual values and assumptions used during the analysis are presented later.
Using the results of median demand values of various bridge components, a correlation matrix was obtained and used to generate a joint PSDM, as proposed by Nielson and DesRoches (2007b). The correlation matrix reflects the overall dynamics of the bridge system, including the influence of each component on another component’s behavior. The system fragility for retrofitted MSC concrete bridges was assessed through a Monte-Carlo simulation using a series approximation for bridge-level failure analysis. This simulation is intended to integrate the joint PSDM over all possible failure domains as defined by the limit states. The probability that the bridge system was at or beyond a particular limit state is therefore the union of the probabilities of the bridge components exceeding the same LS. Finally, the parameters for the lognormal distribution representing the system fragility (median and lognormal standard deviation) were estimated through regression analysis, allowing the assessment of the conditional probability of achieving various qualitative damage states.
To account for the uncertainty due to earthquakes, the suite of synthetic ground motions developed by Atkinson (2009) for eastern Canada site-class C in the NBCC (2005), and compatible with a uniform hazard spectrum (UHS) having a 2% probability of exceedance in 50 years is used. The ability of the fragility curve procedure to propagate inherent uncertainties as the earthquake source, wave propagation, and soil conditions is conditioned by the ability of the suite to capture these aleatoric uncertainties. The range of PGA for the entire ground-motion suite was 0.1 to 1.25 g. From a total of 180 artificial ground motions generated, a set of 120 orthogonal components were selected and applied in the longitudinal and transverse directions of each bridge model.
5 Demand and Capacity Estimates
The seismic demand for each retrofitted bridge class was assessed by constructing PSDMs for the response of critical bridge components considering a power law, as presented above. The potential nonlinear behavior of columns, abutment footings, abutment walls, and seismic isolators were considered in the three-dimensional analytical models. The demand placed on each component varied from as-built bridges when seismic isolation was considered as a retrofit measure, with different values for the median (ln(a)) and slope (b) of the regression models. Figure 4 presents a comparison of regression lines for column drift of as-built and isolated MSC concrete bridges. The replacement of conventional elastomeric bearings (solid lines) with seismic isolators (dotted lines) increased system flexibility, significantly reducing column drift. The values of PSDM estimates for as-built and isolated models can be found elsewhere (Tavares et al. 2012, Siqueira 2013).
Figure 4: PSDM regression comparison of column drift for as-built and isolated MSC concrete bridges.

7
In this study, the median values of the prescriptive limit states used by Tavares et al. (2012) were adapted for columns, abutment walls, and foundation footings for retrofitted bridge models in Quebec. These limit states were associated with qualitative descriptions or functional interpretations of bridge damage such as slight, moderate, extensive, and complete, as presented in HAZUS (2003). Due to the nonspecificity of a unique column configuration, column drift values were adopted based on the study conducted by Tavares et al. (2010). In the case of abutment walls and footing foundations, the first limit state was defined as the first yield, while the other limit states were defined based on the ultimate displacement of these components.
The derivation of limit states for the seismic isolators was based on stability tests for two slender square bearings measuring 300 mm on a side, with a total rubber height of 180 mm and shape factors of 6.25 and 8.33, respectively. Experimental tests were based on the constant lateral-displacement method and the critical load was determined by the procedure developed by Nagarajaiah and Ferrell (1999). Using the results obtained for these slender bearings, two-dimensional half-space finite-element models were developed using ADINAR and compared to the experimental results. The Neo-Hookean constitutive model with stiffening and four node elements with constant pressure were used to represent the rubber elements. Since good agreement between experimental results and FE modeling was found, three specimens measuring 300 mm on a side and with a total rubber height of 108.0 mm were modeled, covering a range of shape factors varying from 6.25 to 12.5. Figure 5 presents the details of the experimental test and the FE model. Considering a range of service pressures varying from 5.0 to 7.5 MPa, the mean value of critical displacement causing instability of the FE-bearing models was 288 mm, which corresponds to 267% of shear strain. Since the specimens tested evidenced no sign of intermediary damage prior to instability or shear failure, which occurred at shear-strain values of around 300% for a compressive pressure of 5.0 MPa, this value of 267% of shear strain is considered to be the only limit state for natural-rubber seismic isolators in Quebec. The limit states for all components considered for retrofitted Quebec bridges are presented in Table 2, in terms of a median (SC) and lognormal standard deviation (βC).
Figure 5: Critical load-test details: (a) photograph of the specimen during test; (b) FE mesh in the laterally deformed configuration.
Table 2: Limit state capacities for isolated bridges in Quebec.
Component Slight Moderate Extensive Complete SC βC SC βC SC βC SC βC
Column drift (%) 0.5 0.250 0.7 0.250 1.1 0.460 3.0 0.460 Abutment back-wall deformation (mm) 7.0 0.250 15.0 0.250 30.0 0.460 60.0 0.460 Abutment wing-wall deformation (mm) 7.0 0.250 15.0 0.250 30.0 0.460 60.0 0.460 Abutment footing, longitudinal (mm) 4.0 0.250 20.0 0.250 40.0 0.460 80.0 0.460 Abutment footing, transverse (mm) 4.0 0.250 20.0 0.250 40.0 0.460 80.0 0.460 SI* longitudinal, shear strain (%) 267.0 0.460 267.0 0.460 267.0 0.460 267.0 0.460 SI* transverse, shear strain(%) 267.0 0.460 267.0 0.460 267.0 0.460 267.0 0.460
* SI = seismic isolator

8
6 Fragility Results
Using the methodology presented earlier, fragility curves were developed for different components and, adopting a series-system approach, the fragility of the full bridge system was assessed. Figure 6 provides a comparison of component fragilities and full-bridge system fragility for as-built and isolated models. Components with values of cumulative probability smaller than 5% for a PGA of 1.0 g are not presented due to the low probability of occurrence. As can be seen, the use of seismic isolators reduced the fragility of almost all components assessed. Consistent with the results of Tavares et al. (2012), abutment footing did not present significant vulnerability. In the case of columns, a significant reduction in the risk of damage was observed for slight and moderate limit states. The controlling fragile component contributing to system fragility in the as-built models varied depending on the damage state of interest. For slight damage, elastomeric bearings yielded the highest fragilities, followed by columns. In the case of moderate damage, abutment walls and columns evidenced very similar levels of fragility in the range of the PGA values considered. Abutment walls were the most fragile components for the remaining limit states. This could cause some traffic restrictions or even some bridge closures. In the case of isolated bridges, the wing wall was the controlling fragile component for all bridge classes. This would provide some advantages in terms of bridge performance after an earthquake. For example, considering the performance levels described by the limit states, even if the wing walls were damaged after an earthquake, the system would maintain functionality due to column and foundation integrity, and no bridge closure is expected.
Figure 6: Comparison of component and system fragility for as-built and isolated MSC concrete bridges in Quebec.
The system fragility was reduced significantly for slight damage; smaller reductions are observed at moderate and extensive damage states. This smaller reduction can be explained by the fact that the abutment wing walls governed the fragility of the isolated systems. Due to the superstructure mass of this bridge class, significant inertial loads were transferred to these slender structures during an extreme event; even with the use of keeper plates to reduce the demand, significant damage is expected. The

9
probability of complete damage for all bridge classes was less than 10%, and low susceptibility for complete damage is expected.
Conclusions
This paper presented the analytical development of fragility curves for typical multi-span concrete bridges in Quebec retrofitted with natural-rubber seismic isolators. The methodology for assessing the fragility of isolated Quebec bridges includes the use of 3-D analytical models subjected to a suite of bidirectional GMTHs for eastern Canada. The contribution of multiple vulnerable components was incorporated for the system fragility estimation. Experimental results of square bearings of different sizes and shape factors were used to account for uncertainty about the mechanical properties of seismic isolators. Moreover, experimental results and finite-element modeling to determine the critical load of square bearings were used to establish the limit states for seismic isolators in terms of shear strain. The fragility of different components offers insight into the impact of seismic isolation in the demand placed on various system components. Generally, the use of seismic isolators significantly reduced the demand placed on key elements such as columns for seismic isolated bridges. The use of seismic isolators significantly reduced system fragility for a slight limit state; smaller reductions were observed for higher damage states. The main difference between system fragility for the as-built and isolated models was that a different component governed system fragility depending on the limit state in the case of as-built bridges. In the case of isolated bridges, the abutment wing wall governed system fragility in all limit states. Protecting key components of the bridge system, such as columns and foundations, leads to less time to restore complete bridge functionality and less probability of traffic restriction or bridge closure after an extreme event.
Acknowledgments
The authors would like to acknowledge the financial support of the Natural Sciences and Engineering Research Council of Canada (NSERC) for the Canadian Seismic Research Network (CSRN) under the Strategic Research Networks program, the Québec Fonds pour la recherche sur la nature et les technologies (FQRNT) for the financial support of the Centre d’études interuniversitaire des structures sous charges extrêmes (CEISCE). In addition, the authors acknowledge the support of the Réseau Québécois de Calcul de Haute Performance - RQCHP.
References
Agrawal, A.K., Ghosn, M., Alampalli, S. and Pan, Y. 2012. Seismic fragility of retrofitted multi-span continuous steel bridges in New York. Journal of Bridge Engineering, vol. 17(4), pp. 562–575.
Atkinson, G.M. 2009. Earthquake time histories compatible with the 2005 national building code of canada uniform hazard spectrum. Canadian Journal of Civil Engineering, vol. 36(6), pp. 991–1000.
Basöz, N. and Kiremidjian, A.S. 1998. Evaluation of bridge damage data from the loma prieta and northridge, california earthquakes. MCEER-98-004, Multidisciplinary Center for Earthquake Engineering Research, State University of New York at Buffalo, NY, USA.
CAN/CSA-S6-06. 2006. Canadian Highway Bridge Design Code. Canadian Standards Association.
Clough, R.W. and Penzien, J. 1975. Dynamics of structures. McGraw-Hill.
Cornell, C.A., Jalayer, F., Hamburger, R.O. and Foutch, D.A. 2002. Probabilistic basis for 2000 sac federal emergency management agency steel moment frame guidelines. Journal of Structural Engineering, vol. 128(4), pp. 526–533, 2002.
Cusson, D. and Paultre, P. 1995. Stress-strain model for confined high-strength concrete. Journal of Structural Engineering, vol. 121(3), pp. 468–477.
FEMA. 2003. Multi-hazard loss estimation methodology: earthquake model - HAZUS-MH MR3 technical manual. Federal Emergency Management Agency, Washington, DC, USA.

10
ISQ. 2009. Le québec chiffres en main. Institut de la statistique du Québec, Québec, QC.
Mazzoni, S., McKenna, F., Scott, M.H. and Fenves, G.L. 2009. Open system for earthquake engineering simulation user command-language manual, opensees version 2.0. Pacific Earthquake Engineering Research Center, University of California, Berkeley, CA, USA. (available online: http://opensees.berkeley.edu/OpenSees/manuals/usermanual/).
Naeim, F. and Kelly, J.M. 1999. Design of seismic isolated structures: from theory to practice. John Wiley & Sons, Inc., 1999.
Nagarajaiah, S. and Ferrell, K. 1999. Stability of elastomeric seismic isolation bearings. Journal of Structural Engineering, vol. 125(9), pp. 946–954.
NBCC. 2005. National Building Code of Canada. National Research Council of Canada.
Neuenhofer, A. and Filippou, F.C. 1998. Geometrically nonlinear flexibility-based frame finite element. Journal of Structural Engineering, vol. 124(6), pp. 704–711, 1998.
Nielson, B.G. and DesRoches, R. 2007a. Analytical seismic fragility curves for typical bridges in the central and southeastern United States. Earthquake Spectra, vol. 23(3), pp. 615–633.
Nielson, B.G. and DesRoches, R. 2007b. Seismic fragility methodology for highway bridges using a component level approach. Earthquake Engineering & Structural Dynamics, vol. 36(6), pp. 823–839.
Padgett, J.E. 2007. Seismic vulnerability assessment of retrofitted bridges using probabilistic methods. PhD thesis, Department of Civil and Environmental Engineering, Georgia Institute of Technology, Atlanta, GA, USA.
Padgett, J.E. and DesRoches, R. 2009. Retrofitted bridge fragility analysis for typical classes of multi-span bridges. Earthquake Spectra, vol. 25(1), pp. 117–141.
Pan, Y., Agrawal, A.K. and Ghosn, M. 2007. Seismic fragility of continuous steel highway bridges in New York State. Journal of Bridge Engineering, vol. 12(6), pp. 689–699.
Roy, N. Paultre, P. and Proulx, J. 2010. Performance-based seismic retrofit of a bridge bent: Design and experimental validation. Canadian Journal of Civil Engineering, vol. 37(3), pp. 367–379.
Shinozuka, M., Feng, M.Q., Lee, J. and Naganuma, T. 2000. Statistical analysis of fragility curves. Journal of Engineering Mechanics, vol. 126(12), pp. 1224–1231.
Siqueira, G.H. 2013. Vulnerability Assessment of Highway Bridges in Quebec Retrofitted with Natural Rubber Seismic Isolators. PhD thesis. Faculté de Génie, Département de Génie Civil, Université de Sherbrooke, Sherbrooke, QC.
Suescun, J.R. 2010. Fragility curves for quebec’s multi-span continuous concrete girder bridges considering the soil profiles specified in the CAN/CSA-S6-06 code. Master’s thesis. Faculté de Génie, Département de Génie Civil, Université de Sherbrooke, Sherbrooke, QC.
Tavares, D.H., Cardona, L. and Paultre, P. 2010. Bridge reinforced concrete column limit state definition. In Anais do 52o Congresso Brasileiro do Concreto, CBC2010, Fortaleza, CE, Brazil.
Tavares, D.H., Padgett, J.E. and Paultre, P. 2012. Fragility curves of typical as-built highway bridges in eastern Canada. Engineering Structures, vol. 40, pp. 107–118, 2012.
TQ. 1995. Manuel d’inspection des structures: Évaluation des dommages. Ministre des Transports du Québec, Bibliothèque Nationale du Québec, Gouvernement du Québec, Québec, QC.
Wilson, J.C. 1988. Stiffness of non-skew monolithic bridge abutments for seismic analysis. Earthquake Engineering and Structural Dynamics, vol. 16, pp. 867–883.