seismology instruction with amaseis -...
TRANSCRIPT

Seismology Instruction with AmaSeisinstallation and use of the AS-1 seismometer
1© University of Arizona
Tammy K. BaldwinAnne M. Paquette
Department of GeosciencesUniversity of Arizona
1040 E. 4th StreetTucson, AZ 85721-0077

Seismology Instruction with the AS-1
© University of Arizona 2
AmaSeis Version 0.6 Level 2002.05.28
Getting Started
Introduction ……………………………………………………………....... Seismometer Location ………………………………………….………...... Seismology Overview ...…………………………………………….….......
Seismometer Assembly
Packing List ………………………………………………………...…….... Seismometer Assembly …………………………………………...…....…..
Software Installation and Operations Software Installation ……………………………………………………..... Installing a New Version of AmaSeis ............................................................ AmaSeis File Structure ................................................................................. Setting the Date and Time ............................................................................. Launching the Program ................................................................................. Changing the Port Setting ............................................................................. Launching the Program ................................................................................. Setting Station Parameters ............................................................................ Finding the Trace .......................................................................................... Centering the Trace ....................................................................................... Instrument Settings ....................................................................................... Congratulations! ............................................................................................
Using AmaSeis
Helicorder Screen Overview ...……………………………………….…..... Saving an Event ………………………………....................……………..... Printing an Event .…………………………………..................................... Extract Event Screen Overview ......……………………………………….. Tips for picking P, S, and Surface waves ………...……………………....... Picking Arrivals in AmaSeis ......................................................................... Using the Travel Time Curve ........................................................................ Storing Event Information ............................................................................ Data Identifi cation and Event Location ........................................................ Filtering .........................................................................................................
Acknowledgements ....................................................................................... Additional Resources and Information ………………………….…............
334
55
9910111111121212131314
14151516171718192022
2323

Introduction
The AS-1 System was designed and built to make the science of seismology accessible to individuals and schools at a reasonable cost. With the AS-1 seismometer, you will be able to record and analyze earthquakes. In the classroom, the instrument will allow students to watch a quake roll in as it is occurring. Students will be able to watch a current event unfold, long before the media reports begin.
The AS-1 seismometer combined with the AmaSeis software allows real-time recording of seismic events and simplifi es data analysis. The AmaSeis software automatically stores the ground movements so that the earthquake can be extracted and analyzed at a later time. The AS-1 System will record local quakes as small as magnitude 3.5 at a distance of 150 km, and larger quakes that occur anywhere in the world.
This manual will take you through the setup, software installation, and use of your AS-1 System. It will also give you an introduction to seismogram interpretation and analysis.
Seismometer Location
There are two important location considerations:
Seismometer
Computer Display
Seismology Instruction with the AS-1
3 © University of Arizona
• Find a suitable location for the seismometer, preferably where local vibrations from people or machinery are at a minimum. Vibrations can be caused by air conditioning units, traffi c, construction, or weather. The vibrations, called seismic noise, can hide seismic signals from smaller events. The best surface for the seismometer is a concrete or stone fl oor, in a location free of extreme temperature variations. A back room or storage closet out of the way is an ideal location for the instrument for optimal recordings. The seismometer can be out on display in a public place so that students can see it in operation, but the tradeoff is that fewer earthquakes may be detected because of increased local vibration.
• The computer display showing the real-time data does not need to be close to the seismometer. The AS-1 is shipped with a 7 m (22 ft) paired shielded coaxial cable. The cable can be extended, allowing freedom of placement. We have purchased 21.5 m (70 ft), without loss of signal. Ideally, place the computer display in a prominent location either a classroom or public area where data can be monitored.
Seismology Instruction with the AS-1
4 © University of Arizona
Seismology Overview
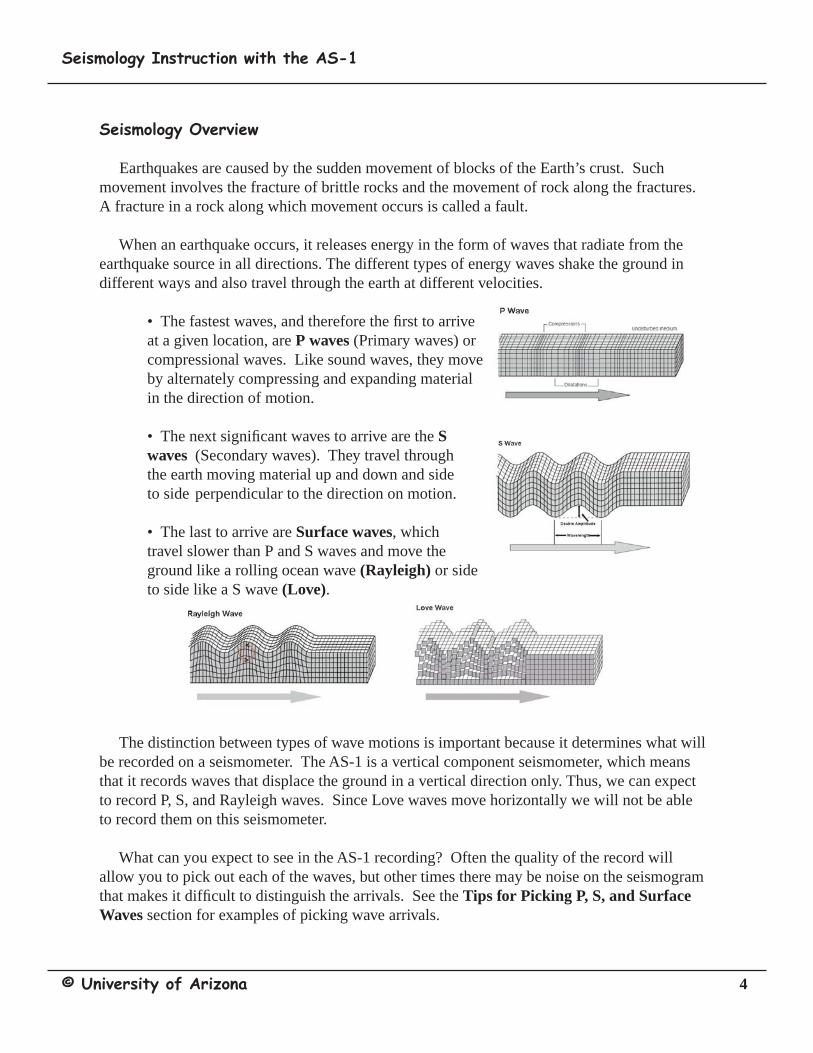
Earthquakes are caused by the sudden movement of blocks of the Earth’s crust. Such movement involves the fracture of brittle rocks and the movement of rock along the fractures. A fracture in a rock along which movement occurs is called a fault.
When an earthquake occurs, it releases energy in the form of waves that radiate from the earthquake source in all directions. The different types of energy waves shake the ground in different ways and also travel through the earth at different velocities.
• The fastest waves, and therefore the fi rst to arrive at a given location, are P waves (Primary waves) or compressional waves. Like sound waves, they move by alternately compressing and expanding material in the direction of motion.
• The next signifi cant waves to arrive are the S waves (Secondary waves). They travel through the earth moving material up and down and side to side perpendicular to the direction on motion.
• The last to arrive are Surface waves, which travel slower than P and S waves and move the ground like a rolling ocean wave (Rayleigh) or side to side like a S wave (Love).
The distinction between types of wave motions is important because it determines what will be recorded on a seismometer. The AS-1 is a vertical component seismometer, which means that it records waves that displace the ground in a vertical direction only. Thus, we can expect to record P, S, and Rayleigh waves. Since Love waves move horizontally we will not be able to record them on this seismometer.
What can you expect to see in the AS-1 recording? Often the quality of the record will allow you to pick out each of the waves, but other times there may be noise on the seismogram that makes it diffi cult to distinguish the arrivals. See the Tips for Picking P, S, and Surface Waves section for examples of picking wave arrivals.
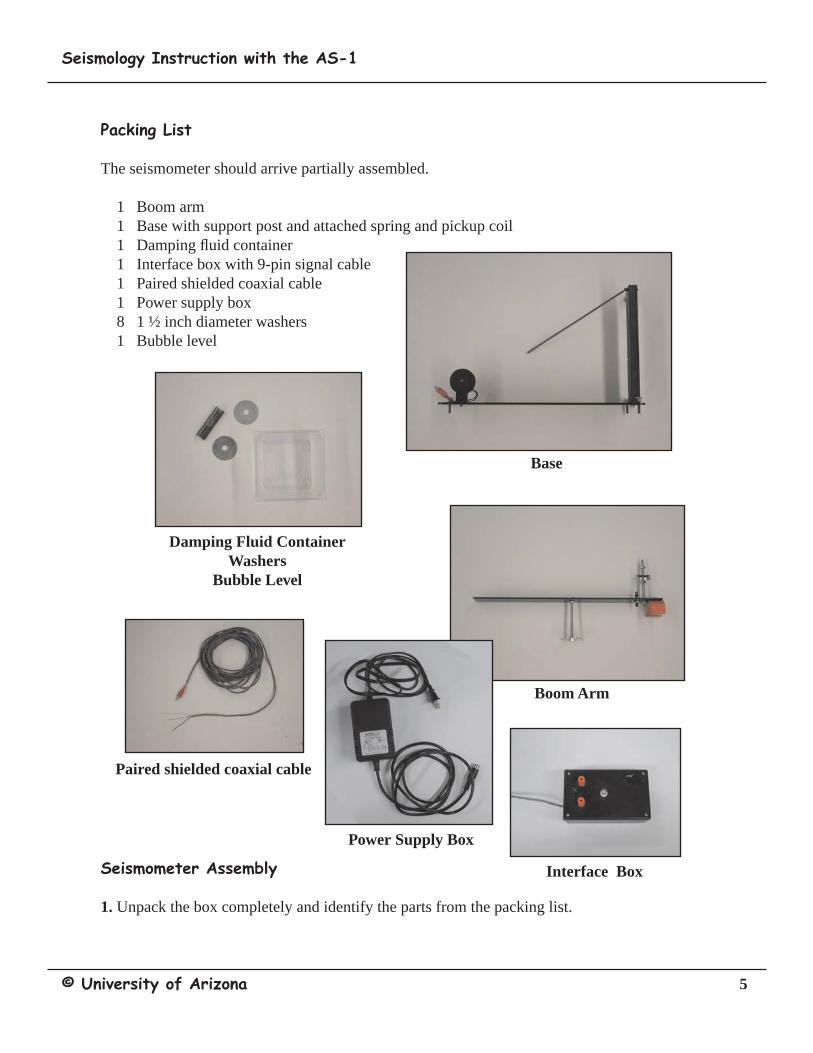
Packing List
The seismometer should arrive partially assembled.
1 Boom arm 1 Base with support post and attached spring and pickup coil1 Damping fl uid container1 Interface box with 9-pin signal cable1 Paired shielded coaxial cable1 Power supply box8 1 ½ inch diameter washers1 Bubble level
Seismometer Assembly
1. Unpack the box completely and identify the parts from the packing list.
Seismology Instruction with the AS-1
5 © University of Arizona
Base
Boom Arm
Damping Fluid ContainerWashers
Bubble Level
Paired shielded coaxial cable
Interface Box
Power Supply Box

2. Place the base of the seismometer on a level surface. The base contains three leveling screws (Figure 1). Use the bubble level and adjust the leveling screws as needed. Check the level of the base both front-to-back and side-to-side.
4. The upright bolt on the boom arm requires a stack of fi ve washers approximately 2.5 cm (1 inch) from the top. Secure the stack between hex nuts (Figure 3)
With the added weight of the washer stack the boom arm should now be suspended over the coil. Center the magnet over the coil (Figure 4) by sliding the knife edge at the support post (Figure 5). The boom arm should move freely up and down, but the magnet should not touch the coil.
5. Carefully swing the boom up until it is possible to position the damping fl uid container under the damping vane. Do not fi ll the container before it is positioned correctly.
CAUTION: Do not release the boom arm abruptly and allow the magnet to hit the coil. The equipment is sensitive, handle and adjust the parts carefully and gently.
6. Add fl uid to the damping fl uid container with either mineral oil or synthetic 10-40 motor oil. The fl uid level should be 1 cm (3/8 inch) below the top of the container.
Seismology Instruction with the AS-1
6 © University of Arizona
Figure 2
Figure 1
Figure 4
Figure 5
3. Remove the tape from the knife-edge at the end of the boom. CAUTION: The knife-edge is sharp, be careful not to cut your hand or damage the knife-edge. One end of the spring should be already connected to the upright support post. Attach the other end of the spring to the boom. Position the boom’s knife-edge into the slot on the support post. The boom will be positioned at an angle, this is to be expected and will not damage the boom (Figure 2). CAUTION: Before moving the seismometer, disconnect the boom to prevent damage to the knife edge.
Figure 3

Seismology Instruction with the AS-1
7 © University of Arizona
7. The boom arm must be level to accurately record vertical motion. Begin by positioning the bubble level on the boom, as shown in Figure 6. If needed, add one or two washer(s) along the boom until the boom is level. The positioning of the washers and the bubble level will vary. The bubble level and the balance washer(s) stay on the boom arm to keep it level.
8. Rotate the bubble level 90 degrees on the boom. Adjust the base leveling screws until the bubble is again centered. Rotate the bubble level 90 degrees back to its starting position.
9. Check that the magnet is still centered above the coil. The boom can be horizontally adjusted by pushing the boom at the support post (Figure 7). The boom arm should move freely up and down, but the magnet should not touch the coil.
10. Attach the paired shielded coaxial cable to the interface box. To attach a wire to a post the wire must pass through the hole on the post (Figure 8), then tighten the plastic knob. The center conductor of the signal cable (uninsulated wire) should be connected to the ground terminal (black post) on the interface box. The remaining two insulated wires should be connected to the two red posts. (Figure 9)
11. There are 2 cables leaving the interface box (Figure 10). The paired shielded coaxial cable (attached to the interface box in Step 10) has a red plug connector on the end. The other cable has a gray 9-pin connector. Install the 9-pin connector from the interface box to the serial port on your personal computer. If your serial card has a 25-pin con-nector, you will need to pur-chase a 9- to 25- pin adapter (available at Radio Shack).
Figure 6
Figure 7
Figure 8
Figure 9
Figure 10

12. The paired shielded coaxial cable attached to the interface box has a red connector end. Plug it into the matching red connector on the seismometer base.
13. Plug in the 5-pin cable from the power supply box to the 5-pin slot on the interface box. Plug in the power cord from the power supply to an outlet (Figure 10).
14. Cover the seismometer with the plexiglass display box. This will minimize motion of the boom due to air currents.
Seismology Instruction with the AS-1
8 © University of Arizona
Figure 10

Software Installation
a) Installing from CD
• Exit all windows programs before inserting the CD.
• Insert the disk in your CD drive. The setup program will automatically be launched.
• Install using the default settings
b) Downloading AmaSeis
• Go to: http://www.geol.binghamton.edu/faculty/jones/as1.html
• Click on the link labeled AmaSeisSetup.exe
• Save the fi le to the Desktop
• Double click on the amaseissetup.exe on the desktop. This will launch the setup program
The standard installation will put fi les in My Computer > System C > AmaSeis
It will also put an icon under the Start menu Start > Programs > Seismology > AmaSeis
Installing a New Version of AmaSeis
To upgrade your version go to:
http://www.geol.binghamton.edu/faculty/jones/as1.html
• Click on the link labeled AmaSeisUpgrade.exe
If prompted save the fi le to the Desktop
• Double click on the amaseisupgrade.exe fi le on the desktop
This will open the WinZip Self Extracting Dialog Box
• Click on UnZip to upgrade AmaSeis
Seismology Instruction with the AS-1
9 © University of Arizona
Once AmaSeis is installed you will need to check for program updates every few months.
• If your computer does not have the WinZip software, a copy is included on the AmaSeis CD.
Once the extraction is complete a message box will appear saying the upgrade was successful. The AmaSeisUpgrade.exe fi le can be deleted from the desktop.

AmaSeis File Structure
AmaSeis stores data in a set of nested folders. A year’s worth of data will take up about 500 megabytes. This can be searched for events at any time. Be aware of the amount of space the data will take so that you don’t fi ll your disk. To erase old data, use the Windows Explorer. Remember, once it is deleted, you can not recover it.
The path to the AmaSeis directory (if you used a standard install) is My Computer > System C > AmaSeis. The AmaSeis directory contains data folders, fi les, and the program.
• AmaSeis creates a series of nested folders to store data. The top level folders are divided by years. In each year folder, there will be 12 month folders which contain subfolders for each day. The actual data fi les are saved with the naming convention hour.z.
Seismology Instruction with the AS-1
10 © University of Arizona
• AmaSeis references time in Coordinated Universal Time (UTC), the international time standard. It is the current term for what was commonly referred to as Greenwich Meridian Time (GMT). Zero (0) hours UTC is midnight in Greenwich England, which lies on the zero longitudinal meridian. Universal time is based on a 24 hour clock, therefore, afternoon hours such as 4 pm UTC are expressed as 16:00 UTC (sixteen hours, zero minutes).
Conversions of UTC: Mountain Standard (Tucson) + 7 hours Eastern Standard (Washington DC) + 5 hours
CAUTION: Keep your computer set to local time, AmaSeis makes the necessary adjustment based on your time zone setting.
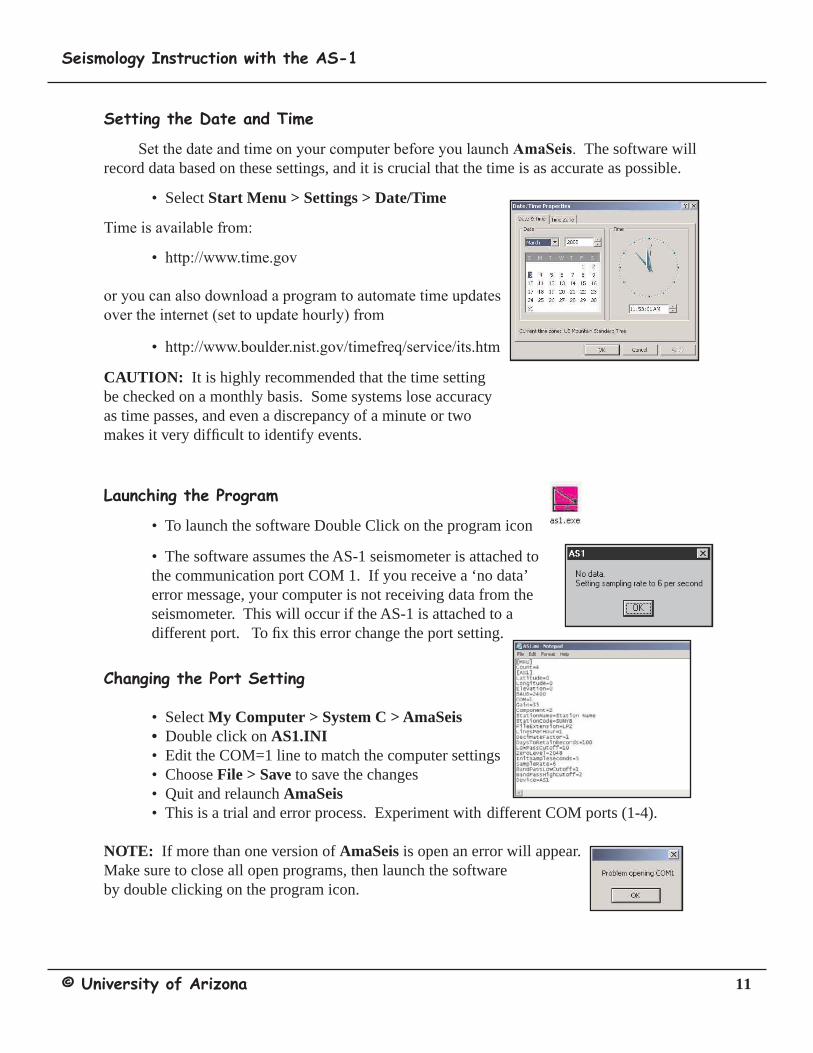
Setting the Date and Time
Set the date and time on your computer before you launch AmaSeis. The software will record data based on these settings, and it is crucial that the time is as accurate as possible.
• Select Start Menu > Settings > Date/Time
Time is available from:
• http://www.time.gov
• http://www.boulder.nist.gov/timefreq/service/its.htm
Launching the Program
• To launch the software Double Click on the program icon
Changing the Port Setting
• Select My Computer > System C > AmaSeis • Double click on AS1.INI • Edit the COM=1 line to match the computer settings • Choose File > Save to save the changes • Quit and relaunch AmaSeis • This is a trial and error process. Experiment with different COM ports (1-4).
NOTE: If more than one version of AmaSeis is open an error will appear. Make sure to close all open programs, then launch the softwareby double clicking on the program icon.
Seismology Instruction with the AS-1
11 © University of Arizona
• The software assumes the AS-1 seismometer is attached to the communication port COM 1. If you receive a ‘no data’ error message, your computer is not receiving data from the seismometer. This will occur if the AS-1 is attached to a different port. To fi x this error change the port setting.
CAUTION: It is highly recommended that the time setting be checked on a monthly basis. Some systems lose accuracy as time passes, and even a discrepancy of a minute or two makes it very diffi cult to identify events.
or you can also download a program to automate time updates over the internet (set to update hourly) from

Seismology Instruction with the AS-1
12 © University of Arizona
Launching the Program
• To launch the software double click on the program icon
• An introductory screen will display for approximately 5 seconds. After that time, the helicorder screen will appear. On the fi rst launch of the software, the station parameters need to be set.
Setting Station Parameters
• From the Menu Bar choose Settings > Station
• To determine the latitude and longitude of your school consult a topographic map or online at http://terraserver.homeadvisor.msn.com
• Once the station properties have been entered, this information is stored and does not need to be entered again.
Finding the Trace
• From the Menu Bar choose Settings > Helicorder
• Set the Gain to 25
• Edit the station properties
- Station Name - Latitude - Longitude - Elevation - Station Code This is assigned to the instrument by the network administrator contact: [email protected] - Component The AS-1 is a vertical component instrument
• The trace will now be drawn on the screen, and it may be visible. Or, more commonly, it is recording off the screen. Slowly move the potentiometer (black knob) on the AS-1 interface box until the trace is visible approximately at the center of the screen.

Centering the Trace
The trace is the actual recording of the seismometer. Each line on the screen represents one hour, so the trace moves slowly. The trace for the current hour should be displayed on the bottom line on the screen. Sometimes the trace is not centered on its hour line. To center the trace:
• From the File Menu choose Settings > Set Zero Level
Instrument Settings
• From the File Menu choose Settings > Helicorder
If you change the lines per hour setting to 3, one hour of recording will take up three lines and 8 hours of recording will be seen on one screen rather than 24 hours. The value can be increased up to 60 to show details of the waveforms. This can be useful for in-class testing and demonstrations.
• Gain This setting adjusts the amplifi cation of the signal and varies with the location of the seismometer. Choose a gain setting such that the background noise is just visible. For example, there is always a little bit of up and down movement of the trace. A values between 25-50 is suggested. If the trace is too noisy, adjust the gain to a lower value.
• Low pass fi lter cutoff Set to 3 Hz.
• Days to retain records This setting controls how many days are available to scroll back through when looking for events. All data will be stored by the system until it is deleted by the user, this setting just controls how much is available to display.
• Decimate Factor This setting controls the number of plotted points when the trace is redrawn, but it does not affect the quality of the recording. Leave this setting at the default setting of 1.
• Lines Per Hour The display can show anywhere between 1 and 24 hours of data on the screen. This value defaults to 1, which means that the width of the screen represents one hour. The data for one day is contained on one screen, this can be useful in searching
Seismology Instruction with the AS-1
13 © University of Arizona
• To shift the trace down to the correct hour line increase the value in the Set Zero Level pop-up window. Large jumps to the bottom of the screen require shifts in the 100s; fi ne-tuning of the trace positions requires shifts of less than 20.

Congratulations!
By reaching this point, your seismometer is accurately recording and will store any events that it is able to detect. The AmaSeis program needs to be running at all times in order to collect data, however the display window can be minimized and the program will still record.
Helicorder Screen Overview
• The date is posted on the 00 hour line. The scroll bar along the right side of the window can be used to scroll back through the earlier recorded data.
• The sampling rate is shown near the top left of the screen and is the data per second that are sent from the seismometer to the computer. It should be a number between 6.1 and 6.2 samples per second for the AS-1. This rate is determined when the introduction screen is visible, by counting the number of data points that arrive in 5 seconds.
Seismology Instruction with the AS-1
14 © University of Arizona
The window that appears when the program is launched is called the helicorder screen. The recording emulates what appears on a drum recorder.
• Using default settings each horizontal line represents an hour. The current time (UTC) is found in the bottom left corner of the screen. The trace should be recording along the bottom hour line.
Current Time (UTC)
Hours (y-axis)
Minutes (x-axis)
Sampling RateScroll Bar
Date
Menu Bar

Seismology Instruction with the AS-1
15 © University of Arizona
Saving an Event
• From the helicorder screen highlight an event by holding down the left mouse button and scrolling over the event
• Click the extract icon below the Menu Bar
This will open the Extract Event Screen
• To save the data in a fi le select File > Save As
• In the upper left corner of the Save As Dialog Box name the fi le (change the * in front of .sac to your fi lename). Please use the following naming convention: two digit year, two digit month, two digit day, two digit hour, station code (yymmddhhstcode)
Example: Tempe High School (thaz)recorded an event at 19:30 on June 23, 2001 01062319thaz.sac
• In the bottom left hand corner, set the File Type to SAC
• Send us your event! You can upload the SAC fi le through your internet browser at http://www.geo.arizona.edu/geoed/spinet
Printing an Event
• From the Extract Event screen click on the print icon or from the Menu Bar choose File > Print
• At the Print Dialog Box click on Properties
• Set the Orientation to Landscape, Click OK
• Click the OK button

Extract Event Screen Overview
The highlighted portion of the trace is displayed in this window.
• Time Expansion expands the x axis. For example, when the time expansion is 2, the time axis is doubled in length allowing you to zoom in. In this case only the fi rst half of the waveform is displayed. To see more of the waveform use the scroll bar at the bottom of the screen.
• Load a previously saved event using the Open Icon.
• The Pick Arrivals Icon is used to mark wave arrivals. For regional events it is sometimes easier to mark the P wave and Surface wave arrivals. For global events, mark the P and S wave arrivals.
• The Travel Time Curves Icon is used to determine the distance from the event to your station using the time delay between wave arrivals.
Seismology Instruction with the AS-1
16 © University of Arizona
Time Expansion
Amplitude (y-axis)
Minutes (x-axis)
Event Information
Return to Helicorder Screen
Menu Bar
Open
Seismology Instruction with the AS-1
17 © University of Arizona
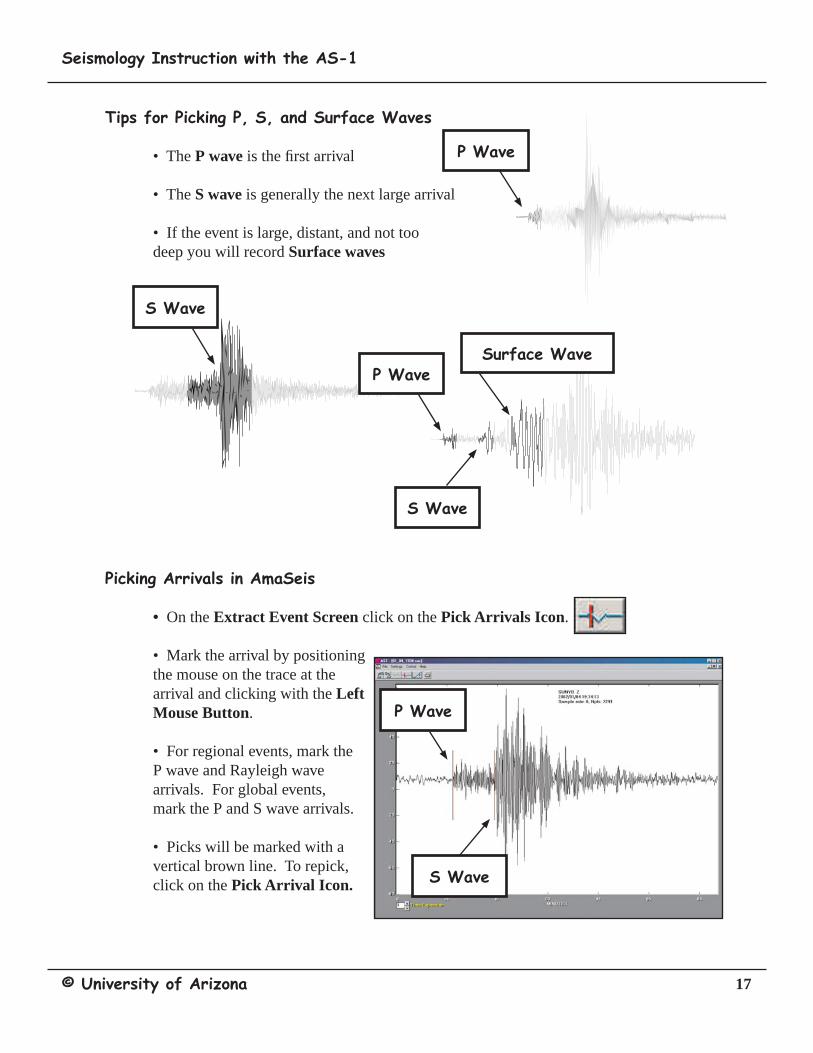
Tips for Picking P, S, and Surface Waves
• The P wave is the fi rst arrival
• The S wave is generally the next large arrival
• If the event is large, distant, and not too deep you will record Surface waves
Picking Arrivals in AmaSeis
• On the Extract Event Screen click on the Pick Arrivals Icon .
• Mark the arrival by positioning the mouse on the trace at the arrival and clicking with the Left Mouse Button.
• For regional events, mark the P wave and Rayleigh wave arrivals. For global events, mark the P and S wave arrivals.
• Picks will be marked with a vertical brown line. To repick, click on the Pick Arrival Icon.
P Wave
Surface Wave
S Wave
P Wave
S Wave
S Wave
P Wave

18 © University of Arizona
Using the Travel Time Curve
• After picking arrivals in the Extract Event Screen click on the Travel Time Curve Icon
• Using the Mouse, drag the trace up or down along the vertical axis to align the Arrival Picks with the corresponding Phase Arrival Lines.
• Once the record is aligned with the travel time curve, the distance to the event is reported on the left under the trace.
• The distance is reported in degrees. To convert from degrees to kilometers: 1 degree = 111 kilometers
Seismology Instruction with the AS-1
Distance
Phase Arrivals
Seismology Instruction with the AS-1
19 © University of Arizona
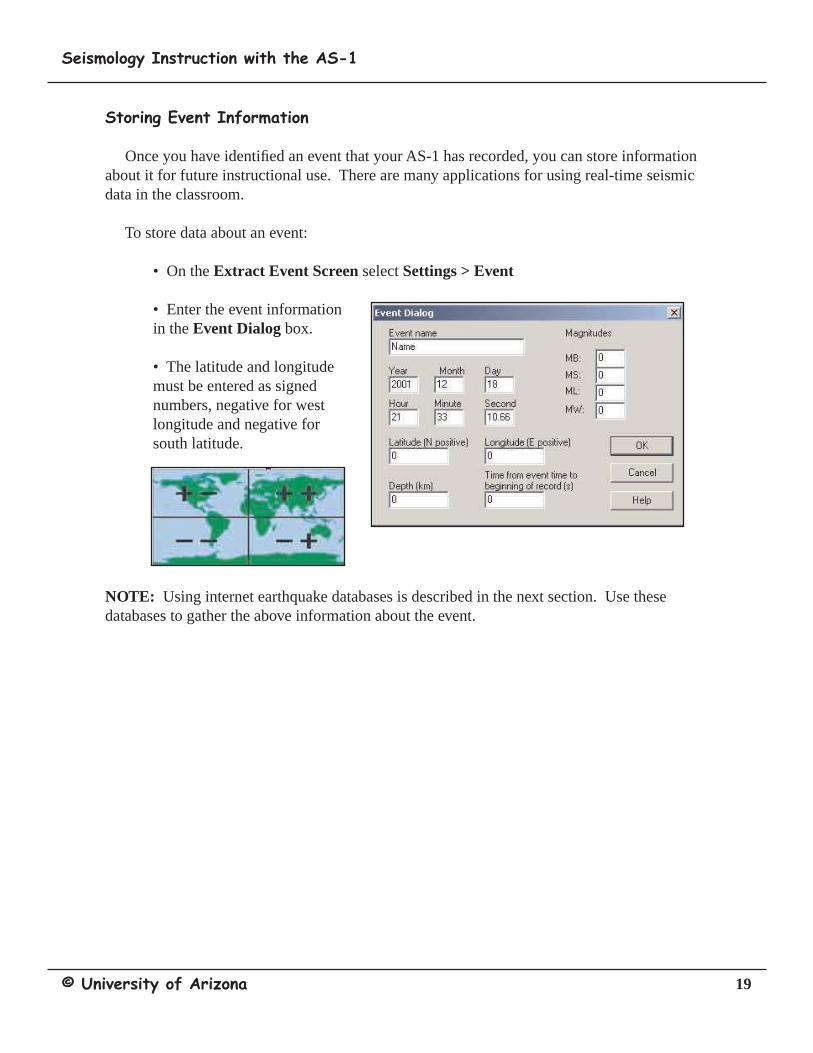
Storing Event Information
Once you have identifi ed an event that your AS-1 has recorded, you can store information about it for future instructional use. There are many applications for using real-time seismic data in the classroom.
To store data about an event:
• On the Extract Event Screen select Settings > Event
• Enter the event information in the Event Dialog box.
• The latitude and longitude must be entered as signed numbers, negative for west longitude and negative for south latitude.
NOTE: Using internet earthquake databases is described in the next section. Use these databases to gather the above information about the event.

Seismology Instruction with the AS-1
20 © University of Arizona
Data Identifi cation and Event Location
Searching for Current Events in NEIC (National Earthquake Information Center)
• Launch your browser and go to: http://wwwneic.cr.usgs.gov
• Select Near Real Time Earthquake List • The 20 most recent events will be displayed
Searching for events from the last month:
• Scroll down and click on Last 30 Days of Earthquake Activity
Searching with NEIC • Launch your browser and go to http://wwwneic.cr.usgs.gov
• Select Earthquake Search. • Scroll down and select Global Search Area.
• Use the default selection for the Output File Type and Database.
• In the Optional Search Parameters fi ll in a date range to narrow down the records. It is not necessary to fi ll in all the fi elds. NOTE: If you enter a minimum magnitude, the site requires a value for the maximum magnitude.
• Click on Submit Search
Site Output: When the search is complete, you will see a table of data in your browser window.
Month
Day Time
Latitude Longitude
Depth MagnitudeCatalogue
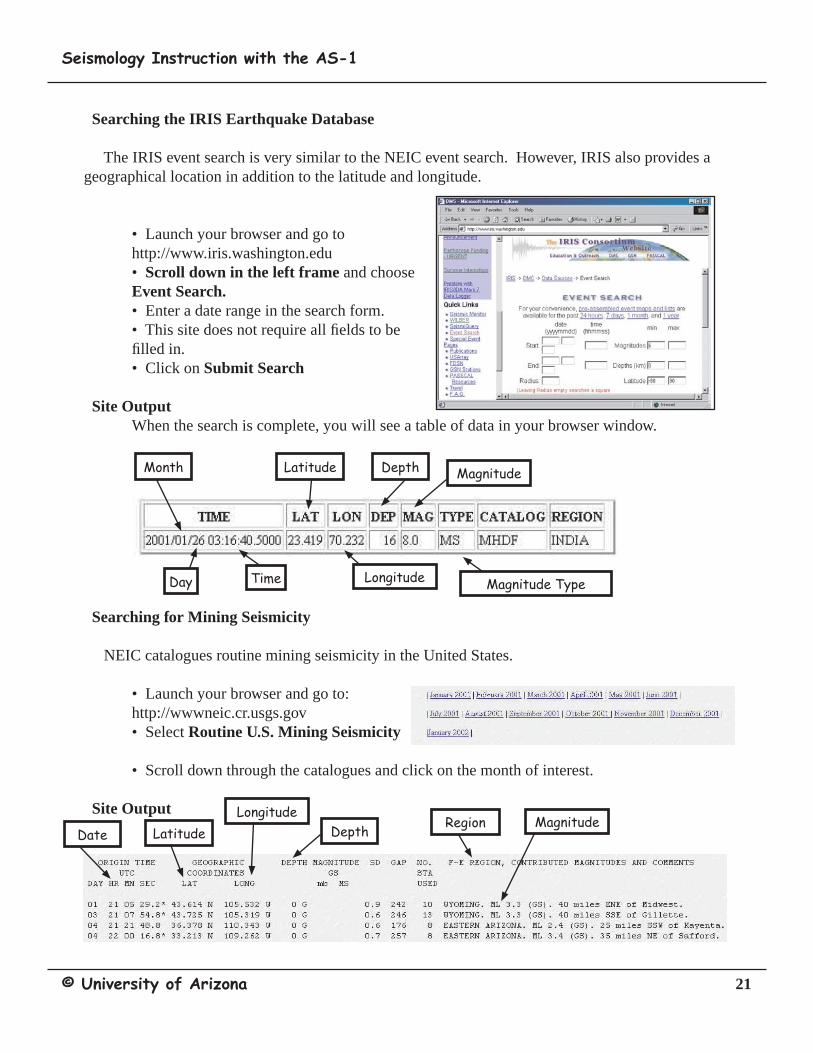
Searching the IRIS Earthquake Database
The IRIS event search is very similar to the NEIC event search. However, IRIS also provides a geographical location in addition to the latitude and longitude.
• Launch your browser and go to http://www.iris.washington.edu • Scroll down in the left frame and choose Event Search. • Enter a date range in the search form. • This site does not require all fi elds to be fi lled in. • Click on Submit Search
Site Output When the search is complete, you will see a table of data in your browser window.
Searching for Mining Seismicity
NEIC catalogues routine mining seismicity in the United States.
• Launch your browser and go to: http://wwwneic.cr.usgs.gov • Select Routine U.S. Mining Seismicity
• Scroll down through the catalogues and click on the month of interest.
Site Output
Month
Day Time
Latitude
Longitude
Depth Magnitude
Date LatitudeLongitude
DepthMagnitudeRegion
Seismology Instruction with the AS-1
21 © University of Arizona
Magnitude Type

Filtering
Local and regional event (less than 10 degrees distance) earthquake seismograms are usually dominated by short period (near 1 s period) energy. Teleseismic (distant earthquakes, 10 to 180 degrees) recordings usually consist of lower frequency (longer period) energy and often have prominent surface wave arrivals of 12 - 30 s period. The AS-1 seismometer has a natural period of oscillation of about 1 s. To make the seismometer more useful for recording distant earthquakes, the long period (greater than 10 s) response of the instrument is enhanced. Because background noise is always present, fi ltering of the records is often desirable to enhance the earthquake signals.
Local and Regional Events • In the Extract Event Screen, from the File Menu Bar select Settings > Filter
• A useful fi lter is a bandpass fi lter with frequency cutoffs of 0.5 Hz and 3 Hz (isolating the short period energy: 2 s - .333 s period).
• Enter the two frequencies in the Filter Dialog Box.
Global Events
For teleseismic or distant earthquakes, lower frequency fi ltering often enhances the seismogram, especially the surface wave arrivals that are prominent for shallow focal depth (0 - 70 km) earthquakes.
• In the Extract Event Screen, from the File Menu Bar select Settings > Filter
• Suggested fi lter cutoffs for lower frequency (longer period) signal enhancement are 0.0001 Hz and 0.1 Hz (isolating the longer period energy: 10,000 s - 10 s period).
• Enter the two frequencies in the Filter Dialog Box.
Default Low Pass Filter
• AmaSeis’s default low pass fi lter is a display fi lter that removes high frequency noise. We recommend that this be set to 3 Hz.
Seismology Instruction with the AS-1
22 © University of Arizona

Seismology Instruction with the AS-1
23 © University of Arizona
Acknowledgements
Assistance for production of the manual has been provided by IRIS as part of their Seismographs in Schools Program
We would like to thank Dr. Michelle Hall-Wallace and Dr. Terry Wallace for their guidance on this project
If you have questions or comments about this manual please email: [email protected]
Additional Resources and Information
AmaSeis Updates
• http://www.geol.bingamton.edu/faculty/jones/as1.html
Identifying Earthquakes or Mining Seismicity
• http://wwwneic.cr.usgs.gov
• http://www.iris.washington.edu
Web Sites for Information and Curriculum Resources
• http://www.eas.purdue.edu/~braile/
• http://www.geo.arizona.edu/geoed/spinet
Time
• http://www.time.gov
• http://www.boulder.nist.gov/timefreq/service/its.htm
Latitude and Longitude
• http://terraserver.homeadvisor.msn.com
California Earthquake Information
• http://www.scec.org/earthquakes/ (select Recent California Earthquakes)