selection criteria for left-turn phasing and indication...
TRANSCRIPT
TRANSPORTATION RESEARCH RECORD 1421 11
Selection Criteria for Left-Turn Phasing and Indication Sequence
SETH A. ASANTE, SrAMAK A. ARDEKANI, AND JAMES C. WILLIAMS
The development of guidelines and recommendations for the selection of left-tum phasing and indication sequences at signalized intersections is documented in this paper. The guidelines developed are based on field studies and use easy-to-obtain data for the selection process. A simple three-level decision process regarding the most suitable left-tum phasing treatment to be used is established. The process favors the least restrictive permissive left-tum phase unless traffic and geometric conditions warrant the more restrictive protected/permissive or protected-only phasings. These guidelines are based on threshold values designed to determine what constitutes an excessive value for any particular variable, beyond which more restrictive left-tum phasing treatments may be justified. The guidelines developed also reflect a selection process that recognizes the trade-off between operational efficiency and safety. The study shows that selection of a particular phase is a multiobjective process involving a number of factors, and in many cases more than one condition must be met to justify the selection of a particular phase that will ensure an optimal solution.
Selection of the appropriate left-tum signal treatment at a signalized intersection involves many options of phase type and phasing sequence. Meanwhile, no comprehensive guidelines have been developed to assist traffic engineers in this task. Existing guidelines are inadequate, and the engineer has to rely on experience or try different treatments until a suitable one is found. Comprehensive guidelines are needed for the selection of the appropriate combination of signal phase pattern and phasing sequence at a signalized intersection. Substantial gains in efficiency and safety of left-turn operations, as well as reductions in fuel consumption and emissions, can be achieved through the implementation of appropriate left-turn signal treatments.
OBJECTIVE
The objective of this study is to develop guidelines for the selection of an appropriate left-turn phase pattern and phasing sequence for a signalized intersection. The phasing patterns considered include protected only, protected/permissive, permissive only, and Dallas phasing. Once a phasing pattern is selected, a decision must be made on the appropriate phasing sequence to be used. Depending on the phasing pattern selected, leading, lagging, or a leading/lagging sequence may be applicable. Phase overlaps are also possible for protectedonly and protected/permissive phases. Dallas phasing, which
Civil Engineering Department, University of Texas at Arlington, P.O. Box 19308, Arlington, Tex. 76019.
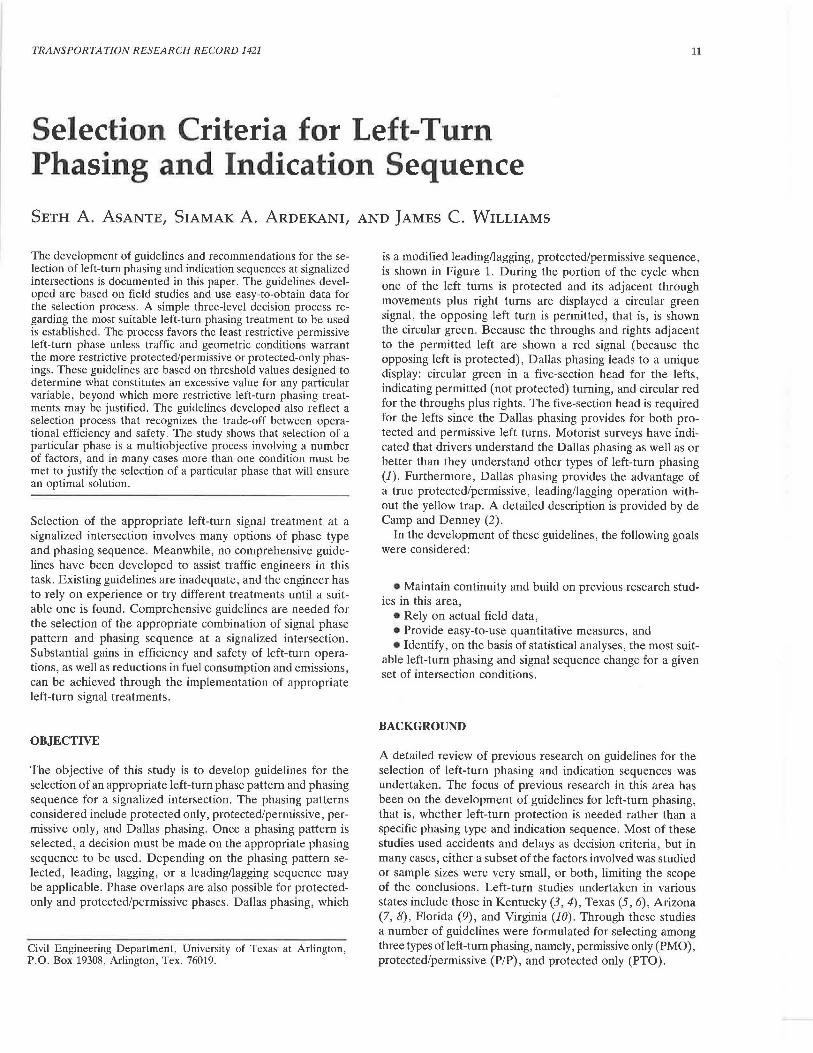
is a modified leading/lagging, protected/permissive sequence, is shown in Figure 1. During the portion of the cycle when one of the left turns is protected and its adjacent through movements plus right turns are displayed a circular green signal, the opposing left turn is permitted, that is, is shown the circular green. Because the throughs and rights adjacent to the permitted left are shown a red signal (because the opposing left is protected), Dallas phasing leads to a unique display: circular green in a five-section head for the lefts, indicating permitted (not protected) turning, and circular red for the throughs plus rights. The five-section head is required for the lefts since the Dallas phasing provides for both protected and permissive left turns. Motorist surveys have indicated that drivers understand the Dallas phasing as well as or better than they understand other types of left-turn phasing (J). Furthermore, Dallas phasing provides the advantage of a true protected/permissive, leading/lagging operation without the yellow trap. A detailed description is provided by de Camp and Denney (2).
In the development of these guidelines, the following goals were considered:
• Maintain continuity and build on previous research stud-ies in this area,
• Rely on actual field data, • Provide easy-to-use quantitative measures, and • Identify, on the basis of statistical analyses, the most suit
able left-turn phasing and signal sequence change for a given set of intersection conditions.
BACKGROUND
A detailed review of previous research on guidelines for the selection of left-turn phasing and indication sequences was undertaken. The focus of previous research in this area has been on the development of guidelines for left-tum phasing, that is, whether left-turn protection is needed rather than a specific phasing type and indication sequence. Most of these studies used accidents and delays as decision criteria, but in many cases, either a subset of the factors involved was studied or sample sizes were very small, or both, limiting the scope of the conclusions. Left-turn studies undertaken in various states include those in Kentucky (3, 4), Texas (5, 6), Arizona (7, 8), Florida (9), and Virginia (JO). Through these studies a number of guidelines were formulated for selecting among three types ofleft-turn phasing, namely, permissive only (PMO), protected/permissive (P/P), and protected only (PTO).
12
LEGEND
Protected Left-Turn
Permissive Left-Turn
' t i···-=··
\ __ ~
FIGURE 1 Dallas phasing.
STUDY APPROACH
Data were collected from over 100 sites in nine counties across Texas, incorporating a variety of population characteristics. Other site selection parameters included intersection geometry, approach speeds, and signal phasing types and sequences. Such diversification also led to a reduction in coverage error and incorporation of local left-turn signalization policies. The nine counties studied were Bexar, Cameron, Dallas, Ector, Harris, Lubbock, Nueces, Tarrant, and Travis.
In each county, 216 possible intersection approach combinations were considered. These included combinations of six opposing speed limits, 50 to 90 km/hr in 8-km/hr increments (30 to 55 mph in 5-mph increments); three opposing lanes (one, two, and three); two left-turn lanes (one and two); and six phase patterns (leading protected only, lagging protected only, leading protected/permissive, lagging protected/ permissive, permissive only, and Dallas phasing). In fact, these
TRANSPORTATION RESEARCH RECORD 1421
216 approaches represent the upper bound and not the actual nurnber of sites studied, as some combinations did not exist or were not found. The selections were made from lists of intersections supplied by the city and county transportation offices in the counties under study. The intersections selected have little or no pedestrian traffic and exclusive left-turn lanes on the study approaches. The number of intersections and approaches studied within each county is shown in Table 1.
DATA COLLECTION AND REDUCTION
Traffic, geometric, and delay data were collected at all the intersections selected for the study. The objective of this field delay study was to compare the results with the most commonly used delay models (11) and make adjustments in the model parameters if necessary. All approaches were studied on weekdays during one of the following peak periods: a.m. (7:00 to 8:30 a.m.), noon (12:00to1:00 p.m.), and p.m. (4:30 to 6:00 p.m.). One hour of continuous video recording of the approaches of interest was made at each site. Depending on the number of approaches under study at each intersection, one or two video cameras were used. Available sight distance was also determined at all approaches that had potentially restricted sight distance.
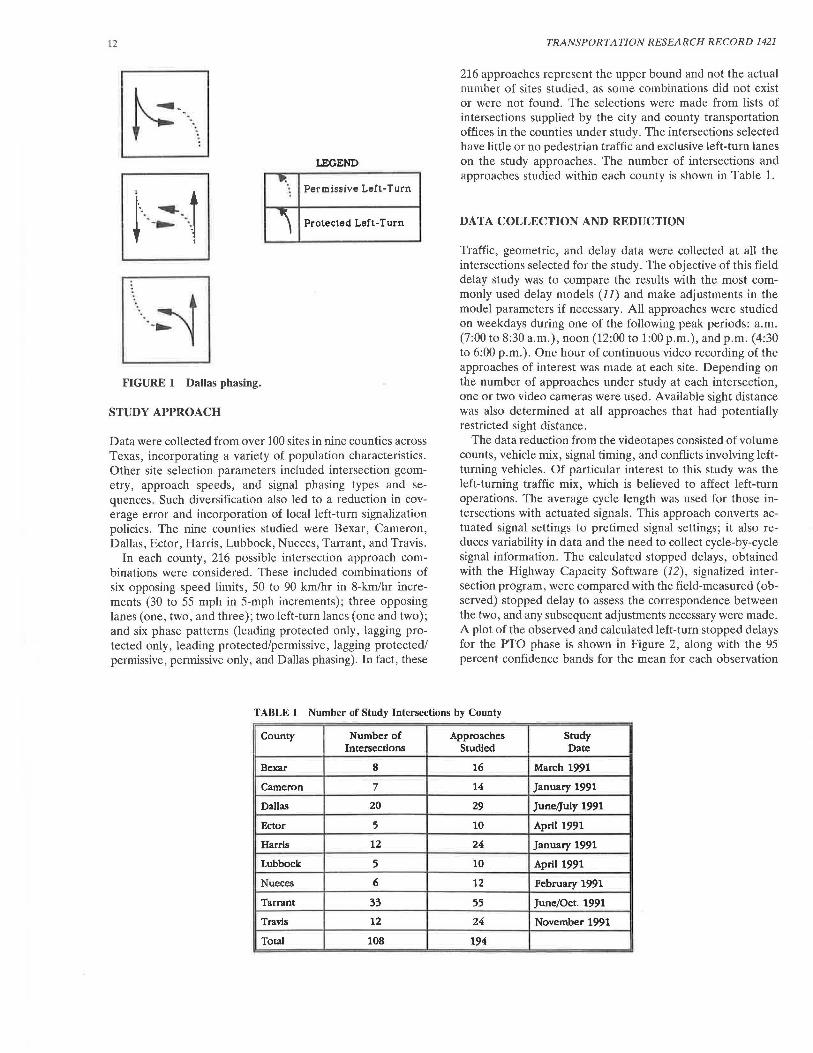
The data reduction from the videotapes consisted of volume counts, vehicle mix, signal timing, and conflicts involving leftturning vehicles. Of particular interest to this study was the left-turning traffic mix, which is believed to affect left-turn operations. The average cycle length was used for those intersections with actuated signals. This approach converts actuated signal settings to pretimed signal settings; it also reduces variability in data and the need to collect cycle-by-cycle signal information. The calculated stopped delays, obtained with the Highway Capacity Software (12), signalized intersection program, were compared with the field-measured (observed) stopped delay to assess the correspondence between the two, and any subsequent adjustments necessary were made. A plot of the observed and calculated left-turn stopped delays for the PTO phase is shown in Figure 2, along with the 95 percent confidence bands for the mean for each observation
TABLE 1 Number of Study Intersections by County
County Number of Approaches Study Intersections Studied Date
Bexar 8 16 March 1991
Cameron 7 14 January 1991
Dallas 20 29 June,july 1991
Ector 5 10 April 1991
Harris 12 24 January 1991
Lubbock 5 10 April 1991
Nueces 6 12 February 1991
Tarrant 33 55 June/Oct. 1991
Travis 12 24 November 1991
Total 108 194
Asante et al.
140~~~~~~~~~~~~~~~~~
120 £ w > 0'100 w (/) ~
>-- 80 j w Cl
.. ·······
o +-~-.-~~.--~-.-~~.......,~-.-~......,.~..._.....
0 20 40 60 80 100 120 140
OBSERVED DELAY (SEC/VEH)
FIGURE 2 Observed and calculated left-turn stopped delays for PTO phase.
(dashed lines). The parameter estimates are presented in Table 2. From the hypothesis tests (Table 2), the slopes (~ 1 ) do not significantly differ from 1. Likewise, the intercepts (~0) do not significantly differ from zero. The observed and calculated delays were in good statistical agreement, as indicated by the parameter estimates and the hypothesis tests. The intercept for the PTO phasings was, however, slightly above zero. The Highway Capacity Manual (11) model was therefore used to estimate the stopped delays.
ACCIDENT STUDIES
To assess the safety aspects of the various phasing treatments, 42 intersections were selected for accident studies. Accident records for those intersections were obtained from the Texas Department of Transportation (TxDOT) and the transportation departments of the cities of Arlington, Dallas, and Fort Worth. The TxDOT records represent three successive years
13
from 1988 through 1990, and the remaining records are for 1989 through 1991. Signal timings, phasing, and geometric history of the intersections involved were also obtained from the city transportation departments to ensure that no major geometric or signalization changes had taken place that might have influenced accidents. Only accidents involving left turns were extracted for analysis. Accident totals rather than rates were used in the study because of their availability and ease of application. Accident rates tend to be biased, with lowvolume approaches having higher rates and vice versa. Another problem with using rates is measurement of exposure, since both left-turn and opposing-traffic volumes can influence the number of accidents. In addition, traffic volume data were for only one peak hour.
The average number of left-turn accidents for the various phases and sequences is shown in Table 3. Aside from phasing patterns, a number of other factors, such as intersection geometry, traffic volume, and weather conditions, affect leftturn accidents and could account for the large standard deviations observed. However, on average, PIP approaches have significantly higher left-turn accident totals (a = 0.10) than PTO approaches. Higher left-turn accident rates at PIP approaches have also been reported by Agent ( 4) and Upchurch (7). The low left-turn accident totals for PMO approaches stem from the fact that they are generally low-volume intersections and were not problematic; otherwise, they would have likely been corrected by providing some form of left. turn protection.
The safety of leading and lagging sequences, as measured through the number of accidents, is not significantly different (see Table 3). However, leading sequences are likely to have higher left-turn accident totals, as indicated by their large variance (although an F-test showed the variances not to be significantly different in this case). Hummer et al. (13) have also reported higher left-turn accidents for approaches with leading as compared with lagging sequences. However, Lee et al. (8) found no significant difference between leading and lagging operations.
The focus of the accident analysis was to establish what constitutes an excessive number of left-turn accidents for a PIP phasing treatment. The 85th-percentile accident numbers were selected as a criterion. The 85th-percentile, 3-year, leftturn accident total was eight for PIP approaches and six for PTO approaches. PTO phases also had smaller variance com-
TABLE 2 Estimates and Tests of Hypotheses for Intercepts and Slopes of the Phase Patterns
Phase Pattern Parameter Estimate Std. Error R2 Hypothesis P-value
Po 6.60 2.860 Ho: Po= 0 0.02' Protected Only p, 0.86 0.073
0.59 Ho: p, = 1 0.07
Po -2.05 1.570 Ho: P0 = 0 0.20 Protected/Permissive p, 0.96 0.053
0.86 Ho: p, = 1 0.47
Po -1.65 2.100 Ho: Po= 0 0.44 Permissive Only p, 0.93 0.100
0.76 Ho: p, = 1 0.51
Po 0.34 1.427 Ho: P0 = 0 0.81 All Phases (pooled) p, 0.98 0.042
0.75 Ho: p, = 1 0.58
• Significant at a = 0.05.
14 TRANSPORTATION RESEARCH RECORD 1421
TABLE 3 Three-Year Left-Turn Accident Totals for Left-Turn Phasing Types and Sequences
Phase Pattern
Protected Only
Protected/Permissive
Dallas Phasing
Permissive Only
Leading Sequence
Lagging Sequence
Mean Value
2.57
3.69
2.92
1.27
2.9
2.8
Standard 85 Percentile Number of Deviation Value Approaches
3.16 5.73 77
3.96 7.65 36
4.60 7.52 18
1.66 2.93 26
3.50 6.40 102•
2.90 5.70 11·
•These approaches are lhe same as lhose listed in lhe first 2 rows of table.
pared with PIP treatments (Table 3). The 85th percentile was selected because it represents the mean plus one standard deviation, a commonly used level of confidence.
CONFLICTS
Conflict analysis can also be a powerful tool in determining the relative safety of intersections. Many latent risk factors at intersections are not reflected in accident records and can only be identified through conflict studies. Many left-turn conflicts of the near-miss type do not result in accidents and hence are not recorded. The left-turn conflict rate (C"} was determined from videotapes. The elapsed time from the start of each study period to the occurrence of the first conflict was used as a surrogate variable to determine the conflict rate. Where no conflict was observed during the 1-hr observation period, a time value of 60 min was used. The left-turn conflict rate is then calculated as
II (1)
where
C1t = number of conflicts ·per million [vehicles per hour (vph)/lane]2,
N1, = number of left-turn lanes, N0 P = number of opposing lanes, vlt = left-turn volume (vph},
vop = opposing volume (vph), and T = time to first conflict (min).
The four left-turn conflict types used in this study are
Type 1. Left-turn vehicle causing the opposing vehicle to brake or weave to avoid collision,
Type 2. The second through vehicle in the opposing path also having to take an evasive action,
Type 3. Vehicles entering the intersection on the green or yellow and turning left on the red, and
Type 4. Rear-end conflict in the left-turn lane.
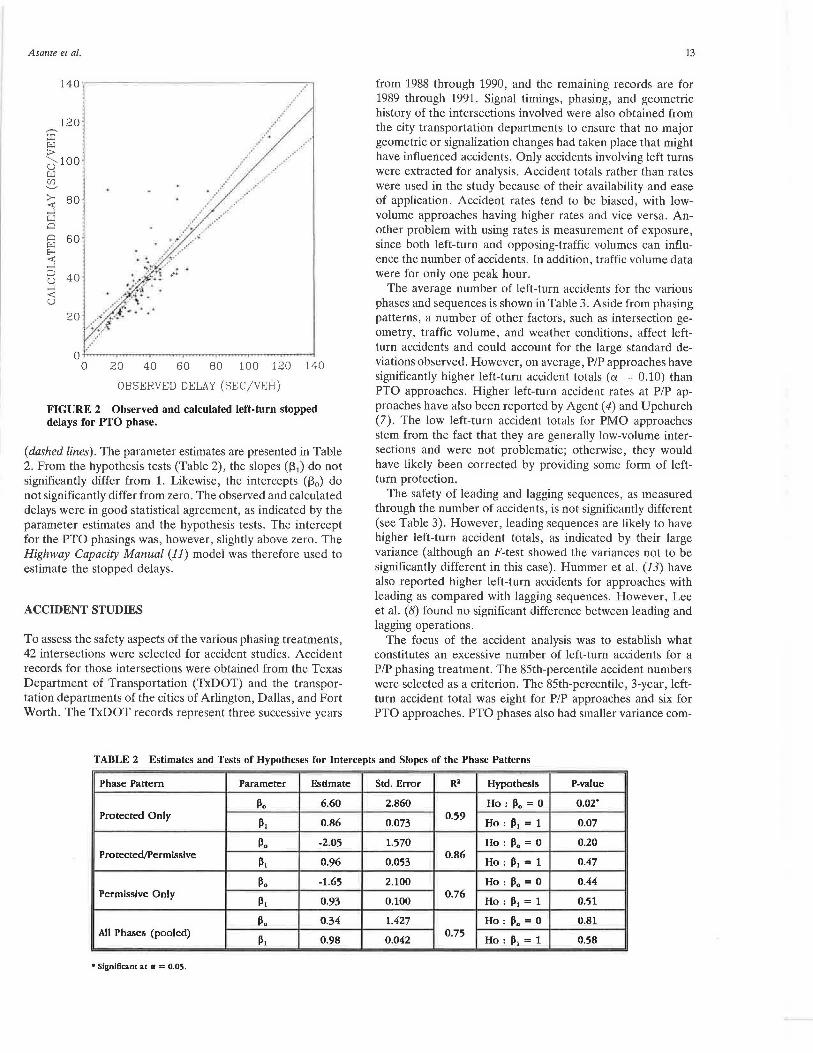
The conflict study results are shown in Table 4. It can be seen that the lagging sequences have a significantly lower conflict rate (a = 0.04). This was not clearly evident in the accident data analysis as reported in Table 3. The conflict studies do confirm the inference made from the accident studies that lagging sequences are safer than leading sequences. As shown in Figure 3, conflicts at PIP approaches with more
TABLE 4 Conflict Rates in Conflicts per Million (vehicles per hour per lane)2 for Left-Turn Phasing Types and Sequences
Phase Mean Standard 85 Percentile Number of Pattern Value Deviation Value Approaches
Protected Only 116 146 262 62
Protected/Permissive 176 272 448 47
Dallas Phasing 161 152 313 10
Permissive Only 914 1130 2044 36
Leading Sequence 156 230 386 86•
Lagging Sequence 90 101 191 23•
•These approaches are the same as lhose listed in lhe first 2 rows of table.
Asante et al. 15
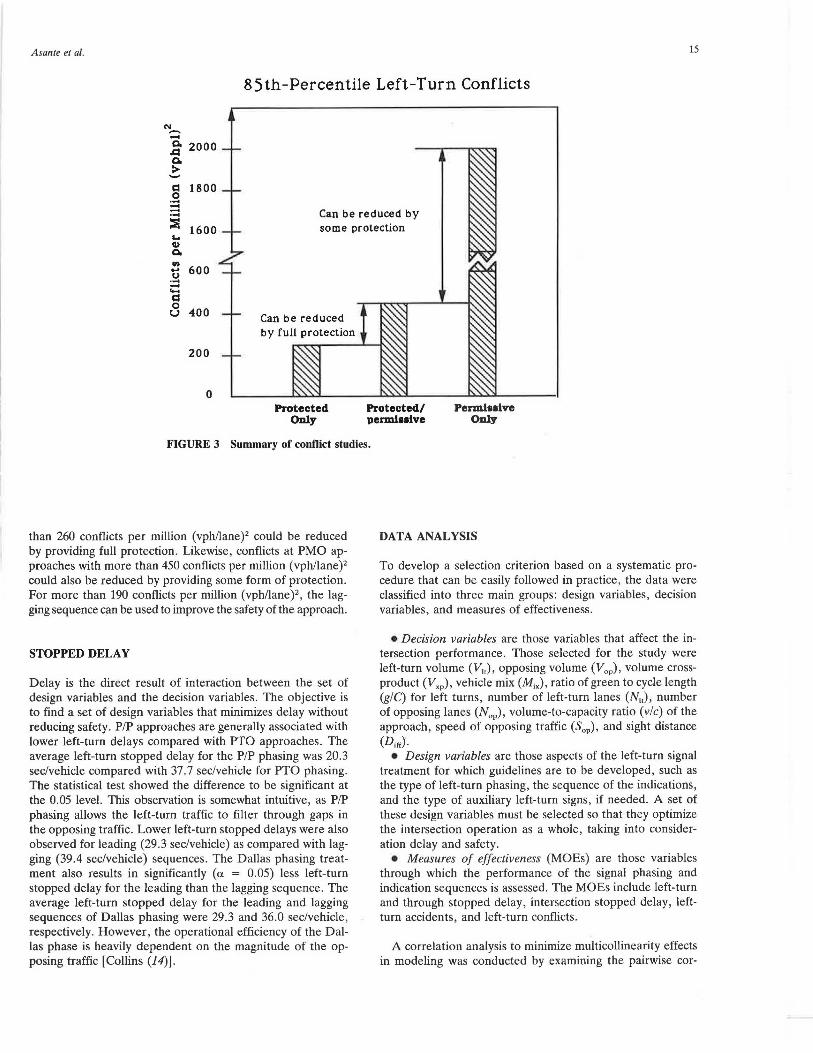
85th-Percentile Left-Turn Conflicts
N.-. -_go 2000 c. > .._... c:I 1800 0 ..... --Si 1600
Can be reduced by some protection ...
G> c. ~ 600 u ..... -...... c:I 8 400
200
0 Protected
Only Protected/ 1>ermi11lve
Penni Hive Only
FIGURE 3 Summary of conOict studies.
than 260 conflicts per million (vph/lane)2 could be reduced by providing full protection. Likewise, conflicts at PMO approaches with more than 450 conflicts per million ( vph/lane )2
could also be reduced by providing some form of protection. For more than 190 conflicts per million (vph/lane)2, the lagging sequence can be used to improve the safety of the approach.
STOPPED DELAY
Delay is the direct result of interaction between the set of design variables and the decision variables. The objective is to find a set of design variables that minimizes delay without reducing safety. P/P approaches are generally associated with lower left-turn delays compared with PTO approaches. The average left-turn stopped delay for the P/P phasing was 20.3 sec/vehicle compared with 37. 7 sec/vehicle for PTO phasing. The statistical test showed the difference to be significant at the 0.05 level. This observation is somewhat intuitive, as PIP phasing allows the left-turn traffic to filter through gaps in the opposing traffic. Lower left-turn stopped delays were also observed for leading (29.3 sec/vehicle) as compared with lagging (39.4 sec/vehicle) sequences. The Dallas phasing treatment also results in significantly (o. = 0.05) less left-turn stopped delay for the leading than the lagging sequence. The average left-turn stopped delay for the leading and lagging sequences of Dallas phasing were 29.3 and 36.0 sec/vehicle, respectively. However, the operational efficiency of the Dallas phase is heavily dependent on the magnitude of the opposing traffic [Collins (14)].
DATA ANALYSIS
To develop a selection criterion based on a systematic procedure that can be easily followed in practice, the data were classified into three main groups: design variables, decision variables, and measures of effectiveness.
• Decision variables are those variables that affect the intersection performance. Those selected for the study were left-turn volume (V1,), opposing volume (V0 P), volume crossproduct (V,p), vehicle mix (Mix), ratio of green to cycle length (g/C) for left turns, number of left-turn lanes (N"), number of opposing lanes (N0 p), volume-to-capacity ratio (vie) of the approach, speed of opposing traffic (S0 P), and sight distance (Diff).
• Design variables are those aspects of the left-turn signal treatment for which guidelines are to be developed, such as the type of left-turn phasing, the sequence of the indications, and the type of auxiliary left-turn signs, if needed. A set of these design variables must be selected so that they optimize the intersection operation as a whole, taking into consideration delay and safety.
• Measures of effectiveness (MOEs) are those variables through which the performance of the signal phasing and indication sequences is assessed. The MOEs include left-turn and through stopped delay, intersection stopped delay, leftturn accidents, and left-turn conflicts.
A correlation analysis to minimize multicollinearity effects in modeling was conducted by examining the pairwise cor-
16
relation among the individual decision variables. The analysis showed no definite trend an1ong any of the decision variables. Similar conclusions were also previously reported by Agent (3) and Upchurch (15).
STATISTICAL ANALYSIS OF DECISION VARIABLES
The statistical analysis addressed a number of decisions regarding the suitability of the left-tum phasing treatment to be used:
•Is a PMO left-tum phase adequate or should left-tum protection (green arrow) be provided?
•If left-tum protection is called for, is a more restrictive PTO phase justified or would the PIP pattern suffice?
•If the PIP phase is prescribed, would a leading operation be sufficient or should a lagging, leading/lagging, or Dallas phasing sequence be provided?
Permissive Versus Some Protection
A probabilistic approach using logistic regression was adopted to address this issue. This approach uses characterizing variables that distinguish one phase type from another. Given a set of decision variables, probability values are associated with the suitability of each phase type. The logistic model (16) is
(2)
ellO + lhXI f ...
P(<!>) =----+ e ll6' JJ1X1 + ... (3)
where
U(P) utility function associated with a set of decision variables (X;),
~0 , ~ 1 model parameters, <!> = phase type, and
P( <!>) = probability of selecting phase type <!>.
Three decision variables were significant in differentiating permissive phasings from those with some protection, namely, left-tum volume, speed limit of the opposing approach, and number of opposing lanes. The maximum likelihood estimates of the parameters in Equation 2 and their standard errors shown in parentheses are
130 = -5.100 (1.79)
13, = 0.705 (0.34)
132 = 0.024 (0.01)
13, = 0.085 (0.05)
The coefficients~., ~2 , and ~3 are associated with the decision variables N0 P, V 1" and S0 P, respectively. All the parameter estimates were statistically significant at the 0.10 level. Since classification is very sensitive to the relative sizes of the two components being classified and always favors classification into the larger group [Hosmer and Lemeshow (17)], a cutoff point of 0.7 was selected for classification to account for the
TRANSPORTATION RESEARCH RECORD 1421
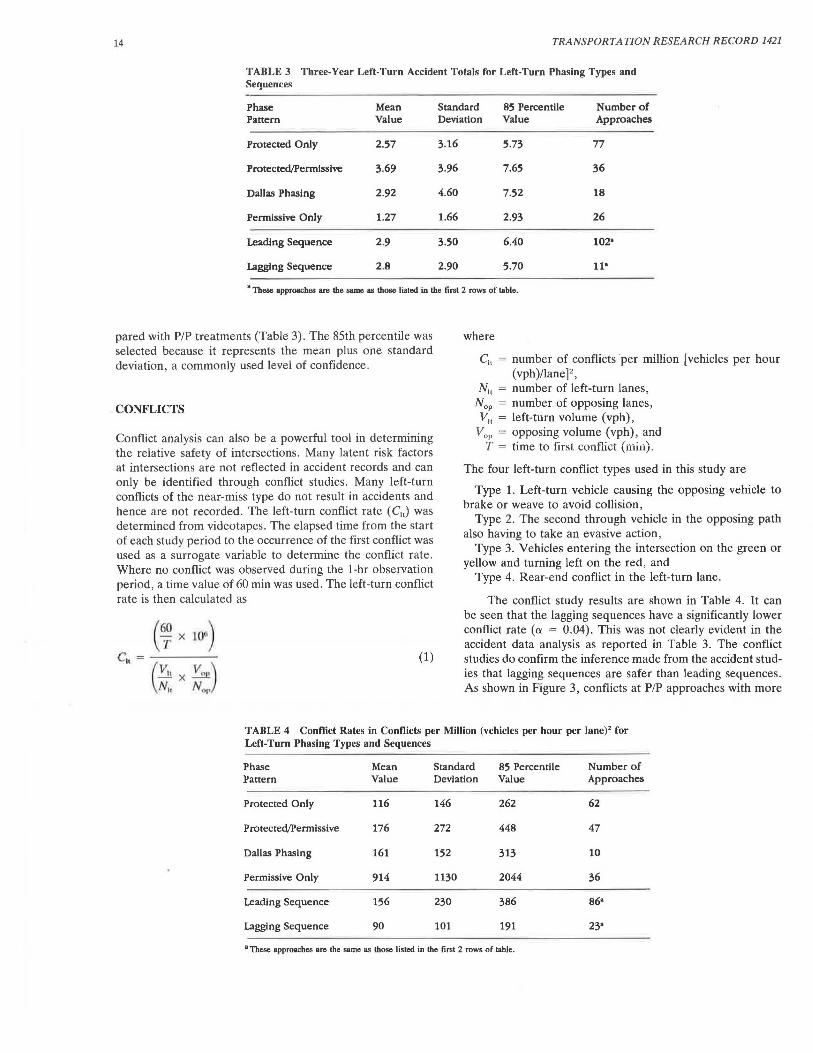
unbalanced data . The positive coefficients for the decision variables indicate preference for some protection for higher values. Using the cutoff point of 0. 7, the corresponding utility value [U(P) = 0.85] is obtained, which yields the following indifference lines:
vlt = 220
v" 190
V1, = 160
3.54 (S0 p) for N0 P
3.54 (S0 p) for N0 P
3.54 (S0 p) for N0 P
1
2
3
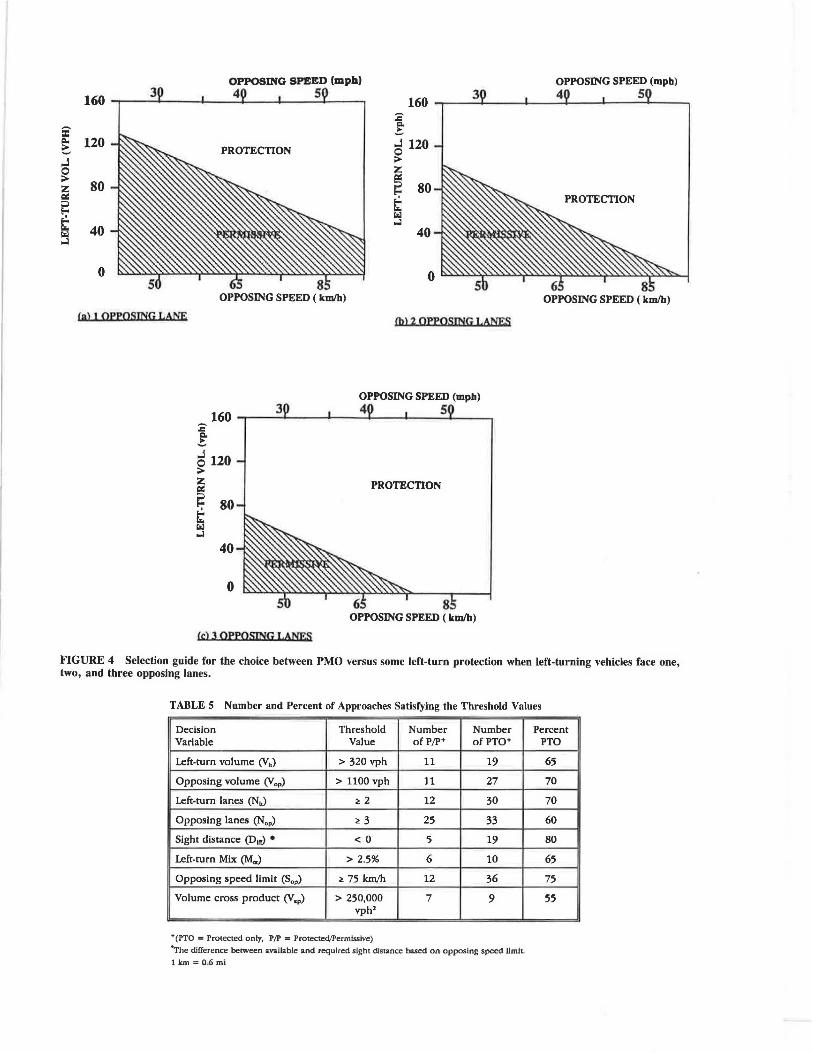
Figure 4 shows the plots of left-tum volume versus speed limit on the opposing approach for one, two, and three opposing lanes, respectively. The lower portion (shaded) indicates preference for PMO operation, and the upper portion (unshaded) signifies the need for some protection.
Protected Only Versus Protected/Permissive
The PTO and PIP phase types display similar characteristics in terms of the decision variables, making the logistic approach ineffective. The analysis approach consists of setting threshold values that could be used as a distinction criterion between the two forms of protective phasings. Threshold values were determined by establishing the 85th-percentile values of each decision variable for the PIP phasings. The number of approaches under each of these two phasing types that meet the threshold values and the percentage of these approaches that have PTO phasing are presented in Table 5. In determining the conditions under which PTO phasing is recommended, all pairwise combinations of the decision variables for which 80 percent or more of the approaches studied had PTO phasings were identified (Table 6).
A sensitivity analysis identified the 80th percentile as the point of diminishing returns for the selection of conditions under which PTO phasing is recommended. The analysis indicated that if a percentile lower than the 80th is used, very few additional conditions for PTO phasings will be added. For example, a 70th- or 75th-percentile cutoff will result in only one added condition for PTO phasing, that is, more than two left-turn lanes. On the other hand, considering a higher value than the 80th percentile will exclude a large number of conditions for which PTO phasing should be recommended. For example, considering the 85th percentile will exclude four of the eight conditions identified under the 80th-percentile criterion, including sight distance, for which PTO phasing should definitely be considered. With the exception of sight distance, two or more conditions are required to justify the use of PTO phasing. The recommended guidelines are presented in the section on summary of guidelines.
Leading or Lagging or Leading/Lagging Phase Pattern
Leading sequences are, from an efficiency standpoint, more desirable since they are associated with lower delays and increased intersection capacity. Lagging sequences, on the other hand, appear to be safer compared with leading sequences. Leading/lagging operation may be implemented for reasons
160 3
= ~ 120 .J 0 > 80 ;z i:i=
~ ~ rilil 40 .J
0
Cal 1 OPPOSING LANE
OPPOSING SPEED (mph) 4 5
160 3
:c c. ~
PROTECTION .J 120 0 > ;z
~ 80
rilil .J
40
8 0
OPPOSING SPEED ( km/h)
£bl 2 QffQ.SWG U.$<i
OPPOSING SPEED (mph) 3 4 5 160 ~-~--.....__...__~ _ ____..________,
:c c. ~
~ 120 > ;z
~ 80
5 .J
40
0
«:> 3 QffQSING I.ANES
PROTECTION
OPPOSING SPEED (mph) 4 5
PROTECTION
FIGURE 4 Selection guide for the choice between PMO versus some left-turn protection when left-turning vehicles face one, two, and three opposing lanes.
TABLE 5 Number and Percent of Approaches Satisfying the Threshold Values
Decision Threshold Number Number Variable Value of PIP+ of PTO+
Left-turn volume (V.) > 320 vph 11 19
Opposing volume (V0 p) > 1100 vph 11 27
Left-turn lanes (N.) ~ 2 12 30
Opposing lanes (N00) ~ 3 25 33
Sight distance (D1n) • < 0 5 19
Left-turn Mix (Mi.) > 2.5% 6 10
Opposing speed limit (S0 p) ~ 75 km/h 12 36
Volume cross product (V,p) > 250,000 7 9 vph2
•(PTO =Protected only, PIP = Protectec1/Permissive)
•The difference between awllable and required sight distance based on opposing speed Umlt.
1km=0.6 mi
Percent PTO
65
70
70
60
80
65
75
55
18 TRANSPORTATION RESEARCH RECORD 1421
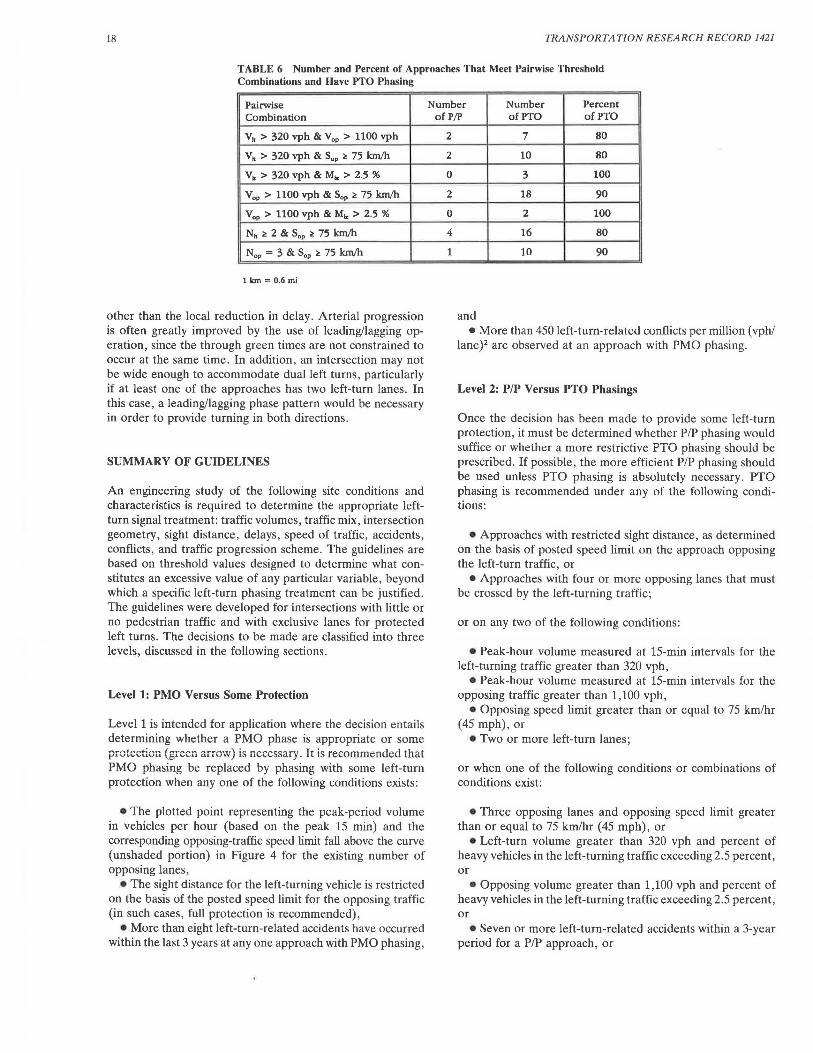
TABLE 6 Number and Percent of Approaches That Meet Pairwise Threshold Combinations and Have PTO Phasing
Pairwise Combination
V, > 320 vph & V0 P > llOO vph
v, > 320 vph & S0 p;;,, 75 km/h
V, > 320 vph & Mi. > 2.5 %
Yop > llOO vph & Sop 2 75 km/h
V0 P > 1100 vph & Mi.> 2.5 %
N, 2 2 & S0 P 2 75 km/h
N0 p = 3 & Sop 2 75 km/h
1km=0.6 mi
other than the local reduction in delay. Arterial progression is often greatly improved by the use of leading/lagging operation, since the through green times are not constrained to occur at the same time. In addition, an intersection may not be wide enough to accommodate dual left turns, particularly if at least one of the approaches has two left-tum lanes. In this case, a leading/lagging phase pattern would be necessary in order to provide turning in both directions .
SUMMARY OF GUIDELINES
An engineering study of the following site conditions and characteristics is required to determine the appropriate leftturn signal treatment: traffic volumes, traffic mix, intersection geometry, sight distance, delays, speed of traffic, accidents, conflicts, and traffic progression scheme. The guidelines are based on threshold values designed to determine what constitutes an excessive value of any particular variable, beyond which a specific left-turn phasing treatment can be justified. The guidelines were developed for intersections with little or no pedestrian traffic and with exclusive lanes for protected left turns. The decisions to be made are classified into three levels, discussed in the following sections.
Level 1: PMO Versus Some Protection
Level 1 is intended for application where the decision entails determining whether a PMO phase is appropriate or some protection (green arrow) is necessary. It is recommended that PMO phasing be replaced by phasing with some left-turn protection when any one of the following conditions exists :
• The plotted point representing the peak-period volume in vehicles per hour (based on the peak 15 min) and the corresponding opposing-traffic speed limit fall above the curve (unshaded portion) in Figure 4 for the existing number of opposing lanes,
•The sight distance for the left-turning vehicle is restricted on the basis of the posted speed limit for the opposing traffic (in such cases, full protection is recommended),
• More than eight left-turn-related accidents have occurred within the last 3 years at any one approach with PMO phasing,
Number Number Percent of PIP of PTO of PTO
2
2
0
2
0
4
1
7 80
10 80
3 100
18 90
2 100
16 80
10 90
and •More than 450 left-turn-related conflicts per million (vph/
lane)2 are observed at an approach with PMO phasing.
Level 2: PIP Versus PTO Phasings
Once the decision has been made to provide some left-turn protection, it must be determined whether PIP phasing would suffice or whether a more restrictive PTO phasing should be prescribed. If possible, the more efficient PIP phasing should be used unless PTO phasing is absolutely necessary . PTO phasing is recommended under any of the following conditions:
• Approaches with restricted sight distance, as determined on the basis of posted speed limit on the approach opposing the left-turn traffic, or
• Approaches with four or more opposing lanes that must be crossed by the left-turning traffic;
or on any two of the following conditions:
• Peak-hour volume measured at 15-min intervals for the left-turning traffic greater than 320 vph,
•Peak-hour volume measured at 15-min intervals for the opposing traffic greater than 1,100 vph,
• Opposing speed limit greater than or equal to 75 km/hr (45 mph) , or
•Two or more left-turn lanes;
or when one of the following conditions or combinations of conditions exist:
• Three opposing lanes and opposing speed limit greater than or equal to 75 km/hr (45 mph), or
•Left-turn volume greater than 320 vph and percent of heavy vehicles in the left-turning traffic exceeding 2.5 percent, or
•Opposing volume greater than 1,100 vph and percent of heavy vehicles in the left-turning traffic exceeding 2.5 percent, or
• Seven or more left-turn-related accidents within a 3-year period for a P/P approach, or
Asante et al.
•More than 260 left-turn-related conflicts per million (vph/ lane)2 observed for a PIP approach, or
•Average stopped delay to left-turning traffic acceptable (i.e., within the desired level of service) for PTO phasing and traffic engineer judges that the use of PIP phasing will result in a greater number of left-turn accidents.
Level 3: Sequence of Phasing-Leading, Lagging, or Leading/Lagging?
Level 3 is for the selection of the appropriate phasing sequence once the phase type to be used has been determined.
• A leading sequence is recommended when PIP or PTO phasing has been determined to be suitable under a Level 1 or 2 decision as outlined above, provided that it will not disrupt any progression scheme on either street;
• In regions where Dallas phasing is a viable option, it is recommended when PIP phasing has been determined to suffice but the resulting level of service is not acceptable;
• A lagging sequence is recommended when - It is intended to improve the safety of an already in
stalled leading sequence under which more than 190 leftturn conflicts per million (vehicles per hour per lane)2 are observed, or
-The lagging left-turn sequence is necessary as part of an overall network progression scheme; • A leading/lagging sequence is recommended for inter
sections when - There is inadequate space within the intersection to safely
accommodate a dual left-turn operation, or -It is necessary for the progression scheme.
DISCUSSION OF RES UL TS
The guidelines developed provide a simple three-level procedure to aid in the selection of the appropriate left-turn signal treatment. The data requirements for each decision level are different, reflecting the different objectives to be dealt with at each level. These guidelines also reflect a selection process that recognizes the trade-off between operational efficiency and safety. In some cases, more than one condition is required to justify the selection of a particular phase so as to ensure an optimum solution.
It must be noted that intersections without exclusive leftturn lanes have not been included in this study, and therefore the proposed guidelines are not applicable to this geometric condition. In general, PIP operation is not appropriate for shared-lane operations. Split phasing is often used when protection is deemed necessary. An aspect of phase type selection overlooked in this study is the inclusion of pedestrian volume as a decision variable. When left-turn protection is required, traffic engineers often favor a PTO phase at intersections with heavy pedestrian volume because permissive left turns are often confusing and unanticipated by pedestrians, particularly when they cross the intersection using signal indications based on vehicular traffic. Permissive phasings are also undesirable for bicyclists, who require a considerably larger gap in the opposing traffic for permissive turns. Threshold values for
19
pedestrian and bicycle volumes and accidents would have to be statistically established beyond which a PTO phasing could be recommended.
ACKNOWLEDGMENTS
This research has been sponsored by the Texas Department of Transportation (TxDOT) in cooperation with the Federal Highway Administration, U.S. Department of Transportation. The authors would particularly like to thank Joni Brookes of the Colorado Department of Transportation, formerly the project technical coordinator with TxDOT, for her assistance and suggestions. They would also like to thank Ray Derr of TxDOT, Robert Musselman, and Davey Warren of FHWA for their comments.
REFERENCES
1. Asante, S. A., S. A. Ardekani, and J. C. Williams. Selection Criteria for Left-Turn Phasing, Indication Sequence, and Auxiliary Signs. Research Report 1256-lF. Transportation Research, University of Texas at Arlington, Feb. 1993.
2. de Camp, G., and R. W. Denney, Jr. Improved ProtectedPermitted Left-Turn Signal Displays-The Texas Approach. /TE Journal, Vol. 62, No. 10, Oct. 1992, pp. 21-24.
3. Agent, K. R., and R. C. Deen. Warrants for Left-Turn Signal Phasing. In Transportation Research Record 737, TRB, National Research Council, Washington, D.C., 1979, pp. 1-10.
4. Agent, K. R. Guidelines for the Use of Protected/Permissive LeftTurn Phasing. Research Report UKTRP-85-19. Kentucky Transportation Research Program, University of Kentucky, Knoxville, Aug. 1985.
5. Machemehl, R. B., and H.J. Lin. Guidelines for Left-Turn Lanes and Signal Phases. In Compendium of Technical Papers, Institute of Transportation Engineers, Washington, D.C., Aug. 1982, pp. 1-8.
6. Machemehl, R. B., and A. M. Mechler. Comparative Analysis of Left-Turn Phase Sequencing. Research Report 258-2. Center for Transportation Research, University of Texas at Austin, Nov. 1983.
7. Upchurch, J. E. Left-Turn Signal Warrants for Arizona. Report FHWA/A2-85/192. Arizona Department of Transportation; FHWA, U.S. Department of Transportation, May 1985.
8. Lee, J. C., R. H. Wortman, D. J. P. Hook, and M. J. Poope. Comparative Analysis of Leading and Lagging Left-Turns. Report FWHA-AZ91-321. Arizona Department of Transportation; FHWA, U.S. Department of Transportation, 1991.
9. Florida Section, Institute of Transportation Engineers. Left-Turn Phase Design in Florida. /TE Journal, Sept. 1982, pp. 28-35.
10. Cottrell, B. H. Guidelines for Protected/Permissive Left-Turn Signal Phasing. In Transportation Research Record 1069, TRB, National Research Council, Washington, D.C., 1986, pp. 54-61.
11. Signalized Intersections. In Special Report 209: High way Capacity Manual, TRB, National Research Council, Washington, D.C., 1985.
12. Highway Capacity Software: User's Manual. Release 1.50, Federal Highway Administration, U.S. Department of Transportation, 1990.
13. Hummer, J.E., R. E. Montgomery, and C. S. Kumares. Guidelines for the Use of Leading and Lagging Left-Turn Signal Phasing. In Transportation Research Record 1324, TRB, National Research Council, Washington, D.C., 1991, pp. 11-20.
14. Collins, R. A Comparative Analysis of Left-Turn Delay Associated with Two Different Lead/Lag Phasing Arrangement. Master's thesis. University of Texas at Austin, 1988.
15. Upchurch, J. E. Guidelines for Selecting Type of Left-Turn Phas-
20
ing. In Transportation Research Record 1069, TRB, National Research Records, Washington, D.C., 1986, pp. 30-38.
16. Wrigley, N. Categorical Data Analysis for Geographers and Environmental Scientists. Longmans, London and New York, 1983.
17. Hosmer, D., and R. Lemeshow. Applied Logistics Regression. Wiley Series. Wiley, New York, 1989.
The contents of this report reflect the views of the authors, who are responsible for the facts and accuracy of the data presented herein.
TRANSPORTATION RESEARCH RECORD 1421
The contents do not necessarily reflect the official views or policies of the Federal Highway Administration or the Texas Department of Transportation. This report does not constitute a standard, specification, or regulation.
Publication of this paper sponsored by Committee on Traffic Control Devices.