selection of the best available water and … · assessment of the best available wastewater...
TRANSCRIPT

ASSESSMENT OF THE BEST AVAILABLE WASTEWATER MANAGEMENT TECHNIQUES FOR A TEXTILE MILL:
COST AND BENEFIT ANALYSIS
A THESIS SUBMITTED TO THE GRADUATE SCHOOL OF NATURAL AND APPLIED SCIENCES
OF MIDDLE EAST TECHNICAL UNIVERSITY
BY
BUĞÇE DOĞAN
IN PARTIAL FULFILMENT OF THE REQUIREMENTS FOR
THE DEGREE OF MASTER OF SCIENCE IN
ENVIRONMENTAL ENGINEERING
SEPTEMBER 2008

Approval of the thesis:
ASSESSMENT OF THE BEST AVAILABLE WASTEWATER MANAGEMENT TECHNIQUES FOR A TEXTILE MILL:
COST AND BENEFIT ANALYSIS
submitted by BUĞÇE DOĞAN in partial fulfillment of the requirements for the degree of Master of Science in Environmental Engineering Department, Middle East Technical University by, Prof. Dr. Canan Özgen Dean, Gradute School of Natural and Applied Sciences Prof. Dr. Göksel N. Demirer Head of Department, Environmental Engineering Prof. Dr. Ülkü Yetiş Supervisor, Environmental Engineering Dept., METU Dr. Merih Kerestecioğlu Co-supervisor, COWI-SNS, Ankara Examining Committee Members: Prof. Dr. Aysel Atımtay Environmental Engineering Dept., METU Prof. Dr. Ülkü Yetiş Environmental Engineering Dept., METU Dr. Merih Kerestecioğlu COWI-SNS, Ankara Assoc. Prof. Dr. Ayşegül Aksoy Environmental Engineering Dept., METU Assoc. Prof. Dr. Mehmet Kitiş Environmental Engineering Dept., SDU Ahmet Beşler Orta Anadolu Holding, Kayseri
Date:

iii
I hereby declare that all information in this document has been obtained and presented in accordance with academic rules and ethical conduct. I also declare that, as required by these rules and conduct, I have fully cited and referenced all material and results that are not original to this work.
Name, Last Name : Buğçe Doğan
Signature :

ABSTRACT
ASSESSMENT OF THE BEST AVAILABLE WASTEWATER MANAGEMENT
TECHNIQUES FOR A TEXTILE MILL: COST AND BENEFIT ANALYSIS
Doğan, Buğçe
MSc., Department of Environmental Engineering
Supervisor : Prof. Dr. Ülkü Yetiş
Co-Supervisor : Dr. Merih Kerestecioğlu
September 2008, 180 pages
The Integrated Pollution Prevention and Control (IPPC) Directive from the European
Union strives to achieve a high level of environmental protection by preventing or
reducing the pollution emanating from industrial installations directly at the source.
The Directive implies that the emission limit values should be set in accordance with
each industry’s Best Available Techniques (BAT). In the present study, water
recovery and wastewater treatability alternatives developed beforehand were
evaluated towards the evaluation of BATs for the management of wastewaters from a
denim textile mill. For this purpose, an assessment that translates the key
environmental aspects into a quantitative measure of environmental performance and
also financial analysis were performed for each of the alternatives. The alternatives
considered for water recovery from dyeing wastewaters were nanofiltration (NF)
with coagulation and/or microfiltration (MF) pretreatment, ozonation or peroxone
and Fenton oxidation. On the other hand, for the end-of-pipe treatment of the mill’s
mixed wastewater; ozonation, Fenton oxidation, membrane bioreactor (MBR) and
iii

activated sludge process followed by membrane filtration technologies were
evaluated. The results have indicated that membrane filtration process providing 70
% water recovery with the least environmental impacts is the BAT for water
recovery. On the other side, MBR technology has appeared as the BAT for the end-
of-pipe treatment of the mill’s mixed wastewater. A technical and financial
comparison of these two BAT alternatives revealed that water recovery via
membrane filtration from dyeing wastewaters is selected as the BAT for the water
and wastewater management in the mill.
Keywords: BAT, Cross-media Effects, Cost-Benefit Analysis, IPPC Directive,
Textile Industry.
iv

ÖZ
TEKSTİL ENDÜSTRİSİ İÇİN MEVCUT EN İYİ ATIKSU YÖNETİM TEKNİKLERİNİN DEĞERLENDİRİLMESİ:
FAYDA VE MALİYET ANALİZİ
Doğan, Buğçe
Yüksek Lisans, Çevre Mühendisliği Bölümü
Tez Yöneticisi : Prof. Dr. Ülkü Yetiş
Ortak Tez Yöneticisi : Dr. Merih Kerestecioğlu
Eylül 2008, 180 sayfa
Avrupa Birliği IPPC (Entegre Kirlilik Önleme ve Kontrolü) Direktifi, endüstri
tesislerinden kaynaklanan kirliliği, kaynağında azaltarak ya da önleyerek, çevrenin
yüksek seviyede korunmasını amaç edinmiştir. Direktif, tesisler için mevcut en iyi
teknikler sayesinde emisyon limit değerlerini belirlemeyi gerektirmektedir. Mevcut
çalışmada denim üreten bir tekstil fabrikasında oluşan atıksular için mevcut en iyi
teknikleri belirlemek adına su geri kazanımı ve atıksu arıtılabilirlik alternatifleri
geliştirilmiştir. Bu amaçla, her bir alternative için nicel bir çevresel performans
değerlendirmesi ve alternatiflerin finansal analizleri yapılmıştır. Su geri kazanımı
için düşünülmüş olan alternatifler boyama atıksuları için koagülasyon ya da
mikrofiltrasyon (MF) ön arıtımıyla nanofiltrasyon (NF), ozonlama ve Fenton
oksidasyonu iken; tesisin karışık atıksuyunun nihai bertarafı için uygulanmış olan
alternatifler ozonlama, Fenton oksidasyonu, membran biyoreaktörü (MBR) ve aktif
çamur sonrasında membran filtrasyon prosesleridir. Sonuçlar, su geri kazanımı
çalışmaları için % 70 su geri kazanımı sağlamış olan en az çevresel etkisi olan
v

membran filtrasyon prosesini mevcut en iyi teknik olarak göstermektedir. Diğer
taraftan membran biyoreaktör prosesi tesisteki karışık atıksuyun arıtılması için
mevcut en iyi teknik olarak görülmektedir. Belirlenmiş olan alternatiflerin teknik ve
ekonomik değerlendirilmesi sonucunda, membran filtrasyon prosesi ile boyama
atıksularından su geri kazanımı, tesisin su ve atıksu yönetimi açısından mevcut en iyi
alternatif olarak seçilmiştir.
Anahtar Kelimeler: BAT, Çapraz-ortam Etkileri, Fayda-Maliyet Analizi, IPPC
Direktifi, Tekstil Endüstrisi.
vi

to my beloved family
vii

ACKNOWLEDGEMENTS
I would like to express my warmest gratitude to my supervisor Prof. Dr. Ülkü Yetiş
for her endless supervision, trust, guidance and encouragement during and beyond
this work. Without her vision and support, I could never complete this work. It is a
great honour for me to be a student of Dr. Yetiş.
I also wish to express my deepest gratitude to my co-supervisor Dr. Merih
Kerestecioğlu for his guidance, excitement, advice and support throughout this thesis
study.
I also would like to acknowledge the valuable comments and contributions of my
Supervising Committee Members.
My special thanks are extended to my colleagues Hümeyra Bahçeci, A. Hakan
Balman, Ahmet Doğan, B. Fuat Çankaya, and Ersin Yıldırım for their friendship,
support, positive energy and joy.
I am also thankful for support, motivation and sisterhood of my cousin Didem
Arıkan...
Finally, my deepest thanks are dedicated to Mom and Dad. They were always near
me with their encouragement and their support. And lastly, but not least, I would like
to express my warmest thanks and love to my dear A. Güray Çimentepe for his
endless trust, endless support and encouragement. I could never complete this thesis
without him...
viii

TABLE OF CONTENTS
ABSTRACT……………………………………………………………………. iii
ÖZ………………………………………………………………………………. v
ACKNOWLEDGEMENTS…………………………………………………….. viii
TABLE OF CONTENTS………………………………………………………. ix
LIST OF TABLES…………………………………………………………….... xiii
LIST OF FIGURES……………………………………………………………. xviii
ABBREVIATIONS………………………………………………………......... xxi
CHAPTERS
1. INTRODUCTION……………………………………………………… 1
1.1. General…………………………………………………………….. 1
1.2. Objective and Scope of the Study…………………………………. 3
1.3. Thesis Overview…………………………………………………… 4
2. LITERATURE REVIEW………………………………………………. 5
2.1. Investment and Operating Cost Data for Alternative Technologies 5
2.1.1. Activated Sludge Process Costs………………………... 5
2.1.2. Advanced Oxidation Processes……………………….... 11
2.1.2.1. Ozonation Costs………………………………… 12
2.1.2.2. Fenton Oxidation Costs…………………………. 15
2.1.2.3. Peroxone Process Costs…………………………. 18
2.1.3. Membrane Processes……………………………………. 19
2.1.3.1. MBR Costs……………………………………… 20
2.1.3.2. Membrane Filtration Costs……………………… 23
3. LEGISLATION BACKGROUND…………………………………….. 27
3.1. Integrated Pollution Prevention and Control Directive…………… 27
ix

3.1.1. Reference Document on Economics & Cross-Media
Effects………………………………………………….. 31
3.1.1.1. General Information……………………………. 31
3.1.1.2. Cross-Media Guidelines……………………….. 33
3.1.1.3. Costing Methodology………………………….. 36
3.1.1.4. Evaluation of the Alternatives…………………. 41
3.1.1.5. Economic Viability of the Sector……………… 44
4. SELECTED MILL……………………………………………………. 47
4.1. Water Recovery Studies………………………………………….. 50
4.1.1. Coagulation as a Pre-treatment for Dyeing Wastewaters 50
4.1.2. Membrane Filtration for Dyeing Wastewaters………… 52
4.1.3. Ozonation for Dyeing Wastewaters……………………. 53
4.1.4. Fenton Oxidation for Dyeing Wastewaters……………. 55
4.2. Prioritization of Applicable Water Recovery Alternatives………. 56
4.3. Wastewater Treatability Studies………………………………….. 59
4.3.1. Biological Treatment Followed by MF and NF for Mixed
Wastewaters……………………………………………………… 59
4.3.2. Membrane Bioreactor for Mixed Wastewaters………… 61
4.3.3. Ozonation for Mixed Wastewaters…………………….. 63
4.3.4. Fenton Oxidation for Mixed Wastewaters…………….. 65
4.4. Prioritization of Applicable Wastewater Treatability Alternatives.. 65
5. COST AND BENEFIT ANALYSIS…….……………………………. 68
5.1. Assumptions………………………………………………………. 68
5.2. Analysis of Water Recovery Studies……………………………… 70
5.2.1. Environmental Impact Analysis………………………… 71
5.2.1.1. Identification of Alternatives…………………… 71
5.2.1.2. Inventory of Consumptions and Emissions……. 72
5.2.1.3. Cross-media Effects of the Alternatives……….. 76
5.2.2. Financial Analysis……………………………………… 84
x
5.2.2.1. Investment Costs………………………………... 84
5.2.2.2. Operating Costs…………………………………. 88
5.2.2.3. Revenues and Avoided Costs…………………… 92
5.2.2.4. Net Present Value……………………………….. 95
5.2.2.5. Internal Rate of Return………………………….. 96
5.2.2.6. Annual Cost Calculation………………………… 97
5.2.3. Evaluation of the Water Recovery Alternatives………… 98
5.2.3.1. Cost Effectiveness and Benefit Analysis……….. 98
5.3. Analysis of Wastewater Treatability Studies……………………… 100
5.3.1. Environmental Impact Analysis………………………… 100
5.3.1.1. Identification of Alternatives…………………… 100
5.3.1.2. Inventory of Consumptions and Emissions……. 101
5.3.1.3. Cross-media Effects of the Alternatives……….. 105
5.3.2. Financial Analysis……………………………………… 108
5.3.2.1. Investment Costs………………………………… 108
5.3.2.2. Operating Costs………………………………….. 113
5.3.2.3. Revenues and Avoided Costs……………………. 121
5.3.2.4. Net Present Value……………………………….. 127
5.3.2.5. Internal Rate of Return………………………….. 127
5.3.2.6. Annual Cost Calculation……………………….... 128
5.3.3. Evaluation of the Wastewater Treatability Alternatives… 129
5.3.3.1. Cost Effectiveness and Benefit Analysis………… 129
5.4. Sensitivity Analysis……………………………………………… 131
5.5. Risk Evaluation………………………………………………….. 134
5.6. Economic Viability of the Textile Sector……………………….. 136
6. SUMMARY…………………………………………………………….. 138
7. CONCLUSIONS……………………....………………………………. 144
8. RECOMMENDATIONS………………………………………………. 146
REFERENCES…………………………………………………………………. 147
xi

APPENDICES
APPENDIX A. Wastewater Reuse Standards…………………………... 155
APPENDIX B. Design Criteria of the Existing Wastewater Treatment
Plant……………………………………………………. 156
APPENDIX C. Sample Working Sheets………………………………... 157
APPENDIX D. Sensitivity Diagrams…………………………………… 162
APPENDIX E. Sensitivity Analysis Results…………………………… 174
APPENDIX F. Calculations for Summary Tables…………………….… 179
xii

LIST OF TABLES
TABLES
Table 2.1. Flowrate and COD concentrations of wastewater A, B, and C from a
textile mill in Turkey…………………………………………………….…… 9
Table 2.2. Unit investment and operating costs for different flowrates……... 11
Table 2.3. Unit investment and operating costs for different COD
concentrations……………………………………………………………….. 11
Table 2.4. Ferric sulfate and hydrogen peroxide unit costs………………….. 17
Table 2.5. Fenton oxidation process – Typical operating costs………..…….. 18
Table 2.6. MBR System Costs……………………………………………….. 22
Table 2.7. Investment and running costs for MF, UF, and NF……………….. 25
Table 2.8. Investment cost formulas for membrane filtration processes.…….. 26
Table 3.1. The Scale Exponent Method……………………………………… 40
Table 4.1. General characteristics for wastewaters of the most-widely used recipes
and their mixture................................................................................................ 51
Table 4.2. Coagulation experiments results....................................................... 51
Table 4.3. General characteristics for wastewaters from the first post-rinsing stage
and composite wastewaters from all post-rinsing stage..................................... 52
Table 4.4. COD and color removal from the first post-rinsing stage and composite
wastewaters from all post-rinsing stage, and most-widely used recipes........... 53
Table 4.5. General characteristics for wastewaters subjected to ozonation
process................................................................................................................ 54
Table 4.6. COD and color removal from wastewaters subjected to ozonation
process................................................................................................................ 54
Table 4.7. General characteristics for wastewaters subjected to Fenton oxidation
process................................................................................................................ 55
xiii

Table 4.8. Summary for water recovery alternatives......................................... 56
Table 4.9. Prioritization of water recovery alternatives-Estimated Scores........ 58
Table 4.10. Discharge standards of KASKI....................................................... 60
Table 4.11. General characteristics for wastewaters subjected to biological treatment
followed by MF and NF..................................................................................... 61
Table 4.12. General characteristics of the influent wastewater to the pilot-scale MBR
system................................................................................................................. 62
Table 4.13. The performance of the MBR system............................................. 62
Table 4.14. General characteristics for wastewaters subjected to ozonation and
peroxone tests.................................................................................................... 63
Table 4.15. COD and color removal from wastewaters subjected to ozonation and
peroxone processes............................................................................................. 64
Table 4.16. General characteristics for wastewaters subjected to
post-ozonation..................................................................................................... 64
Table 4.17. COD and color removal from wastewaters subjected to post
ozonation........................................................................................................... 65
Table 4.18. Summary for wastewater treatability alternatives........................... 66
Table 5.1. General characteristics of the wastewaters used during the cost-benefit
analysis............................................................................................................... 69
Table 5.2. Wastewater distribution among the process streams......................... 70
Table 5.3. Identification of the water recovery alternatives............................... 71
Table 5.4. Energy consumptions of the water recovery alternatives.................. 72
Table 5.5. Average fuel use and emissions released to create 1 GJ of
electricity….…………………………………………………………………… 73
Table 5.6. Calculated emission values released from the alternative options…. 74
Table 5.7. Mass of pollutants released to air....................................................... 74
Table 5.8. Hazardous waste generation for the water recovery alternatives....... 76
Table 5.9. Human toxicity potentials of the water recovery alternatives............ 77
Table 5.10. Global warming potentials of the water recovery alternatives......... 79
xiv

Table 5.11. Acidification potentials of the water recovery alternatives.............. 80
Table 5.12. Photochemical ozone creation potentials of the water recovery
alternatives........................................................................................................... 82
Table 5.13. Cross-media effects of the water recovery alternatives.................... 83
Table 5.14. Investment costs for NF process....................................................... 85
Table 5.15. Investment costs of the water recovery alternatives......................... 87
Table 5.16. Operating costs for NF application................................................... 89
Table 5.17. Operating costs for MF application.................................................. 90
Table 5.18. Operating costs for ozonation application....................................... 91
Table 5.19. Operating costs of the water recovery alternatives......................... 92
Table 5.20. Cash flow assessment for membrane filtration alternative............. 93
Table 5.21. Cash flow assessment for ozonation alternative............................. 94
Table 5.22. NPV values of the water recovery alternatives............................... 96
Table 5.23. IRR values of the water recovery alternatives................................. 97
Table 5.24. Annual costs of the water recovery alternatives............................. 98
Table 5.25. Cost effectiveness of the water recovery alternatives.................... 99
Table 5.26. Identification of the wastewater treatability alternatives................ 101
Table 5.27. Specific energy consumptions of treatment alternatives................. 102
Table 5.28. Electricity usage of treatment alternatives...................................... 102
Table 5.29. Calculated emission values released from the treatment alternative
options………………………………………………………………………… 103
Table 5.30. Mass of pollutants released to air due to treatment alternatives..... 104
Table 5.31. Mass of pollutants released to aquatic environment of treatability
alternatives......................................................................................................... 105
Table 5.32. Hazardous waste amounts of the treatability alternatives............... 105
Table 5.33. Cross-media effects of the wastewater treatability alternatives...... 107
Table 5.34. Investment costs for MF and NF process for treatability
alternatives......................................................................................................... 109
Table 5.35. Investment costs for MBR process................................................. 110
xv

Table 5.36. Investment costs of treatability alternatives................................... 113
Table 5.37. Operating costs for existing activated sludge system of the
textile mill.......................................................................................................... 114
Table 5.38. Unit operating costs for existing activated sludge system of the textile
mill..................................................................................................................... 114
Table 5.39. Operating costs for MF + NF application....................................... 115
Table 5.40. Operating costs for MBR application............................................. 117
Table 5.41. Operating costs for ozonation application before activated sludge
system................................................................................................................ 118
Table 5.42. Operating costs for peroxone treatment before activated
sludge system..................................................................................................... 119
Table 5.43. Operating costs for ozonation application after activated
sludge system..................................................................................................... 120
Table 5.44. Operating costs of the wastewater treatability alternatives........... 121
Table 5.45. Cash flow assessment for activated sludge and membrane filtration
alternative......................................................................................................... 122
Table 5.46. Cash flow assessment for membrane bioreactor alternative......... 123
Table 5.47. Cash flow assessment for activated sludge with pre-ozonation
alternative......................................................................................................... 124
Table 5.48. Cash flow assessment for activated sludge with peroxone
alternative......................................................................................................... 125
Table 5.49. Cash flow assessment for ozonation after activated sludge
alternative.......................................................................................................... 126
Table 5.50. NPV values of the wastewater treatability alternatives.................. 127
Table 5.51. IRR values of the wastewater treatability
alternatives......................................................................................................... 128
Table 5.52. Annual costs of the wastewater treatability alternatives................ 129
Table 5.53. Cost effectiveness of the wastewater treatability alternatives........ 130
Table 5.54. COD and color concentrations for sensitivity analysis…………... 132
xvi
Table 6.1. Summary of cross-media effects for the selected BATs.................. 140
Table 6.2. Summary of financial analysis for the selected BATs..................... 141
Table A.1. Wastewater reuse criteria................................................................. 155
Table B.1. Design criteria of the existing wastewater treatment plant in the textile
mill...................................................................................................................... 156
Table E.1. Changes in costs when critical variables change for water recovery
alternatives......................................................................................................... 175
Table E.2. Changes in costs when critical variables change for wastewater treatability
alternatives......................................................................................................... 176
xvii

LIST OF FIGURES
FIGURES
Figure 2.1. Unit investment cost versus wastewater flowrate graph for activated
sludge systems existing in some of the textile mills located in Turkey……..... 7
Figure 2.2. Relationship between unit investment cost and COD removed from
activated sludge processes existing in some textile mills of Turkey………….. 8
Figure 2.3. Relationship between unit operating cost and wastewater flowrate for
activated sludge processes existing in some textile mills of Turkey………….. 8
Figure 2.4. The price of the main equipment for ozonation treatment...………. 15
Figure 2.5. MBR operating cost change………………………………………. 23
Figure 3.1. Chart for cross-media guidelines…………………………………. 34
Figure 3.2. Chart for costing methodology…………………………………… 37
Figure 3.3. Chart for evaluating the alternatives……………………………… 42
Figure 3.4. Decision making process for evaluating cost effectiveness………. 43
Figure 3.5. Evaluation of economic viability in the sector……………………. 45
Figure 4.1. Water flow in the selected mill…………………………………… 49
Figure 6.1. Investment cost sensitivity diagram for MF + NF alternative applied in
water recovery studies………………………………………………………… 143
Figure 6.2. Investment cost sensitivity diagram for the MBR alternative applied in
wastewater treatability studies………………………………………………… 143
Figure C.1. Input page for sensitivity analysis................................................... 158
Figure C.2. Working sheet of cross-media assessment for water recovery
studies................................................................................................................ 159
Figure C.3. Working sheet of financial analysis for water recovery studies...... 160
Figure C.4. Working sheet for ozonation cost calculations................................. 161
xviii

Figure D.1. Investment cost sensitivity diagram for MF + NF alternative applied in
water recovery studies........................................................................................ 163
Figure D.2. Operating cost sensitivity diagram for MF + NF alternative applied in
water recovery studies........................................................................................ 163
Figure D.3. NPV sensitivity diagram for MF + NF alternative applied in water
recovery studies.................................................................................................. 164
Figure D.4. Investment cost sensitivity diagram for ozonation alternative applied in
water recovery studies....................................................................................... 164
Figure D.5. Operating cost sensitivity diagram for ozonation alternative applied in
water recovery studies....................................................................................... 165
Figure D.6. NPV sensitivity diagram for ozonation alternative applied in water
recovery studies................................................................................................. 165
Figure D.7. Investment cost sensitivity diagram for the AS + MF + NF alternative
applied in wastewater treatability studies......................................................... 166
Figure D.8. Operating cost sensitivity diagram for the AS + MF + NF alternative
applied in wastewater treatability studies........................................................ 166
Figure D.9. NPV sensitivity diagram for the AS + MF + NF alternative applied in
wastewater treatability studies......................................................................... 167
Figure D.10. Investment cost sensitivity diagram for the MBR alternative applied in
wastewater treatability studies............................................................................ 167
Figure D.11. Operating cost sensitivity diagram for the MBR alternative applied in
wastewater treatability studies............................................................................ 168
Figure D.12. NPV sensitivity diagram for the MBR alternative applied in wastewater
treatability studies................................................................................................ 168
Figure D.13. Investment cost sensitivity diagram for the ozonation + AS alternative
applied in wastewater treatability studies............................................................ 169
Figure D.14. Operating cost sensitivity diagram for the ozonation + AS alternative
applied in wastewater treatability studies........................................................... 169
xix

Figure D.15. NPV sensitivity diagram for the ozonation + AS alternative applied in
wastewater treatability studies........................................................................... 170
Figure D.16. Investment cost sensitivity diagram for the peroxone + AS alternative
applied in wastewater treatability studies......................................................... 170
Figure D.17. Operating cost sensitivity diagram for the peroxone + AS alternative
applied in wastewater treatability studies......................................................... 171
Figure D.18. NPV sensitivity diagram for the peroxone + AS alternative applied in
wastewater treatability studies.......................................................................... 171
Figure D.19. Investment cost sensitivity diagram for the post ozonation alternative
applied in wastewater treatability studies......................................................... 172
Figure D.20. Operating cost sensitivity diagram for the post ozonation alternative
applied in wastewater treatability studies......................................................... 172
Figure D.21. NPV sensitivity diagram for the post ozonation alternative applied in
wastewater treatability studies.......................................................................... 173
Figure F.1. Cross-media effects of the existing activated sludge system
in the mill………………………………………………………………………. 180
xx

LIST OF ABBREVIATIONS
BAT Best Available Techniques
BREF BAT Reference Document
COD Chemical Oxygen Demand
EU European Union
EUR European Euro
EWA European Water Association
IPPC Integrated Pollution Prevention and Control
IRR Internal Rate of Return
KASKI KayseriWater and Sewerage Directorate
LCA Life Cycle Assessment
MBR Membrane Bioreactor
METU Middle East Technical University
MF Microfiltration
MoEF Ministry of Environment and Forestry
NF Nanofiltration
NPV Net Present Value
RO Reverse osmos
UF Ultrafiltration
USD United States Dollars
YTL New Turkish Liras
xxi
CHAPTER 1
INTRODUCTION
1.1. General
The European Union (EU) has a set of common rules specified in the Integrated
Pollution Prevention and Control (IPPC) Directive (96/61/EC), published in 1996,
for permitting industrial installations being found in the EU Member States. The aim
of this Directive is to develop an integrated approach in order to improve the
management and control of industrial facilities so as to achieve a high level of
environmental protection taking into account the emissions in air, water and soil as a
whole.
According to Article 3 of the Directive, “Member States shall take the necessary
measures to provide that the competent authorities ensure that installations are
operated in such a way that all the appropriate preventive measures are taken against
pollution, in particular through application of the Best Available Techniques (BAT)”
[1]. In this context, within the definition of “available”, the Directive states that
“techniques shall mean those developed on a scale which allows implementation in
the relevant industrial sector, under economically and technically viable conditions,
taking into consideration the costs and advantages” [1]. Moreover, there is a
requirement that in the determination of BAT, the technical characteristics of the
installation concerned, its geographical location and the local environmental
conditions should be taken into account.
1

Under the framework of the IPPC Directive, a Reference Document called as
“Economics and Cross-Media Effects” has been developed in order to reinforce the
determination of BAT by setting methodologies. In this Reference Document, while
determining the BAT for the installation concerned, first step that should be taken
into consideration is the environmental effects of the options, namely “Cross-Media
Effects”. The purpose of the cross-media methodology is to provide guidance for
how to choose the best alternative [2]. Secondly, costing methodology is mentioned
in order to determine the cost for each option considered. After the establishments of
cross-media effects and costs of the options, their comparison is needed in order to
determine which of the alternative can be selected to be BAT. According to the
abovementioned definition of “available” stated in the Directive, alternatives that are
designated to be BAT should be ones that are technically and economically viable for
the implementation in the relevant industrial installations. Therefore, at the end of the
cost-benefit analysis, economic viability in the sector needs to be considered taking
into account industrial structure, market structure, and resilience of the sector.
Textile industry is one of activities listed in the Annex 1 of the IPPC Directive. The
Directive covers only “plants for pretreatment (operations such as washing,
bleaching, and mercerization) or dyeing of fibres or textiles where the treatment
capacity exceeds 10 tones per day”, not the entire textile processes. According to the
Directive-Specific Plan for the IPPC Directive, published by the Ministry of
Environment and Forestry of Turkey in 2005, there exist approximately 240 – 300
textile companies that should be considered within the IPPC Directive. In this report,
costs for implementation of environmental management systems in the textile
industry were forecasted on average 15,000 EUR - 20,000 EUR per installations. In
addition, total costs for the implementation of such systems in the textile industries
operating whole through Turkey were estimated as 3.6 – 6.0 million EUR [3].
2

1.2. Objective and Scope of the Study
The major aim of this thesis is to select the best water and wastewater management
scheme under economically and technically viable conditions taking into
consideration the costs and advantages for a selected textile mill in Turkey. The
study is a part of the TUBITAK financed project entitled as “Adaptation of IPPC
Directive to a Textile Mill in Turkey” which is conducted by the Department of
Environmental Engineering at the Middle East Technical University (METU) in co-
operation with the Ministry of Environment and Forestry of Turkey.
A denim producing mill had been chosen for the adaption of IPPC Directive. Many
water and wastewater management alternatives such as water recovery techniques
and wastewater treatability technologies were studied and technically discussed for
the purpose of the project. In the present study, initially, environmental impacts of
each management alternative were determined within the framework of cross-media
guidelines specified in the Reference Document on “Economics and Cross-Media
Effects”. Then, financial analysis including investment and operational costs of the
alternative water and wastewater management techniques identified in the previous
phases of the project was performed according to the costing methodology indicated
in the abovementioned Reference Document. In addition, sensitivity analysis was
performed for the critical variations that affect the financial analysis.
As a result of the assessments mentioned above, whether the alternatives studied for
water management and the ones for wastewater management are BAT or not was
determined in this thesis study by means of cost-benefit analysis. Consequently, the
best economically and technically viable alternative for water and wastewater
management was selected as the BAT for the whole system.
3

1.3. Thesis Overview
This thesis includes seven chapters. Chapter 1 (Introduction) presents mainly the
objective and the scope of the study. In Chapter 2 (Literature Review), investment
and operating cost data for the alternative technologies were introduced. Chapter 3
(Legislation Background) reviews the fundamentals of the IPPC Directive and the
“Reference Document on Economics and Cross-Media Effects”. In Chapter 4
(Selected Mill), the studies having done throughout this project are detailed. Also
presented in this chapter is the screening of the alternatives for the cost-benefit
analysis. Chapter 5 (Cost-Benefit Analysis) describes the cost-benefit analysis for the
selected water and wastewater management alternatives including environmental
impact analysis and financial analysis. In addition, it also includes sensitivity and
risk analysis. Chapter 6 (Discussion and Conclusions) evaluates the assessment of
BAT Finally, Chapter 7 (Recommendations) gives the recommendations for this
study.
4

CHAPTER 2
LITERATURE REVIEW
In this chapter, a brief literature review of the cost data for the different options used
in the treatment of textile wastewater, are provided along with recent published
studies. Alternative options taken into considerations are the ones that are used in
this project.
2.1. Investment and Operating Costs for Alternative Technologies
The alternatives considered are activated sludge process, ozonation, membrane
filtration process, membrane bioreactor process, and Fenton oxidation. These
processes are evaluated in terms of their investment and operating costs with respect
to the previous studies published in the literature.
2.1.1. Activated Sludge Process Costs
In textile sector, activated sludge process is one of the most preferential conventional
methods for the treatment of wastewater generated [4]. The main reason for this
preference is due to its low investment and operating costs compared to the other
treatment methods such as physical and chemical treatments. Therefore, it can be
concluded that biological treatment is the most economical wastewater treatment
option in the textile industry [5].
5

In Turkey, there are many activated sludge implementations in textile mills in order
to treat textile effluents. For instance, there exists a textile mill producing cotton
fabrics in Uşak which has an activated sludge treatment plant with a flow rate of 200
m3 per day. In this plant, the daily treated amount of COD is approximately 300
kilograms. Investment cost and annual operating cost for this plant are reported to be
38,000 YTL and 20,000 YTL, respectively. Corresponding, unit investment cost for
one meter cube of wastewater is 190 YTL, whereas operating cost is about 0.28 YTL
[6]. In these cost figures, sludge disposal cost is neglected.
Another textile mill located in Kahramanmaraş has an activated sludge treatment
plant with a flowrate of 1,100 m3/day. Annual production capacity is 2,250 tones of
cotton textile. Additionally, influent COD concentration of wastewater before
entering the extended aeration is approximately 1,200 mg/L. For this system,
investment cost comes about 177,500 YTL, and annual operating cost is nearly
195,700 YTL. Compared to the cost data for the wastewater treatment plant of the
previously mentioned textile mill located in Uşak; unit investment cost for this plant
is lower, namely 160 YTL. However, for this wastewater treatment plant operating
cost per meter cubes of treated textile wastewater is 0.50 YTL, which is more than
the previous one. Moreover, cost for the removal of one kilogram of COD becomes
150 YTL for this situation [6].
To the knowledge of the author of this thesis, there also exist two more textile mills
established in Kahramanmaraş, having their own wastewater treatment plants
consisting of an activated sludge systems which both have capacities of 2,000 m3 per
day. Besides, they annually produce approximately 4,000 – 5,000 tones of cotton
fabric. Similarly, investment and annual operating cost for these wastewater
treatment plants are 360,000 YTL and 280,000 YTL, respectively. Consequently, for
these wastewater treatment plants, the operating cost is 0.40 YTL per m3 of
wastewater treated [6].
6

Investment costs of the treatment plants for the textile industries mentioned above
are composed of construction cost, equipment cost, and installation expenditure. As
can be seen from the mentioned textile wastewater treatment examples, activated
sludge systems in Turkey are installed with an investment cost in the range of 160
YTL to 200 YTL per meter cube of wastewater generated. This wide range is due to
the difference in wastewater flowrate. This relative change in the investment cost
with respect to the wastewater flowrate is illustrated in the graph given in Figure 2.1
[6].
Figure 2.1. Unit investment cost versus wastewater flowrate for activated sludge
systems existing in some of the textile mills located in Turkey
Unit investment cost per removed COD from the system is another important
parameter. For the pre-mentioned examples of textile wastewater treatment plants in
Turkey, this parameter is in the range of 125 YTL to 140 YTL. In Figure 2.2, change
in unit investment cost according to COD removal is graphically presented [6].
7

Figure 2.2. Relationship between unit investment cost and COD removed from
activated sludge processes existing in some textile mills of Turkey
Energy, chemical, labour, fixed operating and maintenance costs are the major
operating cost items taken into account. Operating cost per unit meter cube of treated
wastewater for some textile mills located in Turkey is estimated at between 0.25
YTL and 0.50 YTL [6].
Figure 2.3. Relationship between unit operating cost and wastewater flowrate for
activated sludge processes existing in some textile mills of Turkey
8

Istanbul Technical University, Turkish Economy Bank and TML Construction Inc.
performed a technical and an economical feasibility study of in-plant control for
wool finishing textile industry in order to reduce water consumption and enhance
water recovery on the basis of a survey conducted on a textile mill located in Istanbul
[7]. In this survey, three different wastewater samples having different characteristics
were analyzed by Erdoğan et al. [7]. First wastewater (Wastewater A) is the raw
wastewater before in-plant control applications. Secondly, after applications of water
minimization in-plant, generated wastewater was called as Wastewater B. Third and
final one is Wastewater C, the remaining wastewater obtained after water
conservation and also application of recycling. Flowrate and characterization of these
different types of wastewaters likely to be generated from the mill are summarized in
Table 2.1 [7].
Table 2.1. Flowrate and COD concentrations of wastewater A, B, and C from a
textile mill in Turkey [7]
Wastewaters Parameter
A B C
Flowrate (m3/day) 444 294 194
COD (mg/L) 687 1,038 1,460
In the same survey mentioned above, it was found out that each wastewater was
biologically treated by conventional activated sludge process and discharged to a
receiving environment. Erdoğan et al. [7] performed a feasibility analysis regarding
the investment and operating costs of the treatment processes for three different
wastewater types. Investment cost consisting of construction, electro-mechanic, and
other costs for Wastewater A was approximately calculated as 127,602 USD. On the
9

other hand, they reported investment costs for Wastewater B and Wastewater C as
115,242 USD and 111,331 USD, respectively. As can be seen, investment cost of
treatment decreased by the decrease in flowrate.
Erdoğan et al. [7] also calculated the operating costs for each water management
options in this survey according to manpower, chemical usage and energy usage. By
means of both in-plant water minimization methods and water recovery and reuse
techniques, effluent wastewater flowrates were decreased with an increase in effluent
COD concentration. Therefore, unit investment costs showed an increase due to this
increase in COD concentrations. When the flowrate of the system was 444 m3/day,
the monthly operating cost of the system was determined as 2,668 USD. However,
this value was calculated as 2,680 USD for both Wastewater B and Wastewater C.
According to the examples given above, in textile wastewater treatment by the
process of activated sludge process, investment cost and operating costs are strongly
related with the wastewater flowrate of the plant and also with the COD removed
during the treatment. Table 2.2 summarizes the investment cost and operating cost
for an activated sludge system for different flowrate ranges for the textile industry in
Turkey. Likewise, cost ranges for different COD concentrations are given in Table
2.3.
10

Table 2.2. Unit investment and operating costs for different flowrates [6]
Capacity
(m3/day)
Unit Investment
Cost
(YTL/m3/day)
Unit Operating
Cost
(YTL/m3/day)
1 < 200 190 – 690 0.28 – 0.55
2 200 – 500 190 – 470 0.24 – 0.36
3 500 – 1100 160 – 345 0.24 – 0.50
4 1100 – 2000 160 – 190 0.40 – 0.50
Table 2.3. Unit investment and operating costs for different COD concentrations [6]
COD
Removed
(kg/day)
Unit Investment
Cost
(YTL/kg/day)
Unit Operating
Cost
(YTL/kg/day)
1 < 300 125 – 890 0.18 – 0.61
2 300 – 1200 125 – 150 0.18 – 0.45
3 1200 – 2500 140 – 150 0.30 – 0.45
4 2500 – 3000 135 – 140 ~ 0.30
2.1.2. Advanced Oxidation Processes
In recent years, as a result of the changes and improvements in textile industry,
textile wastewaters have become very difficult to be treated by physico-chemical and
biological treatment methods due to not only its complex structure but also the
11

diversity of dyes and chemicals used in the textile industry [8, 9, 10]. In most of the
cases, these wastewaters are discharged without complete treatment and therefore
they not only cause some negative effects on the environment but also cause
esthetical problems.
Because of the abovementioned reasons, there exist advanced oxidation processes
that can treat textile wastewaters from their toxic and refractory pollutants. These
processes are mainly Fenton oxidation (H2O2/Fe+2), Fenton-like oxidation
(H2O2/Fe+3), photo-Fenton processes (UV/H2O2/Fe+2), ozonation, combination of
ozone with hydrogen peroxide, combination of ozone with UV, and hydrogen
peroxide with UV combinations [11]. All these processes have both advantages and
disadvantages. By means of advanced oxidation processes, in addition to COD and
BOD removals, high level of color removal from textile wastewaters can be
achieved, and this appears as an advantage of these processes over the conventional
ones [9]. On the other hand, one of the disadvantages is that they have high
investment costs [11].
In this part of the thesis, ozonation, Fenton oxidation and ozone with hydrogen
peroxide combination are discussed in terms of investment costs and operation and
maintenance costs according to the information reported in the literature.
2.1.2.1. Ozonation Costs
Ozone is a very powerful oxidant for both water and wastewater treatment [12].
After dissolving in water, ozone undergoes chemical reactions in two ways which are
direct oxidation as molecular ozone, and indirect oxidation with the formation of
secondary oxidants (e.g. hydroxyl radical). Ozone is not only used as a strong
oxidant in the color and odor removal from wastewaters, but also as a strong
disinfectant in water treatment [13].
12

Ozone is produced by ozone generators. In 1998, Brian et al. [14] performed a pilot
scale study in Raleigh on technologies for removal of a highly colored industrial
waste stream. Combination of ultraviolet light and hydrogen peroxide, carbon
adsorption, ion exchange, and ozone were assessed for their efficiency in treating the
colored wastewater with an approximate flowrate of 5,000 m3/day. Equipment cost,
namely ozone generator cost, was designated as 3,000 USD per meter cubes of ozone
produced in a day. In addition, operating cost was calculated as 24 USD per each
meter cubes of treated wastewater [14].
In another survey conducted in Uludag University in 2006, Solmaz et al. [15]
examined three different treatment techniques which are coagulation, Fenton
oxidation and ozonation for a pre-treated textile industry wastewater in order to
compare their performances. Composite wastewater samples used in this survey were
collected from the discharge point of an existing wastewater treatment plant, having
11,000 m3/day of flowrate, of a textile factory in Bursa [15]. The wastewater
treatment plant has physical (coarse screening, equalization, pumping station, rotary
screening and neutralization) and biological treatment (activated sludge process)
units, and the treatment performance is appropriate for existing discharge
regulations. Initially, influent and effluent wastewater characterizations for the
wastewater considered were evaluated. While the influent COD concentration to the
wastewater treatment plant was measured as 668 mg/L, the effluent COD
concentration was 160 mg/L corresponding to a 76 % removal.
In the abovementioned study, the experiments were conducted on the samples which
were taken from the effluent of the existing wastewater treatment plant of the plant.
Optimum ozone dosage was determined as 360 mg/L with 43 % of COD removal
and 97 % of color removal [15].
13

Consequently, Solmaz et al. [15] assessed the operating costs of the alternatives
taken under consideration. For instance, chemical cost was estimated to be 2.42 USD
per each kilogram of ozone. Moreover, excluding labour and sludge disposal costs,
the total operating cost was found as 4.94 USD per m3 of wastewater treated.
In a study performed by Boncz [16], wastewaters from several different types of
economical activity amongst which the tanker cleaning industry were investigated by
oxidation with ozone. The aim was to provide a strategy and the necessary data
needed for the design of an oxidation process using combinations of ozone, H2O2,
and UV irradiation. The research had been focused on the processes in which ozone
is the primary oxidants. Boncz [16] stated that high cost of the oxidant is the major
disadvantage of process. Each kilogram of ozone costed 3.5 EUR. In addition to this,
it was expected that ozonation process implemented in the textile industry had an
approximate operating cost with a range of 0.11 – 0.27 EUR per each tonne. Each
oxygen supply and energy accounted for around 37 % of this cost; whereas
depreciation and maintenance accounted for the remaining 25 %. Moreover, Boncz
[16] also stated that ozonation process could cost up to 0.55 EUR per tonne for more
heavily polluted industry effluents or landfill leachate.
Furthermore, in another study, Canizares et al. [12] described the technical and
economic feasibilities of three different advanced oxidation processes which were
conductive-diamond electrochemical oxidation, ozonation and Fenton oxidation.
They compared these by assessing the three technologies with synthetic wastewaters
polluted with different types of organic compounds and also with actual wastes
generated from olive oil mills and from a fine-chemical manufacturing plant.
Canizares et al. [12] carried out ozonation experiments by continuously feeding an
ozone/oxygen gas stream into a mixed semi-batch bubble reactor (continuous for gas
and batch for liquid). The experimental setup consisted of an ozone generator of
14

Model GMF-10, and a jacketed cylindrical reactor (2.5 dm3) equipped with a porous
gas distribution plate and baffles to increase the capacity for the absorption of ozone.
After the experimental study by Canizares et al [12], financial analyses of the
processes were performed. The main items of equipment required in the case of
ozonation are the reactor and the ozone generator. The prices of these items as a
function of the ozone production required (sizing parameter) are shown in Figure 2.4.
Canizares et al. [12] also stated that the figure also shows the best fit of the Williams
equation indicated over Figure 2.4.
Pric
e (E
UR
)
Ozone production (gr/h)
Figure 2.4. The price of the main equipment for ozonation treatment [12]
2.1.2.2. Fenton Oxidation Costs
In the textile industry wastewater treatment, one of the advanced oxidation
technologies applicable is the Fenton oxidation process. Fenton’s reagent which is a
mixture of peroxide and ferrous sulfate is effective in decolorizing and reducing the
15

COD content of the wastewater that contain reactive, direct, basic, and acid or
disperse dye [17]. Some of the operational parameters that affect this process are pH,
ferric sulfate and hydrogen peroxide dosages [10].
For textile wastewaters, there are many applications of this process one of which was
investigated by Solmaz et al. [15], where it is mentioned in the ozonation costs part
of this chapter. Experiments were conducted with different FeSO4 and H2O2 dosages
for the wastewaters generated in a textile mill located in Bursa in order to determine
the best COD and color removal ratios. As a result of these experiments, removal
ratios for COD and Color were evaluated as 78 % and 95 %, respectively.
According to the abovementioned study, chemical costs for FeSO4.7H2O and H2O2
were estimated at 0.35 USD per kilogram and 0.51 USD per kilogram, respectively.
Moreover, operating cost for this Fenton oxidation process was determined
approximately as 0.59 USD. However, this cost figure did not include labour and
sludge disposal costs [15].
Another study available in the literature as regards, Fenton oxidation process was
discussed in North Carolina in 1998 in the “Color Reduction and Removal” Seminar
[18]. The aim of this seminar was to increase the importance of color issue among
textile companies and increase the sharing of information concerning color reduction
technologies. It was stated in this seminar that suitable color removal could be
accomplished by more powerful oxidizing methods than the biological treatment
systems. Fenton oxidation was discussed as one of these oxidizing methods. In the
seminar operating cost range for Fenton oxidation process was stated as between
0.76 USD/m3 and 1.63 USD/m3 [18].
16

Another environmental study using life cycle assessment (LCA) was carried out by
Montano et al. [19]. To reach color removal by applying different type of photo-
Fenton processes was the purpose of the study. In addition to this LCA, financial
analysis was performed for each of the Fenton process alternatives. In Table 2.4,
ferric sulfate and hydrogen peroxide costs can be seen according to the financial
analysis done in this study.
Table 2.4. Ferric sulfate and hydrogen peroxide unit costs [19]
Chemical
Cost
(EUR)
FeSO4 (kg) 0.25
H2O2 % 50 (kg) 0.22
In another study, Ustun et al. [20] worked on the treatment of the wastewater
generated from the Bursa Organized Industrial Zone and tested three different
processes which are Fenton oxidation, chemical coagulation, and ion exchange.
Industrial zone considered consisted of 200 factories most of which are textile mills.
Consequently, the wastewater characterization from the Zone had the same
characteristics with a typical textile wastewater. The main aim of the study was COD
and color removals from a wastewater flowrate of 48,000 m3/day having a COD in
the range of 113 mg/L to 149 mg/L. In the study, chemical coagulation and ion
exchange processes were applied after pre-treatment by Fenton oxidation process to
the wastewater. It was assessed that the optimum concentrations for FeSO4 and H2O2
were determined as 20 mg/L and 70 mg/L, respectively. As a result, unit operating
cost for Fenton oxidation process was estimated to be 0.124 EUR per each m3 of
wastewater treated. In addition to this, total operating cost that included all the
17

treatment processes such as coagulation, ion exchange, and Fenton oxidation was
determined as 2.54 EUR per m3 of wastewater where cost of sludge disposal was
evaluated approximately 1.20 EUR per m3 [20].
Furthermore, Philippe et al. [10] stated in another study that in South Africa, there
were many plants where Fenton processes were applied. They reported that in these
textile plants color removal is achieved by Fenton process whereas COD removal is
by activated sludge process. The average operating costs for these systems were
stated as 0.4 USD per m3 which did not include the sludge disposal cost.
According to the abovementioned literature review for the Fenton oxidation process,
chemical costs and operating costs for the application of this process can be
summarized as in Table 2.5.
Table 2.5. Fenton oxidation process – Typical operating costs
Chemical Costs
(USD)
Operating Costs
(USD/m3)
FeSO4 (kg) 0.35 – 0.38
H2O2 % 50 (kg) 0.33 – 0.51 0.40 – 1.63
2.1.2.3. Peroxone Process Costs
To obtain better treatment efficiency in the ozonation processes in order to increase
the formation of OH radicals, H2O2 is added into the systems. In other words, the
addition of both hydrogen peroxide and ozone to wastewater accelerates the
decomposition of ozone and enhances production of the hydroxyl radical [21]. As it
18

was stated previously, Solmaz et al. [15] studied ozonation process on the textile
wastewater. They also investigated the performance of the peroxone process with
respect to COD and color removal efficiencies. Different dosages of H2O2 (5, 10, and
25 mg/L) were applied to the wastewater in 15 minutes of contact time. The optimum
dosage was experimented on 5 mg/L with 54 % of COD removal and 99 % of color
removal. For this system, they also evaluated the operating cost as 5.02 USD per
each m3 of treated textile wastewater [15].
In a study conducted for a solid waste disposal site located in Tunis in Tunisia by
Tizaoui et al. [22], the treatment of leachate was investigated. In the study, the
influent COD was measured as 5,230 mg/L. With the application of peroxone
process, COD and color removal ratios were found as 48 % and 94 %, respectively.
An H2O2 dosage of 2,000 mg/L was experimented as the optimum dosage. In
addition, the operating cost per each kilogram of treated COD was evaluated as 2.3
USD [22].
2.1.3. Membrane Processes
The interest in the advanced treatments aimed at textile wastewater reuse has grown
sharply, especially to deal with problems of water shortages. Particularly, in some
industrial applications where water consumption is high, this wastewater reuse aspect
should be taken into account by the industrial sector. For that reason, various
treatment processes were studied and applied to investigate the possibility of textile
wastewater reuse. Within this research field, several experimental were performed
and, according to these experiences, membrane processes are the most promising
methods [23].
The main membrane filtration processes are microfiltration (MF), ultrafiltration
(UF), nanofiltration (NF), and reverse osmosis (RO). These pressure-driven
19

membrane processes use the pressure difference as a driving force to transport the
solvent (usually water) through the membranes. Particles and dissolved components
are partially retained on the membrane related to their properties such as size, shape,
and charge [24].
Another application of membrane separation processes is for the separation of
biomass after biological treatment. This is the membrane bioreactor process (MBR)
which is the combination of a biological treatment (activated sludge process) and
membrane filtration processes. This technology gets a favorable ranking throughout
the industrial wastewater treatment technologies due to its performance in treated
water quality or on wastewater reuse. In addition to the high effluent quality, these
systems are much more compact systems than the conventional biological treatment
systems applying sedimentation for solids separation after biological oxidation.
In the IPPC project, MF and NF processes were applied for dyeing wastewaters and
also for the whole wastewater mixture generated from the various processes carried
out in the selected textile mill. In addition, MBR system was investigated to treat the
mixed wastewater of the mill. In this part of the thesis, a short literature review is
presented regarding the investment and operating costs for membrane processes
considered in the selected mill.
2.1.3.1. Membrane Bioreactor (MBR) Costs
The first reported application of MBR technology was in 1969, when an UF
membrane was used to separate activated sludge from the final effluent of a
biological wastewater treatment system and the sludge was recycled back into the
aeration tank [25]. Today, MBR technology is widely applied not only for municipal
wastewaters, but also for some industrial wastewaters. This technology emerged as
an effective way of treating various forms of wastewater, as it is able to transform
20

even very difficult to treat wastewaters into high-quality effluent that is suitable for
reuse or for discharge into the environment.
There are many applications of MBR in textile industry one of which was performed
by Zheng et al. [26] in 2006 in China. Lab-scale MBR system was conducted to treat
the dyeing and printing wastewaters of a selected textile mill. Moreover, treatment
efficiencies and costs were determined.
The system had a flowrate of 240 m3/day. COD concentration was in the range of
128 mg/L – 321 mg/L. COD and color removal rates were experimented by Zheng et
al. [26] as 80 % and 60 %, respectively. In addition, two different membrane fluxes,
8 L/m2.hr and 10 L/m2.hr were applied to the system and financial analysis was
performed according to these fluxes.
In the financial analysis, membrane costs and non-membrane cost including
mechanical, electrical, civil investment costs were taken into account. On the other
hand, membrane replacement cost, labour cost, chemical, and energy costs were
assumed as the operating costs. In this analysis, non-membrane costs were
approximately assumed as the 70 % of the total investment costs. Table 2.6 shows
the investment and operating costs for the MBR system reported by Zheng et al. [26].
21

Table 2.6. MBR System Costs [26]
Membrane Flux (L/m2.hr)
8 10
Membrane Costs (USD) 18,150 14,500
Non-membrane Costs (USD) 33,850 33,850
Total Investment Costs (USD) 52,000 48,350
Operating Costs (USD/m3) 0.20 0.18
In another survey, Churchouse and Wildgoose [27] stated that membrane costs were
decreased to 60 USD per each m2 of membrane from 400 USD per each m2 between
the years 1992 and 2004 due to three reasons. The first reason was stated as the
increase in the flux value in the design. Secondly, membrane life expectancy
increased from 2 years to nearly 8 years. The final reason was increasing competition
among membrane producing companies.
Moreover, according to this study performed by Churchouse and Wildgoose [27],
Figure 2.5 shows the operating cost change between the years 1992 and 2004 of a
MBR plant with a capacity of 2,000 m3/day.
22

Figure 2.5. MBR operating cost change [27]
2.1.3.2. Membrane Filtration Costs
Membrane filtration processes are mainly used in the industrial wastewaters in order
to achieve wastewater treatment and reuse. The main industries that use membrane
filtration processes are pulp and paper industry, food industry, metal industry, and
textile industry.
For instance, in Egypt, Hafez et al. [28] performed a techno-economic study on food
industry by applying membrane separation technologies. They applied NF and RO
for a plant with 1,200 m3/day capacity. For this system, total investment cost was
evaluated as 254,000 USD whereas operating cost was 0.23 USD per m3 of
wastewater treated.
In 2005, European Union Association (EWA) [29] performed wastewater treatability
and wastewater reuse studies on textile wastewaters. NF and UF membranes were
used and evaluated in these studies. In terms of NF application for such systems,
23

treatment cost was determined in the range of 0.57 EUR per m3 and 0.63 EUR per
m3. However, this range was increased to the range between 0.67 EUR per m3 and
1.04 EUR per m3 in the case of UF application before NF [29].
Another NF process applied for textile wastewaters was conducted by Florio et al.
[30]. In this pilot-scale study, lifetime of mechanical equipment was assumed as 10
years whereas membrane lifetime was assumed as 3 years. For this system, operating
cost was evaluated as 0.60 EUR per m3 of wastewater.
MF was applied before NF in the study performed by Marcucci et al. [31]. The study
was applied on the biologically treated textile wastewater in order to reuse
wastewater in the production process. In the study, sand filtration, MF, and NF were
applied respectively to the wastewater with a flowrate of 1,500 m3/day. Depreciation
period was assumed as 3 years. As a result, unit operating cost for the application of
these three processes was estimated at 0.34 EUR per m3 of wastewater treated.
In a recent study by Guiziou et al. [32], the industrial use of soda cleaning-in-place
solution coupled with membrane regeneration was investigated and it has been
indicated that running and investment costs for MF, UF, and NF, systems are as
indicated in Table 2.7. As their target was to clean caustic solution to the critical
suspended solids concentration of less than 3 g/L, they reported that NF seems to be
the more appropriate operation.
24

Table 2.7. Investment and running costs for MF, UF, and NF [32]
Investment Costs
(EUR)
Running Costs
(EUR/year)
MF 71,530 9,856
UF 76,790 11,878
NF 108,380 15,754
In another survey, Gorenflo et al. [33] carried out NF application for conventionally
pretreated groundwater with elevated hardness and content of natural organic matter
in a German water treatment plant of the public works of Mainz. NF200B type of NF
membrane was used in the experiments. Cost calculations were also performed in the
scope of the study. For a wastewater capacity of 20,000 m3/day, the operating cost of
the NF plant was estimated at about 0.23 EUR per m3 of wastewater treated.
Bruggen et al. [34] performed a study on the application of NF for the removal of
pesticides, nitrate, and hardness form groundwater. In the first part of this study, the
removal of four pesticides, the removal of hardness and the removal of nitrates with
the membranes NF70, NF45, UTC-20 and UTC-60 were experimentally studied.
Then, in the second part, economic evaluations of the selected membranes were
indicated. Bruggen et al. [34] used the equations mentioned in Table 2.8 in order to
estimate the investment costs.
25

Table 2.8. Investment cost formulas for membrane filtration processes [34]
Cost component Formula
Civil investments (1)
Mechanical investments (2)
Membrane investments (3)
Additional investments Q: flowrate (m3/h) n: number of modules
In addition to the abovementioned investment cost equations, Bruggen et al. [34]
assumed some of the operating cost components which were maintenance costs,
quality control costs, and operation of the installation as 2 % of the total investment
costs. In addition to this, chemical costs were stated in the range between 0.020 EUR
to 0.025 EUR per m3 of filtrate.
26

CHAPTER 3
LEGISLATION BACKGROUND
3.1. Integrated Pollution Prevention and Control Directive
In the last decades, environmental problems increased substantially with the
intensification of urbanization and industrialization throughout the world. Therefore,
in order to protect the environment extensively and effectively, there arose a need for
a strategy targeting to an integrated prevention and control of pollution such as air
emissions, wastewater discharges, and solid wastes caused by industrial activities.
Within this respect, pollution prevention and control became one of the cornerstones
of the sustainable development [35]. For that reason, in the EU Member States, the
pollution generated from the industrial facilities is under management with an
integrated pollution management approach.
In the European Community’s Fifth Environmental Action Programme, adopted in
1993, it was stated that priority should be given to the integrated pollution control,
which would not only advance the resources and regenerative capacity of the nature
but also improve a more sustainable balance between human activity and socio-
economic development. As a result of this purpose, the IPPC Directive (96/61/EC)
was published in 1996, and has been implemented in all of the Member States since
October 2007 [1]. The reason why the Directive is implemented 10 years later than
the publication is to ensure that all other existing installations in the Member States
fully comply with the Directive in this transition period.
27

The IPPC Directive is based on four main principles, which are namely:
An integrated approach,
Best available techniques,
Flexibility,
Public participation.
The integrated approach means that the whole environmental performance of the
plant must be taken into account, covering such as emissions to air, water and land,
generation of waste, use of raw materials, energy efficiency, noise, prevention of
accidents, and restoration of the site upon closure [36].
At this point, the main objective of the IPPC Directive is “to prevent emissions into
air, water or soil wherever this is practicable, taking into account waste management,
and, where it is not, to minimize them in order to achieve a high level of protection
for the environment as a whole concerning an integrated approach” [1]. In order to
achieve this purpose, according to the Directive, Member States should take some
necessary precautions for the installations. These precautions are mainly;
Application of best available techniques for prevention of pollution;
Causing no significant pollution;
No waste production in accordance with Council Directive 75/442/EEC of 15
July 1975 on waste; where waste is produced, it is recovered or, where that is
technically and economically impossible, it is disposed of while avoiding or
reducing any impact on the environment;
Efficient usage of energy;
Prevention of accidents and limiting their consequences; and
Definitive cessation of activities.
28

If the installations comply with the abovementioned precautions, a permit is given to
the Member States by the competent authorities. Moreover, the IPPC permit is
classified into two by the Directive as permits for new installations and permits for
the existing ones. Both types of permits should include details of the integrated
environmental protection arrangements as stated in the Directive [1].
One of the most important requirements that the Directive indicates is the use of
“best available techniques” (BAT) for the integrated prevention and control of
environmental pollution. In the Directive, the BAT is defined as “the most effective
and advanced stage in the development of activities and their methods of operation
which indicate the practical suitability of particular techniques for providing in
principle the basis for emission limit values designed to prevent and, where that is
not practicable, generally to reduce emissions and the impact on the environment as a
whole”. The Directive also presents the explanation of “available techniques” as the
technically and economically implementable techniques for the relevant industrial
sector taking into account the costs and advantages [1].
The IPPC Directive also contains elements of flexibility by allowing the licensing
authorities, in determining permit conditions, to take into account:
the technical characteristics of the installation,
its geographical location and,
the local environmental conditions [36].
Furthermore, public participation is another important part of the Directive. Before
the competent authorities make their final decision for submission of permits, the
public should be informed on the new installation or the existing one, and the
measures taken in these installations. Therefore the public can comment on those
issues [1].
29

There are six main categories of industrial activities which are power plants,
production and processing of metals, mineral industry, chemical industry, waste
management and other activities mentioned in Section 6.2 of Annex 1 of the IPPC
Directive. For each of these activities, the IPPC Directive has Reference Documents
called as Best available Reference Documents (BREF) developed by technical
working groups providing supplementary information about the best available
techniques to be used in the relevant industrial activities.
According to the Directive and the Reference Documents, BAT corresponds to the
technologies, techniques, or organizational measures when implemented to an
industrial installation, procures with minimum environmental impact and acceptable
costs [1, 37]. In other words, before the decision of BAT, not only environmental
utilities, but also its economic benefits have to be taken into account. Therefore,
there exists a need for technical feasibility, environmental benefit, and economic
feasibility analyses in order to assess the BAT for each industrial sector.
The aforementioned BREFs act as valuable tools for providing relevant information
concerning best available techniques collected from a number of different sources.
These documents are intended to be used for the determination of BAT from the
technically implementable point of view. Moreover, since the best available
techniques change over time due to change in technology, these Reference
Documents are also reviewed and updated as appropriate [38].
As mentioned in the Article 9 (1) of the Directive, “the emission limit values and the
equivalent parameters and technical measures referred to in paragraph 3 shall be
based on the best available techniques, without prescribing the use of any technique
or specific technology, but taking into account the technical characteristics of the
installation concerned, its geographical location and the local environmental
conditions”. Briefly, the aim of BAT under the IPPC Directive is to take into account
30

the likely costs and benefits of measures as well as protecting the environment as a
whole to avoid creating a new or more serious problems when solving another. For
this purpose, in addition to the technical BREFs, there is another Reference
Document called as “Reference Document on Economics and Cross-Media Effects”
published in 2006 [1, 2].
Textile industry is one of the industries included in the activities mentioned in
Section 6.2 of Annex 1 of the IPPC Directive under “other activities” category. It is
indicated in the Directive that “plants for pre-treatment (operations such as washing,
bleaching, and mercerization) or dyeing of fibres or textiles where the treatment
capacity exceeds 10 tones per day” have to take permit according to the IPPC
Directive, and they have to implement best available techniques mentioned in the
Reference Documents in order to achieve a sound integrated pollution prevention and
control.
3.1.1. Reference Document on Economics and Cross-Media Effects
3.1.1.1. General Information
The scope of this Reference Document is to provide assistance to both technical
working groups preparing BREFs and industries need permits when considering
environmental and economic contradictions that can occur during the determination
of the techniques to be implemented under the frame of IPPC Directive. For the
decision of BAT, it needs to balance environmental impacts against the costs by
setting out a clear and transparent framework described in the methodologies given
in this document. On the other hand, “where there is an obvious conclusion or where
there is broad agreement as to which alternative is the preferred option for
implementation, then there will be no need to apply the methodologies set out in this
Reference Document” [2].
31

In this document, four core principles are discussed in different chapters;
Cross-media effects – Methodology for the determination of techniques to be
implemented under IPPC Directive offering the highest level of protection for
environment as a whole.
Costing methodology – Methodology needs to be done for the determination
of costs of techniques to be considered as BAT, since the Directive requires
technically and economically implementable techniques.
Evaluating the alternatives – Methodology to balance the economic costs
against the environmental benefits.
Evaluating the economic viability – Assessment of the economic viability of
the industrial sector implementing the selected techniques [2].
Consequently, this Reference Document discusses all the requirements stated in the
scope of the IPPC Directive. Within the framework of the implementation of the
IPPC Directive, the characterization of the techniques and the possible abatement
options are able to be done with regard to environmental benefits, technical
practicability and especially economic feasibility under the guidance of this
Reference Document.
3.1.1.2. Cross-Media Guidelines
The alternative techniques determined under the IPPC Directive should be taken into
consideration in terms of their environmental effects that need to be prevented, or
where this is impossible should be minimized in order to protect the environment as
a whole. Therefore, before the decision of the BAT, the determination of the least
32

environmentally damaging options should be analyzed according to some guidelines.
For this purpose, cross-media guidelines are represented in the Reference Document
on “Economics and Cross-Media Effects”. In other words, this document gives a
methodology for the choosing the best option for the environment. Furthermore, the
methodology described in this document is a truncated version of Life Cycle
Analysis, which has been adapted so that the assessment is restricted to the frame of
IPPC [2].
Mainly, four guidelines are discussed in order for the determination of the cross-
media effects of the alternative options selected for the relevant industrial
installation. These four steps of the methodology are:
Scoping and identification of the alternative options;
Inventory of emissions;
Calculation of the cross-media effects;
Interpretation of the cross-media conflicts.
The methodology for the cross-media effects is summarized in Figure 3.1. It is also
stated that at any of the cross-media determination step, if there is sufficient
justification to come to a conclusion, the justification of the decision should be
stopped and set out [2].
33

Figure 3.1. Chart for cross-media guidelines [2]
The first stage of the cross-media methodology is the identification of the
alternatives to be considered as best available techniques according to the
requirements stated in the IPPC Directive. The most important point in this stage is
that the alternative options should sufficiently be described in order to prevent any
ambiguity that can occur. Moreover, the size and capacity of the alternative proposal
should be fixed in order to compare these options under the same basis [2].
34

According to the methodology stated in the Reference Document on “Economics and
Cross-Media Effects”, the next stage is the presentation of the inventory of
consumptions and emissions. In other words, significant environmental releases and
the resources of each alternative option selected to be the best available technique
should be listed and quantified. This list should include the pollutants released from
the selected alternative options, raw materials that are consumed during the processes
including water consumption. In addition, energy used and wastes generated from the
mentioned alternatives should be stated in this stage.
The third stage of the methodology is the calculation of the cross-media effects. It is
stated that in order to assess the environmental effects for each alternative technique
under consideration, different pollutants generated from the selected alternatives
should be compared with respect to seven environmental themes. The themes are:
Human toxicity,
Global warming,
Aquatic toxicity,
Acidification,
Eutrophication,
Ozone depletion,
Photochemical ozone creation potential.
Based on each abovementioned theme, the effects of alternative options need to be
taken into account. Moreover, there may be effects in one medium such as only air or
water, or more than one medium such as water and air together. During the
assessment, in order to compare the effects, an equivalent reference substance
representing the pollution level should be chosen [2].
35

The final stage is the interpretation of the cross-media conflicts. According to the
results of the evaluations outlined in the cross-media methodology, comparisons of
the alternative options should be done as transparent as possible. Consequently, this
Reference Document gives a comprehensive methodology. However, it is not so
much exclusive for some of the individual cases concerned under IPPC Directive.
Since the Directive requires the consideration of some environmental issues, such as
noise, odour, vibration, and etc., there may be some additional factors that should be
taken into account in the assessment [2].
3.1.1.3. Costing Methodology
The IPPC Directive indicates that while determining the best available technique, not
only the option that has the lowest impact on the environment as a whole is decided
as BAT, but also the most economic option should be selected. As a result of this,
there exists a need for comparison of the costs of the alternative options in addition
to the cross-media assessment. The Reference Document on “Economics and Cross-
Media Effects” sets a framework for costing methodology.
As in the cross-media methodology, the first step to be done is scoping and
identifying the alternative options considered under the IPPC Directive. After the
identification stage, the cost data for each option need to be gathered and then
validated. In order to make the assessment as transparent as possible, the cost
components should be defined like investment costs, operating and maintenance
costs, revenues, benefits and avoided costs. In addition to these cost components, for
each alternative option considered, interest rates, discount rates, the economic
lifetime of the equipment and any scrap value that equipment might have should be
presented and processed. Consequently, the calculated costs by means of guidelines
stated above should be attributed to environmental protection. The abovementioned
steps of the costing methodology are given as a flow chart in Figure 3.2 below [2].
36

Figure 3.2. Chart for costing methodology [2]
It is seen from Figure 3.1 and Figure 3.2 that first steps of both the cross-media
methodology and the costing methodology are the same. However, more information
such as the technical specifications of the alternative options should be included in
the Guideline 5 in addition to Guideline 1. For instance, these technical
specifications can established as the expected technical and economic lifetime of the
equipment, operational data such as energy use, maintenance, water consumption,
and use of reagents. In this step, the performances or the efficiencies of the
alternative options considered should be indicated [2].
37

The aim of the second stage of the costing methodology is to gather the cost data
from different sources. These sources can be industries, technology suppliers,
authorities, consultants, research groups, published information, and etc. The data
should be stated clearly with introducing the source and year that is gathered from. In
the Reference Document, it is also stated that in order to describe the validity of the
data, quantitative ranges should be provided. If it is not possible, qualitative
indication can be used instead of quantitative ranges. Moreover, it is preferable to use
recent cost data.
Defining the cost components is another important stage in the methodology. Each
potential BAT that can be applied at a typical industrial installation is connected in
the economic assessment with a set of indicators reflecting the expected economic
costs and benefits from its introduction [39]. The Reference Document sets these
indicators as investment costs, operating and maintenance costs, benefits and
revenues, etc. Investment costs are mainly all the expenses due to civil, electrical,
and mechanical works of the BAT. In other words, expenditures for the purchase and
assembly of necessary BAT equipment are the main investment cost components.
Operating and maintenance costs, on the other hand, include the costs of annual
quantities of fuels, electricity, raw and auxiliary materials. In addition, costs of
consumables such as replacement parts necessary for BAT maintenance,
management and disposal of wastes caused by BAT, salaries of the personnel
responsible for the proper operation and maintenance of BAT are under the frame of
operating and maintenance cost aspects [2, 39]. The Reference Document states that
revenues, avoided costs and benefits should also be discussed separately from
investment expenditures or operating and maintenance costs in the costing
methodology for each potential BAT considered. Revenues may be the sales of
generated energy, heat, and treated effluent for irrigation, produced by-products by
applying the BAT, and are the residual value of equipment. On the other hand,
avoided costs are related to the recovery and reuse of materials as a result of potential
38
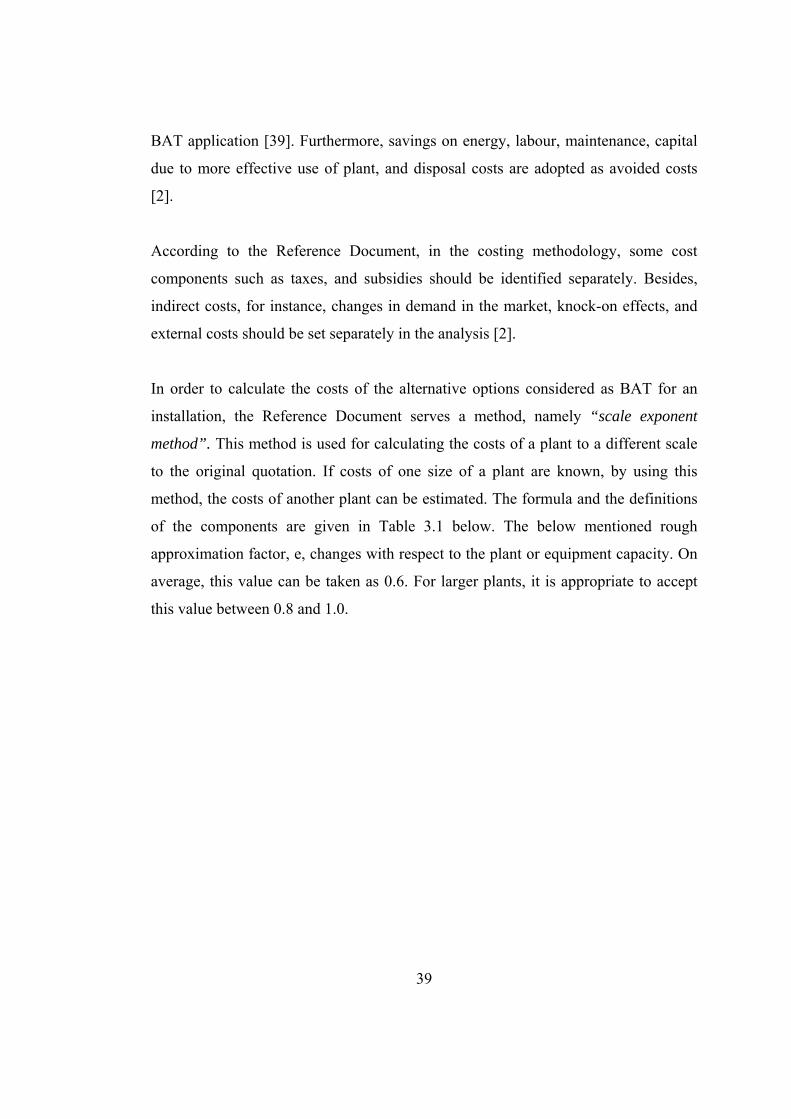
BAT application [39]. Furthermore, savings on energy, labour, maintenance, capital
due to more effective use of plant, and disposal costs are adopted as avoided costs
[2].
According to the Reference Document, in the costing methodology, some cost
components such as taxes, and subsidies should be identified separately. Besides,
indirect costs, for instance, changes in demand in the market, knock-on effects, and
external costs should be set separately in the analysis [2].
In order to calculate the costs of the alternative options considered as BAT for an
installation, the Reference Document serves a method, namely “scale exponent
method”. This method is used for calculating the costs of a plant to a different scale
to the original quotation. If costs of one size of a plant are known, by using this
method, the costs of another plant can be estimated. The formula and the definitions
of the components are given in Table 3.1 below. The below mentioned rough
approximation factor, e, changes with respect to the plant or equipment capacity. On
average, this value can be taken as 0.6. For larger plants, it is appropriate to accept
this value between 0.8 and 1.0.
39

Table 3.1. The Scale Exponent Method [2]
Formula
Cy cost of plant y
Cx cost of plant x
y scale of plant y (size or throughput)
x scale of plant x (size or throughput)
Definitions
e rough approximation factor
After gathering the cost components and validating them, the cost information should
be processed and presented. The original cost data should be expressed in the price
level of a common year. Discount rate is the rate at which future values are
discounted to present [40]. In other words, it can be considered as the opportunity
cost of capital [41]. During the costing of the alternatives, discount and interest rates
should be clearly stated with referencing and underlying all the assumptions made.
Moreover, the cost data should be calculated and presented as annual basis.
However, the costs for the industrial pollution control systems can be assessed by
calculating the cost per unit of product and the cost per unit pollutant reduced or
avoided. As a result, the affordability of the alternatives used can be compared with
the prices of the goods produced, and the cost-effectiveness of the techniques used
can easily be analyzed [2].
The last step of the costing methodology is the attributing the costs to environmental
protection. It should be clearly stated that the purpose of the alternative options to be
implemented is either for the reduction or prevention of the environmental pollution
or for other reasons such as investment expenditure in energy conservation or waste
minimization. Therefore, the differentiation should be done between those costs that
40

are offset by mentioned commercial benefits and those that can be attributed to
environmental protection [2].
3.1.1.4. Evaluation of the Alternatives
In accordance with the Reference Document on “Economics and Cross-media
Effects”, after the estimation of both the environmental effects and economic costs
for alternative techniques each of which is a potential for BAT, the comparison of
these alternatives should be done to determine which meet the BAT criteria.
Therefore, cost effectiveness of each alternative, apportionment of costs between
alternative, and balance between costs and environmental benefits should be assessed
[2]. The methodologies discussed previously are put together with the methodologies
about the evaluation of the alternative, and given in Figure 3.3.
Cost effectiveness analysis is a type of cost-benefit analysis which is more simplified
one as environmental benefits are quantified rather than valued. Cost effectiveness of
an alternative technique is defined typically as annual cost of the technique per
annual reduction of emissions due to application of that [2]. In the cost-benefit
analysis, on the other hand, the objective is to identify and monetize all the possible
impacts of the alternatives in order to determine the costs and benefits [41].
In addition to cost effectiveness analysis, while evaluating the alternatives, the
determined costs should be apportioned between pollutants. By implementing an
alternative, there may be a range of pollutants that will be reduced. Therefore,
apportioning of the costs between these pollutants will be essential. In order to do
this, IPPC Directive prefers a method of apportionment that the costs of the
alternative technique can be attributed in full to the pollution problem for which the
measure was originally intended [2].
41

Figure 3.3. Chart for evaluating the alternatives [2]
The third step in the evaluation of the alternatives is the balancing costs and
environmental benefits. The Reference Document sets methodologies on how to
assess cost effectiveness. In some of the Member States, i.e. Denmark, United
Kingdom, Sweden, Belgium, and etc., reference prices are used for the decision of
the BAT. Reference prices are useful for determining whether the alternative option
invested represents value of money, or not. If this value is known with attributing to
an environmental effect, then it can be used in accordance with the processes
mentioned in Figure 3.4 below.
42
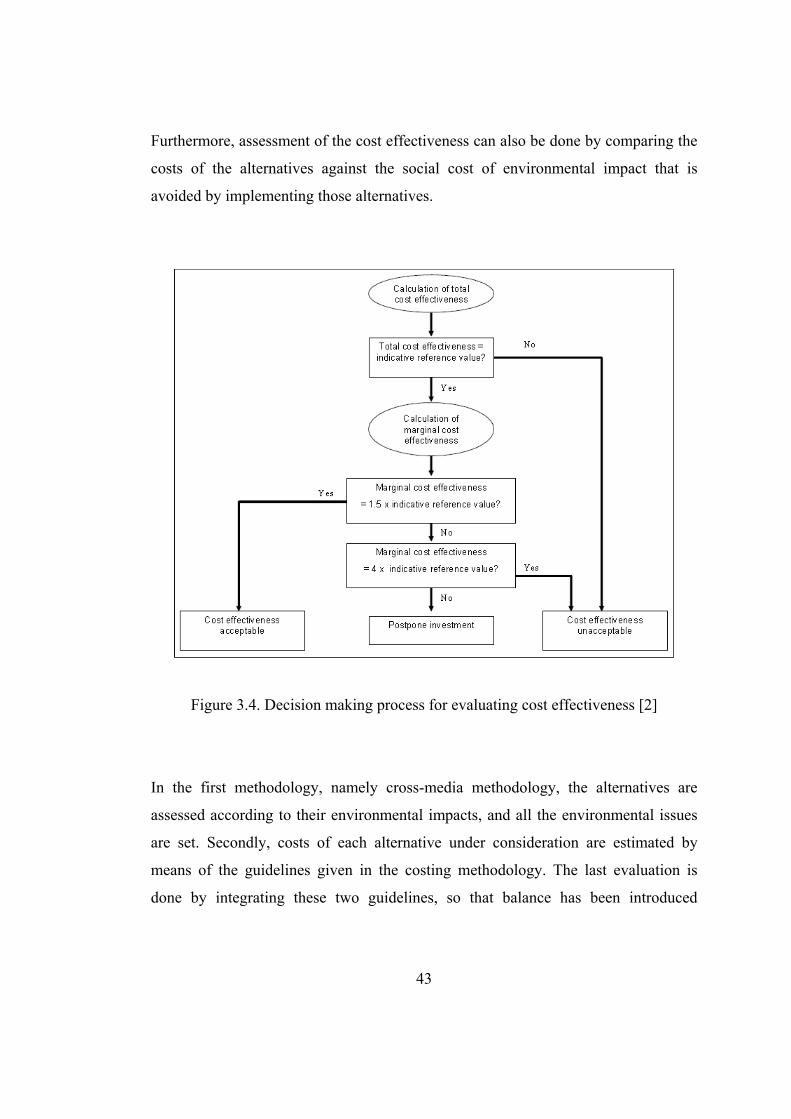
Furthermore, assessment of the cost effectiveness can also be done by comparing the
costs of the alternatives against the social cost of environmental impact that is
avoided by implementing those alternatives.
Figure 3.4. Decision making process for evaluating cost effectiveness [2]
In the first methodology, namely cross-media methodology, the alternatives are
assessed according to their environmental impacts, and all the environmental issues
are set. Secondly, costs of each alternative under consideration are estimated by
means of the guidelines given in the costing methodology. The last evaluation is
done by integrating these two guidelines, so that balance has been introduced
43

between the environmental benefits and the costs of the alternatives. In addition to
this, once the cost effectiveness of each alternative technique is determined and
ranked, it allows to make an objective justification for setting the best available
alternative.
3.1.1.5. Economic Viability in the Sector
As it is stated, the IPPC Directive concerns not only the technically applicable
alternative as BAT, but also the selected option should be economically viable for
the relevant industrial sector. Therefore, after having done cross-media analysis and
financial analysis for the alternative options that are potential of BAT, economic
viability in the sector should be assessed. For this purpose, a framework is provided
in the Reference Document mentioned as “Economic and Cross-Media Effects”.
According the Reference Document, the evaluation of the economical viability is
schematically assisted in Figure 3.5. Most important issues to be considered while
assessing the economic viability are:
Industry structure,
Market structure,
Resilience,
Speed of implementation [2].
44

Figure 3.5. Evaluation of economic viability in the sector [2]
The socio-economic characteristics of the sector and technical characteristics of the
installations in the sector can be described as industry structure. Before the
determination of the BAT, if there are any constraints for implementing considered
techniques, by understanding the industry structure, these constraints can be abated.
For this purpose, size and number of the plants in the sector to be considered,
technical characteristics of the installations, and equipment lifetimes of the plants
should be evaluated. For instance, since investment costs of equipment for the
implementation of BAT are generally high in value, it may be difficult for small
installation to handle it. In addition to this, the type of BAT will also affect the
infrastructure existing in the installation such that adopting BAT will impose
additional operating costs [2].
45

Market structure is the other issue to be considered for the economic viability in the
sector. Firstly, extent of the market is involved in the market structure assessment.
There exist local, regional, and global markets for commodities. It is important to
understand the market structure, as the power that the customer has over the price of
the commodity can be determined. Price elasticity, which it used for describing how
sensitive customers can change in price, is also significant such that if the prices are
elastic, it can be difficult to pass the prices on the customer, so any increase in costs
will affect the producer. Furthermore, competition between products is another factor
that should be taken into account in the market structure [2].
Another issue is the resilience which describes the ability of the sector to absorb the
increase in costs of implementing BAT, as viability remains constant. Some financial
indicators such as liquidity, solvency, and profitability are provided for this analysis.
Liquidity is the short-term measure that describes the ability of the company to pay-
off its immediate liabilities. On the other hand, solvency is the ability of the company
to fulfill its obligations in long term. Lastly, a measure of the profit margins that a
company enjoys can be described by the term profitability [2].
The Reference Document states that the speed of implementation of the BAT is one
of the most critical issues since the IPPC Directive sets time-scale for implementing
the BAT standards. Therefore, short-term, medium-term, and long-term time scales
should be considered in order to determine the speed of implementation.
46

CHAPTER 4
SELECTED MILL
The selected textile mill in this study is one of the largest companies in the World in
terms of denim production. The factory was established in 1953, in Kayseri, in the
Middle Anatolia Region of Turkey. It is an integrated establishment having yarn
production, dyeing, and finishing processes with an annual capacity of 20,000 tones
of cotton fiber, and 45 million meters of denim production. Yarns are produced from
cotton, and then undergo dyeing and sizing processes. After sizing process, weaving
process takes place in the production line. The final step is the finishing process that
serves to impart to the textile the desired end-use properties [22]. Through all these
wet processes in the mill, water is supplied from the wells with a daily consumption
of 5,000-7,000 tones per day. Water flow in the textile mill considered is as given in
Figure 4.1. Less than half of the abstracted water (2,000 – 2,800 tones per day) is
used in the production processes without any treatment. The rest (3,000 – 4,200 tones
per day) goes to softening by ion exchange process. The softened water from the ion
exchangers is diverted to the production processes. Moreover, approximately 40 % of
the softened water from ion exchangers is transferred to the reverse osmosis system
where water is deionised. Then, the deionised water is utilized in the cogeneration
plant for steam generation. Softened water for the ion exchange process is mostly
used in dyeing, sizing and finishing processes which are accepted as wet processes.
In the mill, there exists a wastewater treatment plant applying an activated sludge
process. Wastewater generated from the sizing, dyeing, and finishing processes and
47

also from all the facilities in the factory are treated and then discharged into the
sewage system of the Kayseri Water and Sewage Authority (KASKI) with the
compliance of the discharge standards.
As indicated in Chapter 1, in the project entitled as “Adaptation of IPPC Directive to
a Textile Mill in Turkey”, water recovery studies for the dyeing wastewaters and
wastewater treatability studies for the wastewater generated from all of the processes
of the mill were conducted. In the proceeding section, a short summary of the studies
conducted to investigate the possible alternatives to recover water from wastewater
discharges is presented. All of these treatability studies targeting at both water
recovery and wastewater treatment are summarized in the following sections of this
chapter indicating the water quality achieved in comparison to the discharged
standard or water reuse quality criteria.
48

Figure 4.1. Water flow in the selected mill (as of 2005)
49

4.1. Water Recovery Studies
In water recovery studies, different alternatives were developed to treat the
wastewater generated in the dyeing unit of the selected mill, targeting at water
recovery. The reason why dyeing unit was selected for the water recovery studies is
the high wastewater flowrate. For this purpose, coagulation, membrane filtration,
ozonation, and Fenton oxidation processes were applied to the dyeing wastewaters.
These processes were investigated either as pre-treatment or treatment with the target
of water reuse. Sustainable consumption of natural resources is in accordance with
the main principles of the IPPC Directive.
In the proceeding sections, these process alternatives are discussed as regards their
performance in achieving the desired water quality.
4.1.1. Coagulation as a Pre-treatment for Dyeing Wastewaters
Coagulation process was evaluated as pre-treatment alternative for dyeing rinsing
wastewaters before the application of NF process in order to obtain reusable water.
This process was applied to the rinsing wastewaters of the most-widely used dyeing
recipes, individually and also to the mixed wastewater from the application of these
recipes. Table 4.1 presents the characteristics of the abovementioned wastewaters. As
shown, dyeing wastewater belonging to all recipes and consequently their mixture
are very high in color and COD. In the coagulation experiments run for these
wastewaters, the effluent quality presented in Table 4.2 was obtained. In these
experiments, alum (Al2(SO4)3.18H2O) and ferric chloride (FeCl3.6H2O) were used as
coagulants at about 1,000 mg/L of dosages.
50

Table 4.1. General characteristics for wastewaters of the most-widely used recipes
and their mixture
Parameters Recipe 1 Recipe 2 Recipe 3 Mixture
COD (mg/L) 841-1,096 1,571-1,787 348-1,178 929-1,263
Color (Pt-Co) 5,593-6,460 8,600-10,660 1,255-5,070 5,120-6,850
Table 4.2. Coagulation experiments results
Coagulant Type Effluent COD
(mg/L)
COD Removal
(%)
Alum 370-429 49-56 Recipe 1
Ferric chloride 328-362 57-61
Alum 1,447-1,465 18-19 Recipe 2
Ferric chloride 1,197-1,233 31-33
Alum 198-202 42-43 Recipe 3
Ferric chloride 198-205 41-43
Alum 520-539 42-44 Mixture
Ferric chloride 465-483 48-50
As presented in Table 4.2, in coagulation experiments, it was seen that color and
COD removal were achieved at high coagulant dosages. Therefore, operating costs of
the process will be high due to chemical requirement and also the sludge problem
that can be occur as a consequence of the chemical usage. As a result, coagulation
process as pre-treatment alternative was found to be not an efficient and effective
51

method. In other words, it comes to be not a proper and economical alternative for
dyeing wastewaters.
4.1.2. Membrane Filtration for Dyeing Wastewaters
The other process applied to dyeing wastewaters in order to satisfy water recovery
was the membrane filtration processes. MF, UF, and NF processes were applied to
dyeing wastewaters prior to NF as coagulation.
In these studies, treatability and recovery of the wastewaters from the first post-
rinsing stage, composite wastewaters from all post-rinsing stages, wastewaters of the
most-widely used recipes and the wastewater generated from the mixture of these
recipes by membrane filtration processes were investigated. All these wastewaters
had different characteristics. Table 4.1 shows the characterization of the wastewaters
of the most-widely used recipes and their mixture. Moreover, COD (mg/L) and color
(Pt-Co) values for the wastewaters from the first post-rinsing stage and composite
wastewaters from all post-rinsing stages of dyeing are presented in Table 4.3.
Table 4.3. General characteristics for wastewaters from the first post-rinsing stage
and composite wastewaters from all post-rinsing stage
Parameters First
post-rinsing stage
Composite from all
post-rinsing stage
COD (mg/L) 1,547-1,635 853-870
Color (Pt-Co) 4,824-4,950 2,980-3,100
52

From the experiments, it was determined that MF should be chosen as pre-treatment
process before NF. NF was applied as the main treatment process. According to the
results of these sequential applications of MF and NF, COD and color removal are as
presented in Table 4.4. These removal efficiencies were achieved with an
approximate permeate flux of 40 L/m2/hr.
Table 4.4. COD and color removal from the first post-rinsing stage and composite
wastewaters from all post-rinsing stage, and the most-widely used recipes
Parameters
First
post-rinsing
stage
(%)
Composite from
all
post-rinsing
stage
(%)
Most-widely
used recipes
(%)
COD 92 93 95-97
Color 93 98 98-99
4.1.3. Ozonation for Dyeing Wastewaters
Wastewaters generated from the mixture of the most-widely used recipes were
subjected to ozonation process. As in the previous studies, wastewater
characterization experiments were initially performed. The results of these
characterization studies are given in Table 4.5.
53

Table 4.5. General characteristics for wastewaters subjected to ozonation process
Parameters Wastewater
COD (mg/L) 4,560-6,120
Color (Pt-Co) 715-942
During the ozonation tests, optimum ozone dosage and contact time needed for the
maximum removals of COD and color were determined. At the end, it was
determined that in order to reduce each gram of COD, ozone requirement is 1.67
grams. This dose was the optimum dose that provides the best removal of COD and
color. In Table 4.6, the COD and color removals achieved as a result of the ozonation
process are presented. Although COD and color removals achieved were proper
enough, conductivity of the treated wastewater remained constant at a value of 7,000
µS/cm, which is not satisfactory for reuse. Therefore, ozonation was found to be not
a suitable alternative for water recovery from dyeing wastewaters.
Table 4.6. COD and color removal from wastewaters subjected to ozonation process
Parameters Removal Ratios
(%)
Effluent Quality
COD 60 1,824-2,448 (mg/L)
Color 95 35.8-47.1 (Pt-Co)
54

4.1.4. Fenton Oxidation for Dyeing Wastewaters
Fenton oxidation process was the last treatment alternative applied to the dyeing
wastewaters in order to satisfy water recovery. Ferric sulfate and hydrogen peroxide
were dosed to the samples in different ranges of concentrations. Wastewater
characteristics of the samples used in these experiments are illustrated in Table 4.7.
Table 4.7. General characteristics for wastewaters subjected to Fenton oxidation
process
Parameters Wastewater
COD (mg/L) 2,453
Color (Pt-Co) 15,670
Fenton oxidation process provided a partially effective treatment and, COD and color
removals of 87 % and 98 %, respectively, were achieved. However, the
corresponding effluent quality was not satisfactory in meeting the wastewater reuse
standards (Appendix A). In addition to this, the usage of ferric sulfate caused high
amount of sludge production due to precipitation. Moreover, it was investigated that
COD and color removal ratios would change due to the change in the wastewater
characterization. Therefore, Fenton oxidation process found technically unacceptable
for dyeing wastewaters for the purpose of water recovery.
55

4.2. Prioritization of Applicable Water Recovery Alternatives
The abovementioned water recovery studies are summarized in the Table 4.8 as
regards their COD and color removal efficiencies and also water recovery
performance, sludge generation and clogging problem if there exists.
Table 4.8. Summary for water recovery studies
Criteria Coagulation MF + NF Ozonation Fenton
oxidation
COD
removal
At high coagulant
dosage 95 % 60 % Not flexible
Color
removal
At high coagulant
dosage 98 % 95 % 98 %
Water
recovery None 70 % None None
Sludge
problem High Low Low High
Clogging
problem None High None None
As stated in Table 4.8, the highest COD removal was achieved by the application of
membrane filtration processes. On the other side, all of the alternatives had color
removals at high percentages. However, water recovery was satisfied only through
the membrane filtration process. Moreover, in coagulation and Fenton oxidation
processes, there exists sludge problem due to chemical usage. The other problem
56
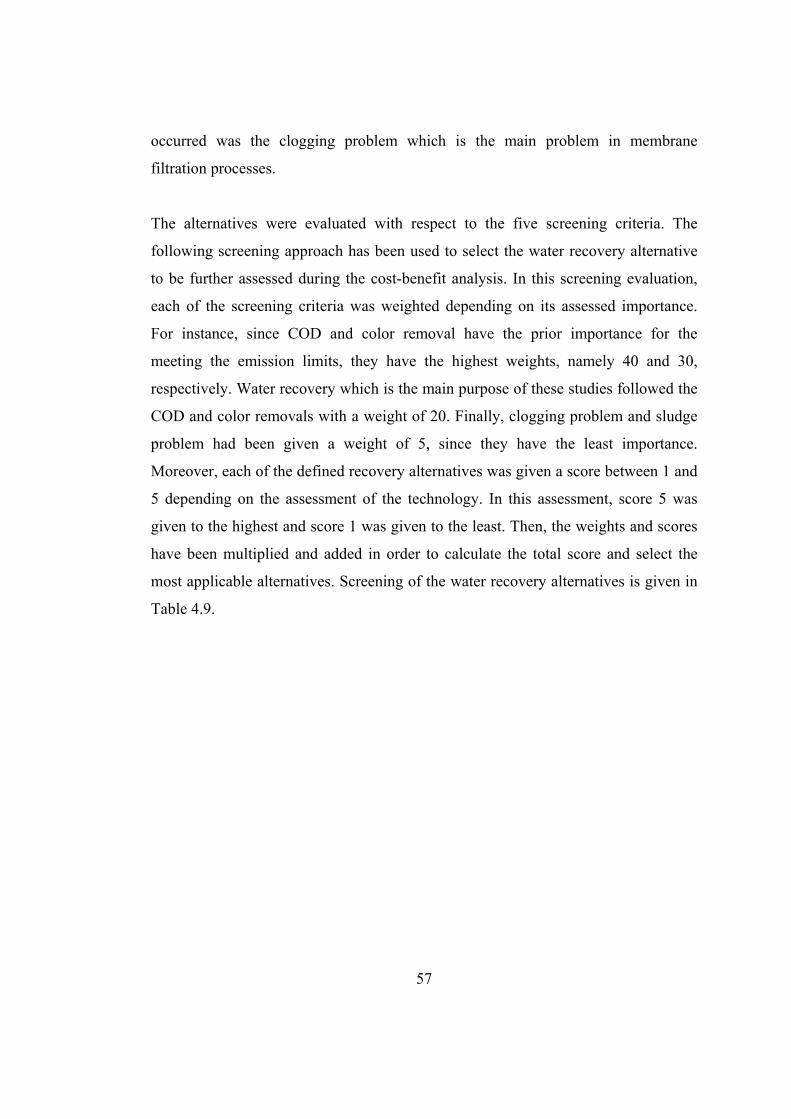
occurred was the clogging problem which is the main problem in membrane
filtration processes.
The alternatives were evaluated with respect to the five screening criteria. The
following screening approach has been used to select the water recovery alternative
to be further assessed during the cost-benefit analysis. In this screening evaluation,
each of the screening criteria was weighted depending on its assessed importance.
For instance, since COD and color removal have the prior importance for the
meeting the emission limits, they have the highest weights, namely 40 and 30,
respectively. Water recovery which is the main purpose of these studies followed the
COD and color removals with a weight of 20. Finally, clogging problem and sludge
problem had been given a weight of 5, since they have the least importance.
Moreover, each of the defined recovery alternatives was given a score between 1 and
5 depending on the assessment of the technology. In this assessment, score 5 was
given to the highest and score 1 was given to the least. Then, the weights and scores
have been multiplied and added in order to calculate the total score and select the
most applicable alternatives. Screening of the water recovery alternatives is given in
Table 4.9.
57

Table 4.9. Prioritization of water recovery alternatives – Estimated scores
Criteria Weight Coagulation MF +
NF Ozonation
Fenton
oxidation
COD
removal 40 1 5 3 2
Color
removal 30 1 5 5 5
Water
recovery 20 0 5 0 0
No
sludge
problem
5 0 5 5 0
No
clogging
problem
5 5 1 5 5
TOTAL
(weight x
score)
100 0.95 4.80 3.20 2.55
As presented in Table 4.9, as a result of the prioritization study or scoring, membrane
filtration which is composed of MF plus NF and ozonation processes appeared to be
the most applicable alternative technologies pertinent for water recovery from dyeing
effluents. These two alternatives should be assessed further in the cost-benefit
analysis for the selection of BAT.
58

4.3. Wastewater Treatability Studies
In the project, wastewater treatability studies were conducted for the wastewaters
coming from all the units of the textile mill. In these studies, eight different treatment
options were considered in both lab-scale and pilot-scale. These treatment
alternatives are;
Biological Treatment followed by MF and NF
Membrane Bioreactor
Ozonation
Ozonation with Hydrogen Peroxide
Biological Treatment followed by Ozonation
Fenton Oxidation
Biological Treatment followed by Fenton Oxidation
Biological Treatment followed by Fenton Oxidation and then MF.
In this part of this thesis, outputs of the abovementioned processes are described one
by one.
4.3.1. Biological Treatment Followed by MF and NF for Mixed Wastewaters
As it was mentioned before, the factory has its own wastewater treatment plant
consisting of an activated sludge system in order to treat the mixed wastewaters from
all processes. The treatment plant had been designed with a capacity of 3,600 m3/day
of flowrate. The design criteria of this wastewater treatment plant are given in
Appendix B.
Treated effluent from the activated sludge unit is discharged into the sewerage
system of the Kayseri Water and Sewage Authority (KASKI) according to the
59

discharge standards (Table 4.10). The selected textile mill satisfies the discharge
standards. These standards are given in Table 4.10.
Table 4.10. Discharge standards of KASKI
Parameters Design Criteria
COD (mg/L) 800
BOD (mg/L) 250
TSS (mg/L) 350
Total nitrogen (mg/L) 40
Total phosphorus (mg/L) 10
Oil and grease (mg/L) 100
Sulphide (mg/L) 2
Phenol (mg/L) 10
pH 6-10
As can be seen from the Table 4.10, color is not a parameter that is taken into
account during discharges. However, it is the one of the most important parameters
in the water reuse standards (Appendix A). Therefore, NF was applied to the
wastewater generated in the textile mill considered with a pre-treatment of MF in
lab-scale. Wastewater taken from the entrance of the wastewater treatment was
initially characterized. The characteristics are presented in Table 4.11.
60

Table 4.11. General characteristics for wastewaters subjected to biological treatment
followed by MF and NF
Parameters Wastewater
COD (mg/L) 2,580-2,780
Color (Pt-Co) 2,605-2,855
It was investigated from this study that biological treatment followed by membrane
filtration processes can meet the reuse criteria. According to the aforementioned
study, COD and color removal were achieved as approximately 90 % and 100 %,
respectively with a flux value of 37 L/m2/hr. Consequently, reuse potential for such
treated wastewaters is very high.
4.3.2. Membrane Bioreactor for Mixed Wastewaters
In this project entitled as “Adaptation of IPPC Directive to a Textile Mill in Turkey”,
the performance of a pilot-scale MBR system for the treatment of the mixed
wastewater from the wet processes (dyeing, finishing, and sizing) of the mill was
investigated [42] The MBR system, containing a submerged hollow fibre membrane
module in the aeration tank, was operated aerobically for about three months on-site
at a continuous mode. The system was operated with a typical permeate flux of 15
L/m2/hr.
During the entire MBR operation, the characteristics of influent wastewater was
quite variable due to the variations in the textile production program and break offs
during weekends for cleanings, etc. [42] (Table 4.12).
61

Table 4.12. General characteristics of the influent wastewater to the pilot-scale MBR
system
Parameters Wastewater
COD (mg/L) 1,411
Color (Pt-Co) 2,447
BOD (mg/L) 455
As presented in Table 4.12, despite the high and variable BOD and COD
concentrations in the influent, very high organic removals were obtained (Table
4.13). Moreover, MBR system has provided very high color removals. Throughout
the entire operation, the average effluent color level was 53 Pt-Co which is well
above the level achievable by activated sludge process.
Table 4.13. The performance of the MBR system
Parameters Removal Ratios
(%)
Permeate Quality
COD 97 37 (mg/L)
Color 98 53 (Pt-Co)
BOD 97 15 (mg/L)
62

4.3.3. Ozonation for Mixed Wastewater
Ozonation process was applied to the textile wastewaters in three different ways.
Firstly, ozonation was considered as pre-treatment technique before activated sludge
process and practiced for the mixed wastewater or for the wastewater generated from
all of the stages of the textile mill. Secondly, hydrogen peroxide assisted ozonation
process namely peroxone process was evaluated experimentally before the activated
sludge system again. The purpose of these two applications was to increase the
biodegradability of the mixed wastewater before activated sludge system and or to
decrease toxicity. The final alternative was the post-ozonation alternative where
ozonation was experimented after the biological treatment.
First series of ozonation and peroxone experiments were applied to the wastewater
samples having the same characteristics in order to be able to assess the benefit of
additional hydrogen peroxide application. The characteristics of the wastewater used
in these experiments are presented in Table 4.14.
Table 4.14. General characteristics for the wastewaters subjected to ozonation and
peroxone tests
Parameters Wastewater
COD (mg/L) 2,680-2,840
Color (Pt-Co) 3,920-4,200
Optimum ozone dosage was evaluated as 2.33 grams per each gram of COD
removed. On the other hand, optimum hydrogen peroxide dosage was determined as
1,500 mg/L. However, during the experiments, no significant effect of hydrogen
63
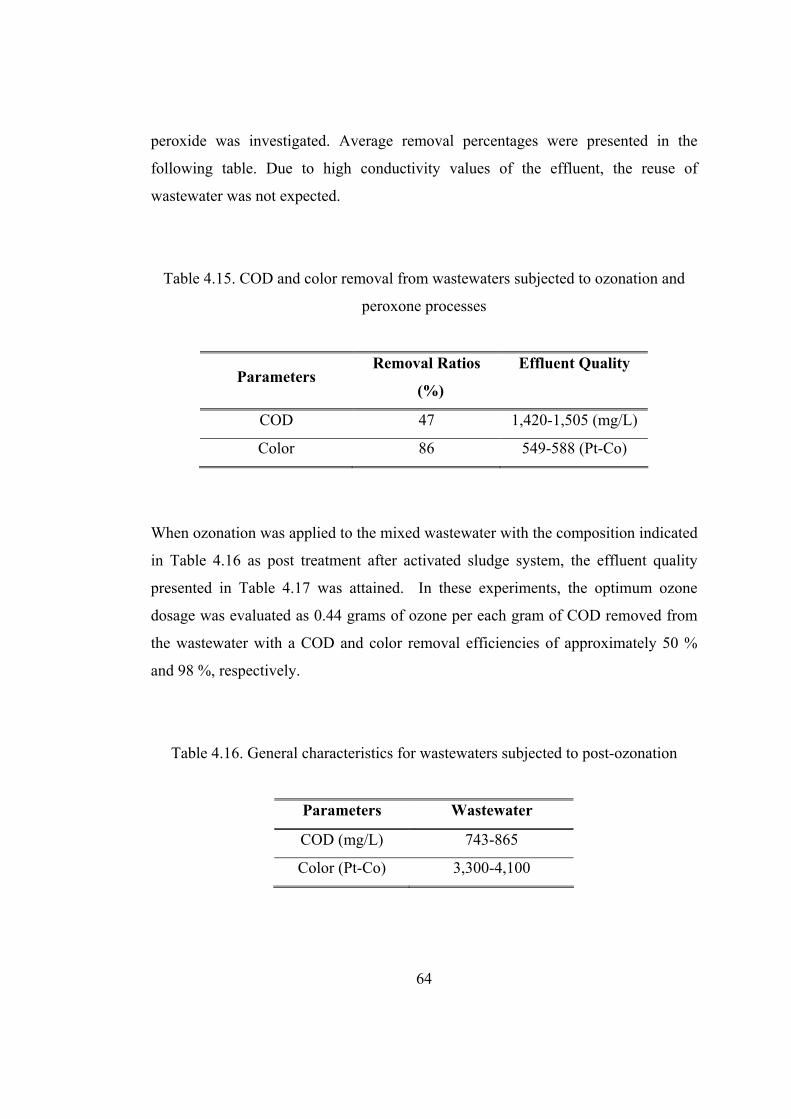
peroxide was investigated. Average removal percentages were presented in the
following table. Due to high conductivity values of the effluent, the reuse of
wastewater was not expected.
Table 4.15. COD and color removal from wastewaters subjected to ozonation and
peroxone processes
Parameters Removal Ratios
(%)
Effluent Quality
COD 47 1,420-1,505 (mg/L)
Color 86 549-588 (Pt-Co)
When ozonation was applied to the mixed wastewater with the composition indicated
in Table 4.16 as post treatment after activated sludge system, the effluent quality
presented in Table 4.17 was attained. In these experiments, the optimum ozone
dosage was evaluated as 0.44 grams of ozone per each gram of COD removed from
the wastewater with a COD and color removal efficiencies of approximately 50 %
and 98 %, respectively.
Table 4.16. General characteristics for wastewaters subjected to post-ozonation
Parameters Wastewater
COD (mg/L) 743-865
Color (Pt-Co) 3,300-4,100
64

65
Table 4.17. COD and color removal from wastewaters subjected to post ozonation
Parameters Removal Ratios
(%)
Effluent Quality
COD 50 372-433 (mg/L)
Color 98 66-82 (Pt-Co)
4.3.4. Fenton Oxidation for Mixed Wastewater
In this part of the wastewater treatability studies, Fenton oxidation processes were
experimented in lab-scale. Similar to the ozonation processes, there were three
different treatment alternatives of Fenton oxidation processes applied. These were
Fenton oxidation for the wastewaters of the textile mill considered, Fenton oxidation
after the activated sludge system, and Fenton oxidation followed by MF after
activated sludge system. In all of these experiments, Fenton oxidation processes were
found impractical due to high amount of sludge generated from the system.
4.4. Prioritization of Applicable Wastewater Treatability
Alternatives
In this part of the thesis, the abovementioned wastewater treatability alternatives are
summarized in the Table 4.18.
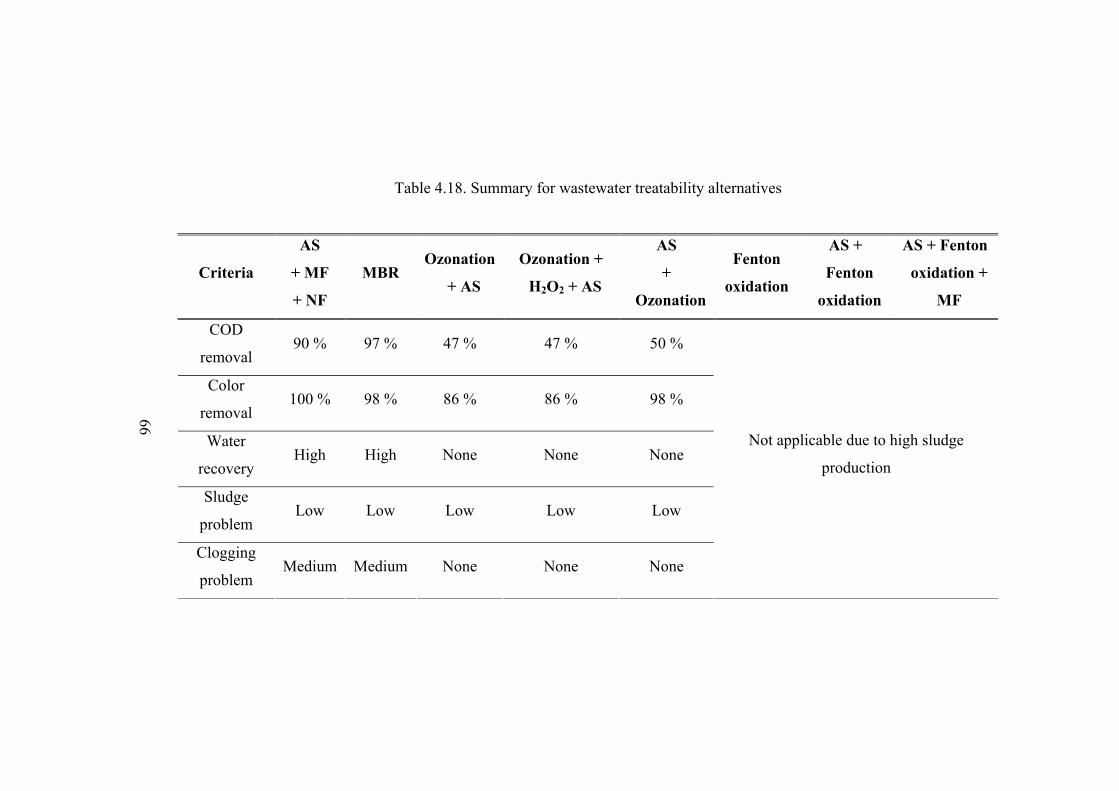
Criteria
AS
+ MF
+ NF
MBR Ozonation
+ AS
Ozonation +
H2O2 + AS
AS
+
Ozonation
Fenton
oxidation
AS +
Fenton
oxidation
AS + Fenton
oxidation +
MF
COD
removal 90 % 97 % 47 % 47 % 50 %
Color
removal 100 % 98 % 86 % 86 % 98 %
Water
recovery High High None None None
Sludge
problem Low Low Low Low Low
Clogging
problem Medium Medium None None None
Not applicable due to high sludge
production
Table 4.18. Summary for wastewater treatability alternatives
66

The same screening methodology was not performed for the wastewater treatability
alternatives since similar results were found for each of the alternatives excluding
Fenton processes. Therefore, the first five alternatives were assessed in the cost-
benefit analysis.
67
CHAPTER 5
COST AND BENEFIT ANALYSIS
In this chapter, under the framework of the Reference Document on “Economics and
Cross-Media Effects”, both water recovery alternatives and wastewater treatability
alternatives are analyzed in terms of their environmental performances or cross-
media effects and financial values.
As water recovery alternatives, NF with MF pretreatment and ozonation processes
will be evaluated since these options are selected as the technically applicable ones.
On the other hand, as for the treatment of the mixed wastewater; activated sludge
process, MBR technology, ozonation and peroxone processes ozonation after
activated sludge process, and finally MF + NF after activated sludge process will be
evaluated.
5.1. Assumptions
Textile wastewater is one of the industrial wastewaters that are very difficult to treat
satisfactorily, due to various raw chemicals (such as dyestuffs, auxiliaries and
inorganic salts) employed in textile manufacturing. These wastewaters are generally
with intense color, high concentration of organic compounds, the large variations in
composition [43]. As it was mentioned in the previous chapter, wastewater from the
mill at which the present study was conducted was highly variable in composition in
agreement with the expected characteristics.
68

As it is mentioned in Chapter 3, according to the BREF, in order to compare the
alternatives under the same basis, sizes and capacities of the selected alternatives
should be fixed [2]. For this purpose, wastewater characterizations for dyeing
wastewaters, wastewaters before and after the activated sludge system are assumed
as it is stated in the Table 5.1. The assumptions are made according to the average
COD and color levels determined in the previous phases of the Project.
Table 5.1. General characteristics of the wastewaters used during the cost-benefit
analysis
Parameters Dyeing
Wastewaters
Wastewaters
before Activated
Sludge System
Wastewaters
after Activated
Sludge System
COD (mg/L) 1,200 1,800 800
Color (Pt-Co) 5,000 3,800 2,100
Another major assumption is made for the water recovery percentage. In the Project,
one of the tasks undertaken was the determination of the wastewater distribution
among the various process streams. Waste streams’ flowrates were evaluated before
and after the in-plant control activities which were the water recovery from dyeing
wastewaters and caustic recovery from finishing wastewaters. The evaluated
wastewater distributions are given in Table 5.2 [44]. While determining the
following distributions, it was assumed that water recovery was achieved.
69

Table 5.2. Wastewater distribution among the process streams
Process stream
Before
in-plant control
(%)
After
in-plant control
(%)
Dyeing wastewaters 35 24
Finishing wastewaters 45 31
Other wastewaters 20 45
According to the abovementioned wastewater distributions before and after the in-
plant control studies, if it is assumed that the percentage of the other wastewaters
such as sizing wastewaters was not changed, then it can be calculated that the water
recovery from dyeing wastewater is approximately 70 %. For this reason, during the
cost-benefit analysis for water recovery studies and wastewater treatability studies,
water reuse percentage was taken as 70 %. In other words, in all the treatment
alternatives by which water reuse is satisfied, permeate was assumed as 70 % of the
influent wastewater, whereas retentate was about 30 % of the influent.
In this project, all the alternatives were performed in lab-scale or pilot scale.
Therefore, in the costing analysis, the values such as flux values, optimum dosages
found in the experiments will be used as they can be applied in full-scale.
5.2. Analysis of Water Recovery Studies
The first alternative is NF with a MF pre-treatment, and the second one is one of the
advanced oxidation processes, namely ozonation. In this part of this thesis study,
these alternatives will be compared with respect to their environmental effects and
70

costs under the guidance of the Reference Document. In the analysis, dyeing
wastewater flowrate was taken as 1,140 m3/day (Figure 4.1).
5.2.1. Environmental Effect Analysis
5.2.1.1. Identification of the Alternatives
According to the Reference Document, the initial step of the analysis is the cross-
media effect determination. Cross-media effect guidelines given in the previous
chapter were adopted for each of the alternatives considered. The first stage of the
cross-media methodology is the identification of the alternatives. The alternatives
and their performances are given in Table 5.3.along with assumptions made. Influent
COD concentration and influent color concentration was assumed as the average
values gathered from the experimental studies.
Table 5.3. Identification of the water recovery alternatives
Alternative
Options
Influent
COD
(mg/L)
Influent
Color
(Pt-Co)
COD
Removal
(%)
Color
Removal
(%)
Water
Recovery
(%)
MF + NF 1,200 5,000 95 98 70
Ozonation 1,200 5,000 60 95 -
71

5.2.1.2. Inventory of Consumptions and Emissions
The presentation of the inventory of consumptions and emissions is the next step. For
this purpose, energy consumption of each alternative was determined at first. These
determinations were made based on the literature values. The specific energy
consumption values of the alternative are presented in Table 5.4.
Table 5.4. Energy consumptions of the water recovery alternatives [45]
Alternatives Specific energy
consumption
Energy
Consumption
(kWh)
MF (kWh/m3) 0.40
NF (kWh/m3) 5.30
Membrane Filtration Total 5.70 6,498
Ozonation (kWh/kg ozone) 13.20-19.80
(16.5*)
37,650
*Specific energy consumption considered in estimations
By using the specific energy consumption figures, electricity to be used for the
alternatives were estimated. As can be depicted from Table 5.4, estimated energy
consumption figures are 6,498 kWh per day for membrane filtration (MF+NF) and
37,650 kWh per day for ozonation based on an average specific energy consumption
of 16.5 kWh/kg ozone. The difference between the energy consumptions is nearly six
times. This is primarily due to the high energy need for ozone generation. On the
other hand, membrane filtration operations need energy only for their pumping
equipments.
72

The Reference Document also requires the assessment of the environmental impacts
of energy generation. In order to evaluate these impacts, in Annex 8 of the Reference
Document, multiplication factors that have been derived for the emissions of SO2,
CO2, and NO2 and also for the consumption of oil, gas, and coal per GJ of electricity
generation are given. According to the document, for the Europe, the average fuel
use and emissions released to generate 1 GJ of electricity are as listed in Table 5.5.
Table 5.5. Average fuel use and emissions released to create 1 GJ of electricity [2]
Type Unit Value
Primary energy GJ 2.57
Oil kg 9.01
Gas m3 6.92
Coal kg 15.7
Fuel
Brown coal kg 34.6
SO2 kg 0.10
CO2 kg 117 Emissions
NO2 kg 0.16
By using the abovementioned multiplication factors, emissions of SO2, CO2 and NO2
from the alternatives considered for water recovery were calculated and the results
given in the Table 5.6 were obtained. As can be seen from the table, estimated mass
generations of SO2 and NO2 were negligible as compared to the mass generation of
CO2. Therefore, only the estimated mass of CO2 emission was considered as the
mass of pollutant released to the air (Table 5.7). Since the energy used in the
ozonation process was higher than the energy used in membrane filtration processes,
73

indirect emissions due to the application of ozonation were found to be higher than
the ones for the other processes. (In these calculations, 1 GJ was taken as 277.78
kWh).
Table 5.6. Calculated emission values released from the alternative options
Alternative options Type Unit Value
SO2 kg/day 2.34
CO2 kg/day 2,737 MF + NF
NO2 kg/day 3.74
SO2 kg/day 13.54
CO2 kg/day 15,846 Ozonation
NO2 kg/day 21.67
Table 5.7. Mass of pollutants released to air
Alternative Options Mass of pollutant
(kg/day)
MF + NF 2,737
Ozonation 15,846
Additionally, the effluents from membrane filtration process are planned to be reused
in the dyeing stage in the textile mill. In addition to this, the rejected stream which
appeared as 30 % of the effluent from the membrane filtration process would be
treated in the existing wastewater treatment plant of the textile mill considered.
74

Therefore, mass of pollutants released to aquatic environment from membrane
filtration alternative would not be directly from the membrane filtration processes, it
would be released due to the treatment of the rejected stream in the activated sludge
process. With a flowrate of 1,140 m3/day and COD of 1,200 mg/L, the mass of the
pollutant in the rejected stream was calculated as 68 kg per day after 95 % COD
removal by membrane filtration. On the other hand, ozonation effluents are also
thought to be discharged to the existing activated sludge system of the textile mill.
Therefore, similar to the membrane filtration system, mass of pollutants released to
aquatic environment due to the ozonation process would be originating from the
pollutants in the ozonated effluent going into activated sludge process. Ozonated
effluent having a flowrate of 1,140 m3/day was with a COD load of 547 kg/day after
60 % removal during ozonation.
In the Reference Document, it is stated that water consumptions and waste
productions of each alternative should be evaluated. In this part of the thesis, both
alternatives do not consume raw water. During membrane filtration processes, the
need of water for back-washing operation can be supplied from water recovered.
In the Reference Document, for the inventory of wastes generated from each of the
alternative option under consideration, waste classification given below is suggested;
Inert wastes,
Non-hazardous wastes,
Hazardous wastes.
Thus, for each alternative, possible generation of all these waste types was
considered. It was assumed that both of the recovery options will produce neither
inert wastes nor non-hazardous wastes. In addition, the effluents of each of the
alternatives were not thought as inert wastes or non-hazardous waste since they
75
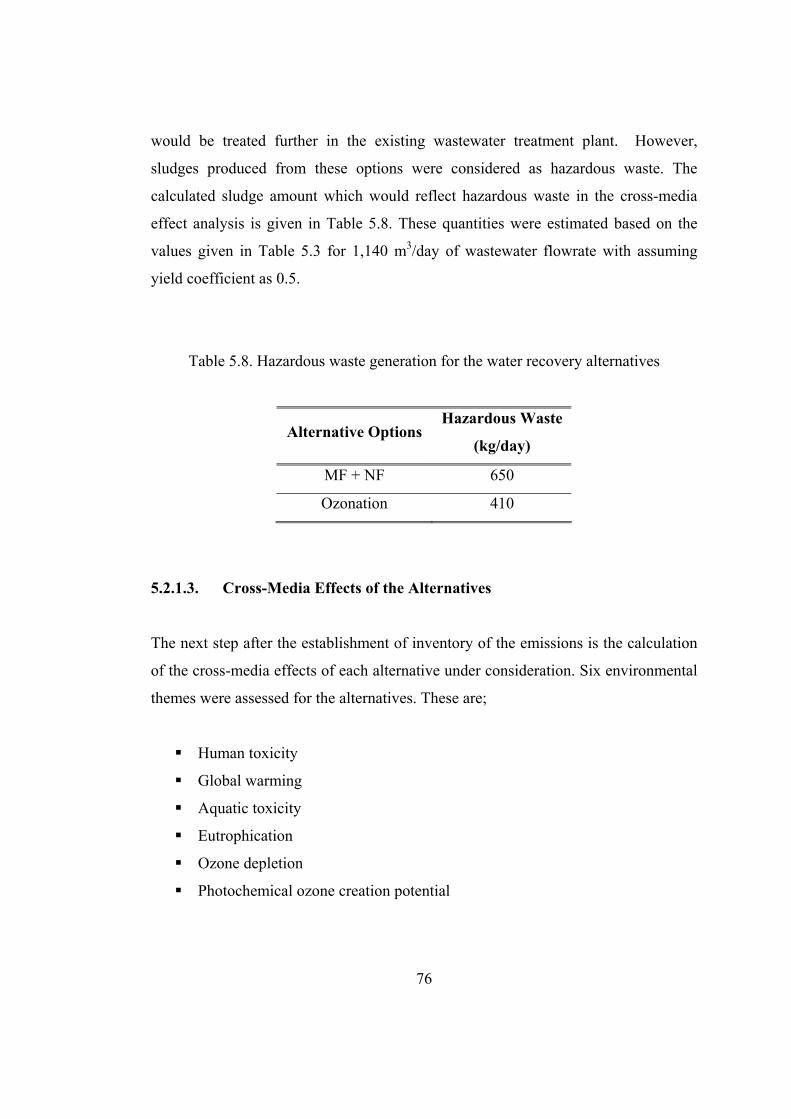
would be treated further in the existing wastewater treatment plant. However,
sludges produced from these options were considered as hazardous waste. The
calculated sludge amount which would reflect hazardous waste in the cross-media
effect analysis is given in Table 5.8. These quantities were estimated based on the
values given in Table 5.3 for 1,140 m3/day of wastewater flowrate with assuming
yield coefficient as 0.5.
Table 5.8. Hazardous waste generation for the water recovery alternatives
Alternative Options Hazardous Waste
(kg/day)
MF + NF 650
Ozonation 410
5.2.1.3. Cross-Media Effects of the Alternatives
The next step after the establishment of inventory of the emissions is the calculation
of the cross-media effects of each alternative under consideration. Six environmental
themes were assessed for the alternatives. These are;
Human toxicity
Global warming
Aquatic toxicity
Eutrophication
Ozone depletion
Photochemical ozone creation potential
76

Alternatives considered for the water recovery studies in the selected mill have no
direct cause on the abovementioned environmental themes. However, due to indirect
effects of emissions released from the energy consumptions, cross-media effects
were assessed for both of the recovery alternatives. Appendix C includes a sample
working sheet developed by using Microsoft Excel 2007 for cross-media effect
assessments (Figure C.2).
Human toxicity is one of the indicators for comparing the alternative options in terms
of their environmental impacts. In order to evaluate human toxicity potential, mass of
toxicity causing pollutant released to air was divided to the toxicity factor of the
pollutant. Toxicity factors have been given in Annex 1 of the Reference Document
on “Economics and Cross-Media Effects”. Toxicity factors listed are only used for
estimating the general toxicity effects. Moreover, they are derived from German
occupational exposure limits, divided by the respective figure for lead [2].
Using the toxicity factors, human toxicity potentials are estimated as kilogram of
lead equivalent. The suggested toxicity factors for SO2 and NO2 are 13 and 95,
respectively. By dividing the calculated emission values for given in Table 5.6 into
these toxicity potentials, the human toxicity potentials for the water recovery
alternatives were evaluated and the values are given in the Table 5.9 below.
Table 5.9. Human toxicity potentials of the water recovery alternatives
Alternative Options Human Toxicity
(kg lead equivalents)
MF + NF 0.22
Ozonation 1.27
77

The second environmental theme is the global warming which is the gradual increase
in the average measured temperature of Earth due to the greenhouse gases such as
carbon dioxide (CO2). In other words, Sun’s energy is trapped in the atmosphere
because of the increasing quantity of the greenhouse gases [2]. Therefore, it is also
important to predict the global warming potentials of the alternatives.
The same as the toxicity potentials for each of the emissions, global warming
potentials for each of the emissions are indicated in the Annex 2 to the Reference
Document. These potentials are published by IPCC (Intergovernmental Panel on
Climate Change). Total global warming potentials of the alternatives considered
were evaluated by the summation of the global warming potential of each
greenhouse gas released.
For the evaluation of the water recovery alternatives, CO2 is considered to be the
only greenhouse gas to be released due to energy usage for the alternatives.
According to the Reference Document, global warming potential of CO2 is stated as
1. The masses of CO2 emissions those were determined in the inventory study in
Table 5.6 were multiplied by 1 and illustrated as the global warming potential for
each alternative option. The units of these values were expressed as kilograms of
CO2 equivalent. Table 5.10 shows the indirect global warming potentials of the water
recovery alternatives evaluated accordingly.
78
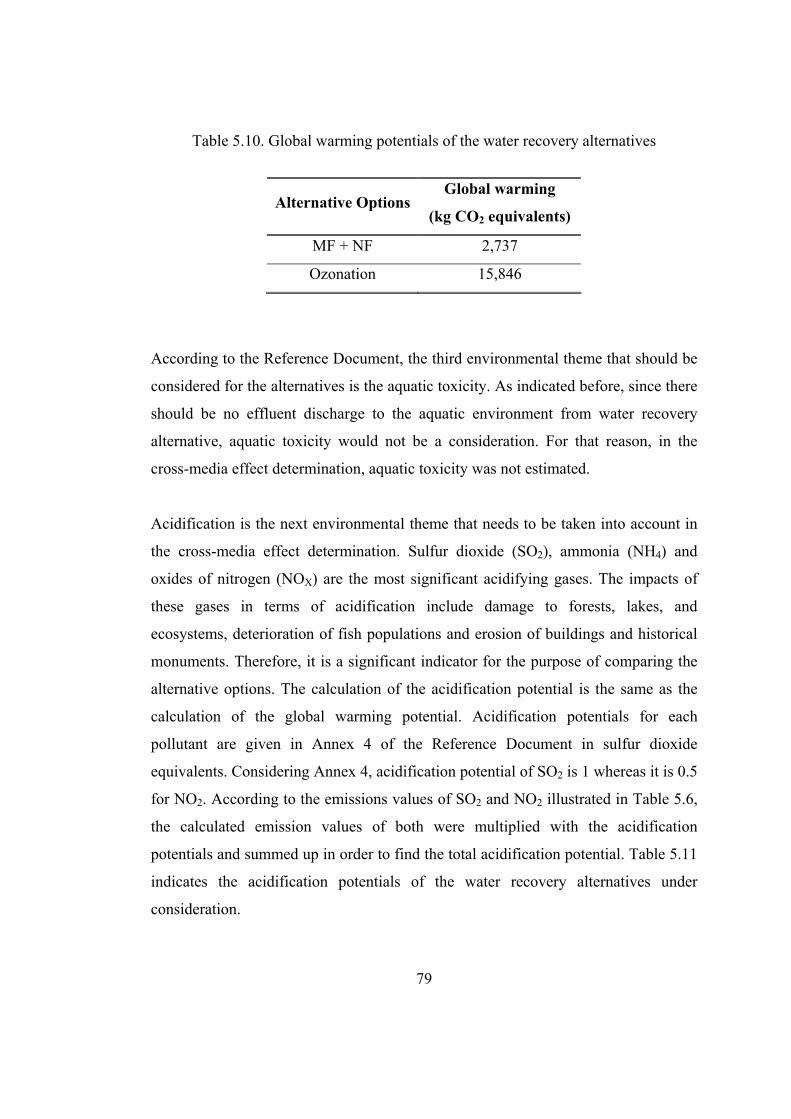
Table 5.10. Global warming potentials of the water recovery alternatives
Alternative Options Global warming
(kg CO2 equivalents)
MF + NF 2,737
Ozonation 15,846
According to the Reference Document, the third environmental theme that should be
considered for the alternatives is the aquatic toxicity. As indicated before, since there
should be no effluent discharge to the aquatic environment from water recovery
alternative, aquatic toxicity would not be a consideration. For that reason, in the
cross-media effect determination, aquatic toxicity was not estimated.
Acidification is the next environmental theme that needs to be taken into account in
the cross-media effect determination. Sulfur dioxide (SO2), ammonia (NH4) and
oxides of nitrogen (NOX) are the most significant acidifying gases. The impacts of
these gases in terms of acidification include damage to forests, lakes, and
ecosystems, deterioration of fish populations and erosion of buildings and historical
monuments. Therefore, it is a significant indicator for the purpose of comparing the
alternative options. The calculation of the acidification potential is the same as the
calculation of the global warming potential. Acidification potentials for each
pollutant are given in Annex 4 of the Reference Document in sulfur dioxide
equivalents. Considering Annex 4, acidification potential of SO2 is 1 whereas it is 0.5
for NO2. According to the emissions values of SO2 and NO2 illustrated in Table 5.6,
the calculated emission values of both were multiplied with the acidification
potentials and summed up in order to find the total acidification potential. Table 5.11
indicates the acidification potentials of the water recovery alternatives under
consideration.
79

Table 5.11. Acidification potentials of the water recovery alternatives
Alternative Options Acidification
(kg SO2 equivalents)
MF + NF 4.21
Ozonation 24.38
Eutrophication and ozone depletion are the two other important issues that need to be
taken under consideration while assessing the cross-media effects. Eutrophication is
the undesired increases in biomass production in aquatic or terrestrial ecosystems
caused by high nutrient inputs which results in algal formations and subsequent
oxygen-consuming degradation processes causing the death of the aquatic
environment (Eutrophication). In this thesis, eutrophication can be neglected from
the cross-media effect assessment, since both of the water recovery alternative
processes, namely membrane filtration processes and ozonation, do not release
pollutants to the aquatic environment.
Another environmental theme that cannot be determined is the ozone depletion.
Some substances emitted by human activities lead to the breakdown of stratospheric
ozone. This in turn causes a larger fraction of the sun’s UV-B radiation to reach the
earth’s surface than in their absence. Moreover, this can have harmful effects on
human health, animal health, terrestrial and aquatic ecosystems, biochemical cycles,
as well as on materials [46]. In this study, the emissions released due to the energy
consumptions of the proposals have no potential of ozone depletion.
The final cross-media effect is the photochemical ozone creation potential. It can be
defined as the formation of reactive substances (mainly ozone), which are harmful to
human health and ecosystems, and which may damage crops. Precursors of photo-
80

oxidants are mainly VOCs, CO, SO2 and NOX [46]. The structure and reactivity of
these photo-oxidants affect their ozone creation potential. For that reason, UNECE
‘Protocol to Abate Acidification, eutrophication, and Ground Level Ozone’
convention proposed the concept of using photochemical ozone creation potential
[2]. In this thesis, photochemical ozone creation potential was determined for SO2
and NO2 emissions released from the energy consumptions of the water recovery
alternatives. In Annex 7 of the Reference Document, photochemical ozone creation
potentials of these individual pollutants are stated as 0.048 for SO2 and 3.8 for NO2.
In order to evaluate the total photochemical ozone creation potential, these factors
were multiplied by the mass of the pollutants and the summation of the results of the
multiplication gave the total potential expressed as kilogram of ethylene equivalent.
Table 5.12 below shows these results.
81

82
Table 5.12. Photochemical ozone creation potentials of the water recovery alternatives
Alternative Options
Photochemical
ozone creation
(kg ethylene equivalents)
MF + NF 14.34
Ozonation 83.00
All the cross-media effects were assessed under the framework of the Reference
Document for each of the alternative options under consideration in order to compare
them. It can be concluded from the results of the assessment that membrane filtration
processes have fewer effects on the environment than ozonation processes (Table
5.13). Therefore, membrane filtration process namely NF after the application of MF
can be accepted as the least environmentally damaging option for water recovery
from dyeing wastewaters in textile industry. All the calculated cross-media effects
are given in Table 5.13.

Alternative
Options
Human
Toxicity
(kg lead
equivalents)
Global
warming
(kg CO2
equivalents)
Acidification
(kg SO2
equivalents)
Eutrophication
(kg PO4-3
equivalents)
Ozone
Depletion
(kg CFC
equivalent)
Photochemical
ozone creation
(kg ethylene
equivalents)
MF + NF 0.22 2,737 4.21 - - 14.34
Ozonation 1.27 15,846 24.38 - - 83.00
Table 5.13. Cross-media effects of the water recovery alternatives
83

5.2.2. Financial Analysis
After the assessment of the environmental performances of the alternatives, these
alternatives were evaluated in terms of economic considerations. Each step of the
costing methodology stated in the Reference Document was applied to the
alternatives under consideration for water recovery. In this part of the thesis, firstly
cost components such as investment costs and operating costs of the processes are
discussed. Then, the calculated cost figures are introduced. Furthermore, in this
thesis, cost data for the alternative options was derived from published information
such as reports, journals, websites, and conference proceedings. Firstly, investment
costs and operating costs were determined for each of the alternatives. According to
the cost information gathered, in order to manipulate them some financial concepts
were evaluated. A sample working sheet, developed by using Microsoft Excel 2007,
for financial analysis in water recovery studies is given in Appendix C (Figure C.3).
5.2.2.1. Investment Costs
Part I. Membrane Filtration Processes
As it is mentioned, the application of membrane processes to textile wastewater
treatment and reuse has been proved effective from a technical point of view in
addition to their environmental performances. However, these processes have high
investment and operating costs compared to conventional systems.
The investment costs for NF application were estimated by using the formulas stated
in Table 2.8. They can be classified as civil investments, mechanical investments,
membrane investments, and additional investments. Civil investment includes
buildings where the installation is housed. In addition, depreciation period for these
84

investments is assumed as 30 years. On the other hand, mechanical investments are
composed of costs of pumps, and piping with a depreciation period of 15 years.
The other important investment cost component is the membrane costs. The
membrane lifetime was estimated at 5 years. In the lab-scale experiments, NF 270
module which has nominal active surface area of 37 m2 was used in order to recover
water from the system [47]. Moreover, the estimated unit cost of this membrane
module is 780 EUR, which costs about 1,225 USD with an exchange rate of 1.57
EUR/USD [48]. Beside these, NF was applied to the dyeing textile wastewaters with
a flux of approximately 40 L/m2-hr in lab-scale experiments. For that reason, for the
full-scale implementation of NF, the flux value was assumed as the same. As a result,
the required total membrane area was determined as 1,187.5 m2. Hence, the system
needs approximately 32 modules of NF membrane.
According to the Table 2.8, Q (m3/hr) is the feed flow; n is the number of membrane
modules. The calculated investment costs for NF application are given in the Table
5.14 in EUR. The exchange rate is 1.57 EUR/USD in these calculations.
Table 5.14. Investment costs for NF process
Components Investment Costs
Civil investments 80,710
Mechanical investments 125,183
Membrane investments 39,303
Additional investments 49,039
TOTAL (EUR) 294,235
TOTAL (USD) 461,949
85

As it is mentioned, the flow rate of the dyeing wastewaters for these cost analysis
was estimated at 1,140 m3 per day. Therefore, the unit investment cost for NF
application can be calculated as 405 USD per each m3 of wastewater recovered.
According to the literature survey, the unit investment cost for the application of MF
before NF is estimated at 150 USD per m3 of wastewater treated. For the
determination of the MF investment costs, this value was used. It was assumed that
since MF and NF processes need to be applied sequentially, civil investment for the
MF process was neglected. As a result, the investment need for performing MF
before NF process for dyeing wastewater with a flowrate of 1,140 m3 per day was
evaluated as 171,000 USD. Consequently, the total investment cost for membrane
filtration alternative was estimated at 632,949 USD.
Part II. Ozonation Process
In the case of ozonation application, the main items of equipment required are the
reactor and the ozone generator. The investment need for such a system can be
calculated from the formula stated in Figure 2.4 which is a function of ozone
production required for treatment [12].
(4)
where;
q : Ozone requirement per hour,
Price : Price of the ozonation process equipment cost in EUR.
86

In the lab-scale experiments, with an average COD value of 1,200 mg/L and 95 % of
COD removal where the flowrate was 1,140 m3/day, it was calculated that COD
removed was 54,150 gr/h. In addition to this, it was also observed that for each gram
of COD removal, ozone requirement of the system would be 1.67 grams in the water
recovery studies conducted for dyeing wastewaters. Therefore, the hourly ozone
requirement was calculated as 90,431 gr/h. By using the equation given above, the
price of the ozonation system equipment was evaluated as 1,905,752 EUR.
In this thesis, the civil investments for such an ozonation system was assumed to be
the same as the civil investments calculated in membrane filtration processes, since
the flowrate and the initial COD values were the same. As a result, civil investment
need was assumed as 80,710 EUR. Then, the total investment cost for ozonation
system for dyeing wastewaters was estimated at 1,986,462 EUR which corresponds
to 3,118,746 USD with and exchange rate of 1.57 EUR/USD.
Consequently, the comparison between the investment costs of the two alternatives,
namely membrane filtration processes and ozonation process is as presented in Table
5.15. As it can be concluded from the results that investment need for membrane
filtration processes are nearly five times less than the need for the ozonation process.
Table 5.15. Investment costs of the water recovery alternatives
Alternative Options Investment Costs
(USD)
MF + NF 632,949
Ozonation 3,118,746
87

5.2.2.2. Operating Costs
After the investment cost determination, operating costs of the alternative options
were analyzed. Operating costs are composed of six components which are;
Energy costs,
Depreciation costs,
Maintenance costs,
Quality control cost,
Operating of installation,
Chemical costs.
Part I. Membrane Filtration Processes
For the estimation of the energy costs, in the cross-media effects determination part
of the thesis, specific energy consumptions were estimated for each of the alternative
option under consideration. Specific energy consumption for NF was determined as
5.30 kWh per m3 of wastewater. According to the information gathered from the
selected mill, the average electricity cost is about 0.072 YTL per kWh which
corresponds to 0.058 USD per kWh with an exchange rate of 1.25 USD/YTL. The
selected textile mill generates energy with its co-generation unit and also buys
electricity from city electric network. Therefore, energy cost was calculated as 0.305
USD per m3 of recovered wastewater.
Depreciation is the decreasing value of the asset to the owner [49]. In this thesis, the
simplest method was used to determine the depreciation which is the straight-line
method. This method assumes that a constant amount is depreciated each year over
the depreciable life of the asset; hence, the book value of that asset decreases linearly
with time. It is stated above that depreciation period for civil, mechanical, membrane
88
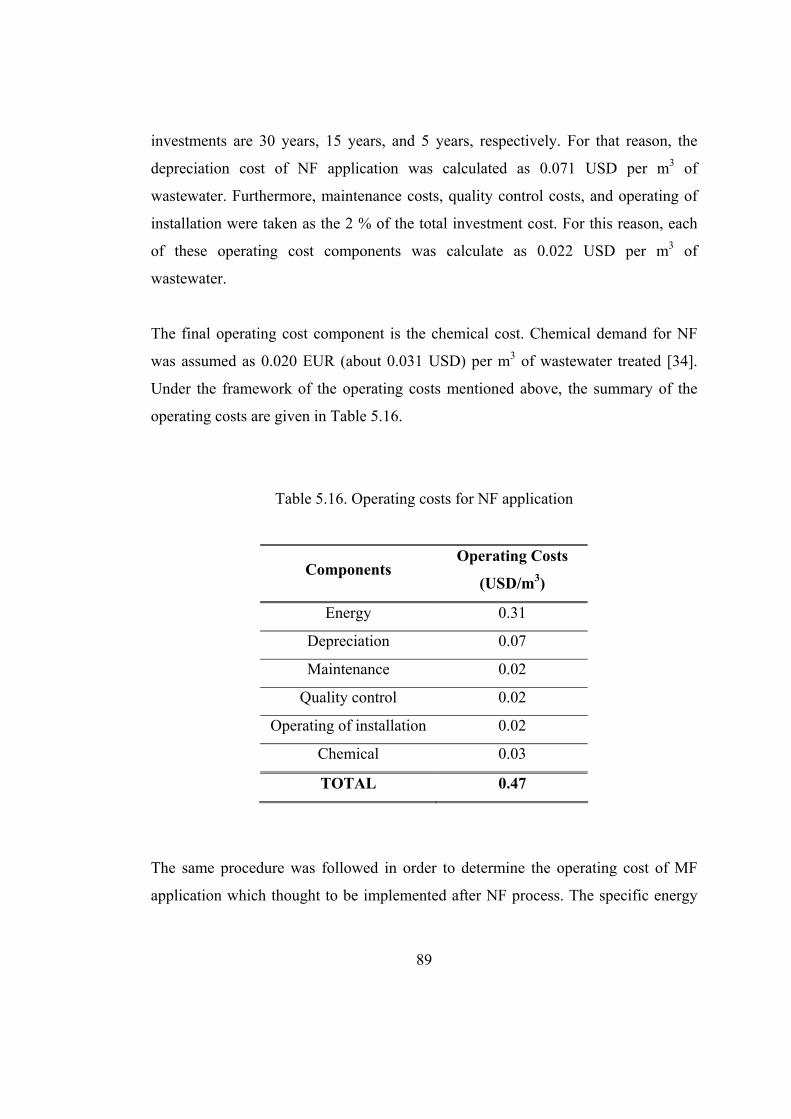
investments are 30 years, 15 years, and 5 years, respectively. For that reason, the
depreciation cost of NF application was calculated as 0.071 USD per m3 of
wastewater. Furthermore, maintenance costs, quality control costs, and operating of
installation were taken as the 2 % of the total investment cost. For this reason, each
of these operating cost components was calculate as 0.022 USD per m3 of
wastewater.
The final operating cost component is the chemical cost. Chemical demand for NF
was assumed as 0.020 EUR (about 0.031 USD) per m3 of wastewater treated [34].
Under the framework of the operating costs mentioned above, the summary of the
operating costs are given in Table 5.16.
Table 5.16. Operating costs for NF application
Components Operating Costs
(USD/m3)
Energy 0.31
Depreciation 0.07
Maintenance 0.02
Quality control 0.02
Operating of installation 0.02
Chemical 0.03
TOTAL 0.47
The same procedure was followed in order to determine the operating cost of MF
application which thought to be implemented after NF process. The specific energy
89

requirement for MF was determined as 0.40 kWh per m3. Thus, the energy cost was
calculated as 0.023 USD per each m3 of wastewater treated. Moreover, the other cost
components were determined as given in Table 5.17.
Table 5.17. Operating costs for MF application
Components Operating Costs
(USD/m3)
Energy 0.02
Depreciation 0.04
Maintenance 0.01
Quality control 0.01
Operating of installation 0.01
Chemical 0.03
TOTAL 0.12
Consequently, the overall operating cost for the membrane filtration application for
dyeing wastewater generated in the selected mill for water recovery purposes was
evaluated as 0.60 USD per each m3 of wastewater recovered.
Part II. Ozonation Process
Similarly, energy cost was evaluated for ozonation process where the specific energy
consumption of the system was determined as 33 kWh per m3 of wastewater. Then,
energy cost was calculated as 1.90 USD per m3 by taking the energy price as 0.058
USD per kWh. Since the equipments used in the ozonation process are mechanical
90

equipments, the depreciation period was assumed as 15 years. Moreover,
maintenance, quality control cost, and operating of installation costs were again
assumed as 2 % of the total investment cost. The overall operating cost and its
components are illustrated in Table 5.18.
Table 5.18. Operating costs for ozonation application
Components Operating Costs
(USD/m3)
Energy 1.90
Depreciation 0.50
Maintenance 0.15
Quality control 0.15
Operating of installation 0.15
TOTAL 2.85
As is the same case in investment cost, ozonation is much more expensive process
than membrane filtration processes in terms of operating cost. The comparison table
regarding operating costs is given below.
91

92
Table 5.19. Operating costs of the water recovery alternatives
Alternative Options Operating Costs
(USD/m3)
MF + NF 0.60
Ozonation 2.85
5.2.2.3. Revenues and Avoided Costs
Furthermore, revenues and some costs being avoided were delivered from the
application of the alternatives under consideration. These were due to water recovery
and the reduction in the wastewater discharge. The selected mill has been paying 1
YTL for each m3 of water used, and also have been paying 1 YTL for each m3 of
wastewater discharged [50]. By means of membrane filtration, as it was stated
approximately 70 % of water recovery can be achieved. It was assumed that 798 m3
of water can be recovered, and also 798 m3 of water was not discharged daily.
Therefore, 1,596 m3 of water which corresponds to 1,596 YTL was avoided. With an
exchange rate of 1.25 USD/YTL, the avoided cost was determined as 466,032 USD
per year. From these cost components, cash flow was assessed for 15 years of
economic life (Table 5.20).
On the other hand, application of ozonation process has no revenues, since water
recovery was not achieved in the lab-scale studies. Cash flow was also assessed for
the ozonation process for 15 years of economic life time and illustrated in Table
5.21.

Table 5.20. Cash flow (USD) assessment for membrane filtration alternative
YEARS 2008 2009 2010 2011 2012 2013 2014 2015 2016 2017 2018 2019 2020 2021 2022
Revenues
Water
Recovery 0 233,016 233,016 233,016 233,016 233,016 233,016 233,016 233,016 233,016 233,016 233,016 233,016 233,016 233,016
Reduction in
WW 0 233,016 233,016 233,016 233,016 233,016 233,016 233,016 233,016 233,016 233,016 233,016 233,016 233,016 233,016
TOTAL
Revenue 0 466,032 466,032 466,032 466,032 466,032 466,032 466,032 466,032 466,032 466,032 466,032 466,032 466,032 466,032
Expenditures
Investment
Cost 632,949 0 0 0 0 0 0 0 0 0 0 0 0 0 0
Operating
Cost 0 200,772 200,772 200,772 200,772 200,772 200,772 200,772 200,772 200,772 200,772 200,772 200,772 200,772 200,772
TOTAL
Expenditure 632,949 200,772 200,772 200,772 200,772 200,772 200,772 200,772 200,772 200,772 200,772 200,772 200,772 200,772 200,772
NET CASH
FLOW -632,949 265,310 265,310 265,310 265,310 265,310 265,310 265,310 265,310 265,310 265,310 265,310 265,310 265,310 265,310
93

Table 5.21. Cash flow (USD) assessment for ozonation alternative
YEARS 2008 2009 2010 2011 2012 2013 2014 2015 2016 2017 2018 2019 2020 2021 2022
Revenues
Water
Recovery 0 0 0 0 0 0 0 0 0 0 0 0 0 0 0
Reduction in
WW 0 0 0 0 0 0 0 0 0 0 0 0 0 0 0
TOTAL
Revenue 0 0 0 0 0 0 0 0 0 0 0 0 0 0 0
Expenditures
Investment
Cost 3,118,746 0 0 0 0 0 0 0 0 0 0 0 0 0 0
Operating
Cost 0 978,048 978,048 978,048 978,048 978,048 978,048 978,048 978,048 978,048 978,048 978,048 978,048 978,048 978,048
TOTAL
Expenditure 3,118,746 978,048 978,048 978,048 978,048 978,048 978,048 978,048 978,048 978,048 978,048 978,048 978,048 978,048 978,048
NET CASH
FLOW
-
3,118,746
-
978,048
-
978,048
-
978,048
-
978,048
-
978,048
-
978,048
-
978,048
-
978,048
-
978,048
-
978,048
-
978,048
-
978,048
-
978,048
-
978,048
94

5.2.2.4. Net Present Value (NPV)
According to the abovementioned cash flow analysis, net present values (NPV) of
the alternatives considered were calculated. Simply, NPV is the sum of the present
worths of net benefits by discounting the stream of benefits and costs back to the
beginning of the year. It can be calculated from the following formula:
(5)
where;
BBt : The benefits in the “t” th year,
Ct : The cost in the “t” th year,
r : The discount rate,
n : The economic life of the alternative.
Here, discount rate is the rate at which future cash flows are discounted to convert
them to present values [51]. While calculating the NPV for the alternatives, discount
rate was assumed to be 10 %. In addition, as it was stated in the cash flow
calculations, economic life of these alternatives under consideration was taken as 15
years. By using the abovementioned formula, NPV for each of the alternative were
evaluated as illustrated in Table 5.22.
95

Table 5.22. NPV values of the water recovery alternatives
Alternative Options NPV
(USD)
MF + NF 1,201,370
Ozonation -9,385,198
5.2.2.5. Internal Rate of Return
The rate of return on the investment that equates the present value of benefits and
costs can be defined as the internal rate of return (IRR). In other words, it is the
interest rate at which the benefits are equivalent to the costs [49]. This concept can
be presented with the following relationship:
(6)
where;
BBt : The benefits in the “t” th year,
Ct : The cost in the “t” th year,
r : The discount rate,
n : The economic life of the alternative.
If the project has high IRR value, then it can be concluded that the project would be
financially applicable. However, if the IRR value is lower than the discount rate, the
96

application of that alternative would be unattractive. IRR values were calculated for
both of the alternative options under consideration. The values are given in Table
5.23.
Table 5.23. IRR values of the water recovery alternatives
Alternative Options IRR
(%)
MF + NF 42
Ozonation NA
5.2.2.6. Annual Cost Calculations
The Reference Document states that cost data of the alternative options should be
calculated and presented as annual costs. Annual cost can be accomplished by
converting all the cash flows accruing over the economic lifetime of the alternative to
an equivalent annual cost. In other words, it is the multiplication of the present value
of the total cost stream, which consists of investment expenditure plus net operating
cost, with capital recovery factor [2]. Annual cost can be calculated by using the
formula mentioned below:
(7)
where;
97

Ct : The investment expenditure in the “t” th year,
BBt : The operating cost in the “t” th year,
r : The discount rate,
n : The economic life of the alternative.
Here, second multiplier of the given formula is called as the capital recovery factor.
It converts a present value into a stream of equal annual payments over a specified
time, at a specified discount rate. According to the given equation, the annual costs
for the two water recovery alternatives were calculated and presented in Table 5.24.
Table 5.24. Annual costs of the water recovery alternatives
Alternative
Options
Capital Recovery Factor
(%)
Annual Costs
(USD)
MF + NF 13 277,621
Ozonation 13 1,357,298
5.2.3. Evaluation of the Water Recovery Alternatives
5.2.3.1. Cost Effectiveness and Benefit Analysis
In accordance with Chapter 3, it is essential to verify the cost effectiveness of the
alternatives considered. In this part of the thesis, in order to determine the cost
effectiveness of the alternatives, the annual costs of them were divided into annual
reduction of pollutants. The calculated cost effectiveness values are given in Table
5.25.
98

Table 5.25. Cost effectiveness of the water recovery alternatives
Alternative
Options
Annual Costs
(USD)
Annual Reduction
of COD
(kg/year)
Cost Effectiveness
(USD/kg COD
reduced)
MF + NF 277,621 632,472 0.45
Ozonation 1,357,298 399,456 3.77
It can be seen from the table that to reduce each kilogram of COD, more money
should be paid in the ozonation process. However, cost of the membrane filtration
process is one eighth of that of ozonation process. Both of the alternatives achieved
high amounts of COD reduction. On the other hand, they cause environmental
impacts due to emissions generated from the energy usages. Therefore, in order to
compare the alternatives, these environmental damages should be evaluated.
However, these damages could not able to be evaluated since no data exist in the
literature presenting the valuation of the environmental impacts. For that reason, it
was assessed from the impacts and COD ratios that the lower the environmental
impacts, the higher the COD reduction in the water recovery alternative.
99

5.3. Analysis of Wastewater Treatability Studies
As it is represented previously, five different treatment patterns were applied for the
wastewaters generated whole through the textile mill. In this part of the chapter,
these treatment alternatives are discussed with respect to their environmental and
economical considerations. In these calculations, the mixed wastewater flowrate was
assumed as 3,250 m3/day (Figure 4.1).
5.3.1. Environmental Effect Analysis
5.3.1.1. Identification of the Alternatives
Similar to the water recovery alternatives, wastewater treatability alternatives were
also assessed in terms of their cross-media effects initially. It is important to give the
definitions of the alternatives according to their technical considerations concluded
from the lab-scale experiments. These issues are given in Table 5.26 with the
assumptions made.
100

Table 5.26. Identification of the wastewater treatability alternatives
Alternative
Options
Influent
COD
(mg/L)
Influent
Color
(Pt-Co)
COD
Removal
(%)
Color
Removal
(%)
Water
Recovery
(%)
AS + MF + NF 1,800 3,800 90 100 70
Membrane
Bioreactor 1,800 3,800 97 98 70
Ozonation + AS 1,800 3,800 47 86 -
Peroxone + AS 1,800 3,800 47 86 -
AS + Ozonation 1,800 3,800 50 98 -
5.3.1.2. Inventory of Consumptions and Emissions
Each treatment alternative was evaluated in terms of their energy consumption in
order to calculate the inventory of consumptions and emissions. Table 5.27 shows
the specific consumption values of the alternatives taken under consideration.
101

Table 5.27. Specific energy consumptions of treatment alternatives [45]
Alternatives
Specific energy
consumption
(kWh/m3)
Activated Sludge + MF + NF 6.20
Membrane Bioreactor 2.50
Ozonation + Activated Sludge 45.88
Peroxone + Activated Sludge 52.98
Activated Sludge + Ozonation 14.50
By using the abovementioned specific energy consumption values for each of the
alternative, electricity used in a day through the options were calculated and
illustrated in Table 5.28.
Table 5.28. Electricity usage of treatment alternatives
Alternatives Electricity
(kWh/day)
Activated Sludge + MF + NF 20,150
Membrane Bioreactor 8,125
Ozonation + Activated Sludge 149,094
Peroxone + Activated Sludge 188,419
Activated Sludge + Ozonation 47,125
102
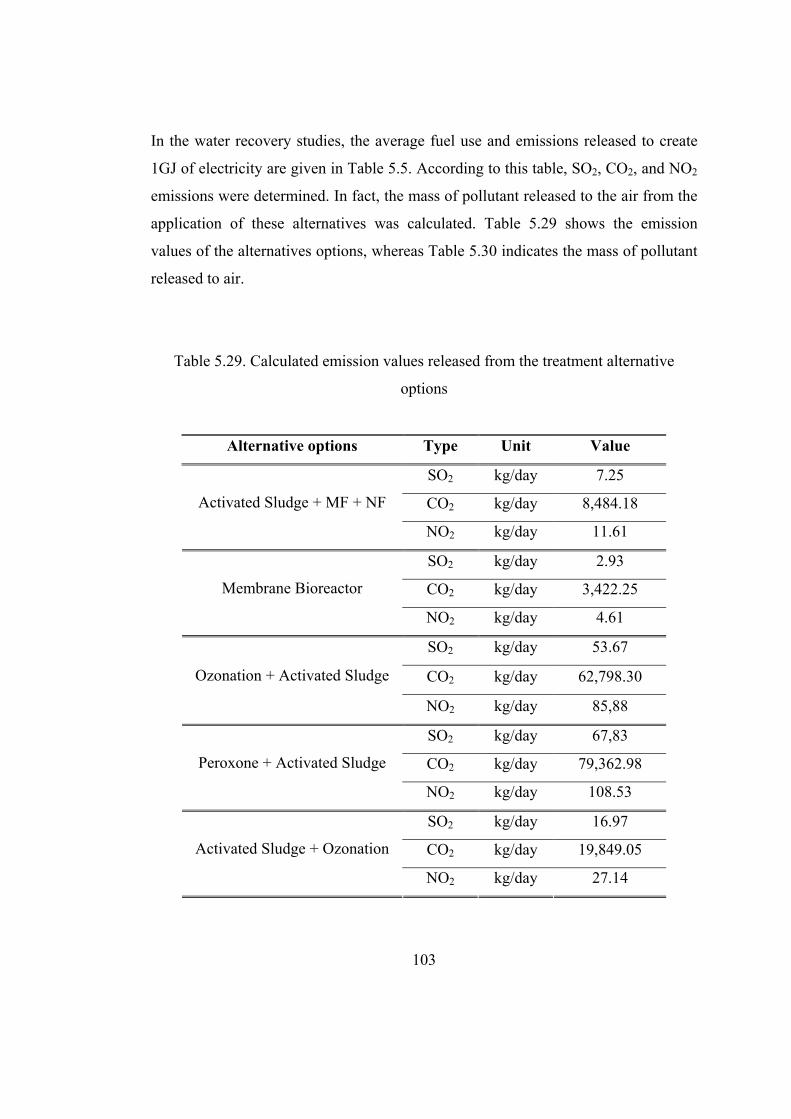
In the water recovery studies, the average fuel use and emissions released to create
1GJ of electricity are given in Table 5.5. According to this table, SO2, CO2, and NO2
emissions were determined. In fact, the mass of pollutant released to the air from the
application of these alternatives was calculated. Table 5.29 shows the emission
values of the alternatives options, whereas Table 5.30 indicates the mass of pollutant
released to air.
Table 5.29. Calculated emission values released from the treatment alternative
options
Alternative options Type Unit Value
SO2 kg/day 7.25
CO2 kg/day 8,484.18 Activated Sludge + MF + NF
NO2 kg/day 11.61
SO2 kg/day 2.93
CO2 kg/day 3,422.25 Membrane Bioreactor
NO2 kg/day 4.61
SO2 kg/day 53.67
CO2 kg/day 62,798.30 Ozonation + Activated Sludge
NO2 kg/day 85,88
SO2 kg/day 67,83
CO2 kg/day 79,362.98 Peroxone + Activated Sludge
NO2 kg/day 108.53
SO2 kg/day 16.97
CO2 kg/day 19,849.05 Activated Sludge + Ozonation
NO2 kg/day 27.14
103

Table 5.30. Mass of pollutants released to air due to treatment alternatives
Alternative Options Mass of pollutant
(kg/day)
Activated Sludge + MF + NF 8,484.18
Membrane Bioreactor 3,422.25
Ozonation + Activated Sludge 62,798.30
Peroxone + Activated Sludge 79,362.98
Activated Sludge + Ozonation 19,849.05
It is mentioned in Table 5.26 that wastewater recovery would be achieved only by
the implementation of the first and the second alternatives which are activated sludge
followed by MF and NF, and membrane bioreactor, respectively. For that reason,
mass of pollutant released to aquatic environment assumed as the mass of the
rejected stream generated from these alternatives. According to their COD removal
ratios (Table 5.26), mass of COD discharged to the environment was assumed to be
the mass of pollutant released to aquatic environment. On the other hand, the reduced
mass of COD, which turns into sludge, was assumed to be the hazardous waste. Both
the mass of pollutant released to aquatic environment and hazardous waste amounts
are presented in Table 5.31 and Table 5.32, respectively with the COD removal
ratios of each alternative option. In the hazardous waste calculations, yield
coefficients were assumed as 0.5 and 0.05 for activated sludge processes and MBR
process respectively.
104
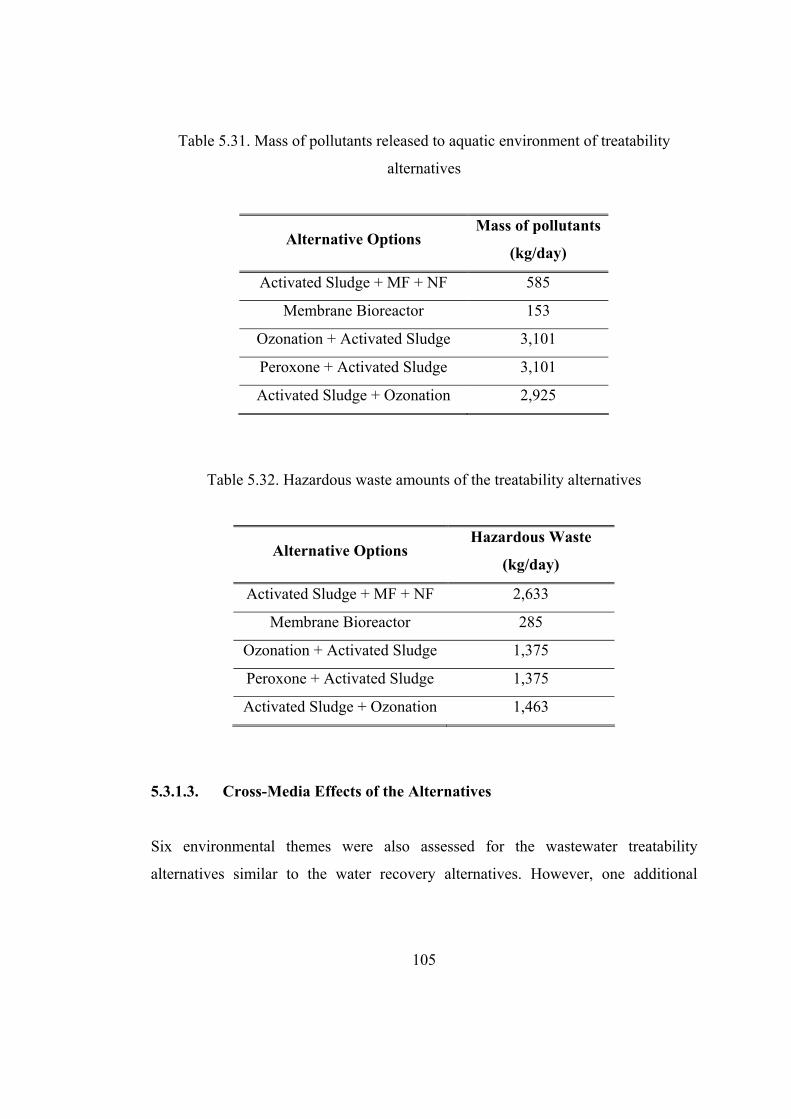
Table 5.31. Mass of pollutants released to aquatic environment of treatability
alternatives
Alternative Options Mass of pollutants
(kg/day)
Activated Sludge + MF + NF 585
Membrane Bioreactor 153
Ozonation + Activated Sludge 3,101
Peroxone + Activated Sludge 3,101
Activated Sludge + Ozonation 2,925
Table 5.32. Hazardous waste amounts of the treatability alternatives
Alternative Options Hazardous Waste
(kg/day)
Activated Sludge + MF + NF 2,633
Membrane Bioreactor 285
Ozonation + Activated Sludge 1,375
Peroxone + Activated Sludge 1,375
Activated Sludge + Ozonation 1,463
5.3.1.3. Cross-Media Effects of the Alternatives
Six environmental themes were also assessed for the wastewater treatability
alternatives similar to the water recovery alternatives. However, one additional
105

106
concern was taken into account. In order to evaluate the alternatives in terms of color
removal efficiency, a new concept which is aesthetical pollution was adjusted.
It is again the same for wastewater treatability alternatives that they have no direct
cause on the environmental themes mentioned previously, they have indirect effects
due to energy consumption which results in releasing of emissions.
Human toxicity, global warming potential, acidification, eutrophication, ozone
depletion, photochemical ozone creation potential, and aesthetical pollution
calculations were performed and the overall results of these calculations are given as
a summary in Table 5.33. These values were calculated according to the emission
values of SO2, CO2, and NO2 indicated in Table 5.29, and the factors presented in the
Reference Document.

Alternative
Options
Human
Toxicity
(kg lead
equivalents)
Global
warming
(kg CO2
equivalents)
Acidification
(kg SO2
equivalents)
Eutrophication
(kg PO4-3
equivalents)
Ozone
Depletion
(kg CFC
equivalents)
Photochemical
ozone creation
(kg ethylene
equivalents)
Aesthetical
Pollution
(Pt-Co)
Activated Sludge
+ MF + NF 0.68 8,487 13.06 - - 44.45 0.00
Membrane
Bioreactor 0.27 3,422 5.27 - - 17.92 82.30
Ozonation +
Activated Sludge 5.03 62,798 96.61 - - 328.91 532.00
Peroxone +
Activated Sludge 6.36 79,362 122.10 - - 415.67 532.00
Activated Sludge
+ Ozonation 1.59 19,849 30.54 - - 103.96 76.00
Table 5.33. Cross-media effects of the wastewater treatability alternatives
107

5.3.2. Financial Analysis
According to the costing methodology stated in the Reference Document, treatability
alternatives were evaluated economically. In this part of the thesis, investment costs
and operating and maintenance costs of each treatment alternative are introduced. In
addition to these cost components, net present values, internal rate of returns and
annual costs are determined.
5.3.2.1. Investment Costs
Part I. Activated Sludge Followed by Membrane Filtration Processes
The first alternative consists of membrane filtration processes which are MF and NF
after the activated sludge process. As it was stated, the textile mill taken under
consideration has an existing wastewater treatment plant consisting of an activated
sludge system. Therefore, there is no need for an investment for such a system where
it takes place in some of the treatment pattern in this study. However, this alternative
of treatability has the investment cost consisting of only membrane filtration costs.
The same calculation pattern with the calculations applied in the membrane filtration
processes implemented to dyeing wastewaters was used. The only differences are the
flowrate and flux values applied. In wastewater treatability studies, the flux value
that experimented was 34 L/m2-hr. For estimating the investment costs, equations
given in Table 2.8 were used similarly. The investment need for such system is given
in Table 5.34.
108

Table 5.34. Investment costs for MF and NF process for treatability alternatives
Membrane Filtration Components
Investment
Costs
Mechanical investment 487,500 MF
TOTAL (USD) 487,500
Civil investments 250,101
Mechanical investments 331,726
Membrane investments 131,821
Additional investments 142,730
TOTAL (EUR) 856,378
NF
TOTAL (USD) 1,344,513
MF + NF OVERALL (USD) 1,832,013
It can be calculated from the overall investment cost of the application of MF and NF
after activated sludge process that the unit cost of the treatment pattern would be 564
USD per m3 of textile wastewater treated where unit investment cost of MF was 150
USD per m3 and that of NF was 414 USD per m3.
Part II. Membrane Bioreactor Process
The second alternative is the membrane bioreactor process. While estimating the
investment cost of the system, three items were taken into account. These are civil
investments, membrane investments, and non-membrane investments. It was
assumed that civil investment needs would be equal to the civil investment needs
calculated for the NF alternative, since the flowrate and COD values were the same
109

for each of the systems. In fact, it was assumed as 250,101 EUR that is equal to
392,658 USD with an exchange rate of 1.57 EUR per USD.
In order to evaluate the membrane costs, firstly, the required membrane area for the
system was determined by using 15 L/m2-hr of flux designated experimentally in lab-
scale studies. As a result, the required membrane area was calculated as 9,028 m2.
The average unit cost of membrane was found from the literature. It was assumed as
125 USD per m2 of membrane area. Consequently, membrane investment was
calculated as 1,128,472 USD. In this study, this membrane investment was assumed
to be 30 % of the total mechanical expenditure. For this purpose, Table 5.35 shows
the investment items and the total investment need of the membrane bioreactor
alternative.
Table 5.35. Investment costs for MBR process
Components Investment Costs
(USD)
Civil investments 392,658
Membrane investments 1,128,472
Non-membrane investments 2,240,444
TOTAL 3,761,574
The unit investment cost can be calculated by dividing the total investment cost value
into flowrate. In this thesis, this value was determined as 1,157 USD per each m3 of
wastewater treated.
110

Part III. Ozonation Process before Activated Sludge
As it was calculated in the water recovery studies, investment need for the ozonation
system was determined from the equation shown in Equation (4). In order to use that
equation, hourly ozone requirement should be calculated. The experimental studies
showed that 2.33 gram of ozone was needed for the reduction of each gram of COD.
COD reduction was performed as 47 % which corresponded to 114,563 grams of
COD reduced with respect to 1,800 mg/L of initial COD.
By using the abovementioned equation, the investment cost of the equipment needed
for ozonation process was calculated as 3,705,431 EUR. In addition to this
equipment cost, civil investments were again assumed as the same as the civil
investment costs calculated for membrane filtration alternatives. Therefore, the total
investment need for this alternative was determined as 3,955,531 EUR where this
value equaled to 6,210,184 USD due to the exchange rate assumed as 1.57 EUR per
USD.
Part IV. Peroxone Process before Activated Sludge
As it is mentioned before, in this thesis, one of the wastewater treatability alternative
evaluated in terms of economic considerations is the peroxone process applied before
the existing activated sludge system in the selected textile mill. The only difference
between this alternative and third alternative which is ozonation before the activated
sludge is the hydrogen peroxide usage in the process. The only financial effect due to
hydrogen peroxide would be in the operating costs. Therefore, it was assumed in this
thesis that the investment cost of this fourth alternative would be the same with the
ozonation application after activated sludge system which was calculated as
6,210,184 USD. Moreover, the investment need due to the pumping requirement of
hydrogen peroxide was ignored.
111

Part V. Ozonation process after Activated Sludge
The last alternative considered is the post-ozonation application. In this alternative,
effluents of the activated sludge system had different wastewater characterization.
The wastewater characterization was given before as 800 mg/L of COD, and 2,100
Pt-Co of color for the wastewater entering to the ozonation process. Since COD
concentration was determined less than the initial COD concentrations mentioned for
the other ozonation processes, the alternative required less ozone for treating
wastewater. For this purpose, in the post-ozonation experiments, ozone requirement
of the process was determined as 0.44 grams per each gram of COD to be treated. It
was also conducted from the experiments that application of ozonation resulted with
50 % of COD removal.
According to these values stated above, ozone requirement was calculated as 23,833
grams per hour. Moreover, equipment cost was computed by using Equation (4) and
found to be 840,833 EUR. As a result, total investment cost was estimated at
1,711,541 USD.
Consequently, investment costs of the wastewater treatability alternatives were
mentioned above. According to these cost figures, it seems that membrane bioreactor
process has the lowest investment cost, on the other hand ozonation is the highest
one in terms of investment costs. All these investment costs were summarized in
Table 5.36.
112

Table 5.36. Investment costs of treatability alternatives
Alternative Options
Investment
Costs
(USD)
Unit
Investment
Costs
(USD/m3)
AS + MF + NF 1,832,013 564
Membrane Bioreactor 3,761,574 1,157
Ozonation + AS 6,210,184 1,911
Peroxone + AS 6,210,184 1,911
AS + Ozonation 1,711,541 527
5.3.2.2. Operating Costs
In this part of the thesis, in addition to investment cost analysis, operating costs of
the considered treatability alternatives were also estimated.
Part I. Activated Sludge Followed by Membrane Filtration Processes
Since the existing wastewater treatment is still in operation, the textile mill has an
operating cost for this system. According to the information gathered from the
selected textile mill, operating costs for the existing system are illustrated in Table
5.37. In this table, monthly expenditures of the textile mill taken under consideration
were illustrated. In addition to this table, Table 5.38 shows the unit operating cost of
the system in USD.
113

Table 5.37. Operating costs for existing activated sludge system of the textile mill
Components
Annual
Operating Costs
(YTL)
Energy 7,140
Depreciation 9,933
Labour 2,500
Wastewater taxes 20,756
Maintenance 40,000
Chemical 25,588
TOTAL 105,917
Table 5.38. Unit operating costs for existing activated sludge system of the textile
mill
Components Operating Costs
(USD/m3)
Energy 0.06
Depreciation 0.08
Labour 0.02
Wastewater taxes 0.17
Maintenance 0.33
Chemical 0.21
TOTAL 0.87
114

In the experimental study, membrane filtration processes, namely MF and NF, were
applied to the biologically pre-treated wastewater. Therefore, for this alternative,
membrane filtration operating costs were also determined in addition to the activated
sludge operating costs. Similarly, the same procedure that used in the water recovery
alternatives was applied. While determining the energy cost, unit price of electricity
was again assumed as 0.072 YTL per kWh. The results of the calculations for the
operating costs are given in Table 5.39.
Table 5.39. Operating costs for MF + NF application
Components
MF Operating
Costs
(USD/m3)
NF Operating
Costs
(USD/m3)
TOTAL
(USD/m3)
Energy 0.02 0.31 0.34
Depreciation 0.04 0.08 0.12
Maintenance 0.01 0.02 0.03
Quality control 0.01 0.02 0.03
Operating of
installation 0.01 0.02
0.03
Chemical 0.04 0.04 0.08
TOTAL 0.13 0.49 0.62
According to the abovementioned operating costs, the overall operating cost for the
alternative consisting of membrane filtration application after the activated sludge
process for the textile wastewater generated in the selected mill for wastewater
115
treatability purposes was evaluated as 1.49 USD per each m3 of wastewater
recovered.
Part II. Membrane Bioreactor Process
While estimating the operating cost of the membrane bioreactor, energy, depreciation
of assets, membrane replacement, maintenance, quality control, operation of
installation, and chemical costs were taken into account. Energy cost was determined
from the specific energy consumption where each kWh of electricity was evaluated
as 0.072 YTL with respect to the data gathered from the selected mill. In
depreciation of assets, equipment year was assumed as 15 years whereas 5 years of
membrane depreciation was used. Moreover, maintenance, quality control, and
operation of the installation were calculated as 2 % of the total investment cost of
membrane bioreactor. On the other hand, 0.04 EUR per treated wastewater was
assumed to be the chemical cost. Table 5.40 shows the operating cost of the
membrane bioreactor in more detail.
116

Table 5.40. Operating costs for MBR application
Components Operating Costs
(USD/m3)
Energy 0.09
Depreciation of assets 0.13
Membrane replacement 0.19
Maintenance 0.06
Quality control 0.06
Operating of installation 0.06
Chemical 0.04
TOTAL 0.64
Part III. Ozonation Process before Activated Sludge
The operating cost calculation for this alternative was executed with the same
procedure as it was applied for ozonation process in dyeing wastewaters. All the
operating items were illustrated below in Table 5.41. Moreover, working sheet for
ozonation cost assessments is given in Appendix C (Figure C.4).
117

Table 5.41. Operating costs for ozonation application before activated sludge system
Components Operating Costs
(USD/m3)
Energy 2.64
Depreciation 0.35
Maintenance 0.11
Quality control 0.11
Operating of installation 0.11
TOTAL 3.31
It can be seen that due to high specific energy consumption, energy cost of this
alternative was high compared to the other components. Moreover, since ozonation is
an expensive treatment alternative in terms of investment cost, depreciation cost was
also found to be high. The total operating cost for this alternative would be the
summation of the operating cost calculated for ozonation and that for existing
activated sludge system. This was calculated as 4.17 USD per m3.
Part IV. Peroxone Process before Activated Sludge
In this alternative, in addition to ozone dosage hydrogen peroxide (H2O2) was also
added to the system. As it was considered, addition of H2O2 would cause an increase
in the operating costs. From the literature, the average cost of H2O2 was found as
0.50 USD per kilogram of H2O2. Furthermore, the experiments performed for this
alternative showed that for such kind of treatment alternative, approximately 1.5
kilograms of H2O2 was needed in order to treat each m3 of wastewater. As a result,
operating cost caused by H2O2 would be 0.75 USD per m3 where it was stated as
chemical cost.
118

Considering the energy requirement, it was calculated in the cross-media effect
analysis that the specific energy consumption of the peroxone alternative was 57.98
kWh per m3 of wastewater. For that reason, the energy cost was estimated at 3.34
USD. The rest of the operating cost items are given in Table 5.42.
Table 5.42. Operating costs for peroxone treatment before activated sludge system
Components Operating Costs
(USD/m3)
Energy 3.34
Depreciation 0.35
Maintenance 0.11
Quality control 0.11
Operating of installation 0.11
Chemical 0.75
TOTAL 4.75
As a result of this calculations, the total operating cost of this peroxone before
activated sludge alternative would be 5.62 USD per m3 where 4.75 USD of this was
due to peroxone application, the rest 0.87 USD was due to the operation of existing
activated sludge.
Part V. Ozonation Process after Activated Sludge
Ozonation was applied both before and after the activated sludge process. The same
calculation with pre-ozonation alternative was executed for this alternative in order
119

to find out the operating cost. The specific energy requirement for this alternative
option was evaluated as 14.50 kWh per m3. Therefore, the energy cost was calculated
as 0.84 USD per m3. For depreciation cost assessment, the equipment life was
thought to be 15 years. Moreover, maintenance, operation of installation, and quality
control costs were assumed as 2 % of the investment costs as it was the same with
the previous operating cost calculations of the other alternatives. Table 5.43 shows
these operating cost items.
Table 5.43. Operating costs for ozonation application after activated sludge system
Components Operating Costs
(USD/m3)
Energy 0.84
Depreciation 0.09
Maintenance 0.03
Quality control 0.03
Operating of installation 0.03
TOTAL 1.02
Activated sludge was applied before the ozonation. Therefore, the total operating
cost was the summation of 0.87 USD and 1.02 USD which resulted as 1.89 USD per
m3 of treated wastewater.
To sum up, Table 5.44 shows all the operating costs calculated for each of the
treatability alternatives mentioned in this part of the thesis.
120
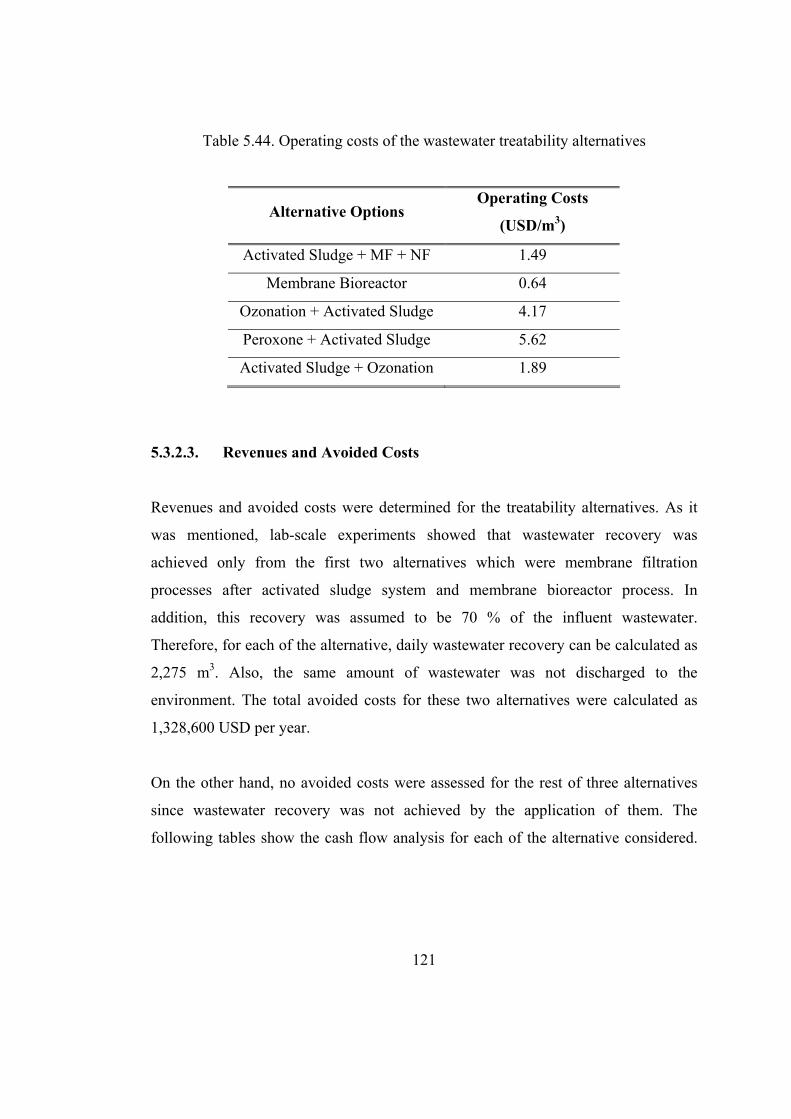
121
Table 5.44. Operating costs of the wastewater treatability alternatives
Alternative Options Operating Costs
(USD/m3)
Activated Sludge + MF + NF 1.49
Membrane Bioreactor 0.64
Ozonation + Activated Sludge 4.17
Peroxone + Activated Sludge 5.62
Activated Sludge + Ozonation 1.89
5.3.2.3. Revenues and Avoided Costs
Revenues and avoided costs were determined for the treatability alternatives. As it
was mentioned, lab-scale experiments showed that wastewater recovery was
achieved only from the first two alternatives which were membrane filtration
processes after activated sludge system and membrane bioreactor process. In
addition, this recovery was assumed to be 70 % of the influent wastewater.
Therefore, for each of the alternative, daily wastewater recovery can be calculated as
2,275 m3. Also, the same amount of wastewater was not discharged to the
environment. The total avoided costs for these two alternatives were calculated as
1,328,600 USD per year.
On the other hand, no avoided costs were assessed for the rest of three alternatives
since wastewater recovery was not achieved by the application of them. The
following tables show the cash flow analysis for each of the alternative considered.

Table 5.45. Cash flow (USD) assessment for activated sludge and membrane filtration alternative
YEARS 2008 2009 2010 2011 2012 2013 2014 2015 2016 2017 2018 2019 2020 2021 2022
Revenues
Water Recovery 0 664,300 664,300 664,300 664,300 664,300 664,300 664,300 664,300 664,300 664,300 664,300 664,300 664,300 664,300 Reduction in
WW 0 664,300 664,300 664,300 664,300 664,300 664,300 664,300 664,300 664,300 664,300 664,300 664,300 664,300 664,300
TOTAL
Revenue 0 1,328,600 1,328,600 1,328,600 1,328,600 1,328,600 1,328,600 1,328,600 1,328,600 1,328,600 1,328,600 1,328,600 1,328,600 1,328,600 1,328,600
Expenditures
122
Investment Cost 1,832,013 0 0 0 0 0 0 0 0 0 0 0 0 0 0 Operating Cost 0 1,526,755 1,526,755 1,526,755 1,526,755 1,526,755 1,526,755 1,526,755 1,526,755 1,526,755 1,526,755 1,526,755 1,526,755 1,526,755 1,526,755
TOTAL
Expenditure 1,832,013 1,526,755 1,526,755 1,526,755 1,526,755 1,526,755 1,526,755 1,526,755 1,526,755 1,526,755 1,526,755 1,526,755 1,526,755 1,526,755 1,526,755
NET CASH
FLOW -1,832,013 -198,155 -198,155 -198,155 -198,155 -198,155 -198,155 -198,155 -198,155 -198,155 -198,155 -198,155 -198,155 -198,155 -198,155

Table 5.46. Cash flow (USD) assessment for membrane bioreactor alternative
YEARS 2008 2009 2010 2011 2012 2013 2014 2015 2016 2017 2018 2019 2020 2021 2022
Revenues
Water Recovery 0 664,300 664,300 664,300 664,300 664,300 664,300 664,300 664,300 664,300 664,300 664,300 664,300 664,300 664,300 Reduction in
WW 0 664,300 664,300 664,300 664,300 664,300 664,300 664,300 664,300 664,300 664,300 664,300 664,300 664,300 664,300
TOTAL
Revenue 0 1,328,600 1,328,600 1,328,600 1,328,600 1,328,600 1,328,600 1,328,600 1,328,600 1,328,600 1,328,600 1,328,600 1,328,600 1,328,600 1,328,600
Expenditures
Investment Cost 3,761,574 0 0 0 0 0 0 0 0 0 0 0 0 0 0 Operating Cost 0 381,196 381,196 381,196 381,196 381,196 381,196 381,196 381,196 381,196 381,196 381,196 381,196 381,196 381,196
TOTAL
Expenditure 3,761,574 381,196 381,196 381,196 381,196 381,196 381,196 381,196 381,196 381,196 381,196 381,196 381,196 381,196 381,196
NET CASH
FLOW -
3,761,574 947,404 947,404 947,404 947,404 947,404 947,404 947,404 947,404 947,404 947,404 947,404 947,404 947,404 947,404
123

Table 5.47. Cash flow (USD) assessment for activated sludge with pre-ozonation alternative
YEARS 2008 2009 2010 2011 2012 2013 2014 2015 2016 2017 2018 2019 2020 2021 2022
Revenues
Water Recovery 0 0 0 0 0 0 0 0 0 0 0 0 0 0 0
Reduction in
WW 0 0 0 0 0 0 0 0 0 0 0 0 0 0 0
TOTAL
Revenue 0 0 0 0 0 0 0 0 0 0 0 0 0 0 0
Expenditures
Investment Cost 6,210,184 0 0 0 0 0 0 0 0 0 0 0 0 0 0 Operating Cost 0 4,441,402 4,441,402 4,441,402 4,441,402 4,441,402 4,441,402 4,441,402 4,441,402 4,441,402 4,441,402 4,441,402 4,441,402 4,441,402 4,441,402
TOTAL
Expenditure 6,210,184 4,441,402 4,441,402 4,441,402 4,441,402 4,441,402 4,441,402 4,441,402 4,441,402 4,441,402 4,441,402 4,441,402 4,441,402 4,441,402 4,441,402
NET CASH
FLOW -
6,210,184 -
4,441,402 -
4,441,402 -
4,441,402 -
4,441,402 -
4,441,402 -
4,441,402 -
4,441,402 -
4,441,402 -
4,441,402 -
4,441,402 -
4,441,402 -
4,441,402 -
4,441,402 -
4,441,402
124

Table 5.48. Cash flow (USD) assessment for activated sludge with peroxone alternative
YEARS 2008 2009 2010 2011 2012 2013 2014 2015 2016 2017 2018 2019 2020 2021 2022
Revenues
Water Recovery 0 0 0 0 0 0 0 0 0 0 0 0 0 0 0
Reduction in
WW 0 0 0 0 0 0 0 0 0 0 0 0 0 0 0
TOTAL
Revenue 0 0 0 0 0 0 0 0 0 0 0 0 0 0 0
Expenditures
Investment Cost 6,210,184 0 0 0 0 0 0 0 0 0 0 0 0 0 0 Operating Cost 0 6,157,859 6,157,859 6,157,859 6,157,859 6,157,859 6,157,859 6,157,859 6,157,859 6,157,859 6,157,859 6,157,859 6,157,859 6,157,859 6,157,859
TOTAL
Expenditure 6,210,184 6,157,859 6,157,859 6,157,859 6,157,859 6,157,859 6,157,859 6,157,859 6,157,859 6,157,859 6,157,859 6,157,859 6,157,859 6,157,859 6,157,859
NET CASH
FLOW -
6,210,184 -
6,157,859 -
6,157,859 -
6,157,859 -
6,157,859 -
6,157,859 -
6,157,859 -
6,157,859 -
6,157,859 -
6,157,859 -
6,157,859 -
6,157,859 -
6,157,859 -
6,157,859 -
6,157,859
125

YEARS 2008 2009 2010 2011 2012 2013 2014 2015 2016 2017 2018 2019 2020 2021 2022
Revenues
Water Recovery 0 0 0 0 0 0 0 0 0 0 0 0 0 0 0
Reduction in
WW 0 0 0 0 0 0 0 0 0 0 0 0 0 0 0
TOTAL
Revenue 0 0 0 0 0 0 0 0 0 0 0 0 0 0 0
Expenditures
Investment Cost 1,711,541 0 0 0 0 0 0 0 0 0 0 0 0 0 0 Operating Cost 0 2,027,693 2,027,693 2,027,693 2,027,693 2,027,693 2,027,693 2,027,693 2,027,693 2,027,693 2,027,693 2,027,693 2,027,693 2,027,693 2,027,693
TOTAL
Expenditure 1,711,541 2,027,693 2,027,693 2,027,693 2,027,693 2,027,693 2,027,693 2,027,693 2,027,693 2,027,693 2,027,693 2,027,693 2,027,693 2,027,693 2,027,693
NET CASH
FLOW -
1,711,541 -
2,027,693 -
2,027,693 -
2,027,693 -
2,027,693 -
2,027,693 -
2,027,693 -
2,027,693 -
2,027,693 -
2,027,693 -
2,027,693 -
2,027,693 -
2,027,693 -
2,027,693 -
2,027,693
126
Table 5.49. Cash flow (USD) assessment for ozonation after activated sludge alternative

5.3.2.4. Net Present Value (NPV)
NPV calculations were done for each of the treatability alternative by using the
Equation (5) mentioned before. Discount rate was assumed as 10 % and the
economic life of the alternatives was taken as 15 years. These evaluated NPV results
are given in Table 5.50.
Table 5.50. NPV values of the wastewater treatability alternatives
Alternative Options NPV
(USD)
Activated Sludge + MF + NF -2,992,510
Membrane Bioreactor 2,925,140
Ozonation + Activated Sludge -35,389,643
Peroxone + Activated Sludge -46,884,731
Activated Sludge + Ozonation -15,135,382
5.3.2.5. Internal Rate of Return
In addition to cash flow analysis and NPV determination, the IRR for such
investments were evaluated and presented in Table 5.51. As can be seen from this
table, the IRR of the alternatives which were ozonation peroxone after and before the
activated sludge system could not be able to be determined since they did not have
revenues in fact they did not provide any water recovery. On the other hand,
although application of membrane filtration processes after the activated sludge
system provided revenue to the selected textile mill, the IRR of this alternative was
not also be determined. The reason for this is that their revenues provided were less
127

than the expenditures due to operating cost. The only calculated IRR value was for
the membrane bioreactor alternative. The Table 5.51 below shows the IRR values of
the alternatives taken under consideration for treatability studies.
Table 5.51. IRR values of the wastewater treatability alternatives
Alternative Options IRR
(%)
Activated Sludge + MF + NF N/A
Membrane Bioreactor 24
Ozonation + Activated Sludge N/A
Peroxone + Activated Sludge N/A
Activated Sludge + Ozonation N/A
5.3.2.6. Annual Cost Calculations
By converting all the cash flows to equivalent annual cost, annual costs of each
alternative were evaluated. Equation (7) was used for the annual cost determination
and the calculated annual costs were given in Table 5.52.
128

Table 5.52. Annual costs of the wastewater treatability alternatives
Alternative Options
Capital
Recovery
Factor
(%)
Annual Costs
(USD)
Activated Sludge + MF + NF 13 1,719,564
Membrane Bioreactor 13 863,747
Ozonation + Activated Sludge 13 5,118,091
Peroxone + Activated Sludge 13 6,780,524
Activated Sludge + Ozonation 13 2,188,896
5.3.3. Evaluation of the Wastewater Treatability Alternatives
5.3.3.1. Cost Effectiveness and Benefit Analysis
The calculated cost effectiveness values for wastewater treatability alternatives are
given in Table 5.53. By evaluating the cost effectiveness, it can be understood which
alternatives would be preferable to reach a specific environmental target at the lowest
cost.
129

Table 5.53. Cost effectiveness of the wastewater treatability alternatives
Alternative Options
Annual
Costs
(USD)
Annual
Reduction
of COD
(kg/year)
Cost
Effectiveness
(USD/kg COD
reduced)
Activated Sludge + MF + NF 1,738,425 1,921,725 0.89
Membrane Bioreactor 863,747 2,079,258 0.42
Ozonation + Activated Sludge 5,737,486 1,003,568 5.10
Peroxone + Activated Sludge 7,439,956 1,003,568 6.76
Activated Sludge + Ozonation 2,255,637 1,067,625 2.05
As can be seen from Table 5.53 that fourth alternative which is peroxone with
activated sludge treatment has the highest cost effectiveness which means that fourth
alternative needs the highest amount of money in order to reach the requirements.
Therefore, it can be concluded that the second one which is MBR application could
be thought to be the best alternative in terms of cost effectiveness.
130

5.4. Sensitivity Analysis
In this thesis, in addition to the cost-benefit analysis, sensitivity analysis was also
performed for each of the alternative options considered in both water recovery
studies and wastewater treatability studies. Sensitivity analysis is the method that
aims at identifying the project’s critical variables [40]. This is done by letting the
project variables vary according to a given percentage change and observing the
subsequent variations in financial indicators. In other words, it provides data in order
to make decision that shows how the economic variables would change when key
project factors vary from their estimated values [51].
There were six variables assumed as critical in the financial analysis for both of the
studies considered in this thesis. These were influent COD value of the wastewater,
influent color value of the wastewater, discount rate, unit energy cost, total operating
cost index, and exchange rate variation.
Here, total operating cost index was the percentage that would be applied in the cash
flow analysis for the operating cost value. If it was assumed as zero, then operating
costs would not change in 15 years period thus it would remain constant through
years. However, if it was assumed any percentage rather than zero, then the operating
cost would change according to this assumed percentage in years.
In this analysis, arbitrarily chosen percentage changes or values were assumed for
each of these critical variables. Sensitivity analysis was performed with respect to the
following variations. Maximum, average, and minimum values for COD and color
concentrations are illustrated in Table 5.54.
maximum, average, and minimum values of COD,
maximum, average, and minimum values of color,
131

6 %, 8 %, and 10 % of discount rate,
0 %, 5 %, and 10 % change observed in the energy costs,
0 %, 1%, and 2 % variations observed in total operating cost index and
exchange rate.
Table 5.54. COD and color concentrations for sensitivity analysis
Dyeing
Wastewaters
Wastewaters
before
Activated
Sludge
System
Wastewaters
after
Activated
Sludge
System
Max 1,600 3,200 900 Avg 850 350 750
COD
(mg/L) Min 1,200 1,800 800 Max 7,000 5,000 4,000 Avg 3,000 2,500 1,600
Color
(Pt-Co) Min 5,000 3,800 2,100
By changing the critical variables’ value, the percentage change in investment costs,
operating costs, and net present values were evaluated, and plotted in a diagram
which is called as sensitivity diagram. All the sensitivity diagrams of the alternatives
considered in the water recovery and wastewater treatability studies are illustrated in
Appendix D. A sample working sheet used in the analysis is given in Appendix C
(Figure C.1).
132

The slopes of the different lines represented which variable had the greatest impact
on financial results. Moreover, the greater the variation of the line, the larger the
economic impact. As can be seen from the diagrams in Appendix D, the greatest
impact on the investment costs was determined due to the variation in the exchange
rate in all of the alternative options whereas operating costs of all of the alternatives
affected mostly by energy cost change. On the other hand, discount rate only affected
the net present values of the alternatives. The calculated percentage changes for the
investment costs, operating costs, and net present values for the alternatives are also
given in Appendix E.
133

5.5. Risk Evaluation
Risk evaluation is the assessment of the impact of given percentage changes in a
variable on the project’s performance indicators [40]. In cases where project results
are expected to be particularly sensitive to certain variables, it has to be assessed how
likely it is that such changes would occur. Therefore, after the sensitivity analysis,
risk evaluation was done in this thesis.
As indicated in the sensitivity analysis, for the water recovery and wastewater
treatability studies percentage changes were evaluated and given in Appendix E.
According to these percentages, it can be seen that influent COD concentration
variation would not affect the investment and operating costs for the membrane
based alternatives which were membrane filtration alternatives and membrane
bioreactor application. However, alternatives consisting of ozonation processes were
changed with respect to the change in COD concentrations. For instance, 33 %
increase in COD concentration changed the investment cost of the ozonation
alternative in the water recovery studies by 19 %. Moreover, in the wastewater
treatability alternatives, investment cost of the ozonation process applied before the
activated sludge system decreased by 59 % with the 81 % decrease in the COD
concentration. Therefore, it can be concluded that COD concentration could be
assumed as a risk element of the ozonation processes. Compared to the investment
and operating costs, NPV of the ozonation alternative was not so much affected with
the COD concentration variation.
In this thesis, it was observed that color was not a determining factor as well as it
was not a critical variable in the sensitivity analysis. Only the treatment efficiency
was affected by the color variation. However, color concentration can be thought as a
risk element in terms of aesthetic requirements.
134

Furthermore, the discount rate was examined as a fundamental means of reflecting
risk in discounted cash flow evaluations. Change in discount rate affected the net
present value in all the alternatives applied for water recovery and wastewater
treatability studies. As an example, 20 % change in discount rate had an
approximately 33 % impact on the cash flow analysis in the membrane bioreactor
alternative considered in the treatability studies. In addition to discount rate, total
operating cost index was investigated as a risk element, since it affected the net
present values high in amount with only 1 % change.
If the energy costs were changed by 5 %, the operating costs would be affected
similarly. Therefore, it was assessed that change in the energy costs did not have
high impact on the operating costs. Thus it would not be thought as a risk element.
This case is the same for the exchange rate variation effect on the investment costs,
operating costs, and net present values.
135

5.6. Economic Viability of the Textile Sector
As indicated in the previous chapters, according to the IPPC Directive, the selected
BAT should be technically and economically viable for the relevant sector.
Therefore, it is important to assess the economic viability of the textile sector. In the
Reference Document, in order to evaluate the economic viability, some issues are
introduced which are industry structure, market structure, resilience, and speed of the
implementation of IPPC Directive.
Textile industry takes the third place of the World market after tourism and
information sector, with an approximate total sale of 1.7 trillion USD [52]. There
exist five main factors that affect the textile industry which are:
Industrial trend,
World trade,
Trends among consumers,
Retail market,
Technological development [50].
The textile sector is one of the major industries for the Turkish economy. Moreover,
it has also taken an important share in the world trade. At the beginning of the 1980s,
the total value of Turkish textile exports equalled to 190 million USD. However, in
1999, this value increased sharply to 9.8 billion USD [53].
On the other hand, as a more capital intensive industry as compared to other
industries, most of the companies in this sector are mainly medium scale. The
industry has also large scale companies having integrated production facilities one of
which is the textile mill considered in this project. As indicated before, the selected
textile mill is one of the world’s leading denim producer companies [54].
136

The estimated investment costs needed for the implementation of both water
recovery and wastewater treatability alternatives were generally high in value.
However, the selected textile mill would probably handle them. Moreover, some of
the alternatives indicated can offset the initial high cost of implementing process in
the long run by providing water recovery with greater efficiency.
Re-known as one of the major innovation leaders of jeans and sportswear, the
selected mill has the vision of “to be a model company internationally in the
sportswear sector in terms of business excellence". The company’s mission is “as a
preferred supplier to manufacturers of sportswear clothing, who give priority to
quality and creativity, our basic task is to be able to plan, sustain and create high
economic value” [55]. Moreover, the textile mill considered is in Turkey’s top list of
500 firms with a ranking of 99. It has a net sale of 230,152,854 YTL [56]. With this
vision and mission, the company is currently one of the leading companies in the
markets in which they offer service. However, as it is well known, the Turkish
Textile Sector is adversely affected by the China’s membership in the World Trade
Organization (WTO) in 2001. Particularly the removal of the quotas on textiles
starting from the beginning of 2005 under the WTO Agreement, has negatively
affected the textile production and exports of the developing countries [57].
Furthermore, the implementation of IPPC Directive in Turkey has not started yet.
However, the transposition of the Directive is in the priority list of the Ministry of
Environment and Forestry of Turkey (MoEF). In the Annual Report of 2007, it was
stated that all the industrial facilities would apply IPPC Directive in the year of 2023
[58].
137

CHAPTER 6
SUMMARY
In this thesis, the best water and wastewater management alternatives for the selected
textile mill located in Kayseri were evaluated according to the requirements in the
IPPC Directive. For this purpose, water recovery alternatives and wastewater
treatability alternatives were studied under the project of “Adaptation of IPPC
Directive to a Textile Mill in Turkey” conducted by METU.
These alternatives were assessed in terms of their environmental benefits and
financial values according to the suggested guidelines in the Reference Document on
“Economics and Cross-Media Effect”. Initially, environmental effects were
determined for each of the alternatives. Then, the considered alternatives were
financially evaluated. Moreover, sensitivity analysis was carried out with the
assessment of the risks.
As indicated previously, according to the IPPC Directive, BAT should be the
technique that can be applied under technically and economically viable conditions
by achieving high level of environmental protection. For this purpose, in this thesis,
while determining the BAT for both of the studies, namely water recovery studies
and wastewater treatability studies, technically applicable alternatives which were
thought to be BAT were assessed in terms of environmental benefits and economic
feasibility according to the methodologies stated in the Reference Document.
138

139
In the water recovery studies, two technically applicable alternatives were evaluated.
It was seen that the lower the environmental effect of the alternative, the lower the
investment and operating costs were determined. In other words, membrane filtration
processes used in the water recovery studies had lower effects on the environment
rather than the ozonation process. In addition to this, both the investment and
operating costs of the ozonation process were estimated at higher values than the
costs for the membrane filtration processes. Then, among the water recovery
alternatives, membrane filtration process chain composed of MF and NF appeared to
be the BAT for reusing of dyeing wastewaters.
Similarly, the same analysis was performed in order to assess the BAT for end-of-
pipe treatment of the mixed wastewater from the mill. The membrane bioreactor
application was determined as BAT among the wastewater treatment alternatives.
The environmental effects of the membrane bioreactor alternative were lower than
those for the other alternatives. On the other hand, the investment and operating costs
calculated for this alternative was the lowest among the other options.
As regards the adaptation of the IPPC Directive, it is necessary to set effluent criteria
in the permit that would be given on the bases of BAT application. Therefore, it is
needed to determine a single set of BATs for the mill. In the present study, the two
alternatives investigated were compared in this respect. Table 6.1 and 6.2 present the
summaries of this comparison.

Table 6.1. Summary of cross-media effects for the selected BATs
Cross-Media Effects
Alternative Options Volume
Treated
(m3/day)
Human
Toxicity
(kg lead
eq.)
Global
warming
(kg CO2
eq.)
Acidification
(kg SO2 eq.)
Photochemical
Oxygen
Creation
Potential
(kg ethylene
eq.)
MF + NF 1,140 0.22 2,737 4.21 14.34
AS 2,452 0.04 516 0.79 2.70
Water Recovery from Dyeing
wastewaters
TOTAL 3,592 0.26 3,253 5.00 17.04
Treatment of the mixed wastewater
by MBR MBR 3,250 0.27 3,422 5.27 17.92
140

Financial Analysis
Alternative Options Investment
Cost
(USD)
Operating
Cost
(USD/m3)
Net
present
value
(USD)
Internal
Rate of
Return
(%)
Annual
Cost
(USD)
Cost
effectiveness
(USD/kg
COD
removed)
MF + NF 632,950 0.60 1,201,370 42 277,621 0.59
AS ** 0.87 ** ** ** **Water Recovery from
Dyeing wastewaters TOTAL 632,950 0.78* 558,566 26 370,584 0.27
Treatment of the mixed
wastewater
by MBR
MBR 3,761,574 0.64 2,925,140 24 863,747 0.42
Table 6.2. Summary of financial analysis for the selected BATs
**Since the activated sludge plant exists, the values were not calculated.
* Calculations are given in Appendix F.
141

As can be depicted from the tables; membrane filtration application for water
recovery from dyeing wastewater is superior to MBR application for the mixed
wastewater with respect to both cross-media effects and financial analysis performed.
It can be seen from Table 6.1 that the environmental effects of both the application of
membrane filtration processes to dyeing wastewaters and the treatment of the other
wastewater streams with the existing activated sludge system are less than those for
MBR alternative applied for the mill’s mixed wastewater. Moreover, as can be
concluded from Table 6.2, membrane filtration alternative for dyeing process is more
economically viable alternative.
According to the sensitivity analysis, for both of the BATs, investment costs were
mainly sensitive to exchange rate variations. On the other hand, operating cost could
change due to the variation in energy costs. Moreover, net present values of the
BATs were sensitive to the change in discount rate. For instance, Figure 6.1 and
Figure 6.2 show the investment cost sensitivity diagrams for membrane filtration
alternative and MBR alternative, respectively.
142

Figure 6.1. Investment cost sensitivity diagram for MF + NF alternative applied in water recovery studies
Figure 6.2. Investment cost sensitivity diagram for the MBR alternative applied in wastewater treatability studies
143

CHAPTER 7
CONCLUSIONS
Based on the results obtained in the previous chapters, the following conclusions can
be done from this thesis
Among two water recovery alternatives which were membrane filtration and
ozonation considered in the cost-benefit analysis, membrane filtration process
chain composed of MF proceeded by NF, was determined as the best water
management alternative due to its low cost and low adverse environmental
effects. This alternative provided a water recovery of 70 %.
MBR process was found to be the best treatment alternative for the mixed
wastewater. The other alternatives considered were activated sludge followed
by membrane filtration, activated sludge followed by ozonation, ozonation
and peroxone followed by activated sludge. MBR selected as the BAT not
only due its high cost-benefit ratio but also water recovery potential.
Finally, among membrane filtration for water recovery and MBR treatment of
the mixed wastewater, the former was selected as the BAT applicable for the
mill in consideration.
Since for both of the options, the selected BATs were based on membrane
technology, membrane technology appeared to be the most promising
144

alternative in terms of recovery and treatability. In addition, this technology is
also economically applicable.
Economic viability of the sector was also investigated in this thesis. Most of
the textile mills in Turkey are in medium scale. However, the selected mill in
this study is one of the world’s leading denim producers. Therefore, it was
thought that the selected mill would afford the investment need for the
selected BAT which is 632,950 USD. In addition, by applying this
alternative, the mill could get some revenues originated for the water
recovery.
According to the sensitivity analysis conducted in order to quantify the level
of risk in the study, influent COD concentration, influent color value,
discount rate, energy cost, total operating cost index, and exchange rate
variation were thought as the critical variations in the studies. Among these
critical variations, it was investigated from the sensitivity diagrams that
investment costs were mainly affected by the exchange rate variations. On the
other hand, the greatest impact on operating cost was due to the variation in
energy costs. Moreover, net present values of the alternatives were sensitive
to the change in discount rate.
Some of the considered critical values were thought as the risk elements such
as initial COD concentration, discount rate, and total operating cost index.
Little change in these values affected the investment costs, operating costs,
and net present values. On the other hand, variations in the influent color
value, energy costs, and exchange rate changes did not have significant
influences on these financial indicators.
145

CHAPTER 8
RECOMMENDATIONS
In addition to the abovementioned conclusions, all the analyses performed in this
thesis were mainly based on assumptions. The reason for this is that the alternatives
considered both in the water recovery and wastewater treatability studies are very
new technologies started to be applied not only in the textile industry, but also in the
other treatment fields. Therefore, more realistic cost figures can be found for those
alternatives in the future studies. In addition, by increasing in the implementation of
these ones in the future, the costs would decrease which would result in more water
recovery.
Moreover, as can be concluded from this thesis that saving water is a very important
issue for textile installations since water consumption is very high in amount in their
sector. By means of water recovery, textile mills not only save water, but also they
save money. From this point of view, textile industry should be made conscious of
water recovery management techniques.
146

REFERENCES
[1] Council Directive 96/61/EC of 24 September 1996 concerning integrated
pollution prevention and control, 24 September 1996.
[2] Integrated pollution prevention and control, Reference Document on
“Economics and Cross-Media Effects”, July 2006.
[3] Ministry of Environment and Forestry, Technical Assistance for
Environmental Heavy-Cost Investment Planning, Directive-Specific Investment Plan
for the Council Directive 96/61/EC of 24 September 1996 concerning Integrated
Pollution Prevention and Control, September 2005.
[4] Alaton I. A., Insel G., Eremektar G., Babuna F., Orhon D. Effect of textile
auxiliaries on the biodegradation of dyehouse effluent in activated sludge.
Chemosphere, 62:1549-1577, 2006.
[5] El-dein A. M., Libra J., Wiesman U. Cost analysis or the degradation of
highly concentrated textile dye wastewater with chemical oxidation H2O2/UV and
biological treatment. Journal of Chemical Technology and Biotechnology, 81:1239-
1245, 2006.
[6] Confidential Wastewater Treatment Plant Reports, Ministry of Environment
and Forestry, Turkey, 2008.
147
[7] Erdogan A. O., Orhon H. F., Dulkadiroglu H., Dogruel S., Eremektar G.,
Babuna F. G., Orhon D. Feasibility analysis of in-plant control for water
minimization and wastewater reuse in a wool finishing textile mill. Journal of
Environmental Science & Health, A39:1819-1832, 2004.
[8] Soares O. S., Orfao J. M., Portela D., Vieira A., Pereira M. Ozonation of
textile effluents and dye solutions under continuous operation: Influence of operating
parameters. Journal of Hazardous Materials, B137:1664-1673, 2006.
[9] Tabrizi G. B., Mehrvar M. Integration of advanced oxidation technologies
and biological processes: recent developments, trends, and advances. Journal of
Environmental Science and Health, A39 (11-12): 3029-3081, 2004.
[10] Vandevivere P., Bianchi R., Verstraete W., Treatment and reuse of
wastewater from textile wet-processing industry: review of emerging technologies.
Journal of Chemical Technology and Biotechnology, 72:289-302, 1998.
[11] Munter R. Advanced oxidation processes – current status and prospects.
Proceeding of the Estonian Academy of Sciences Chemistry, 50 (2): 59-80, 2001.
[12] Canizares P., Paz R., Saez C., Rodrigo M. A., Costs of the electrochemical
oxidation of wastewaters: A comparison with ozonation and Fenton oxidation
processes, Journal of Environmental Management, In press, Corrected Proof, 2008.
[13] Buffle M., Schumacher J., Meylan S., Jekel M., Gunten U. Ozonation and
advanced oxidation of wastewater effect of O3 Dose, pH, DOM, and HO. –
scavengers on ozone decomposition and HO. generation. Ozone: Science and
Engineering, 28:247-259, 2006.
148

[14] Mock B., Hamouda H. Ozone application to color destruction of industrial
wastewater – Part 1. Experimental. American Dyestuff Reporter, Raleigh, August
1998.
[15] Solmaz S., Birgul A., Ustun G., Yonar T. Color and COD removal from
textile effluent by coagulation and advanced oxidation processes. Coloration
Technology, 122:102-109, 2006.
[16] Boncz M. Selective oxidation of organic compounds in wastewater by ozone-
based oxidation processes. PhD Thesis, Wageningen University, Wageningen, the
Netherlands, 2002.
[17] Lin S. H., Peng C. F. A continuous Fenton’s process for treatment of textile
wastewater. Environmental Technology, 16:693-699, 1995.
[18] Case Studies Report, Color Reduction and Removal Seminar, North Carolina,
1998.
[19] Montano J., Ruiz N., Munoz I., Domenech X., Garcia-Hortal J., Torrades F.,
Peral J., Environmental assessment of different photo-Fenton approaches for
commercial reactive dye removal. Journal of Hazardous Materials, 138:218-225,
2006.
[20] Ustun G., Solmaz S., Birgul A., Regeneration of industrial district wastewater
using a combination of Fenton process and ion exchange – a case study. Resources
Conservation and Recycling, 52:425-440, 2007.
149

[21] Al-kdasi A., Idris A., Saed K., Guan C. T. Treatment of textile wastewater by
advanced oxidation processes – a review. Global Nest: the International Journal, 6
(3): 222-230, 2004.
[22] Tizaoui C., Bouselmi L., Mansouri L., Ghrabi A., Landfill leachate treatment
with ozone and ozone/hydrogen peroxide systems. Journal of Hazardous Materials,
140:316-324, 2007.
[23] Marcucci M., Ciabatti I., Matteucci A., Vernaglione G. Membrane
technologies applied to textile wastewater treatment. Annals of the New York
Academy of Science, 984:53-64, 2003.
[24] Uzal N. Recovery and reuse of indigo dyeing wastewater using membrane
technology, PhD thesis, Middle East technical University, Ankara, Turkey, 2007.
[25] Ng A., Kim A., A mini-review of modeling studies on membrane bioreactor
(MBR) treatment for municipal wastewaters. Desalination, 212:261-281, 2007.
[26] Zheng X., Liu J., Dyeing and printing wastewater treatment using a
membrane bioreactor with a gravity drain. Desalination, 190:277-286, 2007.
[27] Churchouse S., Wildgoose D. Membrane bioreactors progress from the
laboratory to full-scale use. MBR Technology, Bristol, UK.
[28] Hafez A., Khedr M., Gadallah H., Wastewater treatment and water reuse of
food processing industries. Part 2: Techno-economic study of a membrane separation
technique. Desalination, 214:261-272, 2007.
150

[29] Efficient use of water in the textile finishing industry. E-Water, European
Water Association, 2005.
[30] Florio L., Giordano A., Mattioli D., Nanofiltration of low-contaminated
textile rinsing effluents for on-site treatment and reuse. Desalination, 181:283-292,
2005.
[31] Marcucci M., Ciardelli G., Matteucci A., Ranieri L., Russo M., Experimental
campaigns on textile wastewater for reuse by means of different membrane
processes. Desalination, 149:137-143, 2002.
[32] Guiziou G. G., Alvarez N., Jacob D., Daufin G. Cleaning-in-place coupled
with membrane regeneration for re-using caustic soda solutions. Separation
Purification Technology, 54:329-339, 2007.
[33] Gorenflo A., Velazquez-Padron D., Frimmel F. H. Nanofiltration of a
German groundwater of high hardness and NOM content: performance and costs.
Desalination, 151:253-265, 2002.
[34] Van der Bruggen B., Everaert K., Wilms D., Vandecasteele C., Application of
nanofiltration for removal of pesticides, nitrate and hardness from ground water:
rejection properties and economic evaluation, Journal of Membrane Science,
193:239-248, 2001.
[35] Mavrotas G., Georgopoulou E., Mirasgedis S., Sarafidis Y., Lalas D., Hontou
V., Gakis N., An integrated approach for the selection of Best Available Techniques
(BAT) for the industries in the greater Athens area using multi-objective
combinatorial optimization. Energy Economics, 29(4):953-973, 2007.
151

[36] European Commission, http://ec.europa.eu/environment/air/pollutants/
stationary/ippc/summary.htm, last accessed on 12/08/2008.
[37] Dijkmans R., Methodology for selection of best available techniques (BAT)
at the sector level, Journal of Cleaner Production, 8:11-21, 2000.
[38] European Comission, Integrated Pollution Prevention and Control Directive,
Reference Document on “Best available techniques for the textile industry”, July
2003.
[39] Georgopoulou E., Hontou V., Gakis N., Sarafidis Y., Mirasgedis S., Lalas
D.P., Loukatos A., Gargoulas N., Mentzis A., Economidis D., Triantafilopoulos T.,
Korizi K., BEAsT: a decision-support tool for assessing the environmental benefits
and the economic attractiveness of best available techniques in industry, Journal of
Cleaner Production, 16(3):359-373, 2008.
[40] European Commission, Evaluation Unit, DG Regional Policy, "Guide to cost-
benefit analysis of investment projects", Bruxelles, 2002.
[41] European Commission, Evaluation Unit, DG Regional Policy, Guidance on
the methodology for carrying out Cost-Benefit Analysis, 2007.
[42] Yigit N.O., Uzal N., Koseoglu H., Harman I., Yukseler H., Yetis U.,
Civelekoglu G., Kitis M., Treatment of a denim producing textile industry
wastewater using pilot-scale membrane bioreactor (MBR), Desalination, In press.
[43] Takahashi N., Kumagai T., Removal of Dissolved Organic Carbon and Color
from Dyeing Wastewater by Pre-ozonation and Subsequent Biological Treatment,
Ozone. Science and Engineering, 28:199-205, 2006.
152

[44] Adaptation of the IPPC Directive to a Textile Mill in Turkey, 105Y088
TUBITAK, Project Report, Ankara, Turkey, 2008.
[45] Tchobanoglous, G., Burton, F. L., Stensel, H. D., Wastewater Engineering
Treatment and Reuse, 4th Ed., McGraw-Hill, New York, 2003.
[46] Munoz I., Peral J., Ayllon J. A., Malato S., Passarinho P., Domenech X., Life
cycle assessment of a coupled solar photocatalytic–biological process for wastewater
treatment, Water Research, 40:3533-3540, 2006.
[47] Dow Product and Services, “http.//www.dow.com/liquidseps/prod/nf270_400
htm”, last accessed on 21/06/2008.
[48] Liikanena R., Yli-Kuivilab J., Tenhunenc J., Laukkanend R., Cost and
environmental impact of nanofiltration in treating chemically pre-treated surface
water, Desalination, 201:58-70, 2006.
[49] Badiru A. B., Omitaomu O. A., Computational Economic Analysis for
Engineering Industry, CRC Press, New York, 2007.
[50] Kayseri Metropolitan Municipality Water and Sewerage Directorate,
“http.//www.kaski.gov.tr/tr/fiyat.php”, last accessed on 23/06/2008.
[51] Brown T., Engineering Economics and Economic Design for Process
Engineers, CRC Press, New York, 2007.
[52] Sekizinci Beş Yıllık Kalkınma Planı, Tekstil ve Giyim Snayi Özel İhtisas
Komisyonu Raporu, Devlet Planlama Teşkilatı, Ankara, Turkey, 2001.
153

[53] Akalin M. Insight into the Turkish textile and apparel industry, Electronic
Journal of Textiles, 1(1), 2001.
[54] Turkish Textile Industry. Technical Report. İstanbul Tekstil ve Konfeksiyon
İhracatçı Birlikleri Genel Sekreterliği, İstanbul, Turkey.
[55] Orta Anadolu Holding, “http://www.ortaanadolu.com/en/company-profile.
aspx”, last accessed on 21/08/2008.
[56] Sabah, “http://arsiv.sabah.com.tr/ozel/turkiyenin117/listebir.html”, last
accessed on 21/08/2008.
[57] Dokuzuncu Beş Yıllık Kalkınma Planı, Tekstil ve Giyim Snayi Özel İhtisas
Komisyonu Raporu, Devlet Planlama Teşkilatı, Ankara, Turkey, 2006.
[58] Annual Report 2007, Ministry of Environment and Forestry, Turkey, 2007.
154

APPENDIX A
WASTEWATER REUSE STANDARDS
Table A.1. Wastewater reuse criteria [54]
Parameters Design Criteria
COD (mg/L) 80
TSS (mg/L) 5
TDS (mg/L) 500
Hardness (mg/L as CaCO3) 60
Conductivity (µS/cm) 1,000
Alkalinity (mg/L as CaCO3) -
Color (Pt-Co) 20
Turbidity (NTU) 1
pH 6-8
155

APPENDIX B
DESIGN CRITERIA OF THE EXISTING WASTEWATER
TREATMENT PLANT
Table B.1. Design criteria of the existing wastewater treatment plant in the textile
mill
Parameters Design Criteria
Flowrate (m3/day) 3,600
COD (mg/L) 2,800
BOD (mg/L) 1,100
TSS (mg/L) 430
NH4-N (mg/L) 3.2
Free-Cl (mg/L) <0.3
Total Cr (mg/L) <0.5
Sulphide (mg/L) <2
Sulphite (mg/L) <1
Phenol (mg/L) <1
pH 11-12
156

APPENDIX C
SAMPLE WORKING SHEETS
These working sheets were derived from Microsoft Excel 2007.
157

Figure C.1. Input page for sensitivity analysis
158

Figure C.2. Working sheet of cross-media effect assessment for water recovery
studies
159

Figure C.3. Working sheet of financial analysis for water recovery studies
160
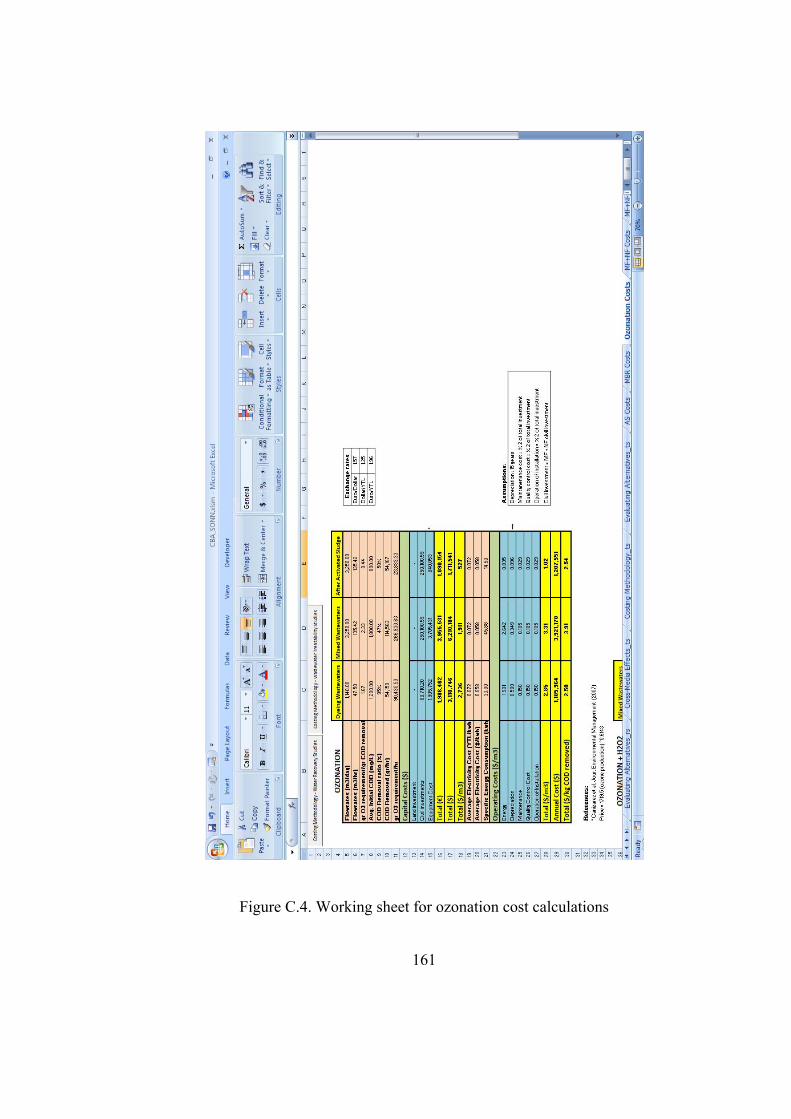
Figure C.4. Working sheet for ozonation cost calculations
161

APPENDIX D
SENSITIVITY DIAGRAMS
This appendix provides the sensitivity diagrams for each of the water recovery and
wastewater treatability alternatives.
162

Figure D.1. Investment cost sensitivity diagram for MF + NF alternative applied in water recovery studies
Figure D.2. Operating cost sensitivity diagram for MF + NF alternative applied in water recovery studies
163

Figure D.3. NPV sensitivity diagram for MF + NF alternative applied in water recovery studies
Figure D.4. Investment cost sensitivity diagram for ozonation alternative applied in water recovery studies
164

Figure D.5. Operating cost sensitivity diagram for ozonation alternative applied in water recovery studies
Figure D.6. NPV sensitivity diagram for ozonation alternative applied in water recovery studies
165

Figure D.7. Investment cost sensitivity diagram for the AS + MF + NF alternative applied in wastewater treatability studies
Figure D.8. Operating cost sensitivity diagram for the AS + MF + NF alternative applied in wastewater treatability studies
166

Figure D.9. NPV sensitivity diagram for the AS + MF + NF alternative applied in wastewater treatability studies
Figure D.10. Investment cost sensitivity diagram for the MBR alternative applied in wastewater treatability studies
167

Figure D.11. Operating cost sensitivity diagram for the MBR alternative applied in wastewater treatability studies
Figure D.12. NPV sensitivity diagram for the MBR alternative applied in wastewater treatability studies
168

Figure D.13. Investment cost sensitivity diagram for the ozonation + AS alternative applied in wastewater treatability studies
Figure D.14. Operating cost sensitivity diagram for the ozonation + AS alternative applied in wastewater treatability studies
169

Figure D.15. NPV sensitivity diagram for the ozonation + AS alternative applied in wastewater treatability studies
Figure D.16. Investment cost sensitivity diagram for the peroxone + AS alternative applied in wastewater treatability studies
170

Figure D.17. Operating cost sensitivity diagram for the peroxone + AS alternative applied in wastewater treatability studies
Figure D.18. NPV sensitivity diagram for the peroxone + AS alternative applied in wastewater treatability studies
171

Figure D.19. Investment cost sensitivity diagram for the post ozonation alternative applied in wastewater treatability studies
Figure D.20. Operating cost sensitivity diagram for the post ozonation alternative applied in wastewater treatability studies
172

Figure D.21. NPV sensitivity diagram for the post ozonation alternative applied in wastewater treatability studies
173

APPENDIX E
SENSITIVITY ANALYSIS RESULTS
In the following tables, the variations of the investment costs, operating costs, and
NPV values according to the change in the critical variables are given as a result of
sensitivity analyses performed both for water recovery studies and wastewater
treatability studies.
174

Table E.1. Changes in costs when critical variables change for water recovery
alternatives
Alternative options
Critical Variable
Change in variables
Investment cost
change
Operating cost change
NPV Change
33% 0% 0% 0% 0% 0% 0% 0% COD
-29% 0% 0% 0% 40% 0% 0% 0% 0% 0% 0% 0% Color
-40% 0% 0% 0% -40% 0% 0% 44% -20% 0% 0% 20% Discount
rate 0% 0% 0% 0% 0% 0% 0% 0% 5% 0% 2% -4% Energy
cost 10% 0% 5% -8% 0% 0% 0% 0% 1% 0% 0% -6% Operating
cost index 2% 0% 0% -12% 0% 0% 0% 0% 1% 1% 0% -3%
MF + NF
Exchange rate
variation 2% 2% 0% -5% 33% 19% 6% -8% 0% 0% 0% 0% COD
-29% -18% -6% 8% 40% 0% 0% 0% 0% 0% 0% 0% Color
-40% 0% 0% 0% -40% 0% 0% -23% -20% 0% 0% -10% Discount
rate 0% 0% 0% 0%
10% 0% 7% -6% 5% 0% 4% -3% Energy
cost 0% 0% 0% 0% 2% 0% 0% -7% 1% 0% 0% -4% Operating
cost index 0% 0% 0% 0% 0% 0% 0% 0% 1% 1% 0% 0%
Ozonation
Exchange rate
variation 2% 2% -1% 0%
175

Table E.2. Changes in costs when critical variables change for wastewater treatability
alternatives
Alternative options
Critical Variable
Change in variables
Investment cost
change
Operating cost change
NPV Change
78% 0% 0% 0% 0% 0% 0% 0% COD
-81% 0% 0% 0% 32% 0% 0% 0% 0% 0% 0% 0% Color
-34% 0% 0% 0% -40% 0% 0% -16% -20% 0% 0% -7% Discount
rate 0% 0% 0% 0% 0% 0% 2% 9% 5% 0% 1% 4% Energy
cost 10% 0% 0% 0% 0% 0% 0% -37% 1% 0% 0% -18% Operating
cost index 2% 0% 0% 0% 0% 0% 0% 0% 1% 1% -1% -1%
AS + MF + NF
Exchange rate
variation 2% 2% -1% -2% 78% 0% 0% 0% 0% 0% 0% 0% COD
-81% 0% 0% 0% 32% 0% 0% 0% 0% 0% 0% 0% Color
-34% 0% 0% 0% -40% 0% 0% 73% -20% 0% 0% 33% Discount
rate 0% 0% 0% 0%
10% 0% 1% -3% 5% 0% 0% -2% Energy
cost 0% 0% 0% 0% 0% 0% 0% -12% 1% 0% 0% -6% Operating
cost index 2% 0% 0% 0% 0% 0% 0% 0% 1% 0% 0% -4%
MBR
Exchange rate
variation 2% 0% 0% -7%
176

Table E.2. (Continued)
Alternative options
Critical Variable
Change in variables
Investment cost
change
Operating cost
change
NPV Change
78% 40% 6% -9% 0% 0% 0% 0% COD
-81% -59% -9% 14% 32% 0% 0% 0% 0% 0% 0% 0% Color
-34% 0% 0% 0% -40% 0% 0% -27% -20% 0% 0% -12% Discount
rate 0% 0% 0% 0% 0% 0% 6% -6% 5% 0% 3% -3% Energy
cost 10% 0% 0% 0% 0% 0% 0% -9% 1% 0% 0% -4% Operating
cost index 2% 0% 0% 0% 0% 0% 0% 0% 1% 1% 0% 1%
Ozonation + AS
Exchange rate
variation 2% 2% -1% 1% 78% 40% 5% -7% 0% 0% 0% 0% COD
-81% -59% -7% 10% 32% 0% 0% 0% 0% 0% 0% 0% Color
-34% 0% 0% 0% -40% 0% 0% -28% -20% 0% 0% -13% Discount
rate 0% 0% 0% 0%
10% 0% 6% -6% 5% 0% 3% -3% Energy
cost 0% 0% 0% 0% 0% 0% 0% -9% 1% 0% 0% -5% Operating
cost index 2% 0% 0% 0% 0% 0% 0% 0% 1% 1% -1% 1%
Ozonation + H2O2 + AS
Exchange rate
variation 2% 2% -1% 1%
177

Table E.2. (Continued)
Alternative options
Critical Variable
Change in
variables
Investment cost
change
Operating cost
change
NPV Change
78% 6% 1% -1% 0% 0% 0% 0% COD
-81% -3% -1% 0% 32% 0% 0% 0% 0% 0% 0% 0% Color
-34% 0% 0% 0% -40% 0% 0% -28% -20% 0% 0% -13% Discount
rate 0% 0% 0% 0% 0% 0% 4% -4% 5% 0% 2% -2% Energy
cost 10% 0% 0% 0% 0% 0% 0% -10% 1% 0% 0% -5% Operating
cost index 2% 0% 0% 0% 0% 0% 0% 0% 1% 1% -1% 1%
AS + Ozonation
Exchange rate
variation 2% 2% -2% 1%
178

APPENDIX F
CALCULATIONS FOR SUMMARY TABLES
Total flowrate = 3,250 m3/day
Dyeing wastewater flowrate = 1,140 m3/day
By applying membrane filtration to the textile mill for water recovery, the whole
system would be;
Dyeing wastewater flowrate = 1,140 m3/day (70 % water recovery achieved)
Rejected stream sent to AS = 342 m3/day
Flowrate treated by AS = (3,250 – 1,140) + 342 = 2,452 m3/day
Operating cost for;
Membrane filtration = 0.60 USD/m3
Activated sludge = 0.87 USD/m3
The calculated cross-media effects of the existing activated sludge system in the mill
are given in Figure F.1 below.
179

Figure F.1. Cross-media effects of the existing activated sludge system in the mill
180