sensible sonochemistry - pure · pdf filesensible sonochemistry / by maikel m. van iersel,...
TRANSCRIPT

Sensible sonochemistry
van Iersel, M.M.
DOI:10.6100/IR638503
Published: 01/01/2008
Document VersionPublisher’s PDF, also known as Version of Record (includes final page, issue and volume numbers)
Please check the document version of this publication:
• A submitted manuscript is the author's version of the article upon submission and before peer-review. There can be important differencesbetween the submitted version and the official published version of record. People interested in the research are advised to contact theauthor for the final version of the publication, or visit the DOI to the publisher's website.• The final author version and the galley proof are versions of the publication after peer review.• The final published version features the final layout of the paper including the volume, issue and page numbers.
Link to publication
Citation for published version (APA):Iersel, van, M. M. (2008). Sensible sonochemistry Eindhoven: Technische Universiteit Eindhoven DOI:10.6100/IR638503
General rightsCopyright and moral rights for the publications made accessible in the public portal are retained by the authors and/or other copyright ownersand it is a condition of accessing publications that users recognise and abide by the legal requirements associated with these rights.
• Users may download and print one copy of any publication from the public portal for the purpose of private study or research. • You may not further distribute the material or use it for any profit-making activity or commercial gain • You may freely distribute the URL identifying the publication in the public portal ?
Take down policyIf you believe that this document breaches copyright please contact us providing details, and we will remove access to the work immediatelyand investigate your claim.
Download date: 02. May. 2018
Sensible Sonochemistry
PROEFSCHRIFT
ter verkrijging van de graad van doctor aan de
Technische Universiteit Eindhoven, op gezag van de Rector Magnificus, prof.dr.ir. C.J. van Duijn, voor een
commissie aangewezen door het College voor Promoties in het openbaar te verdedigen
op donderdag 13 november 2008 om 16.00 uur
door
Maikel Maria van Iersel
geboren te Tilburg
Dit proefschrift is goedgekeurd door de promotor: prof.dr.ir. J.T.F. Keurentjes
Copromotor: dr.ir. N.E. Benes
© 2008, Maikel M. Van Iersel Sensible Sonochemistry / by Maikel M. van Iersel, Technische Universiteit Eindhoven, Eindhoven, 2008. A catalogue record is available from the Eindhoven University of Technology Library. ISBN: 978‐90‐386‐1438‐0 Printed by Universiteitsdrukkerij Technische Universiteit Eindhoven. Cover design by Maikel van Iersel and Paul Verspaget.


Summary
As compared to more conventional energy sources such as heat or light, ultrasound can provide unique conditions to drive chemical reactions. These unique conditions predominantly derive from acoustic cavitation, i.e. the sound‐induced growth and collapse of micrometer‐sized cavities in a liquid, leading to hot‐spots in the liquid. In the hot‐spots, temperatures of several thousands of Kelvins, pressures of hundreds of bars, and high heating and cooling rates can be achieved. These conditions can result in, e.g. the emission of light and the dissociation of chemical bonds. Chemistry induced or assisted by ultrasound irradiation is often referred to as sonochemistry.
In this thesis a single‐cavity dynamics model is described to study the governing physical processes in acoustic cavitation and the effect of process conditions on hot‐spot temperature, as the sonochemical effect strongly relates to the temperature attained upon collapse. The model predicts a rapid decrease in hot‐spot temperature with increasing bulk liquid temperature and increasing specific heat capacity of the gas dissolved in the liquid. These trends are in agreement with the trends obtained by experiments, which illustrate that the single‐cavity model can be employed to predict and understand the effect of process conditions on sonochemistry.
The chemical effect of ultrasound irradiation does not only depend on the magnitude of the temperature rise, but also on the molecules present inside or close to the collapsing cavity. In general argon is used in sonochemical processes, since the low heat capacity of a monoatomic gas allows for a significant temperature rise. However, monoatomic gasses are chemically inert and cannot participate in any chemical reaction. We demonstrate for aqueous systems that, by adding a small amount of methane, ethylene or iso‐butane to the gas feed, higher hydrogen production rates can be obtained, which implies an increase in radical production rate. Nevertheless, this increase upon hydrocarbon addition can not be employed for the acceleration of the aqueous polymerization of acrylics. Due to the high vapor pressure of methyl methacrylate, the cavity contains a relatively large amount of polyatomic reactant and the addition of methane to the feed has no additional advantage. For the polymerization of methacrylic acid, polymer scission has a relatively large contribution to the total radical production rate and hence, the benefit of methane for the polymerization rate is
i
almost negligible. On the contrary, optimization of the gas feed composition is crucial for gas‐phase reactions. By balancing the physical and chemical effects, i.e. heat capacity of the cavity interior and reactant concentration, yields of up to 20% are obtained for the monochlorination of methane. These high yields demonstrate for the first time that the high radical concentrations inside the collapsing cavities can be used very effectively.
Besides these chemical and physical aspects on the level of a cavity, the importance of macroscopic effects is also studied in this work. Intense sound fields give rise to the formation of a large cloud of bubbles close to the ultrasound emitter, which scatter and absorb the sound wave. By increasing the hydrostatic pressure, the bubble cloud is suppressed. This reduction in bubble cloud volume leads to a more efficient sound field and hence, can even result in a slight increase in sonochemical reactivity, regardless of the less efficient cavity dynamics at elevated pressure.
The limited solubility of organic reactants in water and the environmental impact of organic solvents have led to an increasing amount of research on the effect of ultrasound in alternative solvents. In particular, carbon dioxide (CO2) has been recognized as a viable alternative to conventional solvents. Numerical simulations reported in this thesis show that cavitation in liquid CO2 is impeded by mass and heat transport limitations. Due to these transport limitations the vapor pressure inside the cavity decreases, which hinders cavity expansion. As a result, non‐linear cavity motion is not predicted and ultrasound‐induced chemistry in CO2 appears improbable. On the contrary, high‐speed visualization studies reveal that for a mixture of carbon dioxide and argon ultrasound irradiation leads to extraordinary phenomena not occurring in aqueous systems, thereby providing significant improvements for ultrasound‐assisted processes in pressurized gases. Sonication of a liquid mixture gives rise to ejection of a macroscopic vapor phase from the ultrasound horn with a velocity of several meters per second. In the vicinity of the critical point ultrasound irradiation results in extremely fast local phase separation during each consecutive acoustic cycle. This phase transition can propagate with the speed of sound, but can also be located at fixed positions in the case of a standing wave.
The high yields obtained for the free‐radical polymerization of acrylics and the halogenation of methane demonstrate that ultrasound‐induced radicalization is an effective technique for the initiation of radical reactions. To fully exploit the potential of ultrasound in sonochemical processes, a solid understanding on the various aspects of acoustic cavitation is essential, for which this thesis offers a starting point. In particular, the performed gas‐phase reactions and the unique response of pressurized solvents have provided new insights and represent possible directions for future research.
ii
Samenvatting
In vergelijking tot conventionele energiebronnen, zoals warmte en licht, schept ultrasoon geluid unieke condities voor het uitvoeren van chemische reacties, ook wel sonochemie genoemd. De unieke condities komen tot stand via akoestische cavitatie: de door geluid veroorzaakte groei en implosie van microscopische belletjes in een vloeistof. De implosies kunnen lokaal temperaturen van duizenden Kelvin, drukken van honderden bar en hoge opwarm‐ en afkoelsnelheden veroorzaken. Dit proces kan resulteren in de emissie van licht en de dissociatie van chemische bindingen.
In dit proefschrift wordt de cavitatie dynamica van een enkele bel beschreven om de belangrijkste fysische processen in akoestische cavitatie en het effect van de procescondities op de implosietemperatuur te bestuderen. Het sonochemische effect is sterk afhankelijk van deze temperatuur. Volgens dit cavitatie dynamica model neemt de implosietemperatuur sterk af wanneer de vloeistoftemperatuur toeneemt en de specifieke warmtecapaciteit van het in de vloeistof opgeloste gas toeneemt. Deze effecten worden eveneens experimenteel aangetoond; daardoor is het model bruikbaar om het effect van een verandering in procescondities te begrijpen en te voorspellen.
Het chemische effect van ultrasoon geluid hangt niet alleen samen met de mate van de temperatuursstijging, maar ook met het type moleculen in of vlakbij de imploderende bel. Vaak wordt argon gebruikt voor sonochemische processen, omdat de lage warmtecapaciteit van monoatomische gassen zorgt voor een optimale temperatuursstijging. Monoatomische gassen zijn echter chemisch inert en kunnen daarom niet deelnemen aan een chemische reactie. Door een kleine hoeveelheid methaan, etheen of iso‐butaan aan de gasvoeding toe te voegen, kan de productie van waterstof in waterige systemen worden verhoogd. Dit impliceert dat in deze systemen ook meer radicalen worden gevormd. Toch leidt de toevoeging van methaan niet tot een snellere polymerisatie van acryl in water. Door de hoge dampspanning van methylmethacrylaat bevat de bel in afwezigheid van methaan al relatief veel polyatomisch reactant en leidt de toevoeging van methaan aan de gasvoeding niet tot een versnelde productie van radicalen. Tijdens de polymerisatie van methacrylzuur levert het breken van gevormd polymeer een relatief grote bijdrage aan de productie van radicalen; hierdoor is het voordeel van methaan op de polymerisatiesnelheid ook in
iii

dit geval bijna verwaarloosbaar. Anders dan bij polymerisatiereacties is sturing van de samenstelling van de gasvoeding cruciaal voor gasfasereacties. Voor de monochlorering van methaan is een opbrengst van 20% behaald door de juiste balans van specifieke warmtecapaciteit en reactantconcentratie van de gasvoeding. Een dusdanig hoge opbrengst toont aan dat het mogelijk is om de hoge concentratie aan radicalen in de imploderende bellen effectief te benutten.
Naast deze chemische en fysische effecten zijn ook macroscopische effecten van belang voor sonochemie. Ultrasoon geluid met een hoge intensiteit leidt vlakbij de bron tot de vorming van een grote bellenwolk, die het geluidsveld zowel verstrooit als absorbeert. Verhoging van de hydrostatische druk in het systeem kan het volume van een dergelijke bellenwolk onderdrukken. De afname in het volume van de bellenwolk leidt tot een efficiënter geluidsveld en, ondanks dat de belgroei wordt tegengewerkt bij verhoogde statische druk, kan zelfs resulteren in een lichte toename van de sonochemische reactiviteit.
De beperkte oplosbaarheid van organische reactanten in water en de impact van organische oplosmiddelen op het milieu hebben geleid tot een toename in het onderzoek naar het effect van ultrasoon geluid in alternatieve oplosmiddelen. Koolzuur (CO2) in het bijzonder wordt gezien als een mogelijk alternatief voor conventionele oplosmiddelen. Numerieke simulaties, uitgevoerd voor een vloeibaar mengsel van CO2 en argon, tonen aan dat tijdens de belgroei massa‐ en warmtetransportlimiteringen zorgen voor een daling van de dampspanning in de bel. Cavitatie en chemie geïnduceerd door ultrasoon geluid lijkt daarmee in dergelijke hogedruksystemen onwaarschijnlijk. Opnamen met een hogesnelheidscamera tonen echter aan dat blootstelling van dit mengsel aan ultrasoon geluid resulteert in bijzondere fenomenen. Deze fenomenen treden niet op in waterige systemen en kunnen significante implicaties hebben voor processen uitgevoerd in gecomprimeerde gassen. In een vloeistof leidt ultrasoon geluid gedurende enkele tientallen cycli tot de vorming van een macroscopische dampfase en de daaropvolgende verplaatsing met een snelheid van een aantal meter per seconde. In de nabijheid van het kritische punt resulteert ultrasoon geluid in een extreem snelle, lokale fasenscheiding tijdens iedere opeenvolgende akoestische cyclus. Deze fasenscheiding beweegt zich voort met de snelheid van het geluid of is gefixeerd op vaste posities in het geluidsveld bij een staande golf.
De hoge opbrengsten, die worden behaald bij de vrije radicaalpolymerisatie van acryl en de halogenering van methaan, tonen aan dat radicalisatie veroorzaakt door ultrasoon geluid een effectieve techniek is voor de initiatie van radicaalreacties. Om het
iv

potentieel van ultrasoon geluid in sonochemische processen volledig te kunnen benutten, is een goed begrip van de verschillende aspecten van akoestische cavitatie essentieel. Dit proefschrift kan hiervoor als startpunt dienen. In het bijzonder de uitgevoerde gasfasereacties en de unieke respons van gecomprimeerde gassen hebben tot nieuwe inzichten geleid; zij vertegenwoordigen mogelijke richtingen voor toekomstig onderzoek.
v

vi

Table of Contents
Summary i
Samenvatting iii
Table of Contents vii
1. Ultrasound and Chemistry 1
2. Comprehensible Numerical Model for Sonochemistry 15
3. Solvent and Solute Effects in Ultrasound‐Induced Polymerizations
37
4. High Yield Gas‐Phase Sonochlorination of Methane 55
5. Pressure‐Induced Reduction of Shielding for Improving Sonochemical Activity
63
6. Inhibition of Non‐Linear Acoustic Cavitation Dynamics in Liquid CO2
79
7. Sound‐Driven High‐Frequency Phase Transitions in Pressurized CO2
95
8. Sensible Sonochemistry 105
Dankwoord 123
Curriculum Vitae 125
vii

1
Ultrasound and Chemistry
Abstract
The utilization of high‐intensity ultrasound in chemical processes is referred to as sonochemistry. It is well known that ultrasound irradiation provides a powerful technique for establishing unique chemical and physical conditions, such as a local increase in temperature of several thousands of Kelvins. These unique conditions primarily arise from two main processes, which are addressed in this chapter. Additionally, an overview is given of the current applications of sonochemistry. While the majority of these studies have focused on aqueous systems, the potential of alternative solvents has also been recognized recently. Finally, the aim and outline of this thesis are described.
1
Chapter 1
1.1 Ultrasound
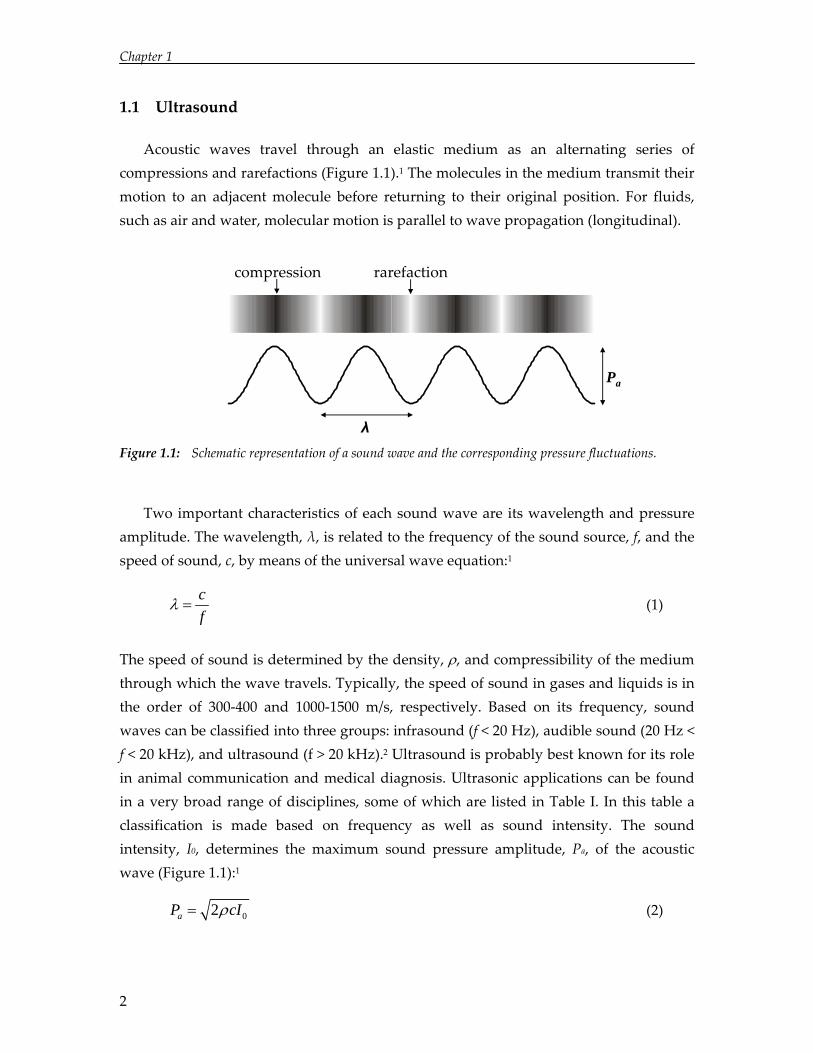
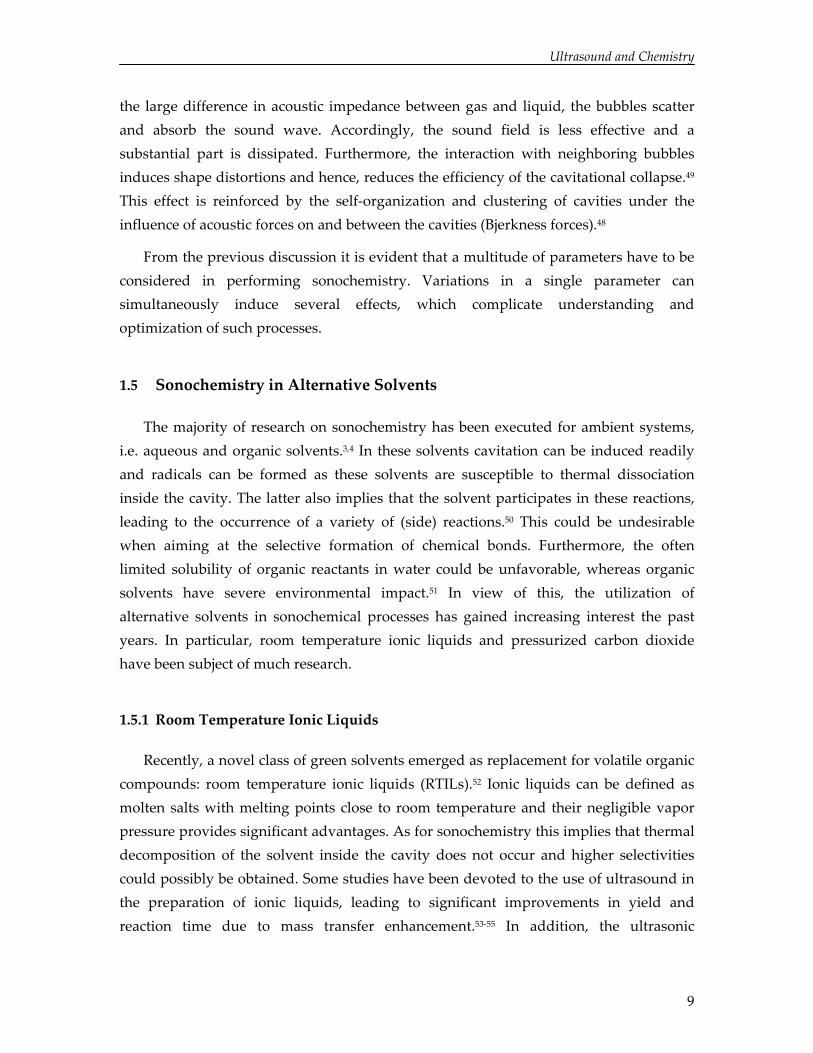
Acoustic waves travel through an elastic medium as an alternating series of compressions and rarefactions (Figure 1.1).1 The molecules in the medium transmit their motion to an adjacent molecule before returning to their original position. For fluids, such as air and water, molecular motion is parallel to wave propagation (longitudinal).
λ
Pa
compression rarefaction
Figure 1.1: Schematic representation of a sound wave and the corresponding pressure fluctuations.
Two important characteristics of each sound wave are its wavelength and pressure amplitude. The wavelength, λ, is related to the frequency of the sound source, f, and the speed of sound, c, by means of the universal wave equation:1
cf
λ = (1)
The speed of sound is determined by the density, ρ, and compressibility of the medium through which the wave travels. Typically, the speed of sound in gases and liquids is in the order of 300‐400 and 1000‐1500 m/s, respectively. Based on its frequency, sound waves can be classified into three groups: infrasound (f < 20 Hz), audible sound (20 Hz < f < 20 kHz), and ultrasound (f > 20 kHz).2 Ultrasound is probably best known for its role in animal communication and medical diagnosis. Ultrasonic applications can be found in a very broad range of disciplines, some of which are listed in Table I. In this table a classification is made based on frequency as well as sound intensity. The sound intensity, I0, determines the maximum sound pressure amplitude, Pa, of the acoustic wave (Figure 1.1):1
02aP cρ= I (2)
2
Ultrasound and Chemistry
Table I: Various applications of ultrasound.2,3
Low frequency ultrasound
(20 kHz – 1 MHz)
High frequency ultrasound
(1 – 10 MHz)
Low intensity Sonophoresis Medical diagnosis
High intensity
Welding
Cleaning
Cell disruption
Lithotripsy
Engineering applications
Sonochemistry
Massage therapy
Drug delivery
A wide variety of engineering applications can be found in industry, such as cutting of brittle materials and surface treatment. The utilization of low frequency, high‐intensity ultrasound in chemical processes is referred to as sonochemistry. The large number of books on sonochemistry during the past decades illustrates the increasing interest in this field, which is mainly due to the wider availability of commercial ultrasound equipment.3‐6 It has been reported that ultrasound irradiation successfully increases conversion, changes reaction pathways, initiates reactions, and accelerates mixing.7 The exact origin of these physical and chemical effects is explained in the following section.
1.2 Governing Processes in Sonochemistry
The benefits of ultrasound irradiation in chemical processes principally derive from two main processes: acoustic streaming and acoustic cavitation.
1.2.1 Acoustic Streaming
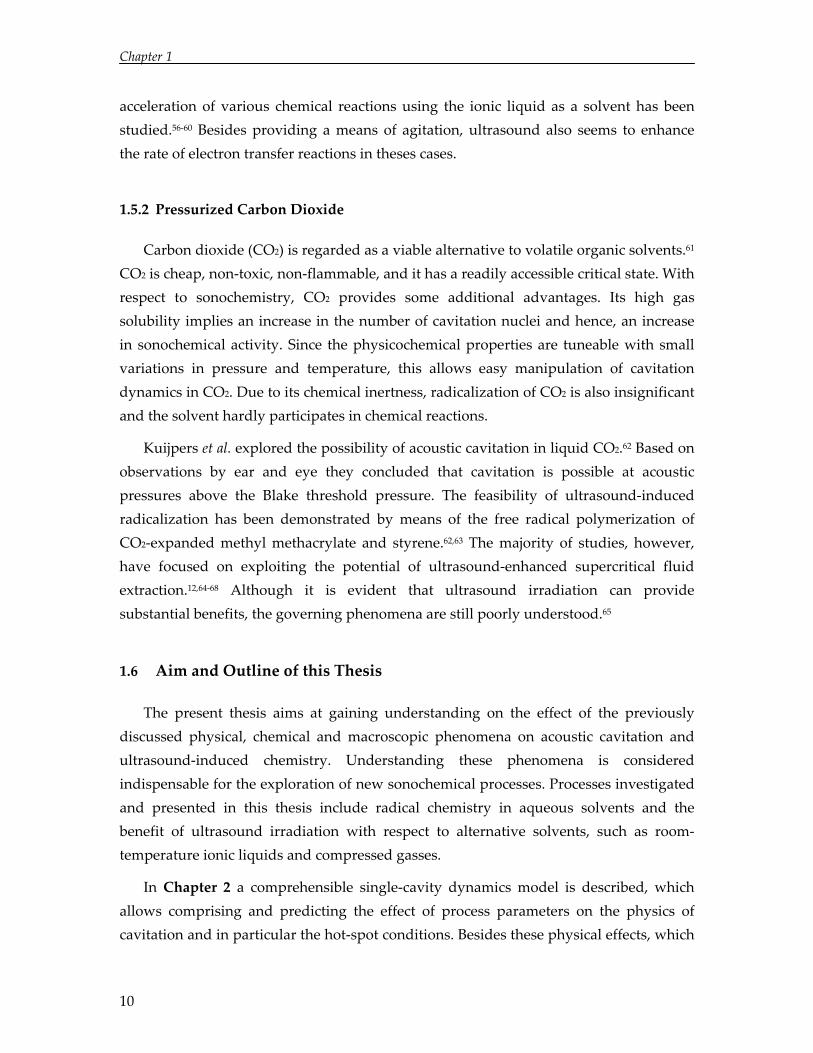
A sound wave loses its momentum when traveling through a liquid, e.g. due to viscous friction.8 The momentum is transferred to the liquid, resulting in the formation of liquid motion in the direction of wave propagation. This sound‐induced flow is often referred to as acoustic streaming (Figure 1.2). Typically, streaming velocities of a few centimeters up to a meter per second can be obtained.9 In the presence of a small particle, friction between the fluid and the particle can also give rise to micro‐
3
Chapter 1
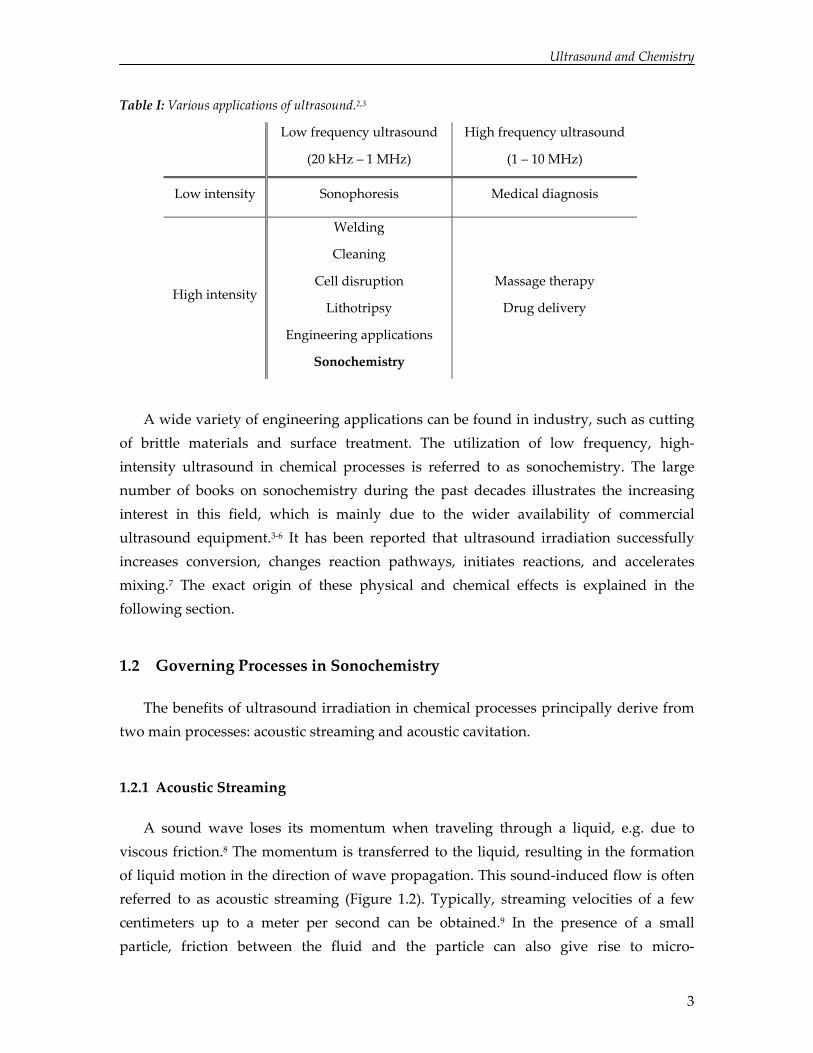
streaming.10 Due to these phenomena, ultrasound provides a non‐invasive means for enhancing mass and heat transfer.11,12 However, the energy efficiency of ultrasound‐induced mixing is rather low compared to conventional mechanical stirring, since a substantial part of the sound energy (~99%) is converted into heat and used for other processes, e.g. acoustic cavitation.
Horn
Bottom of reactor
Figure 1.2: Image showing the effect of ultrasound irradiation on aqueous systems. A large cloud of
bubbles is formed directly below the ultrasound horn. The arrows indicate the direction of acoustic streaming.
1.2.2 Acoustic Cavitation
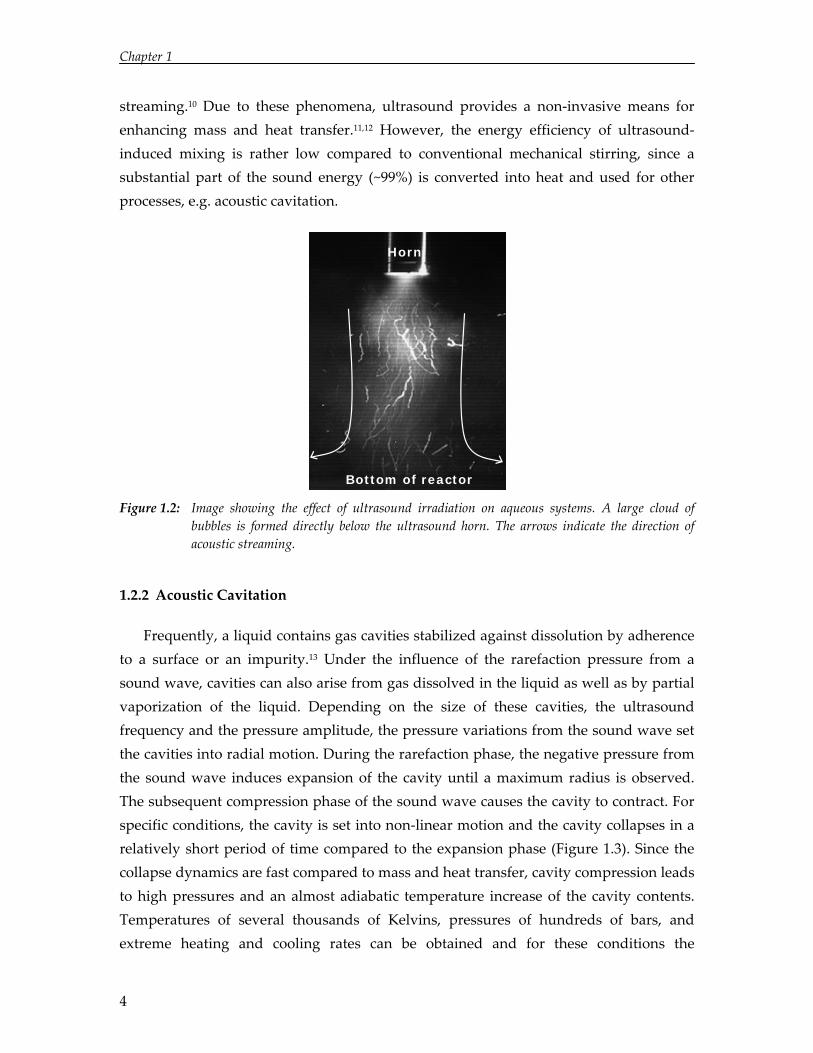
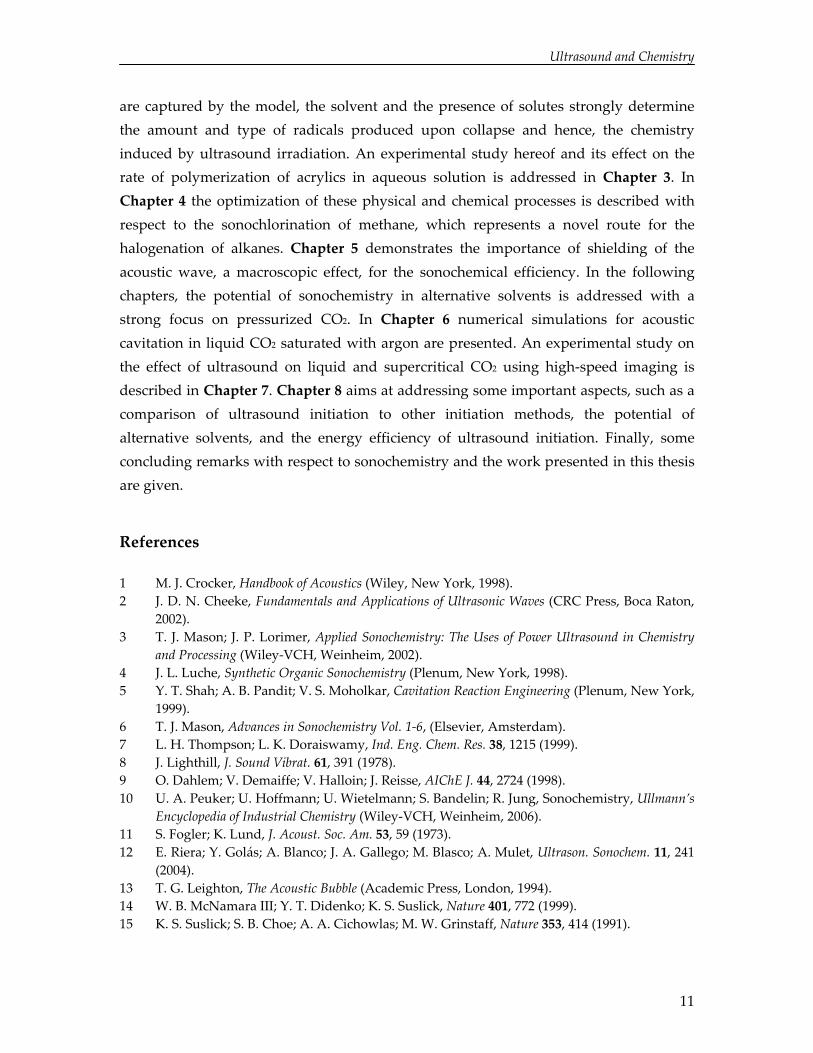
Frequently, a liquid contains gas cavities stabilized against dissolution by adherence to a surface or an impurity.13 Under the influence of the rarefaction pressure from a sound wave, cavities can also arise from gas dissolved in the liquid as well as by partial vaporization of the liquid. Depending on the size of these cavities, the ultrasound frequency and the pressure amplitude, the pressure variations from the sound wave set the cavities into radial motion. During the rarefaction phase, the negative pressure from the sound wave induces expansion of the cavity until a maximum radius is observed. The subsequent compression phase of the sound wave causes the cavity to contract. For specific conditions, the cavity is set into non‐linear motion and the cavity collapses in a relatively short period of time compared to the expansion phase (Figure 1.3). Since the collapse dynamics are fast compared to mass and heat transfer, cavity compression leads to high pressures and an almost adiabatic temperature increase of the cavity contents. Temperatures of several thousands of Kelvins, pressures of hundreds of bars, and extreme heating and cooling rates can be obtained and for these conditions the
4
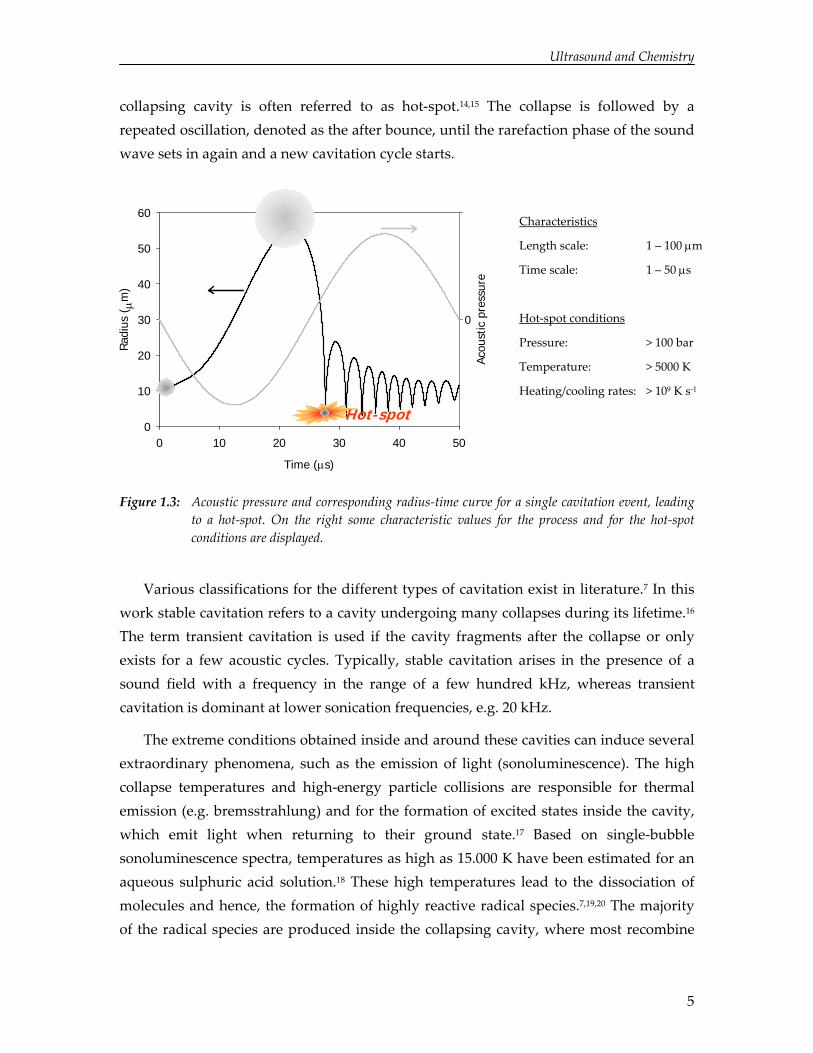
Ultrasound and Chemistry
collapsing cavity is often referred to as hot‐spot.14,15 The collapse is followed by a repeated oscillation, denoted as the after bounce, until the rarefaction phase of the sound wave sets in again and a new cavitation cycle starts.
Time (μs)
0 10 20 30 40 50
Rad
ius
(
μm)
0
10
40
50
60
20
30
Acou
stic
pre
ssur
e
Characteristics
Length scale: 1 – 100 μm
Time scale: 1 – 50 μs
Hot‐spot conditions
Pressure: > 100 bar
Temperature: > 5000 K
Heating/cooling rates: > 109 K s‐1
Hot-spot
0
Figure 1.3: Acoustic pressure and corresponding radius‐time curve for a single cavitation event, leading to a hot‐spot. On the right some characteristic values for the process and for the hot‐spot conditions are displayed.
Various classifications for the different types of cavitation exist in literature.7 In this work stable cavitation refers to a cavity undergoing many collapses during its lifetime.16 The term transient cavitation is used if the cavity fragments after the collapse or only exists for a few acoustic cycles. Typically, stable cavitation arises in the presence of a sound field with a frequency in the range of a few hundred kHz, whereas transient cavitation is dominant at lower sonication frequencies, e.g. 20 kHz.
The extreme conditions obtained inside and around these cavities can induce several extraordinary phenomena, such as the emission of light (sonoluminescence). The high collapse temperatures and high‐energy particle collisions are responsible for thermal emission (e.g. bremsstrahlung) and for the formation of excited states inside the cavity, which emit light when returning to their ground state.17 Based on single‐bubble sonoluminescence spectra, temperatures as high as 15.000 K have been estimated for an aqueous sulphuric acid solution.18 These high temperatures lead to the dissociation of molecules and hence, the formation of highly reactive radical species.7,19,20 The majority of the radical species are produced inside the collapsing cavity, where most recombine
5
Chapter 1
before entering the liquid.21 Furthermore, the temperature of the liquid surrounding the cavity can also increase substantially and lead to radical formation in the liquid phase.22 In addition to these chemical effects, cavitation gives rise to some physical effects. The collapsing cavities can induce high velocities and strain rates in the liquid around the cavity and shock waves, leading to high‐velocity particle collisions and polymer scission.23,24 In the vicinity of a phase boundary, the collapse is asymmetric and a microjet is formed perpendicular to the surface. These microjets can reach speeds up to 100 m/s and alter surfaces significantly.25
1.3 Applications of Sonochemistry
Since cavitation leads to the formation of radicals, it seems evident that ultrasound irradiation can initiate or enhance free‐radical reactions, such as free‐radical polymerizations.3,7 Typical examples hereof include the bulk and emulsion polymerization of methyl methacrylate, styrene and butyl acrylate.26‐29 Currently, there is only one report on the sonochemical halogenation of alkanes, which represents another classical example of free‐radical reactions.30 Ultrasound is also known to accelerate reactions that do not proceed by means of a radical mechanism, such as some Diels‐Alder and Wittig‐Horner reactions.31,32 Frequently, the exact mechanism is poorly understood.33 For some of these reactions it is claimed that ultrasonic enhancement arises from the acceleration of single‐electron‐transfer (SET) processes. Reactions that follow an ionic mechanism are generally not affected by ultrasound irradiation.34 However, in the presence of ultrasound a free‐radical or SET mechanism could be favored over the ionic mechanism, thereby changing the reaction pathway (sonochemical switching).35,36 Additionally, ultrasound is frequently employed in the degradation of organic solutes in aqueous solution, either by direct decomposition or by attack from radicals arising from the dissociation of water.37 In heterogeneous systems, ultrasonic enhancement is predominantly associated with the physical effects of ultrasound and cavitation. A typical example hereof includes the emulsification of two immiscible liquids for applications in emulsion polymerization and phase transfer catalysis.38‐40 In particular, the sonication of liquid‐solid mixtures provides unique conditions, e.g. for the activation of metal catalysts.3
6
Ultrasound and Chemistry
1.3.1 Industrial Applications
There are a number of engineering and processing applications involving ultrasound, such as cutting, atomization, mixing, extraction, and crystallization.3 Recently, the utilization of ultrasound in membrane processes has received increasing interest.41 However, only a limited number of applications involve the use of ultrasound in chemical reactions, especially in which the benefit is based on the chemical effect of cavitation. Up to now, advanced oxidation processes for waste water treatment represent one of the few commercial applications.42,43 Advanced oxidation processes involve the ultrasound‐induced decomposition of organic and inorganic pollutants in aqueous solution by hydroxyl radicals, possibly upon addition of oxygen, ozone, or peroxide. The use of ultrasound in industrial chemical processes is still limited, mainly due to its low energy‐efficiency and scale‐up difficulties, and the importance of process optimization has been recognized.44
1.4 Factors of Consideration in Sonochemistry
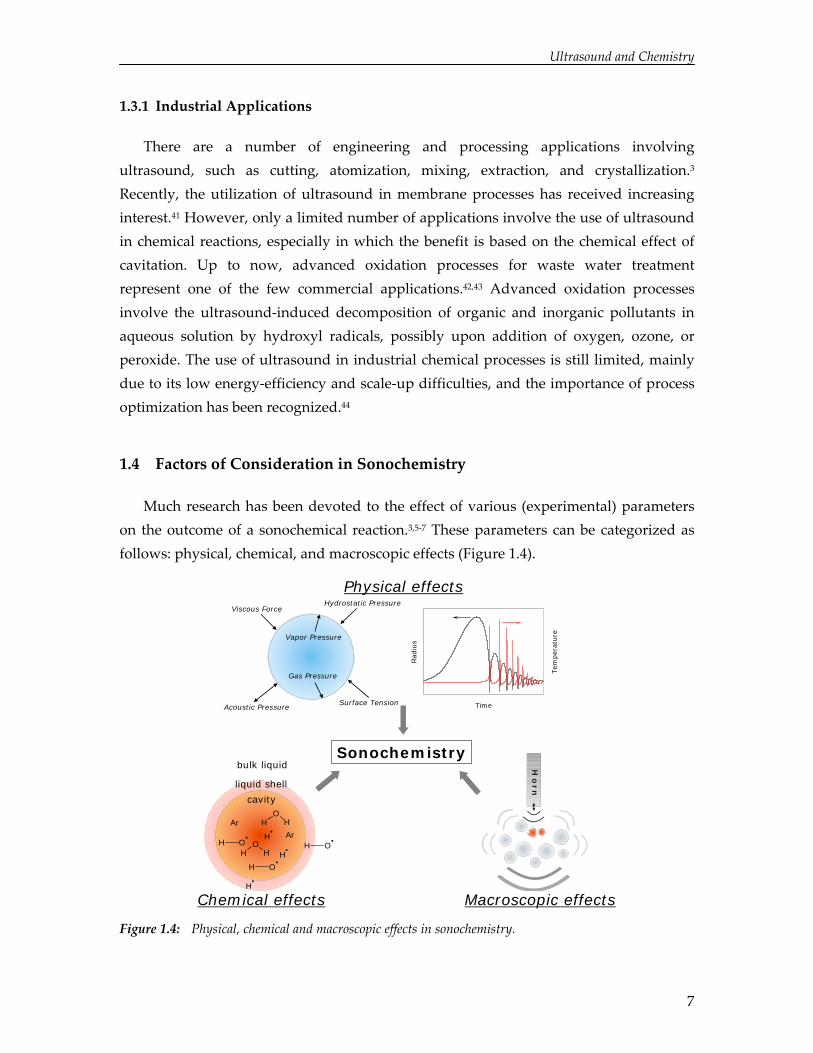
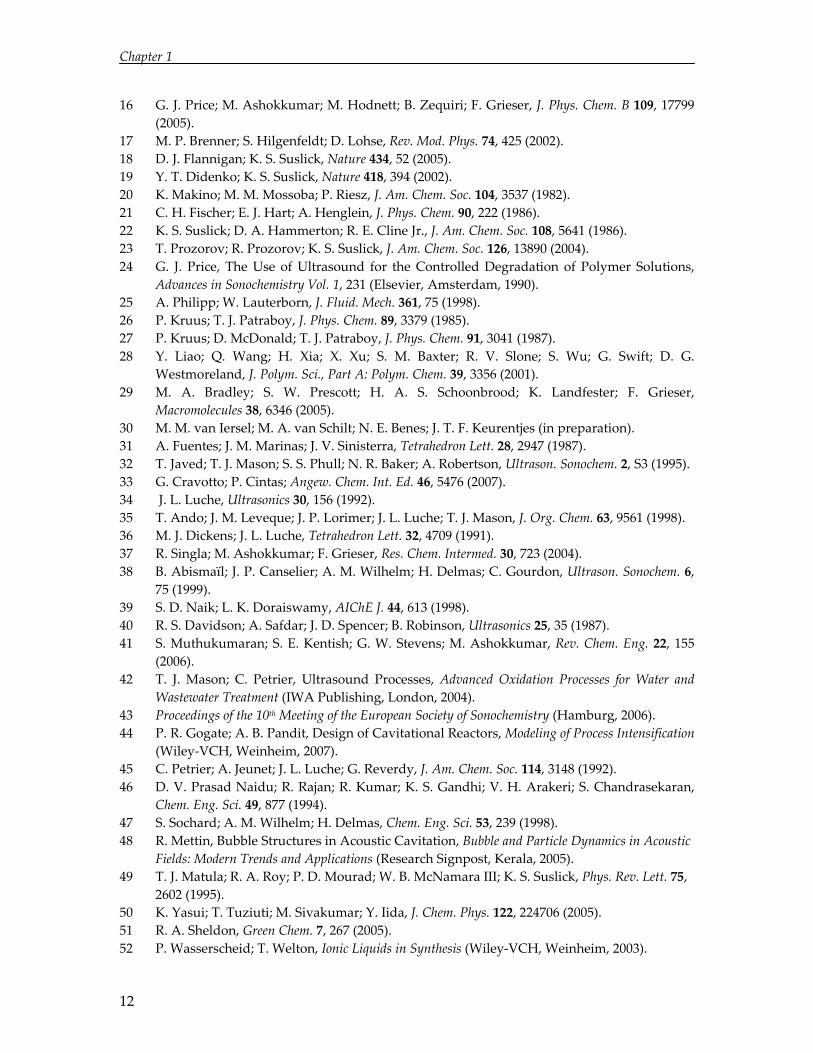
Much research has been devoted to the effect of various (experimental) parameters on the outcome of a sonochemical reaction.3,5‐7 These parameters can be categorized as follows: physical, chemical, and macroscopic effects (Figure 1.4).
Sonochemistry
Ho
rn
cavity
liquid shell
bulk liquid
ArH
OHHAr
OHH H
H
H O
H O H O
Physical effects
Chemical effects Macroscopic effects
Acoustic Pressure
Gas Pressure
Vapor Pressure
Surface Tension
Viscous ForceHydrostatic Pressure
Time
Rad
ius
Tem
per
ature
Figure 1.4: Physical, chemical and macroscopic effects in sonochemistry.
7
Chapter 1
1.4.1 Physical Effects
The cavitation dynamics and corresponding temperature rise are strongly determined by the physicochemical properties of the liquid and gasses dissolved.5‐7 Examples of liquid properties include bulk temperature, viscosity, and surface tension. In addition, the characteristics of the imposed sound field, i.e. intensity and frequency, are also of considerable importance. For instance, a higher ultrasound frequency enhances the number of collapses per unit time, whereas the intensity of cavitational collapse decreases.45 Much of these physical effects can be captured using a single‐cavity dynamics model.13,17 The Rayleigh‐Plesset equation or a more elaborate equation of motion is often on the basis of such a model and it relates the forces involved to radial motion. To predict the composition of the cavity interior and the temperature attained upon collapse, these models are frequently extended with descriptions for mass and heat transport.
1.4.2 Chemical Effects
Upon cavity collapse, molecules present inside or around the cavity can dissociate and form radicals. Since the magnitude of the temperature increase varies for the different reaction zones, the ‘location’ of a reactant is of primary importance.7 A volatile reactant is susceptible to thermal dissociation inside the cavity, whereas a non‐volatile reactant can merely dissociate in the relatively cold liquid shell surrounding the cavity or by attack from primary radicals. For obvious reasons, the number and type of radicals produced strongly influence the chemical effect of ultrasound irradiation. Therefore, chemical reaction kinetics have been incorporated into various single‐cavity dynamics models described in literature.46,47 Additionally, dissociation of polyatomic species inside the collapsing cavity substantially lowers the temperature rise.19
1.4.3 Macroscopic Effects
The previously discussed physical and chemical effects are associated with processes occurring on the level of a single cavity. Conventional ultrasound equipment, i.e. ultrasonic baths and probe systems, involves the simultaneous formation and activation of a large cloud of bubbles.48 Although macroscopic phenomena are often disregarded, these can have a pronounced influence on the sonochemical effect. First of all, the cavities have a strong impact on the intensity and distribution of the sound field. Due to
8
Ultrasound and Chemistry
the large difference in acoustic impedance between gas and liquid, the bubbles scatter and absorb the sound wave. Accordingly, the sound field is less effective and a substantial part is dissipated. Furthermore, the interaction with neighboring bubbles induces shape distortions and hence, reduces the efficiency of the cavitational collapse.49 This effect is reinforced by the self‐organization and clustering of cavities under the influence of acoustic forces on and between the cavities (Bjerkness forces).48
From the previous discussion it is evident that a multitude of parameters have to be considered in performing sonochemistry. Variations in a single parameter can simultaneously induce several effects, which complicate understanding and optimization of such processes.
1.5 Sonochemistry in Alternative Solvents
The majority of research on sonochemistry has been executed for ambient systems, i.e. aqueous and organic solvents.3,4 In these solvents cavitation can be induced readily and radicals can be formed as these solvents are susceptible to thermal dissociation inside the cavity. The latter also implies that the solvent participates in these reactions, leading to the occurrence of a variety of (side) reactions.50 This could be undesirable when aiming at the selective formation of chemical bonds. Furthermore, the often limited solubility of organic reactants in water could be unfavorable, whereas organic solvents have severe environmental impact.51 In view of this, the utilization of alternative solvents in sonochemical processes has gained increasing interest the past years. In particular, room temperature ionic liquids and pressurized carbon dioxide have been subject of much research.
1.5.1 Room Temperature Ionic Liquids
Recently, a novel class of green solvents emerged as replacement for volatile organic compounds: room temperature ionic liquids (RTILs).52 Ionic liquids can be defined as molten salts with melting points close to room temperature and their negligible vapor pressure provides significant advantages. As for sonochemistry this implies that thermal decomposition of the solvent inside the cavity does not occur and higher selectivities could possibly be obtained. Some studies have been devoted to the use of ultrasound in the preparation of ionic liquids, leading to significant improvements in yield and reaction time due to mass transfer enhancement.53‐55 In addition, the ultrasonic
9
Chapter 1
acceleration of various chemical reactions using the ionic liquid as a solvent has been studied.56‐60 Besides providing a means of agitation, ultrasound also seems to enhance the rate of electron transfer reactions in theses cases.
1.5.2 Pressurized Carbon Dioxide
Carbon dioxide (CO2) is regarded as a viable alternative to volatile organic solvents.61 CO2 is cheap, non‐toxic, non‐flammable, and it has a readily accessible critical state. With respect to sonochemistry, CO2 provides some additional advantages. Its high gas solubility implies an increase in the number of cavitation nuclei and hence, an increase in sonochemical activity. Since the physicochemical properties are tuneable with small variations in pressure and temperature, this allows easy manipulation of cavitation dynamics in CO2. Due to its chemical inertness, radicalization of CO2 is also insignificant and the solvent hardly participates in chemical reactions.
Kuijpers et al. explored the possibility of acoustic cavitation in liquid CO2.62 Based on observations by ear and eye they concluded that cavitation is possible at acoustic pressures above the Blake threshold pressure. The feasibility of ultrasound‐induced radicalization has been demonstrated by means of the free radical polymerization of CO2‐expanded methyl methacrylate and styrene.62,63 The majority of studies, however, have focused on exploiting the potential of ultrasound‐enhanced supercritical fluid extraction.12,64‐68 Although it is evident that ultrasound irradiation can provide substantial benefits, the governing phenomena are still poorly understood.65
1.6 Aim and Outline of this Thesis
The present thesis aims at gaining understanding on the effect of the previously discussed physical, chemical and macroscopic phenomena on acoustic cavitation and ultrasound‐induced chemistry. Understanding these phenomena is considered indispensable for the exploration of new sonochemical processes. Processes investigated and presented in this thesis include radical chemistry in aqueous solvents and the benefit of ultrasound irradiation with respect to alternative solvents, such as room‐temperature ionic liquids and compressed gasses.
In Chapter 2 a comprehensible single‐cavity dynamics model is described, which allows comprising and predicting the effect of process parameters on the physics of cavitation and in particular the hot‐spot conditions. Besides these physical effects, which
10
Ultrasound and Chemistry
are captured by the model, the solvent and the presence of solutes strongly determine the amount and type of radicals produced upon collapse and hence, the chemistry induced by ultrasound irradiation. An experimental study hereof and its effect on the rate of polymerization of acrylics in aqueous solution is addressed in Chapter 3. In Chapter 4 the optimization of these physical and chemical processes is described with respect to the sonochlorination of methane, which represents a novel route for the halogenation of alkanes. Chapter 5 demonstrates the importance of shielding of the acoustic wave, a macroscopic effect, for the sonochemical efficiency. In the following chapters, the potential of sonochemistry in alternative solvents is addressed with a strong focus on pressurized CO2. In Chapter 6 numerical simulations for acoustic cavitation in liquid CO2 saturated with argon are presented. An experimental study on the effect of ultrasound on liquid and supercritical CO2 using high‐speed imaging is described in Chapter 7. Chapter 8 aims at addressing some important aspects, such as a comparison of ultrasound initiation to other initiation methods, the potential of alternative solvents, and the energy efficiency of ultrasound initiation. Finally, some concluding remarks with respect to sonochemistry and the work presented in this thesis are given.
References
1 M. J. Crocker, Handbook of Acoustics (Wiley, New York, 1998). 2 J. D. N. Cheeke, Fundamentals and Applications of Ultrasonic Waves (CRC Press, Boca Raton,
2002). 3 T. J. Mason; J. P. Lorimer, Applied Sonochemistry: The Uses of Power Ultrasound in Chemistry
and Processing (Wiley‐VCH, Weinheim, 2002). 4 J. L. Luche, Synthetic Organic Sonochemistry (Plenum, New York, 1998). 5 Y. T. Shah; A. B. Pandit; V. S. Moholkar, Cavitation Reaction Engineering (Plenum, New York,
1999). 6 T. J. Mason, Advances in Sonochemistry Vol. 1‐6, (Elsevier, Amsterdam). 7 L. H. Thompson; L. K. Doraiswamy, Ind. Eng. Chem. Res. 38, 1215 (1999). 8 J. Lighthill, J. Sound Vibrat. 61, 391 (1978). 9 O. Dahlem; V. Demaiffe; V. Halloin; J. Reisse, AIChE J. 44, 2724 (1998). 10 U. A. Peuker; U. Hoffmann; U. Wietelmann; S. Bandelin; R. Jung, Sonochemistry, Ullmann’s
Encyclopedia of Industrial Chemistry (Wiley‐VCH, Weinheim, 2006). 11 S. Fogler; K. Lund, J. Acoust. Soc. Am. 53, 59 (1973). 12 E. Riera; Y. Golás; A. Blanco; J. A. Gallego; M. Blasco; A. Mulet, Ultrason. Sonochem. 11, 241
(2004). 13 T. G. Leighton, The Acoustic Bubble (Academic Press, London, 1994). 14 W. B. McNamara III; Y. T. Didenko; K. S. Suslick, Nature 401, 772 (1999). 15 K. S. Suslick; S. B. Choe; A. A. Cichowlas; M. W. Grinstaff, Nature 353, 414 (1991).
11
Chapter 1
16 G. J. Price; M. Ashokkumar; M. Hodnett; B. Zequiri; F. Grieser, J. Phys. Chem. B 109, 17799 (2005).
17 M. P. Brenner; S. Hilgenfeldt; D. Lohse, Rev. Mod. Phys. 74, 425 (2002). 18 D. J. Flannigan; K. S. Suslick, Nature 434, 52 (2005). 19 Y. T. Didenko; K. S. Suslick, Nature 418, 394 (2002). 20 K. Makino; M. M. Mossoba; P. Riesz, J. Am. Chem. Soc. 104, 3537 (1982). 21 C. H. Fischer; E. J. Hart; A. Henglein, J. Phys. Chem. 90, 222 (1986). 22 K. S. Suslick; D. A. Hammerton; R. E. Cline Jr., J. Am. Chem. Soc. 108, 5641 (1986). 23 T. Prozorov; R. Prozorov; K. S. Suslick, J. Am. Chem. Soc. 126, 13890 (2004). 24 G. J. Price, The Use of Ultrasound for the Controlled Degradation of Polymer Solutions,
Advances in Sonochemistry Vol. 1, 231 (Elsevier, Amsterdam, 1990). 25 A. Philipp; W. Lauterborn, J. Fluid. Mech. 361, 75 (1998). 26 P. Kruus; T. J. Patraboy, J. Phys. Chem. 89, 3379 (1985). 27 P. Kruus; D. McDonald; T. J. Patraboy, J. Phys. Chem. 91, 3041 (1987). 28 Y. Liao; Q. Wang; H. Xia; X. Xu; S. M. Baxter; R. V. Slone; S. Wu; G. Swift; D. G.
Westmoreland, J. Polym. Sci., Part A: Polym. Chem. 39, 3356 (2001). 29 M. A. Bradley; S. W. Prescott; H. A. S. Schoonbrood; K. Landfester; F. Grieser,
Macromolecules 38, 6346 (2005). 30 M. M. van Iersel; M. A. van Schilt; N. E. Benes; J. T. F. Keurentjes (in preparation). 31 A. Fuentes; J. M. Marinas; J. V. Sinisterra, Tetrahedron Lett. 28, 2947 (1987). 32 T. Javed; T. J. Mason; S. S. Phull; N. R. Baker; A. Robertson, Ultrason. Sonochem. 2, S3 (1995). 33 G. Cravotto; P. Cintas; Angew. Chem. Int. Ed. 46, 5476 (2007). 34 J. L. Luche, Ultrasonics 30, 156 (1992). 35 T. Ando; J. M. Leveque; J. P. Lorimer; J. L. Luche; T. J. Mason, J. Org. Chem. 63, 9561 (1998). 36 M. J. Dickens; J. L. Luche, Tetrahedron Lett. 32, 4709 (1991). 37 R. Singla; M. Ashokkumar; F. Grieser, Res. Chem. Intermed. 30, 723 (2004). 38 B. Abismaïl; J. P. Canselier; A. M. Wilhelm; H. Delmas; C. Gourdon, Ultrason. Sonochem. 6,
75 (1999). 39 S. D. Naik; L. K. Doraiswamy, AIChE J. 44, 613 (1998). 40 R. S. Davidson; A. Safdar; J. D. Spencer; B. Robinson, Ultrasonics 25, 35 (1987). 41 S. Muthukumaran; S. E. Kentish; G. W. Stevens; M. Ashokkumar, Rev. Chem. Eng. 22, 155
(2006). 42 T. J. Mason; C. Petrier, Ultrasound Processes, Advanced Oxidation Processes for Water and
Wastewater Treatment (IWA Publishing, London, 2004). 43 Proceedings of the 10th Meeting of the European Society of Sonochemistry (Hamburg, 2006). 44 P. R. Gogate; A. B. Pandit, Design of Cavitational Reactors, Modeling of Process Intensification
(Wiley‐VCH, Weinheim, 2007). 45 C. Petrier; A. Jeunet; J. L. Luche; G. Reverdy, J. Am. Chem. Soc. 114, 3148 (1992). 46 D. V. Prasad Naidu; R. Rajan; R. Kumar; K. S. Gandhi; V. H. Arakeri; S. Chandrasekaran,
Chem. Eng. Sci. 49, 877 (1994). 47 S. Sochard; A. M. Wilhelm; H. Delmas, Chem. Eng. Sci. 53, 239 (1998). 48 R. Mettin, Bubble Structures in Acoustic Cavitation, Bubble and Particle Dynamics in Acoustic
Fields: Modern Trends and Applications (Research Signpost, Kerala, 2005). 49 T. J. Matula; R. A. Roy; P. D. Mourad; W. B. McNamara III; K. S. Suslick, Phys. Rev. Lett. 75,
2602 (1995). 50 K. Yasui; T. Tuziuti; M. Sivakumar; Y. Iida, J. Chem. Phys. 122, 224706 (2005). 51 R. A. Sheldon, Green Chem. 7, 267 (2005). 52 P. Wasserscheid; T. Welton, Ionic Liquids in Synthesis (Wiley‐VCH, Weinheim, 2003).
12
Ultrasound and Chemistry
53 V. Namboodiri; R. S. Varma, Org. Lett. 4, 3161 (2002). 54 J. M. Lévêque; J. L. Luche; C. Pétrier; R. Roux; W. Bonrath, Green Chem. 4, 357 (2002). 55 J. M. Lévêque; S. Desset; J. Suptil; C. Fachinger; M. Draye; W. Bonrath; G. Cravotto,
Ultrason. Sonochem. 13, 189 (2006). 56 R. R. Deshmukh; R. Rajagopal; K. V. Srinivasan, Chem. Commun. 17, 1544 (2001). 57 R. Rajagopal; D. V. Jarikote; K. V. Srinivasan, Chem. Commun. 6, 616 (2002). 58 R. Rajagopal; K. V. Srinivasan, Ultrason. Sonochem. 10, 41 (2003). 59 A. R. Gholap; K. Venkatesan; T. Daniel; R. J. Lahoti; K. V. Srinivasan, Green. Chem. 5, 693
(2003). 60 J. L. Bravo; I. López; P. Cintas; G. Silvero; M. J. Arévalo, Ultrason. Sonochem. 13, 408 (2006). 61 P. G. Jessop, W. Leitner, Chemical Synthesis Using Supercritical Fluids (Wiley‐VCH,
Weinheim, 1999). 62 M. W. A. Kuijpers; D. van Eck; M. F. Kemmere; J. T. F. Keurentjes, Science 298, 1969 (2002). 63 R. Wang; H. M. Cheung, J. Supercrit. Fluids 33, 269 (2005). 64 Y. Enokida; S. A. El‐Fatah; C. M. Wai, Ind. Eng. Chem. Res. 41, 2282 (2002). 65 M. T. Timko, K. A. Smith, R. L. Danheiser, J. I. Steinfeld, J. W. Tester, AIChE J. 52, 1127
(2006). 66 S. Balachandran; S. E. Kentish; R. Mawson; M. Ashokkumar, Ultrason. Sonochem. 13, 471
(2006). 67 A. Hu; S. Zhao; H. Liang; T. Qiu; G. Chen, Ultrason. Sonochem. 14, 219 (2007). 68 D. Luo; T. Qiu; Q. Lu, J. Sci. Food. Agric. 87, 431 (2007).
13

Chapter 1
14
2
Comprehensible Numerical Model for Sonochemistry
Abstract
A comprehensible single‐cavity dynamics model has been developed to study and predict the effect of varying process conditions on cavity dynamics and the corresponding temperature rise. As the hot‐spot temperature strongly influences the extent of radical formation, the model can provide valuable information concerning the effect of process conditions on sonochemistry. For the effect of liquid temperature and gas dissolved, the agreement between numerical modeling results and experimental results has demonstrated the usefulness of such a reduced model.
15

Chapter 2
2.1 Introduction
The majority of the effects induced by ultrasound irradiation derive from acoustic cavitation, i.e. the growth and subsequent adiabatic collapse of microscopic cavities in a liquid.1 Upon collapse, temperatures of several thousands of Kelvins and pressures of hundreds of bars can be attained.2 These conditions lead to the formation of radicals, thereby providing an alternative route to initiate chemical reactions.
Various detailed models have been proposed in the literature to describe the dynamics of a single cavity, aiming at a better understanding of the governing phenomena.3‐5 In this work a comprehensible single‐cavity dynamics model has been developed in accordance with previous studies.6‐8 The model employs ordinary differential and algebraic equations to describe the governing processes, such as radial dynamics, mass transfer, and energy transport. To investigate to what extent this single‐bubble model can assist in the interpretation of the trends observed in multi‐bubble sonochemistry, experiments have been performed in which bulk liquid temperature and the type of gas dissolved were varied.
2.2 Cavity Dynamics Model
A small pre‐existing cavity in an unbounded liquid is set into radial motion by applying a uniform ultrasonic field. The cavity remains spherical and fixed during this oscillation and the effect of bubble‐bubble interactions, e.g. coalescence, is neglected. During contraction of the cavity, high temperatures can be obtained and as a result chemical reactions can take place. Although these reactions substantially lower the temperature rise, they are not incorporated to allow for a comprehensible model.
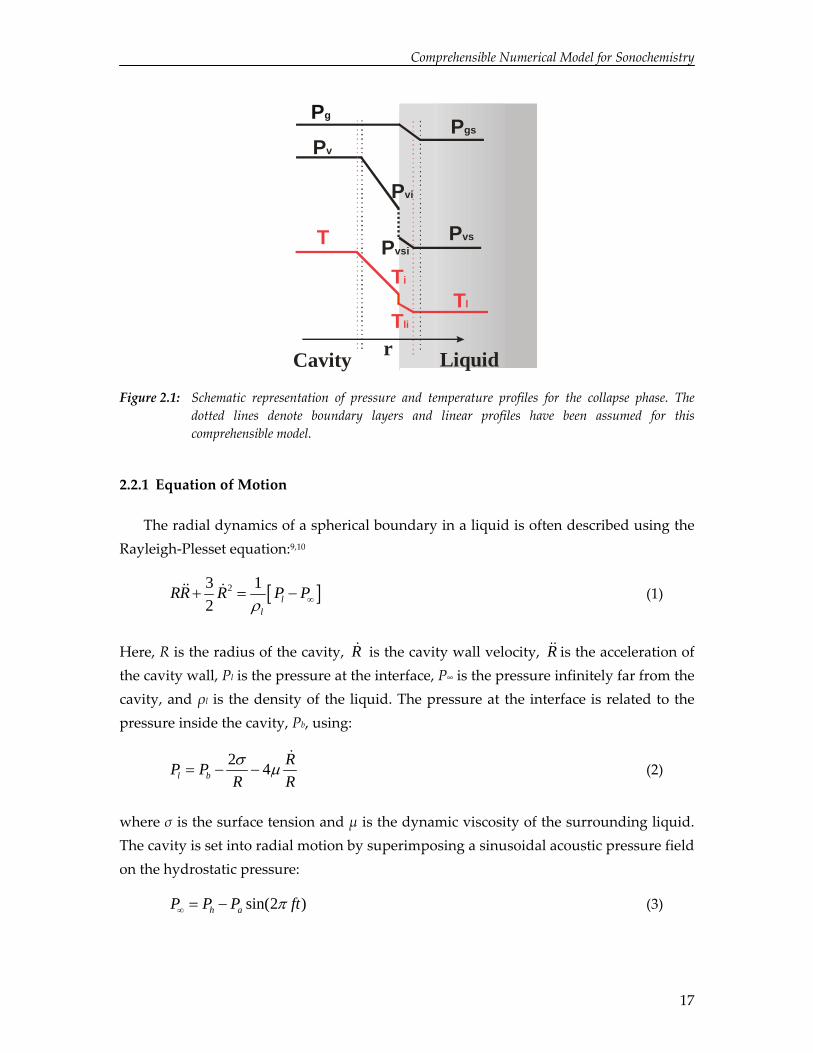
Since the cavity is small compared to the wavelength of the applied sound field, the cavity and its surrounding liquid are considered spatially uniform, except for thin boundary layers in which pressure and temperature vary as a function of the radial distance r (Figure 2.1). In the following sections, the governing equations for the cavity dynamics model are presented.
16
Comprehensible Numerical Model for Sonochemistry
Pv
Pvi
Pg
T
Ti
Tl
r LiquidCavity
PvsiPvs
Tli
Pgs
Figure 2.1: Schematic representation of pressure and temperature profiles for the collapse phase. The
dotted lines denote boundary layers and linear profiles have been assumed for this comprehensible model.
2.2.1 Equation of Motion
The radial dynamics of a spherical boundary in a liquid is often described using the Rayleigh‐Plesset equation:9,10
[23 12 l
l
RR R P Pρ ∞+ = −&& & ] (1)
Here, R is the radius of the cavity, R& is the cavity wall velocity, R&& is the acceleration of the cavity wall, Pl is the pressure at the interface, P∞ is the pressure infinitely far from the cavity, and ρl is the density of the liquid. The pressure at the interface is related to the pressure inside the cavity, Pb, using:
2 4l b
RP PR Rσ μ= − −
& (2)
where σ is the surface tension and μ is the dynamic viscosity of the surrounding liquid. The cavity is set into radial motion by superimposing a sinusoidal acoustic pressure field on the hydrostatic pressure:
sin(2 )h aP P P ftπ∞ = − (3)
17

Chapter 2
Here, Ph is the hydrostatic pressure, and Pa and f represent the amplitude and frequency of the ultrasonic field, respectively. To account for the effect of sound radiation and liquid compressibility, the Rayleigh‐Plesset equation is extended to the Keller‐Miksis formulation:11
( )23 21 1 12 3l l b b 4R R R RRR R P P P
C C C C Rσ R
Rρ ρ μ∞
⎛ ⎞ ⎛ ⎞ ⎛ ⎞− + − = + − + − −⎜ ⎟ ⎜ ⎟ ⎜ ⎟
⎝ ⎠ ⎝ ⎠ ⎝ ⎠
& & &&& & &
& (4)
Here, C represents the speed of sound in the liquid and is the time derivative of the
pressure inside the cavity. For a more detailed description of the various available equations of motion, the reader is referred to literature.
bP&
12
2.2.2 Mass Balance
The cavity contains both non‐condensable gas and vapor and its contents is modeled with the van der Waals equation of state:13
( )2g v gaP P v b R Tv
⎛ ⎞+ + − =⎜ ⎟⎝ ⎠
(5)
where Pg is the partial pressure of the gas, Pv is the partial pressure of the vapor, a and b are the van der Waals constants, υ is the molar volume, Rg is the gas constant, and T is the temperature inside the cavity. During cavity motion, gas diffuses into and out of the cavity. It is assumed that the transport rate of gas is determined by diffusion in a thin stagnant liquid film surrounding the cavity (Figure 2.1). To describe the flux of gas
molecules, gN& (moles per second), the Maxwell‐Stefan diffusion model has been used:14
24
2
l s ig
g s il
D C CN RC CC
πδ
−=
⎛ +⎛ ⎞− ⎜ ⎟⎜ ⎟⎝ ⎠⎝ ⎠
&⎞ (6)
Here, Dl represents the gas‐liquid diffusion coefficient, Cl the molar liquid concentration, and Cs and Ci the gas saturation and gas interface concentration, respectively. The saturation concentration is considered constant and it is calculated from the hydrostatic pressure and the saturated vapor pressure. The gas content near the interface is coupled to the partial gas pressure inside the cavity using equilibrium thermodynamics. In accordance with previous work the boundary layer thickness,
gδ , is calculated from the
penetration depth using a characteristic time scale of the process dynamics:8
18

Comprehensible Numerical Model for Sonochemistry
lg
R DRπδ =&
(7)
During expansion and contraction of the cavity, molecules evaporate and condense at the interface. Several approaches have been employed in literature to calculate the flux of vapor molecules and the corresponding vapor pressure. A first approximation is to assume that the flux is determined by the rate of evaporation and condensation. Yasui applied the Hertz‐Knudsen‐Langmuir equation to describe non‐equilibrium phase transition across the interface:6,15,16
242
M
v vsi viv
g v li i
M P PN RR M T T
α
ππ
⎡ ⎤= ⎢
⎢ ⎥⎣ ⎦& − ⎥ (8)
Here, represents the vapor flux in moles per second, MvN& v is the molecular mass of the
vapor, Pvsi is the saturated vapor pressure at the liquid interface temperature Tli, and Pvi is the vapor pressure at the cavity interface temperature Ti. The accommodation coefficient, αM, represents the ratio of the molecules that accommodate to the interface and condense or evaporate, to the total number of molecules that hit the interface. Several values have been reported for the accommodation coefficient, ranging from 10‐3 to 1 for various systems.6,17 Toegel et al. suggested that vapor transport is controlled by the rate of diffusion inside the cavity.8 Assuming that the total molar concentration inside the cavity, Ct, is spatially uniform the following expression is obtained from the Maxwell‐Stefan theory, which holds for diluted as well as concentrated systems:
24
2
b vi vv t
m vi vb
D P PN R CP PP
πδ
−=
⎛ +⎛ ⎞− ⎜ ⎟⎜ ⎟⎝ ⎠⎝ ⎠
&⎞ (9)
Here, Db represents the binary diffusion coefficient and the vapor mole fractions are calculated from the corresponding partial vapor pressures. The boundary layer thickness,
mδ , is calculated from the penetration depth using a characteristic time scale of
the process dynamics, and a minimum value is incorporated to avoid that the boundary layer exceeds a length comparable to the cavity radius:8
min , bm
R DRRπδ
π⎛ ⎞
= ⎜⎜⎝ ⎠& ⎟⎟ (10)
19
Chapter 2
The model presented in this study accounts for diffusion as well as non‐equilibrium phase transition by means of a vapor transport continuity equation across the interface, i.e. Eq. (8) is set equal to Eq. (9).
2.2.3 Energy Balance
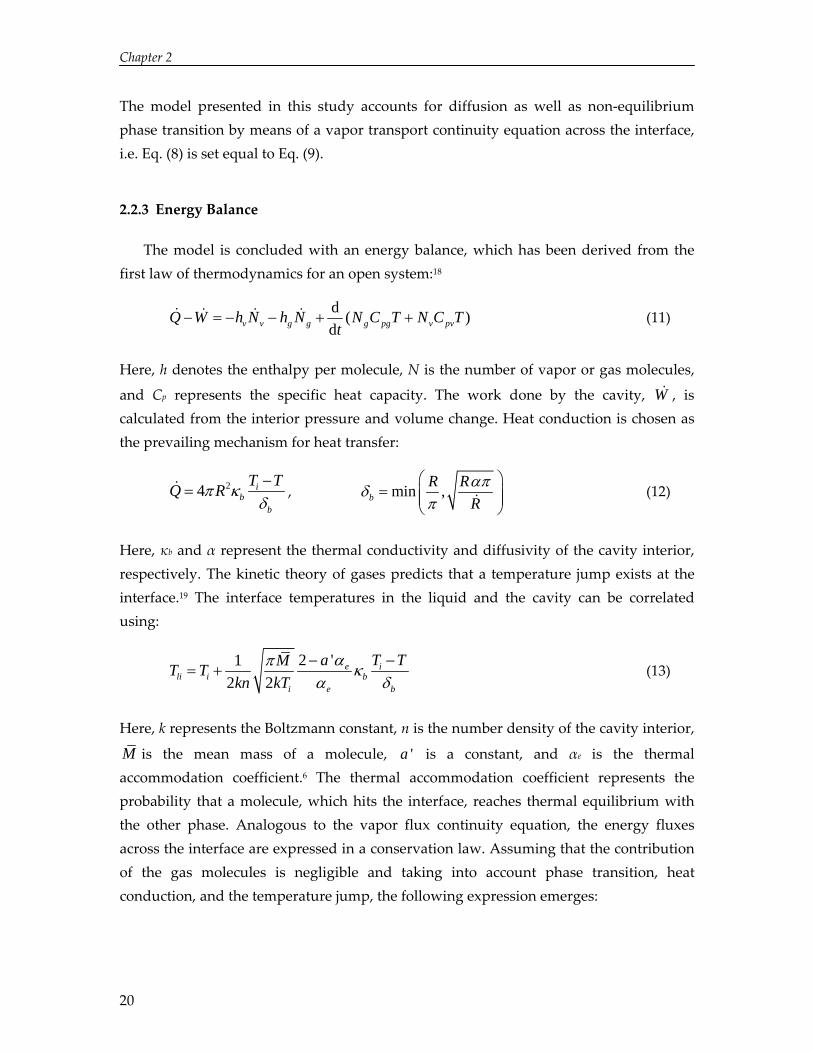
The model is concluded with an energy balance, which has been derived from the first law of thermodynamics for an open system:18
d (dv v g g g pg v pvQ W h N h N N C T N C T
t− = − − + +& & & & ) (11)
Here, h denotes the enthalpy per molecule, N is the number of vapor or gas molecules,
and Cp represents the specific heat capacity. The work done by the cavity, , is calculated from the interior pressure and volume change. Heat conduction is chosen as the prevailing mechanism for heat transfer:
W&
24 ib
b
T TQ Rπ κδ−
=& , min ,bR R
Rαπδ
π⎛ ⎞
= ⎜⎜⎝ ⎠& ⎟⎟ (12)
Here, κb and α represent the thermal conductivity and diffusivity of the cavity interior, respectively. The kinetic theory of gases predicts that a temperature jump exists at the interface.19 The interface temperatures in the liquid and the cavity can be correlated using:
2 '1
2 2e i
li i bi e b
a TMT Tkn kT
απ κ Tα δ− −
= + (13)
Here, k represents the Boltzmann constant, n is the number density of the cavity interior,
M is the mean mass of a molecule, ' is a constant, and αa e is the thermal accommodation coefficient.6 The thermal accommodation coefficient represents the probability that a molecule, which hits the interface, reaches thermal equilibrium with the other phase. Analogous to the vapor flux continuity equation, the energy fluxes across the interface are expressed in a conservation law. Assuming that the contribution of the gas molecules is negligible and taking into account phase transition, heat conduction, and the temperature jump, the following expression emerges:
20
Comprehensible Numerical Model for Sonochemistry
2 24 4 ( )(l li il b v vap v pv g pg i li
l b
T T T TR R N H N C N Cπ κ π κδ δ− −
= + Δ + +& & & )T T−
j ijQ
(14)
Here, κl is the thermal conductivity of the liquid, Tl is the liquid bulk temperature, and ΔHvap represents the enthalpy of vaporization and condensation.
2.2.4 Physical Parameters
The values of the physical parameters are obtained either from experimental data in literature or from pure component correlations. The values for the liquid properties, ρl, μ, C, Cpl, Pvs, κl, and Dl are determined at the bulk conditions, Tl and Ph, and these parameters are considered constant during an acoustic cycle. Since the temperature at the interface evolves during an acoustic cycle, the interface properties ΔHvap, σ, and Pvsi are calculated as a function of the interface temperature Tli. According to the equipartition theorem, the enthalpy of the gas and vapor molecules is related to the number of degrees of freedom.13 The temperature inside a cavity increases considerably during the collapse and temperature‐dependent correlations are used for the cavity interior properties Cpg, Cpv, κg, and κv. These low temperature correlations are extrapolated for higher temperatures. The mixture properties are calculated from pure component properties using a geometric combining rule with a quadratic dependence on mole fraction.20 For an arbitrary parameter Q, this implies:
1 1
n n
m ii j
Q y y= =
= ∑∑ ij ii jjQ Q Q= (15)
in which the subscript m denotes the mixture property and i and j represent the pure component properties. The binary diffusion coefficient, Db0, is calculated from the Chapman‐Enskog theory:18
50 2
1 1
7.2·10 g vb
m D t
TM M
DCσ
−
⎛ ⎞+⎜ ⎟⎜ ⎟
⎝=Ω
⎠ (16)
where σm is the mixture characteristic length and ΩD is the diffusion collision integral. The standard Lennard‐Jones 12‐6 potential is used for evaluating σm and ΩD. The temperature‐dependency of the collision integral is incorporated by means of the Neufeld relation.20 To correct for higher densities, the Enskog correction for dense gases
21
Chapter 2
is applied. The diffusion coefficient, Db, is related to the low‐density diffusion coefficient as follows:21
3 30 4 42 213 4 4 3 4 4
g v v gbg g v v
b g v g
D n nD
σ σ σ σσ σ
σ σ σ σ
⎛ ⎞⎛ ⎞ ⎛ ⎞+ += + +⎜ ⎟⎜ ⎟ ⎜ ⎟⎜ ⎟ ⎜ ⎟⎜ ⎟+ +⎝ ⎠ ⎝ ⎠⎝ ⎠v
(17)
where ng and nv represent the number densities of the gas and vapor, respectively, and σg and σv the characteristic lengths. A similar approach is employed for correcting the thermal conductivity of the cavity interior.
01 1.2 0.755m
bb yv y
κ⎛ ⎞
= + +⎜⎝ ⎠
bκ⎟ (18)
where 2 3
0.6250 0.2869 0.115m m mb b byv v v
⎛ ⎞ ⎛ ⎞ ⎛ ⎞ ⎛ ⎞= + + +⎜ ⎟ ⎜ ⎟ ⎜ ⎟ ⎜ ⎟⎝ ⎠ ⎝ ⎠ ⎝ ⎠ ⎝ ⎠
4mbv
(19)
Here, bm is the mixture van der Waals constant, v is the molar volume and κb0 is the low‐density thermal conductivity.
For water the values for ρl, μ, C, Cpl, Pvs, κl, and Dl have been obtained from [22]. Second order polynomials have been fitted to literature data for the interface properties ΔHvap and σ.22 The saturated vapor pressure at the interface, Pvsi, has been calculated as a function of the interface temperature using the Antoine equation.20 The values for the pure component Van der Waals constants, Lennard‐Jones parameters, Henry coefficients and gas‐liquid diffusion coefficients have been obtained from literature.20,22,23 The temperature‐dependent correlations for the specific heat capacity of the gases and water vapor have been acquired from [20]. The descriptions for the thermal conductivities have been obtained from [6,24] and from interpolation of tabulated data in [25]. The correlations and values for air have been obtained from [26], except for the specific heat capacity, which has been determined from tabulated data in [27].
2.2.5 Numerical Method
Mathematica software has been used to solve the system of ordinary differential and algebraic equations, i.e. Eq. (4), (6), (8), (9), (11) and (13).28 The selected algorithm is based on a backward differentiation formula and Newton iterative methods. The ordinary differential equations have been solved using appropriate initial conditions. It is assumed that initially the cavity radius equals R0 and the cavity wall is at rest
22
Comprehensible Numerical Model for Sonochemistry
(i.e. ). Furthermore, the vapor pressures equal the saturated vapor pressure and the various temperatures equal the bulk liquid temperature. The initial number of vapor molecules in the cavity, N
0R =&
v(0), is calculated from the saturated vapor pressure and the initial number of gas molecules, Ng(0), from the quasi‐static assumption. The following base case conditions have been applied for the numerical simulations: R0 = 10 μm, f = 20 kHz, Pa = 1.2∙105 N/m2, αM = 0.4, and αe = 0.6.6,29,30 It has been reported that an increasing bulk temperature results in a lower mass accommodation coefficient.6,31 Since this temperature effect is relatively small and there is lacking agreement in literature on the exact temperature dependency, the mass accommodation coefficient has been considered constant.
2.3 Experimental Section
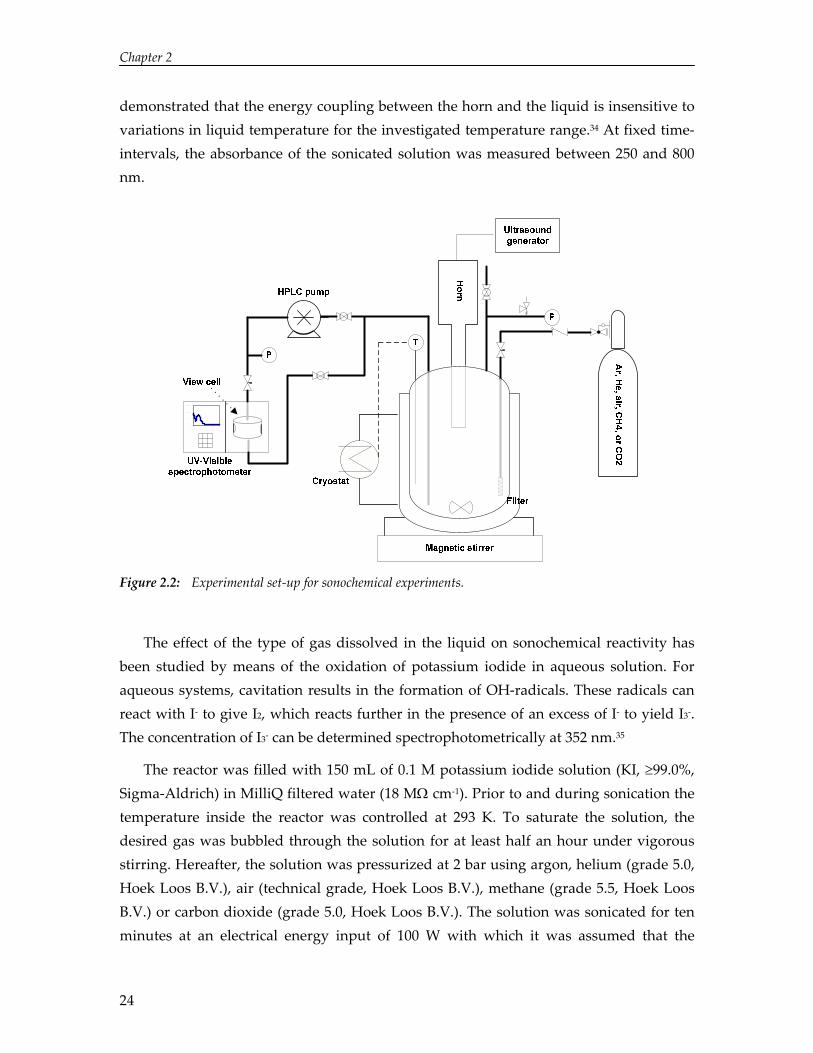
Experiments were conducted in a 175 mL stainless steel vessel (Figure 2.2). The 13 mm diameter full wave titanium alloy ultrasound horn was inserted at the top of the reactor and fixed at its nodal point. A Sonics and Materials VC750 ultrasonic generator with variable power output was used for producing ultrasound with a frequency of 20 kHz. The temperature inside the reactor was controlled externally using a thermostatic bath and a Pt‐100 temperature sensor. The sonicated solution was circulated through a small view cell (SITEC‐Sieber Engineering AG, 740.2095) using a HPLC pump (Jasco Inc., PU‐2086 Plus). The view cell was placed within a UV‐Vis spectrophotometer (Thermo Electron Corporation, Genesys 5) to analyze the contents of the reactor.
The influence of bulk liquid temperature has been investigated using a radical scavenger 2,2‐diphenyl‐1‐picrylhydrazyl (DPPH) in methanol. During sonication of a solution of DPPH in a protic solvent, DPPH reacts predominantly with H‐radicals to form DPPH2.32,33 The course of this reaction can be monitored by changes in absorbance. The peaks attributed to DPPH (326 and 515 nm) decrease in time, whereas one of the absorption peaks of DPPH2 (278 nm) arises. In addition, the presence of several isobestic points in the spectrum indicates that a reaction has occurred.
The reactor was filled with 150 mL of 30 μM DPPH solution (≥ 85% (CHN), Sigma‐Aldrich) in methanol (≥ 99.9%, Sigma‐Aldrich). Prior to sonication, the thermostat was set to the desired value and argon (grade 5.0, Hoek Loos B.V.) was bubbled through the solution under vigorous stirring for at least half an hour. Subsequently, the solution was pressurized with argon at 2 bar. Ultrasound was applied for 20 minutes, while the electrical energy input was maintained at 100 W. Previous calorimetric studies have
23
Chapter 2
24
demonstrated that the energy coupling between the horn and the liquid is insensitive to variations in liquid temperature for the investigated temperature range.34 At fixed time‐intervals, the absorbance of the sonicated solution was measured between 250 and 800 nm.
0
0 .1
0 .2
0 .3
3 0 0 5 0 0
Figure 2.2: Experimental set‐up for sonochemical experiments.
The effect of the type of gas dissolved in the liquid on sonochemical reactivity has been studied by means of the oxidation of potassium iodide in aqueous solution. For aqueous systems, cavitation results in the formation of OH‐radicals. These radicals can react with I‐ to give I2, which reacts further in the presence of an excess of I‐ to yield I3‐. The concentration of I3‐ can be determined spectrophotometrically at 352 nm.35
The reactor was filled with 150 mL of 0.1 M potassium iodide solution (KI, ≥99.0%, Sigma‐Aldrich) in MilliQ filtered water (18 MΩ cm‐1). Prior to and during sonication the temperature inside the reactor was controlled at 293 K. To saturate the solution, the desired gas was bubbled through the solution for at least half an hour under vigorous stirring. Hereafter, the solution was pressurized at 2 bar using argon, helium (grade 5.0, Hoek Loos B.V.), air (technical grade, Hoek Loos B.V.), methane (grade 5.5, Hoek Loos B.V.) or carbon dioxide (grade 5.0, Hoek Loos B.V.). The solution was sonicated for ten minutes at an electrical energy input of 100 W with which it was assumed that the
Comprehensible Numerical Model for Sonochemistry
energy coupling between the horn and the liquid is unaffected by the dissolved gas. After fixed periods of sonication the absorbance at 352 nm was measured to monitor the relative increase in I3‐ concentration.
2.4 Results and Discussion
2.4.1 Bulk Liquid Temperature
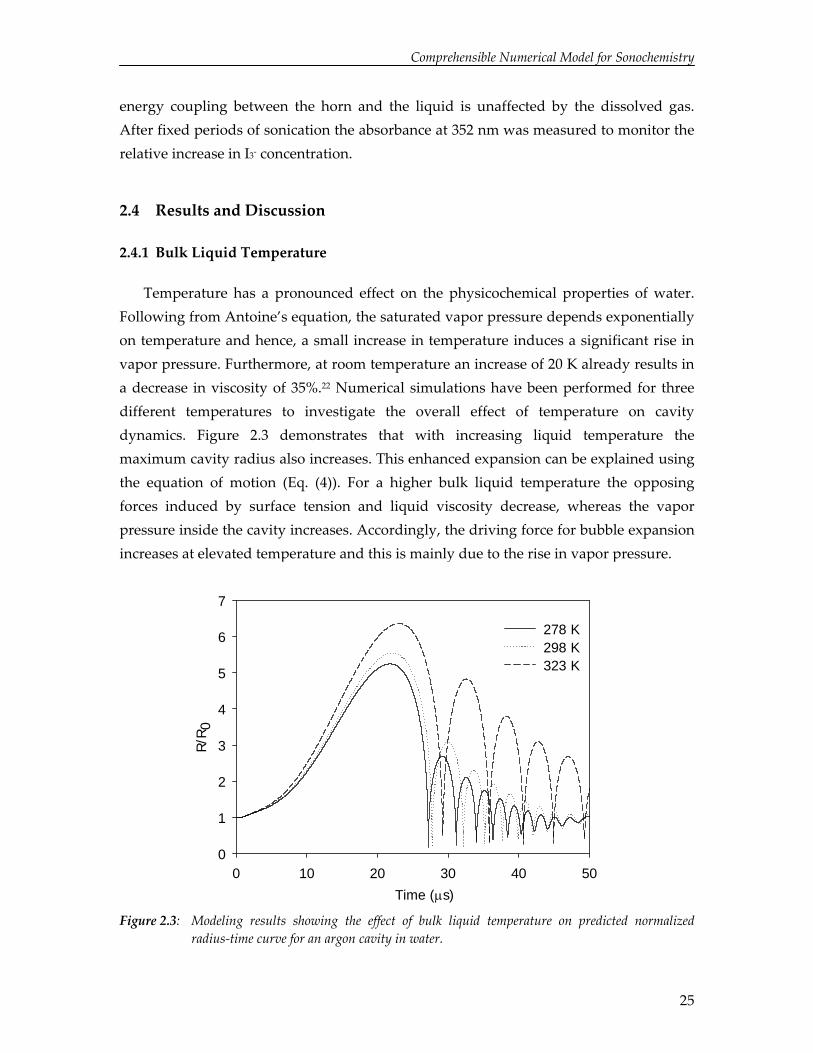
Temperature has a pronounced effect on the physicochemical properties of water. Following from Antoine’s equation, the saturated vapor pressure depends exponentially on temperature and hence, a small increase in temperature induces a significant rise in vapor pressure. Furthermore, at room temperature an increase of 20 K already results in a decrease in viscosity of 35%.22 Numerical simulations have been performed for three different temperatures to investigate the overall effect of temperature on cavity dynamics. Figure 2.3 demonstrates that with increasing liquid temperature the maximum cavity radius also increases. This enhanced expansion can be explained using the equation of motion (Eq. (4)). For a higher bulk liquid temperature the opposing forces induced by surface tension and liquid viscosity decrease, whereas the vapor pressure inside the cavity increases. Accordingly, the driving force for bubble expansion increases at elevated temperature and this is mainly due to the rise in vapor pressure.
Time (μs)
0 10 20 30 40 50
R/R 0
0
1
2
3
4
5
6
7
278 K298 K323 K
Figure 2.3: Modeling results showing the effect of bulk liquid temperature on predicted normalized radius‐time curve for an argon cavity in water.
25
Chapter 2
Time (μs)
0 10 20 30 40 5
0
Vapo
r fr
actio
n
0.0
0.2
0.4
0.6
0.8
1.0
278 K298 K323 K
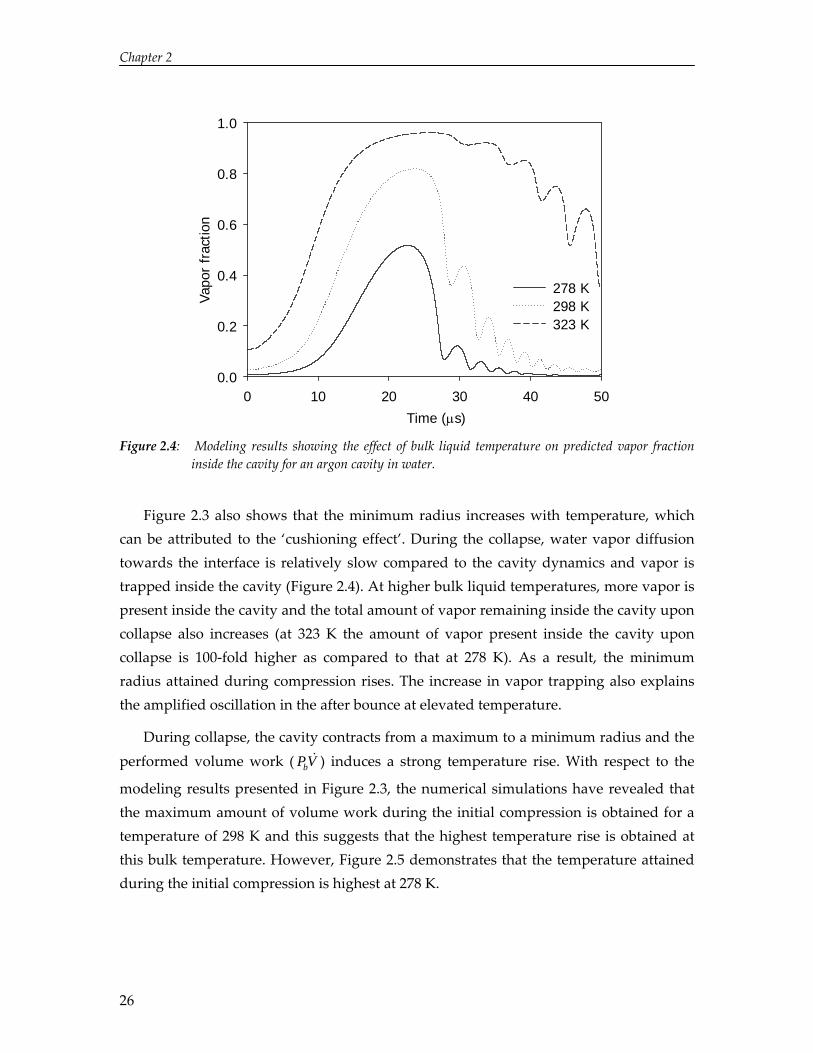
Figure 2.4: Modeling results showing the effect of bulk liquid temperature on predicted vapor fraction
inside the cavity for an argon cavity in water.
Figure 2.3 also shows that the minimum radius increases with temperature, which can be attributed to the ‘cushioning effect’. During the collapse, water vapor diffusion towards the interface is relatively slow compared to the cavity dynamics and vapor is trapped inside the cavity (Figure 2.4). At higher bulk liquid temperatures, more vapor is present inside the cavity and the total amount of vapor remaining inside the cavity upon collapse also increases (at 323 K the amount of vapor present inside the cavity upon collapse is 100‐fold higher as compared to that at 278 K). As a result, the minimum radius attained during compression rises. The increase in vapor trapping also explains the amplified oscillation in the after bounce at elevated temperature.
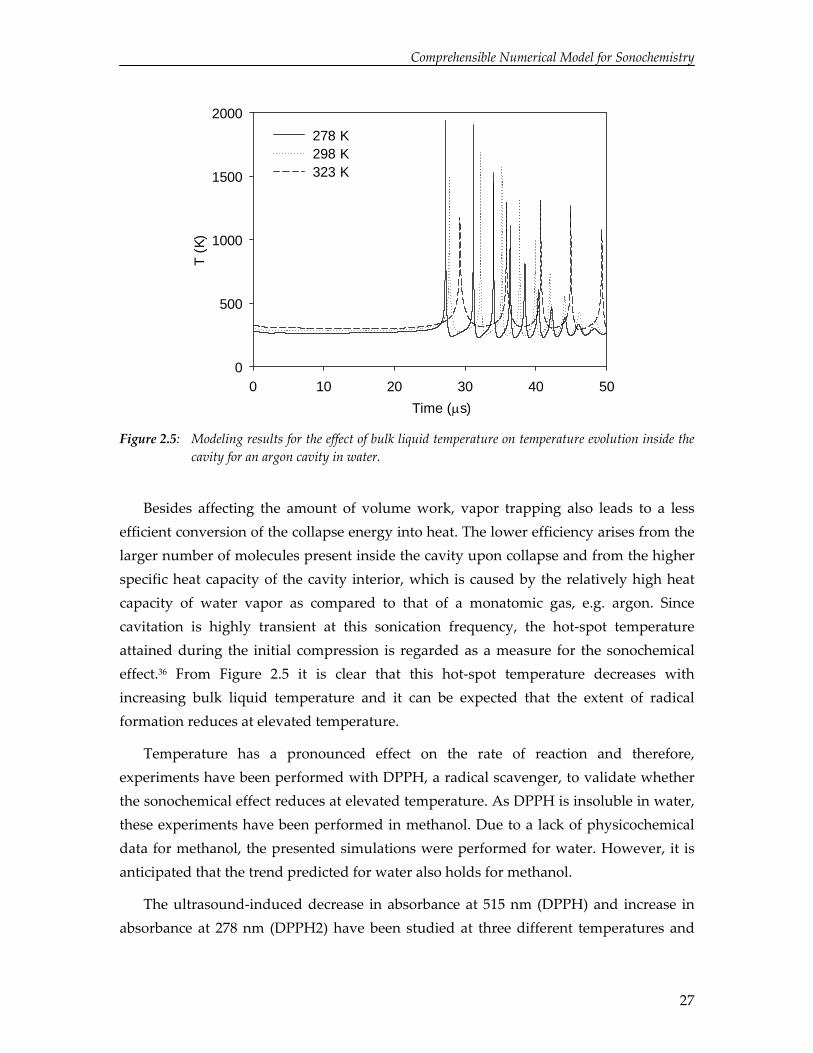
During collapse, the cavity contracts from a maximum to a minimum radius and the performed volume work ( ) induces a strong temperature rise. With respect to the
modeling results presented in Figure 2.3, the numerical simulations have revealed that the maximum amount of volume work during the initial compression is obtained for a temperature of 298 K and this suggests that the highest temperature rise is obtained at this bulk temperature. However, Figure 2.5 demonstrates that the temperature attained during the initial compression is highest at 278 K.
bPV&
26
Comprehensible Numerical Model for Sonochemistry
Time (μs)
0 10 20 30 40 5
0
T (K
)
0
500
1000
1500
2000
278 K298 K323 K
Figure 2.5: Modeling results for the effect of bulk liquid temperature on temperature evolution inside the
cavity for an argon cavity in water.
Besides affecting the amount of volume work, vapor trapping also leads to a less efficient conversion of the collapse energy into heat. The lower efficiency arises from the larger number of molecules present inside the cavity upon collapse and from the higher specific heat capacity of the cavity interior, which is caused by the relatively high heat capacity of water vapor as compared to that of a monatomic gas, e.g. argon. Since cavitation is highly transient at this sonication frequency, the hot‐spot temperature attained during the initial compression is regarded as a measure for the sonochemical effect.36 From Figure 2.5 it is clear that this hot‐spot temperature decreases with increasing bulk liquid temperature and it can be expected that the extent of radical formation reduces at elevated temperature.
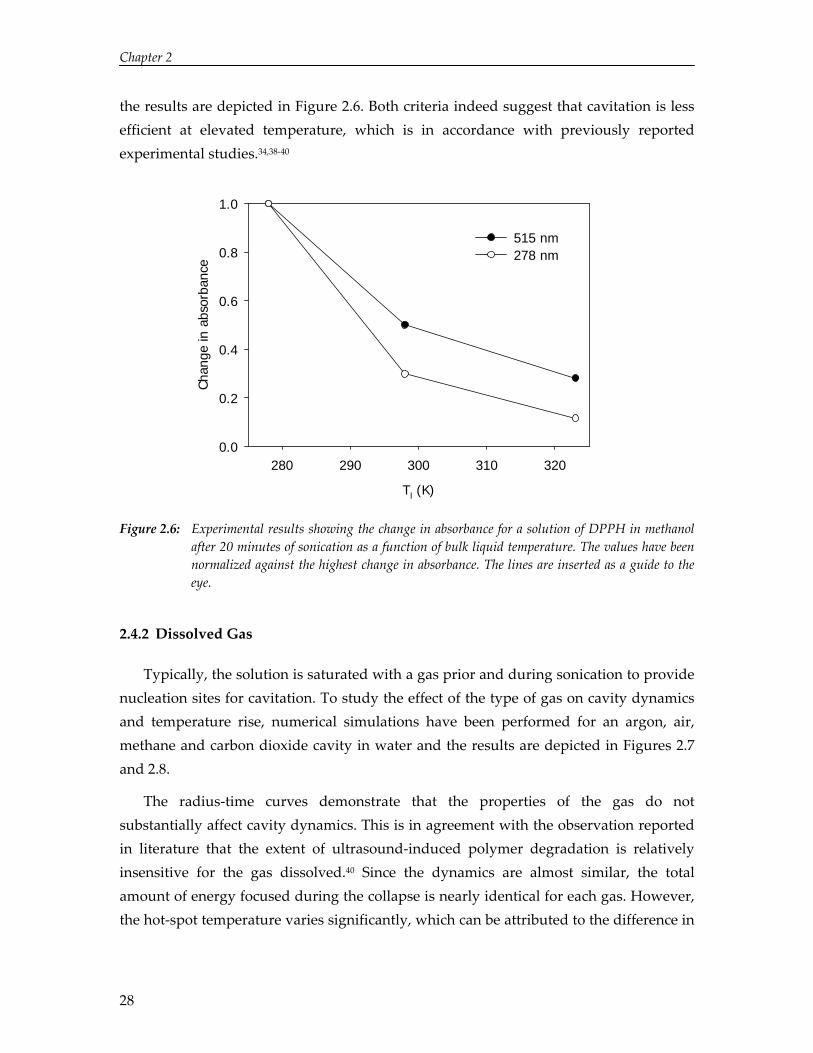
Temperature has a pronounced effect on the rate of reaction and therefore, experiments have been performed with DPPH, a radical scavenger, to validate whether the sonochemical effect reduces at elevated temperature. As DPPH is insoluble in water, these experiments have been performed in methanol. Due to a lack of physicochemical data for methanol, the presented simulations were performed for water. However, it is anticipated that the trend predicted for water also holds for methanol.
The ultrasound‐induced decrease in absorbance at 515 nm (DPPH) and increase in absorbance at 278 nm (DPPH2) have been studied at three different temperatures and
27
Chapter 2
the results are depicted in Figure 2.6. Both criteria indeed suggest that cavitation is less efficient at elevated temperature, which is in accordance with previously reported experimental studies.34,38‐40
Tl (K)
280 290 300 310 320
Chan
ge in
abs
orba
nce
0.0
0.2
0.4
0.6
0.8
1.0
515 nm278 nm
Figure 2.6: Experimental results showing the change in absorbance for a solution of DPPH in methanol
after 20 minutes of sonication as a function of bulk liquid temperature. The values have been normalized against the highest change in absorbance. The lines are inserted as a guide to the eye.
2.4.2 Dissolved Gas
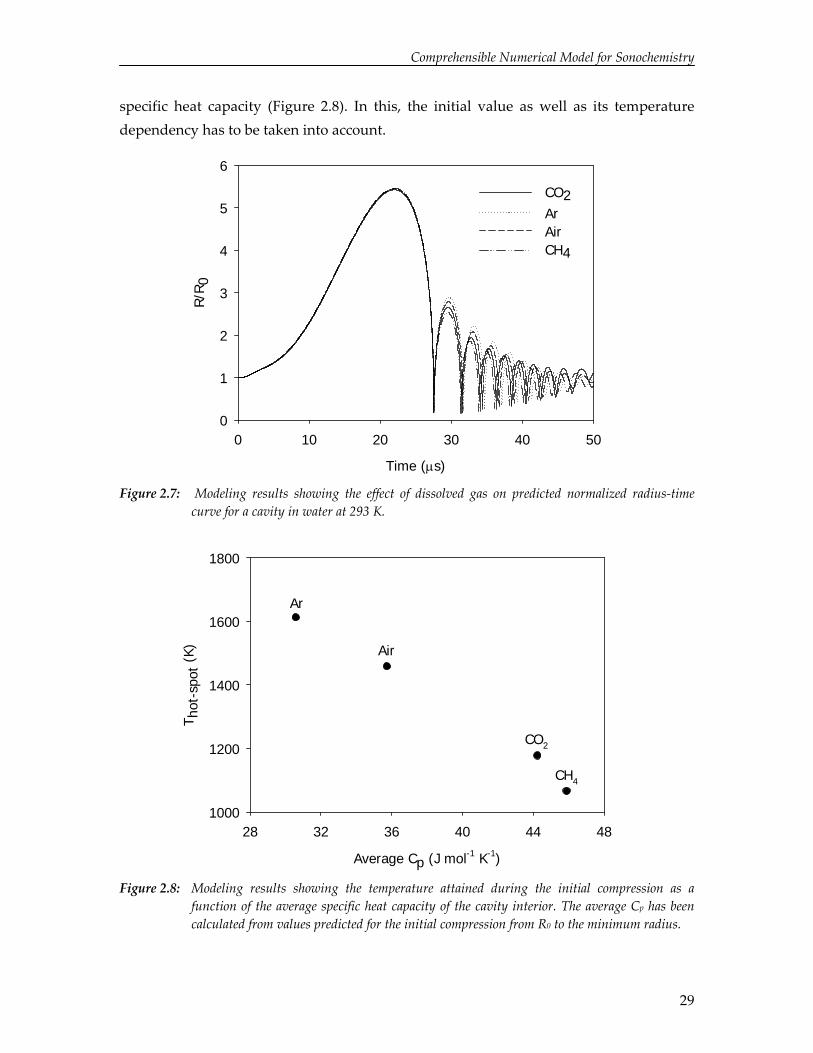
Typically, the solution is saturated with a gas prior and during sonication to provide nucleation sites for cavitation. To study the effect of the type of gas on cavity dynamics and temperature rise, numerical simulations have been performed for an argon, air, methane and carbon dioxide cavity in water and the results are depicted in Figures 2.7 and 2.8.
The radius‐time curves demonstrate that the properties of the gas do not substantially affect cavity dynamics. This is in agreement with the observation reported in literature that the extent of ultrasound‐induced polymer degradation is relatively insensitive for the gas dissolved.40 Since the dynamics are almost similar, the total amount of energy focused during the collapse is nearly identical for each gas. However, the hot‐spot temperature varies significantly, which can be attributed to the difference in
28
Comprehensible Numerical Model for Sonochemistry
29
Time (μs)
0 10 20 30 40 50
R/R
0
0
1
2
3
4
5
6
CO2ArAirCH4
specific heat capacity (Figure 2.8). In this, the initial value as well as its temperature dependency has to be taken into account.
Figure 2.7: Modeling results showing the effect of dissolved gas on predicted normalized radius‐time
curve for a cavity in water at 293 K.
Average Cp (J mol-1 K-1)
28 32 36 40 44 48
T hot
-spo
t (K
)
1000
1200
1400
1600
1800
Ar
Air
CO2
CH4
Figure 2.8: Modeling results showing the temperature attained during the initial compression as a
function of the average specific heat capacity of the cavity interior. The average Cp has been calculated from values predicted for the initial compression from R0 to the minimum radius.

Chapter 2
30
Argon, a monoatomic gas, has merely three translational degrees of freedom per molecule.13 Therefore, its heat capacity is relatively low and the effect of temperature on the value of the heat capacity is negligible. Consequently, the temperature attained during the compression of an argon cavity is highest. Diatomic molecules, such as nitrogen and oxygen, possess three translational and two rotational degrees of freedom. For polyatomic molecules, e.g. carbon dioxide and methane, the vibrational degrees of freedom also contribute to the specific heat capacity, especially at higher temperatures. Based on this, the hot‐spot temperature will be highest for an argon‐saturated system and it will decrease in the following order of dissolved gases: Ar > Air > CO2 > CH4.
In Figure 2.9 the results of the sonochemical experiments using various dissolved gases are depicted. On the x‐axis average Cp‐values are given, which have been calculated from values predicted for the first compression from initial to minimum radius.
Average Cp (J mol-1 K-1)
28 32 36 40 44 48
Incr
ease
in a
bsor
banc
e
0.0
0.2
0.4
0.6
0.8
1.0Ar
Air
CO2 CH4He
Figure 2.9: Experimental results showing the increase in absorbance (λ = 352 nm) for an aqueous solution of KI after 10 minutes of sonication as a function of the calculated average specific heat capacity of the cavity interior. The values have been normalized against the change in absorbance obtained with argon.
As is shown in Figure 2.9, the properties of the dissolved gas have a strong effect on the rate of potassium iodide oxidation. The experimentally determined reactivity order is reasonably in accordance with the order predicted from the single‐cavity model and
Comprehensible Numerical Model for Sonochemistry
with results reported in literature.41‐43 However, the difference in reactivity in the presence of air and argon is relatively large compared to the difference in specific heat capacity. The lower reactivity for air could be caused by its low solubility in water. Gas solubility is frequently regarded as an important parameter, since it determines the number of cavitation nuclei.38 On the contrary, the presence of oxygen is known to enhance the oxidation of potassium iodide.44,45 Additionally, the low reactivity in the presence of helium seems striking. Assuming that the specific heat capacity is the dominating factor, the reactivity in the presence of helium should be similar to that measured for argon. Various studies in literature have also reported a lower reactivity for helium as compared to argon and several explanations have been proposed to account for this effect.41,46‐48 Many authors attribute the lower reactivity to the high thermal conductivity of helium as more of the energy focused during the collapse transfers to the liquid, thereby effectively lowering the hot‐spot temperature.43 Okitsu et al. postulate that the thermal conductivity is not that important, since the collapse is almost adiabatic.49 Conversely, they claim that the lower solubility of helium would account for its lower reactivity. Molecular dynamics simulations suggest that the low kinetic energy of the helium atoms limits the amount of energy that is focused during the collapse.50 On the contrary, Storey & Szeri claim that the collapse is more violent for a cavity filled with helium compared to argon.7 Due to the higher vapor diffusion coefficient for a helium filled cavity (~ 1 gasM ), less vapor is trapped upon collapse and
the hot‐spot temperature is higher. Reduced vapor trapping also implies that less reactant (water vapor) is present inside the cavity upon collapse and according to Storey & Szeri this would explain the low reactivity in the presence of helium. Moreover, the large dissimilarity in molecular mass induces segregation effects, leading to an enrichment of water vapor close to the cavity wall.51 Due to segregation the vapor diffusion coefficient increases further and less water vapor is present inside the hottest region, i.e. the center of the cavity. Segregation effects are not captured by the presented model, in which a spatially uniform cavity interior is assumed. Although all of the previously discussed explanations imply a lower reactivity in the presence of helium compared to argon, it remains unclear which of these effects dominates.
2.5 Conclusions
A comprehensible single‐cavity dynamics model has been described, which includes a momentum balance, an expression for vapor and gas transport, and an energy balance. For the description of mass transport, diffusion inside and outside the cavity as well as
31
Chapter 2
non‐equilibrium phase transition is taken into account. The reduced model can be used to comprise and predict the effect of varying process conditions on cavity dynamics and the corresponding temperature rise. As for the effect of bulk liquid temperature, the model predicts a decrease in reactivity for increasing temperature, which is mainly due to vapor trapping. The experiments performed with a radical scavenger confirm that the sonochemical effect decreases monotonically with liquid temperature. In addition, numerical simulations have demonstrated the importance of the specific heat capacity of the dissolved gas for the sonochemical effect, which has also been confirmed by experiments. Although the model seems reasonably effective in predicting trends in multi‐bubble sonochemistry, the low reactivity in the presence of helium has illustrated the shortcomings of such a reduced model.
Nomenclature
a Van der Waals constant [J m3/mol2] A cavity surface area [m2]
' arbitrary parameter [‐] ab Van der Waals constant [m3/mol] C speed of sound in the liquid [m/s] Ci gas interface concentration [mol/m3] Cl molar liquid concentration [mol/m3] Cpg specific heat capacity gas [J/mol K] Cpv specific heat capacity vapor [J/mol K] Cs gas saturation concentration [mol/m3] Ct total molar concentration [mol/m3] Db vapor diffusion coefficient [m2/s] Dl gas‐liquid diffusion coefficient [m2/s] e energy per unit mass [J/kg] f ultrasonic frequency [Hz] hg enthalpy per gas molecule [J] hv enthalpy per vapor molecule [J] ΔHvap enthalpy of vaporization and condensation [J/mol] k Boltzmann constant [m2 kg/s2 K] M molecular mean mass [kg] Mg molar mass gas [kg/mol] Mv molar mass vapor [kg/mol] n number density [m‐3] Ng amount of gas [mol]
32

Comprehensible Numerical Model for Sonochemistry
gN& gas flux [mol/s]
Nv amount of vapor [mol]
vN& vapor flux [mol/s]
Pa maximum acoustic pressure [Pa] Pb cavity interior pressure [Pa] Pg partial gas pressure [Pa] Pgs saturated gas pressure [Pa] Ph hydrostatic pressure [Pa] Pl pressure at the interface [Pa] Pv partial vapor pressure [Pa] Pvi vapor pressure at the interface [Pa] Pvs saturated vapor pressure at infinity [Pa] Pvsi saturated vapor pressure at the interface [Pa] P∞ pressure infinitely far from the cavity [Pa]
Q& heat transfer [J/s]
R cavity radius [m] R& time derivative of the cavity radius [m/s] R&& second time derivative of the cavity radius [m/s2] Rg universal gas constant [J/mol K] R0 initial radius [m] t time [s] T temperature cavity interior [K] T& temperature change cavity interior [K/s] Ti cavity temperature at the interface [K] Tl bulk liquid temperature [K] Tli liquid temperature at the interface [K] v molar volume [m3/mol] V cavity volume [m3] V& volume change [m3/s] W& work performed by cavity [J/s]
Greek symbols
α thermal diffusivity [m2/s] αe thermal accommodation coefficient [‐] αM mass accommodation coefficient [‐] δb thermal boundary layer cavity interior [m] δg gas diffusion boundary layer liquid [m] δl thermal boundary layer liquid [m] δm vapor diffusion boundary layer cavity interior [m]
33
Chapter 2
κb thermal conductivity cavity interior [W/m K] κl thermal conductivity liquid [W/m K] μ dynamic viscosity [Pa s] ρl liquid density [kg/m3] σ surface tension [N/m]
References
1 L. H. Thompson; L. K Doraiswamy, Ind. Eng. Chem. Res. 38, 1215 (1999). 2 E. B. Flint; K. S. Suslick, Science 253, 1397 (1991). 3 W. C. Moss; D. A. Young; J. A. Harte; J. L. Levatin; B. F. Rozsnyai; G. B. Zimmerman; I. H.
Zimmerman, Phys. Rev. E 59, 2986 (1999). 4 B. D. Storey; A. J. Szeri, Proc. R. Soc. Lond. A 456, 1685 (2000). 5 C. Xiao; D. M. Heyes; J. G. Powles, Mol. Phys. 100, 3451 (2002). 6 K. Yasui, Phys. Rev. E 56, 6750 (1997). 7 B. D. Storey; A. J. Szeri, Proc. R. Soc. Lond. A 457, 1685 (2001). 8 R. Toegel; B. Gompf; R. Pecha; D. Lohse, Phys. Rev. Lett. 85, 3165 (2000). 9 Lord Rayleigh, Phil. Mag. 34, 94 (1917). 10 M. Plesset, J. Appl. Mech. 16, 277 (1949). 11 J. B. Keller; M. Miksis, J. Acous. Soc. Am. 68, 628 (1980). 12 M. P. Brenner; S. Hilgenfeldt; D. Lohse, Rev. Mod. Phys. 74, 425 (2002). 13 P. W. Atkins, Physical Chemistry 6th Ed. (Oxford University Press, Oxford, 1998). 14 J. A. Wesselingh; R. Krishna, Mass Transfer in Multicomponent Mixtures (Delft University
Press, Delft, 2000). 15 S. Fujikawa; T. Akamatsu, J. Fluid. Mech. 97, 481 (1980). 16 V. P. Carey, Statistical Thermodynamics and Microscale Thermophysics (Cambridge University
Press, Cambridge, 1999). 17 G. F. Puente; F. J. Bonetto, Phys. Rev. E 71, 056309 (2005). 18 B. E. Poling; J. M. Prausnitz; J. P. O’Connell, The Properties of Gases and Liquids 5th Ed.
(McGraw‐Hill, London, 2001). 19 R. B. Byron; W. E. Stewart; E. N. Lightfoot, Transport Phenomena 2nd Ed. (Wiley, London,
2001). 20 M. N. Kogan, Rarefied Gas Dynamics (Plenum, New York, 1969). 21 J. O. Hirschfelder; C. F. Curtiss; R. B. Bird, Molecular Theory of Gases and Liquids 4th Ed.
(Chapman and Hall, London, 1967). 22 D. R. Lide, Handbook of Chemistry & Physics 87th Ed. (CRC Press, Boca Raton, 2006). 23 P. J. Linstrom; W. G. Mallard, NIST Chemistry WebBook, NIST Standard Reference
Database Number 69, National Institute of Standards and Technology, Gaithersburg MD, 20899 (June 2005).
24 V. Kamath; A. Prosperetti; F. Egolfopoulos, J. Acous. Soc. Am. 94, 248 (1993). 25 Y. S. Touloukian; P. E. Liley; S. C. Saxena, Thermal Conductivity: Nonmetallic Liquids and
Gases (IFI/Plenum, New York, 1970). 26 K. Yasui, J. Acoust. Soc. Am. 98, 2772 (1995). 27 Y. S. Touloukian; T. Makita, Specific heat: Nonmetallic Liquids and Gases (IFI/Plenum, New
York, 1970).
34
Comprehensible Numerical Model for Sonochemistry
28 Wolfram Research Inc., Mathematica (1993). 29 B. Barber; S. Putterman, Phys. Rev. Lett. 69, 3839 (1992). 30 M. Zientara; D. Jakubczyk; G. Derkachov; K. Kolwas; M. Kolwas, J. Phys. D 38, 1978 (2005). 31 Y. Q. Li; P. Davidovits; Q. Shi; J. T. Jayne; C. E. Kolb; D. R. Worsnop, J. Phys. Chem. A 105,
10627 (2001). 32 K. Okitsu; H. Nakamura; N. Takenaka; H. Bandow; Y. Maeda; Y. Nagata, Res. Chem.
Intermed. 30, 763 (2004). 33 C. Sehgal; T. J. Yu; R. G. Sutherland; R. E. Verrall, J. Phys. Chem. 86, 2982 (1982). 34 M. W. A. Kuijpers; M. F. Kemmere; J. T. F. Keurentjes, Ultrasonics 40, 675 (2002). 35 S. Koda; T. Kimura; T. Kondo; H. Mitome, Ultrason. Sonochem. 10, 149 (2003). 36 G. J. Price; M. Ashokkumar; M. Hodnett; B. Zequiri; F. Grieser, J. Phys. Chem. B 109, 17799
(2005). 37 Y. Mizukoshi; H. Nakamura; H. Bandow; Y. Maeda; Y. Nagata, Ultrason. Sonochem. 6, 203
(1999). 38 M. H. Entezari; P. Kruus; R. Otson, Ultrason. Sonochem. 4, 49 (1997). 39 P. Kruus; T. J. Patraboy, J. Phys. Chem. 89, 3379 (1985). 40 A. Henglein; M. Gutierrez, J. Phys. Chem. 92, 3705 (1988). 41 K. Okitsu; A. Yue; S. Tanabe; H. Matsumoto; Y. Yobiko; Y. Yoo, Bull. Chem. Soc. Jpn. 75, 2289
(2002). 42 A. Henglein, Zeitschrift für Naturforschung T. B. Anorganische Chemie 40B, 100 (1985). 43 W. B. McNamara III; Y. T. Didenko; K. S. Suslick, Nature 401, 772 (1999). 44 D. V. Prasad Naidu; R. Rajan; R. Kumar; K. S. Gandhi; V. H. Arakeri; S. Chandrasekaran,
Chem. Eng. Sci. 49, 877 (1994). 45 E. J. Hart; A. Henglein, J. Phys. Chem. 89, 4342 (1985). 46 R. O. Prudhomme, Bulletin de la Société de Chimie Biologique 39, 425 (1957). 47 H. Harada, Ultrason. Sonochem. 5, 73 (1998). 48 G. Mark; A. Tauber; R. Laupert; H‐P. Schuchmann; D. Schulz; A. Mues; C. von Sonntag,
Ultrason. Sonochem. 5, 41 (1998). 49 K. Okitsu; T. Suzuki; N. Takenaka; H. Bandow; R. Nishimura; Y. Maeda, J. Phys. Chem. B
110, 20081 (2006). 50 D. Schanz (personal communication, 2007). 51 B. D. Storey; A. J. Szeri, J. Fluid. Mech. 396, 203 (1999).
35

Chapter 2
36

3
Solvent and Solute Effects in Ultrasound‐Induced
Polymerizations
Abstract
The influence of sonication medium and gas feed composition on the chemical effect of acoustic cavitation has been investigated by comparing hydrogen formation rates. The addition of a small amount of methane to the gas feed has resulted in an increase in hydrogen production from water by a factor of ten, which implies a significant increase in radical concentration. Nevertheless, this higher radical concentration has not led to enhanced polymerization rates for methyl methacrylate and methacrylic acid in aqueous solution. The results obtained for the polymerization of methyl methacrylate have demonstrated, however, that ultrasound initiation gives rise to high molecular weights and that it is feasible to produce small polymer particles in the absence of any stabilizer. For more hydrophilic polymers, such as polymethacrylic acid, radicals arising from polymer scission seem to determine the overall polymerization rate in aqueous solution to a large extent.
37
Chapter 3
3.1 Introduction
The chemical effect induced by ultrasound irradiation does not exclusively depend on the physics of cavitation, which have been captured by the cavity dynamics model described in chapter 2. The molecules inside and around the cavity also strongly determine the chemistry involved. In view of this, several authors have incorporated chemical reaction kinetics into their numerical models.1‐4 In the first section of this chapter an experimental study is presented on the influence of the solvent and the presence of solutes on sonochemistry. The sonochemical effect has been evaluated and compared by means of the rate of hydrogen formation.5 Subsequently, it has been explored whether the addition of solutes could be employed for enhancing the rate of free‐radical polymerizations. To this end, the polymerization of methyl methacrylate and methacrylic acid in aqueous solution have been studied for various gas feed compositions.
3.2 Solvent and Solute Effects in Sonochemistry
3.2.1 Experimental Section
The experiments were performed in the set‐up schematically depicted in Figure 3.1. Ultrasound with a frequency of 20 kHz was applied from the top of the glass reactor (~ 300 mL) using a Sonics and Materials VC750 ultrasonic generator. The piezoelectric transducer was coupled to the liquid with a 13 mm diameter full wave titanium alloy horn. The temperature inside the reactor was controlled externally using a thermostatic bath and a Pt‐100 temperature sensor. Mass flow meters (Bronkhorst High‐Tech B.V., F‐201CV) were used to control the gas feed composition. The head space of the reactor was analyzed using a gas chromatograph equipped with thermal conductivity detectors (Varian Inc., Micro‐GC CP4900). To separate and analyze the mixture two different columns were used (simultaneously): 10 meter Molsieve 5Å column with 1 meter Pora PLOT‐Q precolumn (argon as carrier) and 10 meter Pora PLOT‐Q column with 1 meter Pora PLOT‐Q precolumn (helium as carrier).
The reactor was filled with 250 mL of MilliQ filtered water (18 MΩ cm‐1), methanol (≥ 99.8%, Sigma‐Aldrich), toluene (≥ 99.5%, Sigma‐Aldrich), or a mixture hereof. The thermostat was set to the desired temperature and the gas feed was bubbled through the mixture under vigorous stirring. Samples were taken from the head space to ensure that
38

Solvent and Solute Effects in Ultrasound‐Induced Polymerizations
all air was removed from the reactor and that its composition equaled the gas feed composition. The following gases were employed for this study: argon (grade 5.0, Hoek Loos B.V.), methane (grade 5.5, Hoek Loos B.V.), ethylene (grade 3.0, Hoek Loos B.V.), and iso‐butane (grade 2.5, Hoek Loos B.V.). During sonication the total gas flow equaled 30 mL/min and a sample was taken from the outgoing flow every 5 minutes for GC‐analysis. In all experiments the electrical energy input to the ultrasound horn was maintained at 50 W.
Horn
21.91.81.71.61.51.41.31.21.110.90.80.70.60.50.40.30.20.10
3,000
2,500
2,000
1,500
1,000
500
0
-500
-1,000
-1,500
hydrogen
SPW
0.0
5S
TH 1
2.00
TI O
FF TI O
N
hydr
ogen
SPW
0.1
2
oxyg
en
met
hane
RT [min]
Exp 112_1.DATAuV
Argon
Hydrocarbon
Figure 3.1: Experimental set‐up for hydrogen formation and polymerization experiments.
3.2.2 Results and Discussion
Solvent Effects
In the sonication of aqueous as well as organic solvents hydrogen gas is the major product and hence, the hydrogen formation rate has been considered as a measure for chemical reactivity in these systems.5‐7 The hydrogen formation rate was calculated from the steady state hydrogen concentration in the head space as determined from GC‐analysis. Figure 3.2 shows the hydrogen formation rate from water as a function of temperature.
39
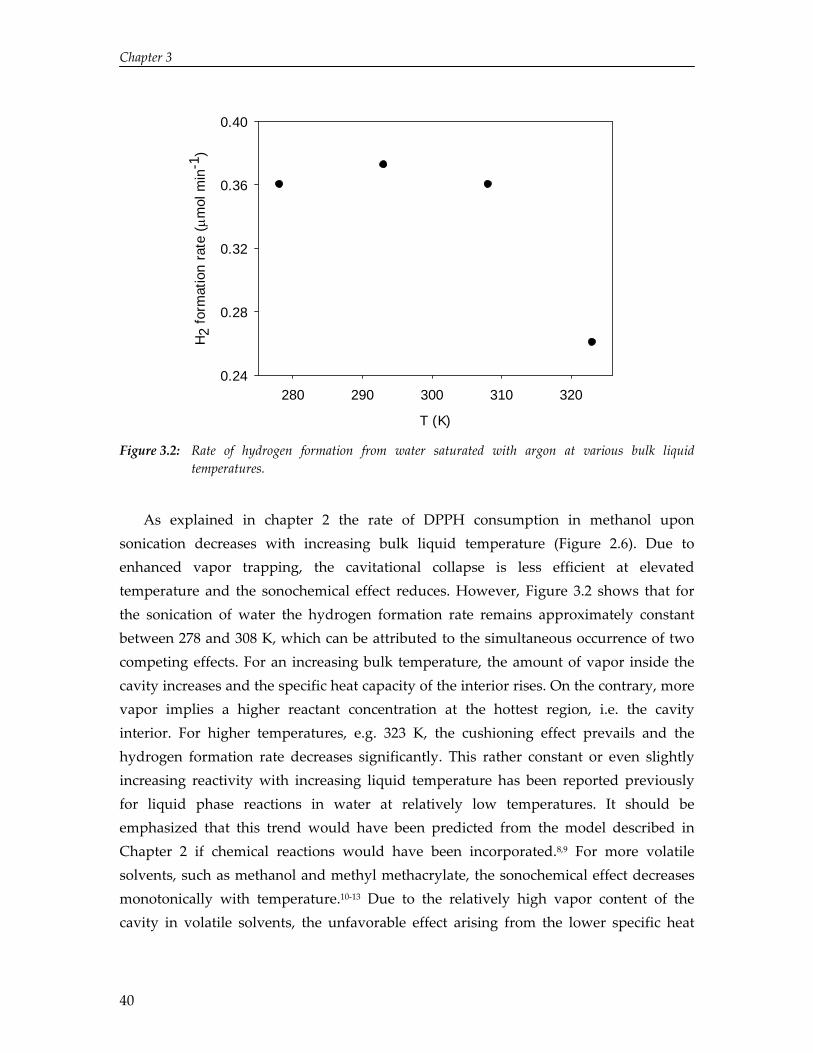
Chapter 3
T (K)
280 290 300 310 320
H2
form
atio
n ra
te (μm
ol m
in-1
)
0.24
0.28
0.32
0.36
0.40
Figure 3.2: Rate of hydrogen formation from water saturated with argon at various bulk liquid
temperatures.
As explained in chapter 2 the rate of DPPH consumption in methanol upon sonication decreases with increasing bulk liquid temperature (Figure 2.6). Due to enhanced vapor trapping, the cavitational collapse is less efficient at elevated temperature and the sonochemical effect reduces. However, Figure 3.2 shows that for the sonication of water the hydrogen formation rate remains approximately constant between 278 and 308 K, which can be attributed to the simultaneous occurrence of two competing effects. For an increasing bulk temperature, the amount of vapor inside the cavity increases and the specific heat capacity of the interior rises. On the contrary, more vapor implies a higher reactant concentration at the hottest region, i.e. the cavity interior. For higher temperatures, e.g. 323 K, the cushioning effect prevails and the hydrogen formation rate decreases significantly. This rather constant or even slightly increasing reactivity with increasing liquid temperature has been reported previously for liquid phase reactions in water at relatively low temperatures. It should be emphasized that this trend would have been predicted from the model described in Chapter 2 if chemical reactions would have been incorporated.8,9 For more volatile solvents, such as methanol and methyl methacrylate, the sonochemical effect decreases monotonically with temperature.10‐13 Due to the relatively high vapor content of the cavity in volatile solvents, the unfavorable effect arising from the lower specific heat
40
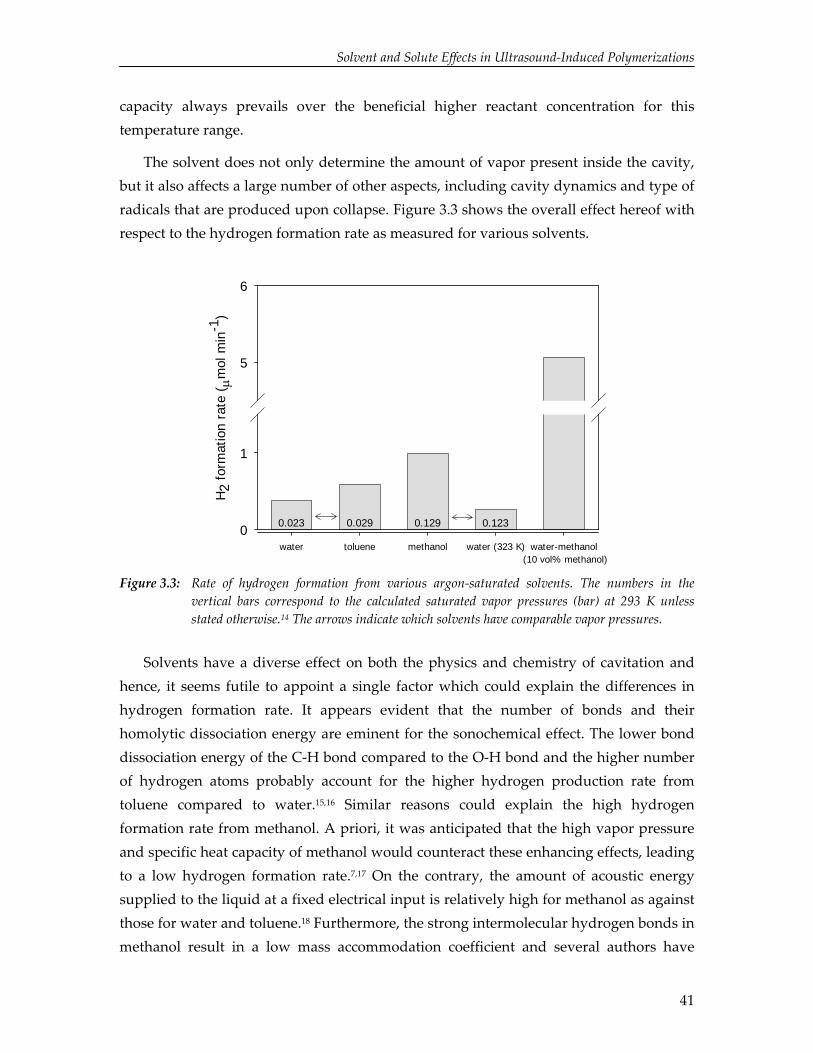
Solvent and Solute Effects in Ultrasound‐Induced Polymerizations
41
capacity always prevails over the beneficial higher reactant concentration for this temperature range.
The solvent does not only determine the amount of vapor present inside the cavity, but it also affects a large number of other aspects, including cavity dynamics and type of radicals that are produced upon collapse. Figure 3.3 shows the overall effect hereof with respect to the hydrogen formation rate as measured for various solvents.
water toluene methanol water (323 K) water-methanol
H2
form
atio
n ra
te (μm
ol m
in-1
)
0
1
5
6
0.1290.0290.023 0.123
(10 vol% methanol)
Figure 3.3: Rate of hydrogen formation from various argon‐saturated solvents. The numbers in the vertical bars correspond to the calculated saturated vapor pressures (bar) at 293 K unless stated otherwise.14 The arrows indicate which solvents have comparable vapor pressures.
Solvents have a diverse effect on both the physics and chemistry of cavitation and hence, it seems futile to appoint a single factor which could explain the differences in hydrogen formation rate. It appears evident that the number of bonds and their homolytic dissociation energy are eminent for the sonochemical effect. The lower bond dissociation energy of the C‐H bond compared to the O‐H bond and the higher number of hydrogen atoms probably account for the higher hydrogen production rate from toluene compared to water.15,16 Similar reasons could explain the high hydrogen formation rate from methanol. A priori, it was anticipated that the high vapor pressure and specific heat capacity of methanol would counteract these enhancing effects, leading to a low hydrogen formation rate.7,17 On the contrary, the amount of acoustic energy supplied to the liquid at a fixed electrical input is relatively high for methanol as against those for water and toluene.18 Furthermore, the strong intermolecular hydrogen bonds in methanol result in a low mass accommodation coefficient and several authors have
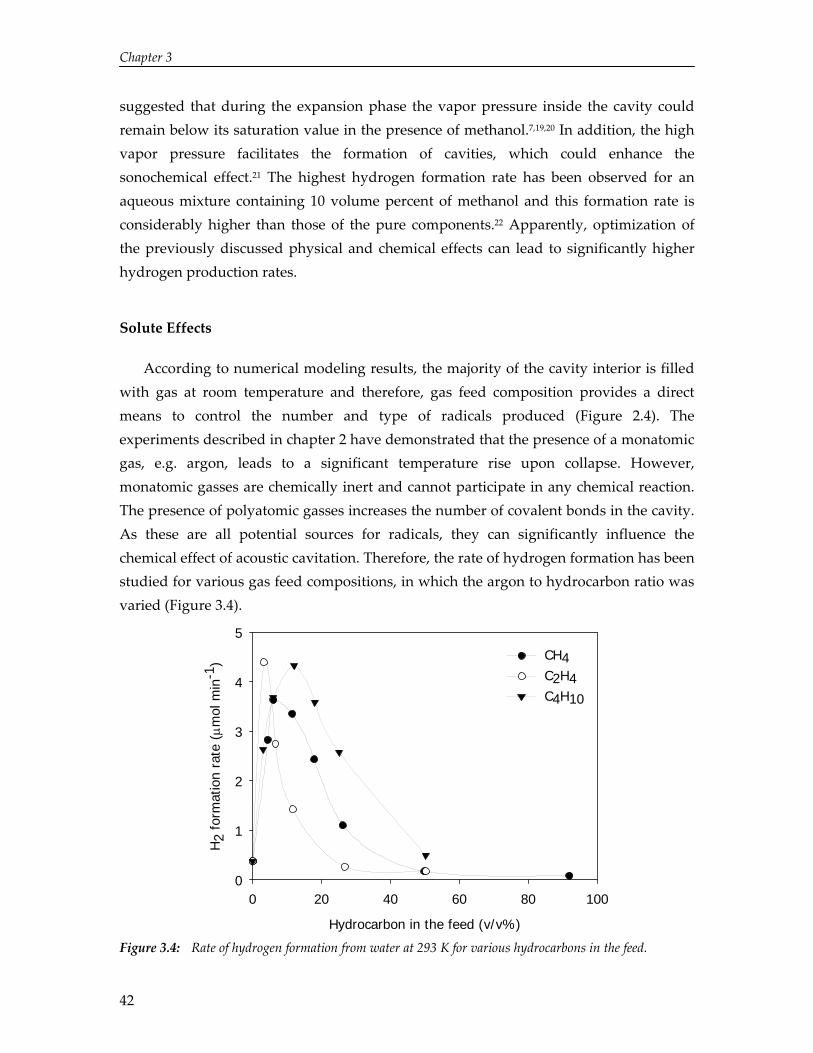
Chapter 3
suggested that during the expansion phase the vapor pressure inside the cavity could remain below its saturation value in the presence of methanol.7,19,20 In addition, the high vapor pressure facilitates the formation of cavities, which could enhance the sonochemical effect.21 The highest hydrogen formation rate has been observed for an aqueous mixture containing 10 volume percent of methanol and this formation rate is considerably higher than those of the pure components.22 Apparently, optimization of the previously discussed physical and chemical effects can lead to significantly higher hydrogen production rates.
Solute Effects
Hydrocarbon in the feed (v/v%)
0 20 40 60 80 1
According to numerical modeling results, the majority of the cavity interior is filled with gas at room temperature and therefore, gas feed composition provides a direct means to control the number and type of radicals produced (Figure 2.4). The experiments described in chapter 2 have demonstrated that the presence of a monatomic gas, e.g. argon, leads to a significant temperature rise upon collapse. However, monatomic gasses are chemically inert and cannot participate in any chemical reaction. The presence of polyatomic gasses increases the number of covalent bonds in the cavity. As these are all potential sources for radicals, they can significantly influence the chemical effect of acoustic cavitation. Therefore, the rate of hydrogen formation has been studied for various gas feed compositions, in which the argon to hydrocarbon ratio was varied (Figure 3.4).
00
H2
form
atio
n ra
te (μm
ol m
in-1
)
0
1
2
3
4
5
CH4C2H4C4H10
Figure 3.4: Rate of hydrogen formation from water at 293 K for various hydrocarbons in the feed.
42
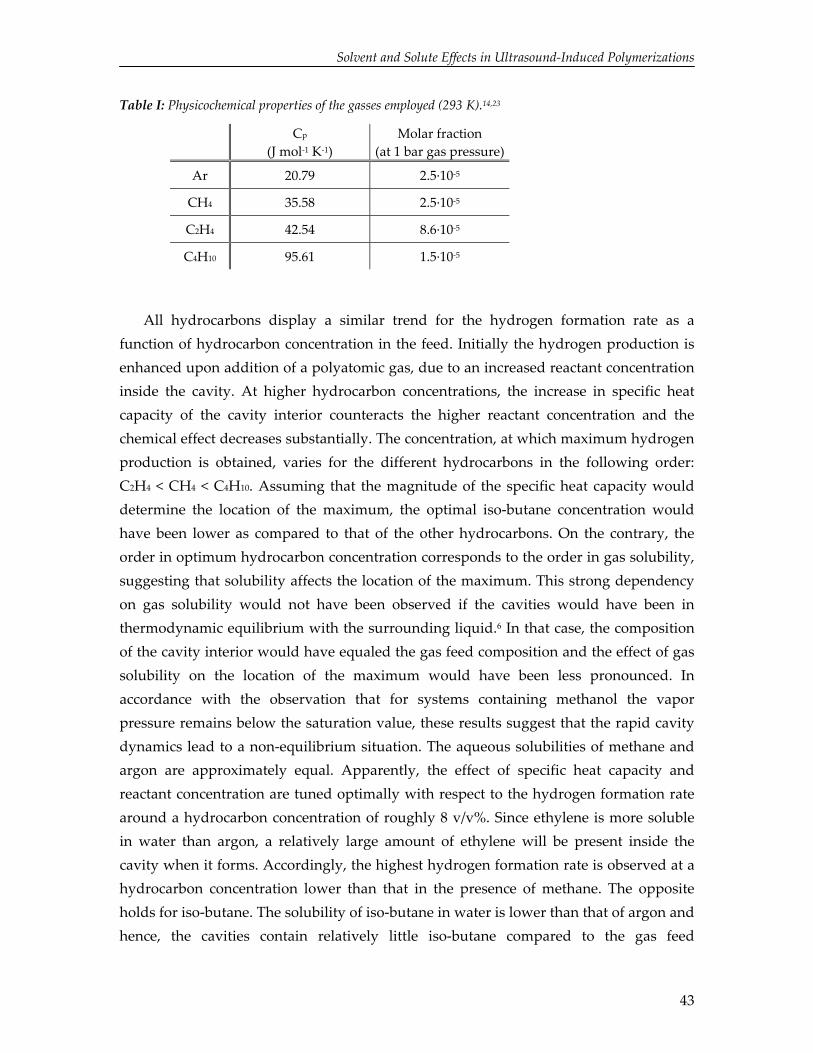
Solvent and Solute Effects in Ultrasound‐Induced Polymerizations
Table I: Physicochemical properties of the gasses employed (293 K).14,23
Cp
(J mol‐1 K‐1) Molar fraction
(at 1 bar gas pressure)
Ar 20.79 2.5∙10‐5 CH4 35.58 2.5∙10‐5
C2H4 42.54 8.6∙10‐5
C4H10 95.61 1.5∙10‐5
All hydrocarbons display a similar trend for the hydrogen formation rate as a function of hydrocarbon concentration in the feed. Initially the hydrogen production is enhanced upon addition of a polyatomic gas, due to an increased reactant concentration inside the cavity. At higher hydrocarbon concentrations, the increase in specific heat capacity of the cavity interior counteracts the higher reactant concentration and the chemical effect decreases substantially. The concentration, at which maximum hydrogen production is obtained, varies for the different hydrocarbons in the following order: C2H4 < CH4 < C4H10. Assuming that the magnitude of the specific heat capacity would determine the location of the maximum, the optimal iso‐butane concentration would have been lower as compared to that of the other hydrocarbons. On the contrary, the order in optimum hydrocarbon concentration corresponds to the order in gas solubility, suggesting that solubility affects the location of the maximum. This strong dependency on gas solubility would not have been observed if the cavities would have been in thermodynamic equilibrium with the surrounding liquid.6 In that case, the composition of the cavity interior would have equaled the gas feed composition and the effect of gas solubility on the location of the maximum would have been less pronounced. In accordance with the observation that for systems containing methanol the vapor pressure remains below the saturation value, these results suggest that the rapid cavity dynamics lead to a non‐equilibrium situation. The aqueous solubilities of methane and argon are approximately equal. Apparently, the effect of specific heat capacity and reactant concentration are tuned optimally with respect to the hydrogen formation rate around a hydrocarbon concentration of roughly 8 v/v%. Since ethylene is more soluble in water than argon, a relatively large amount of ethylene will be present inside the cavity when it forms. Accordingly, the highest hydrogen formation rate is observed at a hydrocarbon concentration lower than that in the presence of methane. The opposite holds for iso‐butane. The solubility of iso‐butane in water is lower than that of argon and hence, the cavities contain relatively little iso‐butane compared to the gas feed
43
Chapter 3
composition. As the maximum hydrogen formation rate can change significantly with a small variation in gas feed composition, it seems inconsiderable to draw any solid conclusion concerning the magnitude of the maximum hydrogen formation rate and the type of hydrocarbon.
3.3 Ultrasound‐Induced Polymerizations in Aqueous Systems
In recent years, ultrasound has gained increasing interest in the field of polymer synthesis and polymer processing.24 In particular, the ultrasound‐assisted emulsion polymerization of vinyl monomers in aqueous solution has been investigated thoroughly.25‐28 As compared to conventional emulsion polymerizations, the ultrasound‐assisted process provides several advantages.29‐31 Acoustic cavitation is a source for radicals and ultrasound‐assisted free‐radical polymerizations can be performed at lower initiator concentrations or even in the absence of an initiator. Since radical formation does not solely depend on thermal dissociation of an initiator, lower reaction temperatures can be used. The latter is also beneficial for the intensity of cavitational collapse. The need for emulsifying agents, such as surfactants and co‐stabilizers, is reduced due to the shearing action of ultrasound. Additionally, higher monomer conversions, polymerization rates and molecular weights have been reported in the presence of ultrasound. There is still some controversy about the exact source of radicals in an ultrasound‐initiated emulsion polymerization. In principle, radicals could arise from the thermal dissociation of water vapor, monomer, and surfactant, and from polymer scission.32 Several authors have suggested that surfactant decomposition is the primary source of radicals, since little conversion has been obtained in the absence of a surfactant and gas chromatography‐mass spectroscopy studies have confirmed surfactant dissociation.25,31‐33 Conversely, it has been hypothesized that water dissociation is the primary source of radicals in the aqueous polymerization of vinyl monomers.27 In their study on the effect of organic monomers on sonoluminescence emission, these authors could not detect any monomer pyrolysis products at 20 kHz sonication, which strongly suggests that monomer dissociation does not account for initiation.34 Furthermore, they claimed that the rate enhancement upon surfactant addition merely arises from the increased number of polymerization loci, i.e. micelles and monomer droplets.30 After initiation, polymerization can proceed in the monomer droplets, micelles or aqueous phase, depending on the mode of polymerization.29,35,36
Assuming that initiation mainly proceeds via the formation of primary radicals inside the collapsing cavities and that the rate of polymerization increases with
44
Solvent and Solute Effects in Ultrasound‐Induced Polymerizations
increasing initiator concentration, it is investigated in this study whether higher polymerization rates can be obtained by simultaneously adding argon and methane (Figure 3.4).27,37 Besides an increase in the radical production rate, the addition of methane leads to the formation of relatively stable methyl radicals. Accordingly, for the polymerization of methyl methacrylate and methacrylic acid in aqueous solution the rate of polymerization has been studied for a varying methane to argon ratio in the feed.
3.3.1 Experimental Section
The polymerization reactions were executed in the set‐up described in the previous section (Figure 3.1). Methyl methacrylate (MMA, ≥ 99%, Sigma‐Aldrich) and methacrylic acid (MAA, ≥ 98%, Sigma‐Aldrich) were distilled prior to use to remove the hydroquinone inhibitor. The reactor was filled with a mixture of monomer and MilliQ filtered water with a total volume of approximately 250 mL. The temperature was set to the desired value and the gas mixture was bubbled through the solution under vigorous stirring. Oxygen is known to effectively terminate radical polymerizations and hence, the head space was analyzed using GC‐analysis to identify whether oxygen was excluded from the reactor.37 For the ultrasound‐induced polymerizations, the reaction was started by switching on the ultrasound source and the electrical input was maintained at 50 W during sonication. For reasons of comparison, some conventional polymerizations using a thermal initiator were also performed. In these experiments, the addition of an aqueous solution of potassium persulfate (KPS, ≥ 99%, Sigma‐Aldrich) marked the start of the reaction. Samples were withdrawn from the reactor at specified time intervals to monitor monomer conversion (gravimetrically) and molecular weight in time.
Characterization
The dried polymethylmethacrylate samples were dissolved in tetrahydrofuran (THF, ≥ 99.8%, Sigma‐Aldrich) and passed through a 0.2 μm filter. Polymer molecular weights and molecular weight distributions were determined relative to polystyrene standards with size exclusion chromatography using two 30 cm linear columns from Mixed C. Polymer Laboratories, a Waters 510 pump (1 mL∙min‐1 THF) and a Waters 410 differential refractometer (313 K). Particle morphology was studied using Transmission Electron Microscopy (FEI Company, Tecnon G2 Sphera cryo TEM) with 200 kV accelerating voltage. Zeta‐potential measurements (Malvern Instruments Ltd., Zetasizer
45
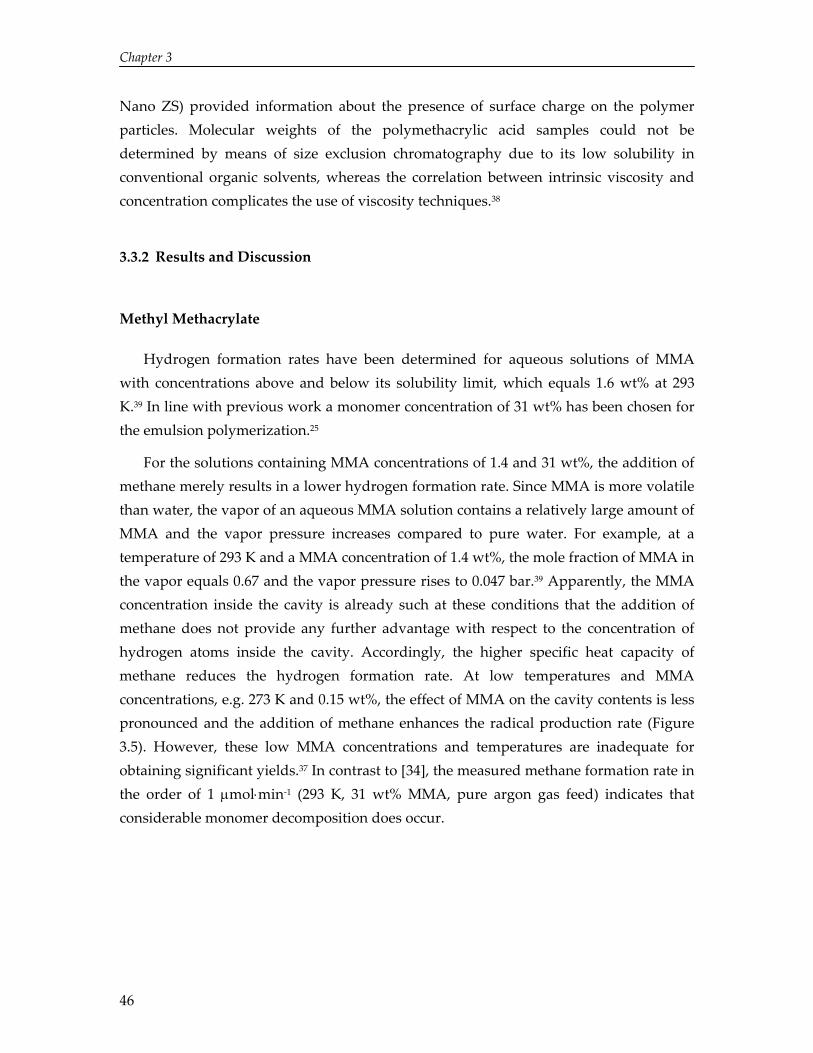
Chapter 3
Nano ZS) provided information about the presence of surface charge on the polymer particles. Molecular weights of the polymethacrylic acid samples could not be determined by means of size exclusion chromatography due to its low solubility in conventional organic solvents, whereas the correlation between intrinsic viscosity and concentration complicates the use of viscosity techniques.38
3.3.2 Results and Discussion
Methyl Methacrylate
Hydrogen formation rates have been determined for aqueous solutions of MMA with concentrations above and below its solubility limit, which equals 1.6 wt% at 293 K.39 In line with previous work a monomer concentration of 31 wt% has been chosen for the emulsion polymerization.25
For the solutions containing MMA concentrations of 1.4 and 31 wt%, the addition of methane merely results in a lower hydrogen formation rate. Since MMA is more volatile than water, the vapor of an aqueous MMA solution contains a relatively large amount of MMA and the vapor pressure increases compared to pure water. For example, at a temperature of 293 K and a MMA concentration of 1.4 wt%, the mole fraction of MMA in the vapor equals 0.67 and the vapor pressure rises to 0.047 bar.39 Apparently, the MMA concentration inside the cavity is already such at these conditions that the addition of methane does not provide any further advantage with respect to the concentration of hydrogen atoms inside the cavity. Accordingly, the higher specific heat capacity of methane reduces the hydrogen formation rate. At low temperatures and MMA concentrations, e.g. 273 K and 0.15 wt%, the effect of MMA on the cavity contents is less pronounced and the addition of methane enhances the radical production rate (Figure 3.5). However, these low MMA concentrations and temperatures are inadequate for obtaining significant yields.37 In contrast to [34], the measured methane formation rate in the order of 1 μmol⋅min‐1 (293 K, 31 wt% MMA, pure argon gas feed) indicates that considerable monomer decomposition does occur.
46

Solvent and Solute Effects in Ultrasound‐Induced Polymerizations
47
CH4 (v/v%)
5 10 150 20
H2
form
atio
n ra
te (μm
ol m
in-1
)
0
1
2
3
4273 K, 0.15 wt%293 K, 1.4 wt%293 K, 31 wt%
Figure 3.5: Rate of hydrogen formation from aqueous solutions with varying methyl methacrylate concentration as a function of methane fraction in the feed.
Due to the low yields, monomer conversion has only been determined gravimetrically for the polymerizations performed with an aqueous MMA solution of 31 wt%. As the addition of methane does not enhance the radical production rate, it is anticipated that the rate of polymerization will not increase in the presence of methane, which has been confirmed by experiments. Typically, monomer conversions in the order of a few percent (< 5%) have been obtained after 3 hours of sonication. For relatively high methane fractions in the feed (> 15 v/v%), the temperature attained upon collapse is too low for a significant radical production rate and polymerization did not appear to proceed. Figure 3.6 shows that the molecular weight increases at the early stages of polymerization. This increase is followed by a decrease in molecular weight, probably due to ultrasound‐induced polymer scission.40 As compared to molecular weights typically obtained for the emulsion polymerization of MMA, the relatively low radical concentration for the ultrasound‐induced process leads to higher molecular weights. The polydispersity index remains approximately constant during sonication.
The polymerizations have been performed in the absence of any stabilizer and hence, particle coagulation could not be prevented. However, TEM‐images of the polymer solutions showed the presence of spherical polymer particles, implying that some kind of stabilization exists (Figure 3.7). Zeta‐potential measurements demonstrated that the particles are weakly charged. This could indicate that carboxylic groups are formed
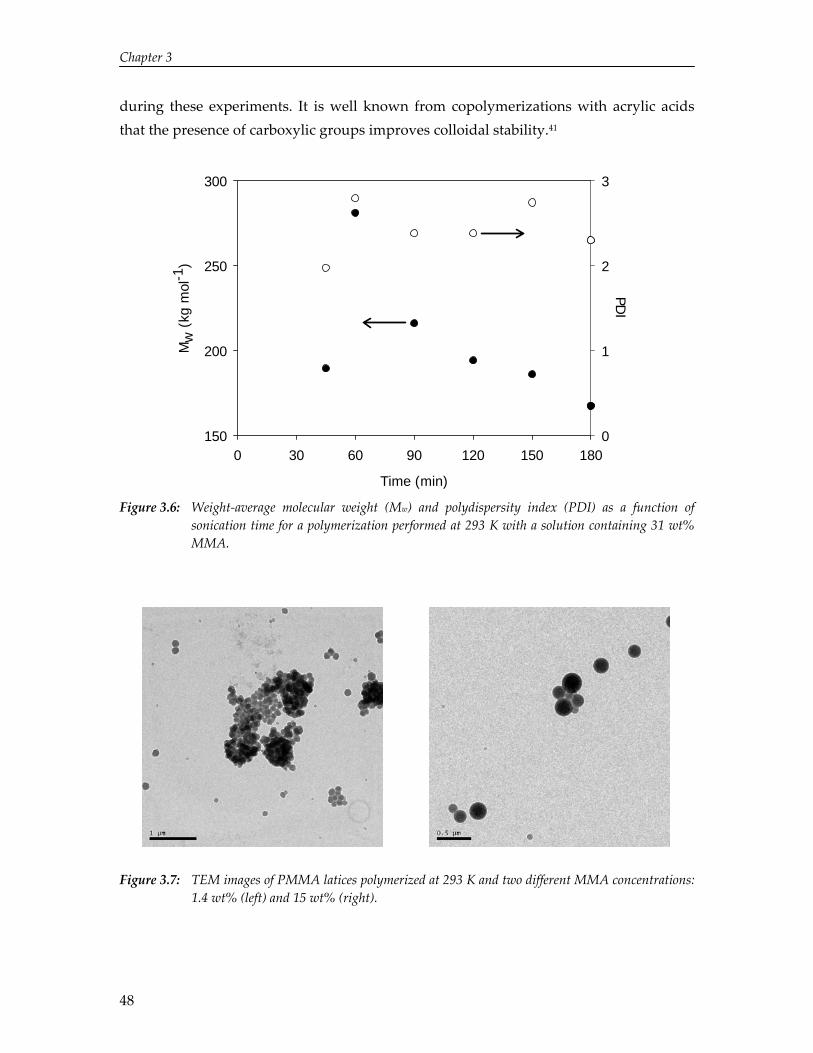
Chapter 3
during these experiments. It is well known from copolymerizations with acrylic acids that the presence of carboxylic groups improves colloidal stability.41
Time (min)
0 30 60 90 120 150 180
Mw
(kg
mol
-1)
150
200
250
300PD
I
0
1
2
3
Figure 3.6: Weight‐average molecular weight (Mw) and polydispersity index (PDI) as a function of sonication time for a polymerization performed at 293 K with a solution containing 31 wt% MMA.
Figure 3.7: TEM images of PMMA latices polymerized at 293 K and two different MMA concentrations: 1.4 wt% (left) and 15 wt% (right).
48
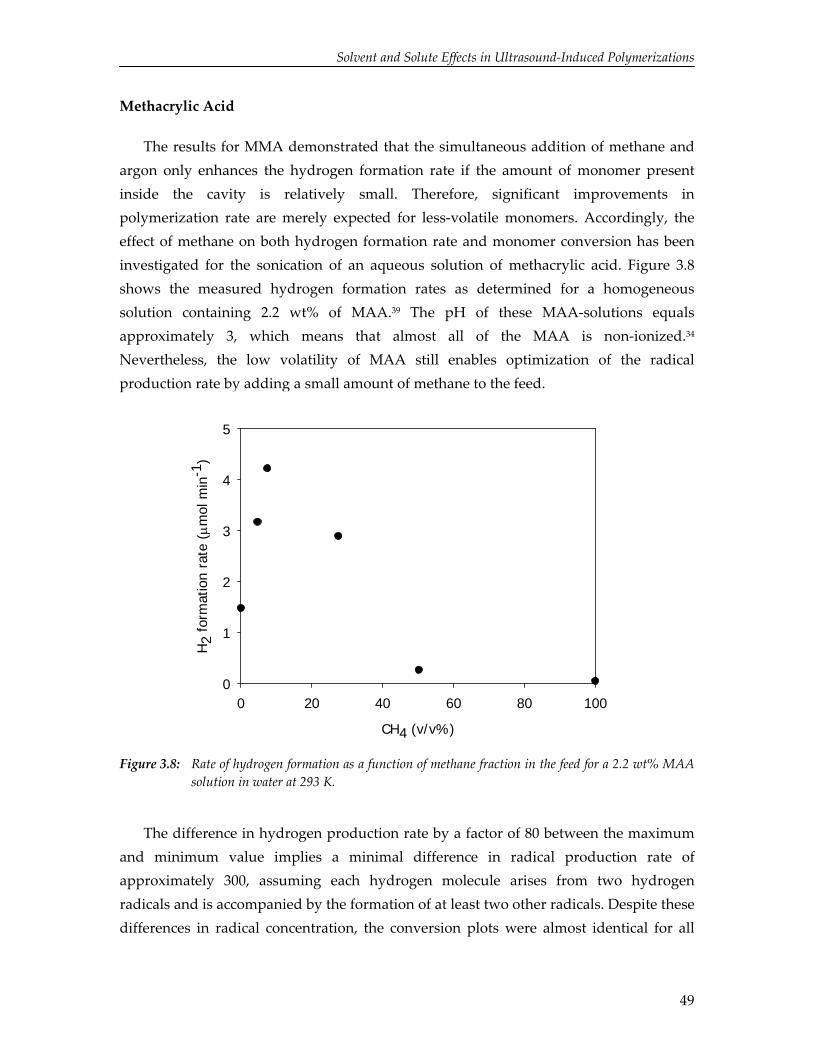
Solvent and Solute Effects in Ultrasound‐Induced Polymerizations
Methacrylic Acid
The results for MMA demonstrated that the simultaneous addition of methane and argon only enhances the hydrogen formation rate if the amount of monomer present inside the cavity is relatively small. Therefore, significant improvements in polymerization rate are merely expected for less‐volatile monomers. Accordingly, the effect of methane on both hydrogen formation rate and monomer conversion has been investigated for the sonication of an aqueous solution of methacrylic acid. Figure 3.8 shows the measured hydrogen formation rates as determined for a homogeneous solution containing 2.2 wt% of MAA.39 The pH of these MAA‐solutions equals approximately 3, which means that almost all of the MAA is non‐ionized.34 Nevertheless, the low volatility of MAA still enables optimization of the radical production rate by adding a small amount of methane to the feed.
CH4 (v/v%)
0 20 40 60 80 100
H2
form
atio
n ra
te (μm
ol m
in-1
)
0
1
2
3
4
5
Figure 3.8: Rate of hydrogen formation as a function of methane fraction in the feed for a 2.2 wt% MAA solution in water at 293 K.
The difference in hydrogen production rate by a factor of 80 between the maximum and minimum value implies a minimal difference in radical production rate of approximately 300, assuming each hydrogen molecule arises from two hydrogen radicals and is accompanied by the formation of at least two other radicals. Despite these differences in radical concentration, the conversion plots were almost identical for all
49
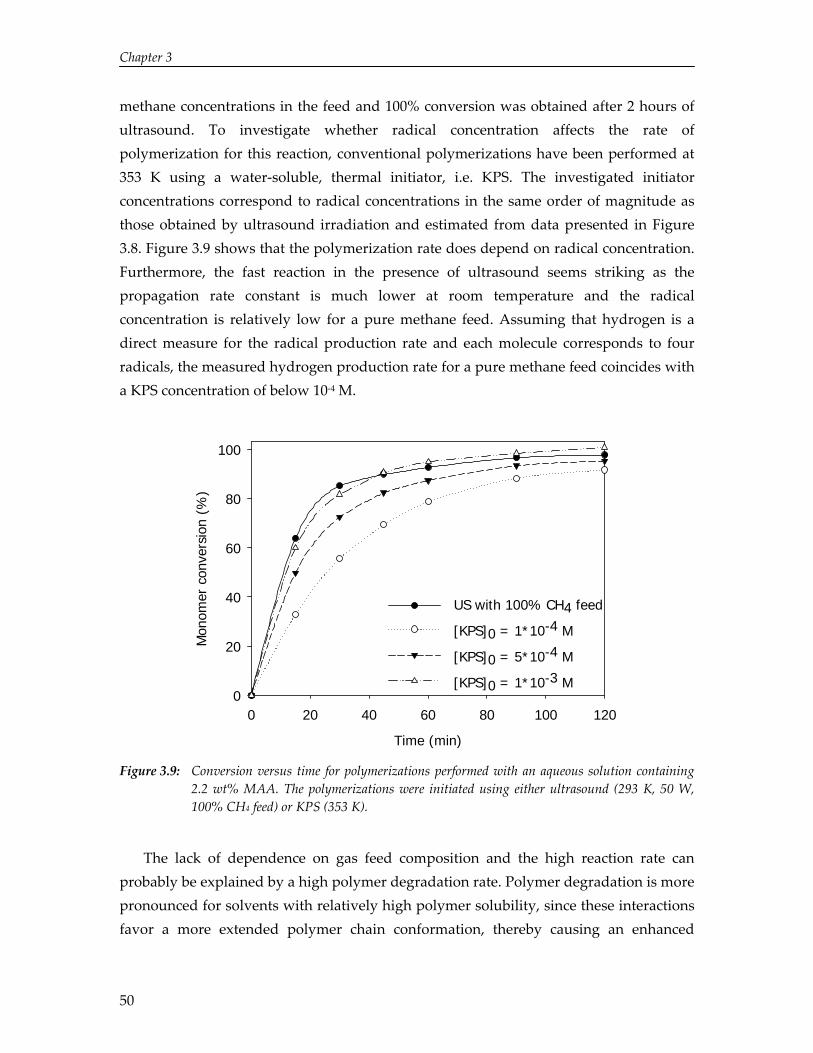
Chapter 3
methane concentrations in the feed and 100% conversion was obtained after 2 hours of ultrasound. To investigate whether radical concentration affects the rate of polymerization for this reaction, conventional polymerizations have been performed at 353 K using a water‐soluble, thermal initiator, i.e. KPS. The investigated initiator concentrations correspond to radical concentrations in the same order of magnitude as those obtained by ultrasound irradiation and estimated from data presented in Figure 3.8. Figure 3.9 shows that the polymerization rate does depend on radical concentration. Furthermore, the fast reaction in the presence of ultrasound seems striking as the propagation rate constant is much lower at room temperature and the radical concentration is relatively low for a pure methane feed. Assuming that hydrogen is a direct measure for the radical production rate and each molecule corresponds to four radicals, the measured hydrogen production rate for a pure methane feed coincides with a KPS concentration of below 10‐4 M.
Time (min)
0 20 40 60 80 100 120
Mon
omer
con
vers
ion
(%)
0
20
40
60
80
100
US with 100% CH4 feed
[KPS]0 = 1*10-4 M
[KPS]0 = 5*10-4 M
[KPS]0 = 1*10-3 M
Figure 3.9: Conversion versus time for polymerizations performed with an aqueous solution containing 2.2 wt% MAA. The polymerizations were initiated using either ultrasound (293 K, 50 W, 100% CH4 feed) or KPS (353 K).
The lack of dependence on gas feed composition and the high reaction rate can probably be explained by a high polymer degradation rate. Polymer degradation is more pronounced for solvents with relatively high polymer solubility, since these interactions favor a more extended polymer chain conformation, thereby causing an enhanced
50

Solvent and Solute Effects in Ultrasound‐Induced Polymerizations
susceptibility towards polymer scission.42 This explains for example the relatively fast degradation of PMMA in organic solvents and water‐soluble polymers in aqueous systems compared to the observed decrease in molecular weight of PMMA in water (Figure 3.6).43,44 The degradation rates reported for polyethylene oxide in water and polyacrylic acid in water indicate that polymer scission could be responsible for a substantial part of the radicals produced in these aqueous systems. As a result, radical concentrations estimated from hydrogen formation rates underrate the actual radical concentrations, which would clarify the fast reaction in the presence of ultrasound. Additionally, the extent of polymer scission is relatively insensitive for the gas dissolved and this would explain the nearly identical conversion plots for all gas feed compositions.12 Partial deprotonation of the carboxylic groups in polymethacrylic acid, as confirmed by electrical conductivity measurements, reinforces chain unfolding and hence, polymer degradation.38 Unfortunately, this hypothesis could not be validated by molecular weight data, due to the previously discussed experimental difficulties.
3.4 Conclusions
The experiments presented in this chapter have clearly demonstrated the pronounced effect of the solvent and the presence of solutes on cavitation and the subsequent formation of radicals. Although cavity dynamics models predict that cavitation is less efficient at elevated temperature, the hydrogen formation rate from water remains approximately constant between 278 and 308 K, which can be attributed to the increased water vapor content inside the cavity. Similar competing effects, i.e. reactant concentration and specific heat capacity, have been observed in the study on the influence of gas feed composition. Experiments have demonstrated that the hydrogen production rate can be changed significantly by controlling the gas feed composition. The simultaneous addition of methane and argon resulted in an enhancement of the hydrogen production rate from water by a factor of ten as compared to a pure argon feed. This enhanced radical production rate could not be employed for accelerating the aqueous polymerization of MMA, due to the high volatility of MMA. For the sonication of an aqueous solution of MAA, a less volatile monomer, the simultaneous addition of methane and argon resulted in a minimal difference in radical production rate by a factor of 300. However, this difference in radical concentration did not lead to an increase in the rate of polymerization. Presumably, the more stretched conformation of the relatively hydrophilic polymethacrylic acid chains enhances polymer scission, leading to an increase in radical production. Due to these higher radical concentrations,
51
Chapter 3
the benefit of methane with respect to the total radical production rate appears almost negligible.
References
1 D. V. Prasad Naidu; R. Rajan; R. Kumar; K. S. Gandhi; V. H. Arakeri; S. Chandrasekaran, Chem. Eng. Sci. 49, 877 (1994).
2 S. Sochard; A. M. Wilhelm; H. Delmas, Chem. Eng. Sci. 53, 239 (1998). 3 C. Gong; D. P. Hart, J. Acoust. Soc. Am. 104, 2675 (1998). 4 B. D. Storey; A. J. Szeri, Proc. R. Soc. Lond. A 457, 1685 (2001). 5 D. N. Rassokhin; G. V. Kovalev; L. T. Bugaenko, J. Am. Chem. Soc. 117, 344 (1995). 6 A. Henglein, Z. Naturforsch. 40b, 100 (1985). 7 Y. Mizukoshi; H. Nakamura; H. Bandow; Y. Maeda; Y. Nagata, Ultrason. Sonochem. 6, 203
(1999). 8 K. Okitsu; A. Yue; S. Tanabe; H. Matsumoto; Y. Yobiko; Y. Yoo, Bull. Chem. Soc. Jpn. 75, 2289
(2002). 9 M. H. Entezari; P. Kruus, Ultrason. Sonochem. 3, 19 (1996). 10 M. H. Entezari; P. Kruus; R. Otson, Ultrason. Sonochem. 4, 49 (1997). 11 P. Kruus; T. J. Patraboy, J. Phys. Chem. 89, 3379 (1985). 12 A. Henglein; M. Gutierrez, J. Phys. Chem. 92, 3705 (1988). 13 M. W. A. Kuijpers; M. F. Kemmere; J. T. F. Keurentjes, Ultrasonics 40, 675 (2002). 14 B. E. Poling; J. M. Prausnitz; J. P. O’Connell, The Properties of Gases and Liquids 5th Ed.
(McGraw‐Hill, London, 2001). 15 R. J. Dwyer; O. Oldenberg, J. Chem. Phys. 12, 351 (1944). 16 M. Szwarc, Proc. R. Soc. Lond. A 207, 5 (1951). 17 K. Yasui, J. Chem. Phys. 116, 2945 (2002). 18 J. M. Löning; C. Horst; U. Hoffmann, Ultrason. Sonochem. 9, 169 (2002). 19 M. Matsumoto; K. Yasuoka; Y. Kataoka, J. Chem. Phys. 101, 7912 (1994). 20 G. J. Price; M. Ashokkumar; F. Grieser, J. Am. Chem. Soc. 126, 2755 (2004). 21 T. G. Leighton, The Acoustic Bubble (Academic Press, London, 1994). 22 J. Büttner; M. Gutiérez; A. Henglein, J. Phys. Chem. 95, 1528 (1991). 23 P. J. Linstrom; W. G. Mallard, Eds., NIST Chemistry WebBook, NIST Standard Reference
Database Number 69, National Institute of Standards and Technology, Gaithersburg MD, 20899 (June 2005).
24 K. S. Suslick; G. J. Price, Annu. Rev. Mater. Sci. 29, 295 (1999). 25 Y. Liao; Q. Wang; H. Xia; X. Xu; S. M. Baxter; R. V. Slone; S. Wu; G. Swift; D. G.
Westmoreland, J. Polym. Sci., Part A: Polym. Chem. 39, 3356 (2001). 26 G. Cooper; F. Grieser; S. Biggs, J. Colloid Interface Sci. 184, 52 (1996). 27 B. M. Teo; S. W. Prescott; M. Ashokkumar; F. Grieser, Ultrason. Sonochem. 15, 89 (2008). 28 L. Yan; H. Wu; Q. Zhu, Green Chem. 6, 99 (2004). 29 H. Xia; Q. Wang; Y. Liao; X. Xu; S. M. Baxter; R. V. Slone; S. Wu; G. Swift; D. G.
Westmoreland, Ultrason. Sonochem. 9, 151 (2002). 30 M. A. Bradley; S. W. Prescott; H. A. S. Schoonbrood; K. Landfester; F. Grieser,
Macromolecules 38, 6346 (2005). 31 H. C. Chou; J. O. Stoffer, J. Appl. Polym. Sci. 72, 797 (1999). 32 Y. He; Y. Cao; Y. Liu, J. Polym. Sci., Part B: Polym. Phys. 43, 2617 (2004).
52
Solvent and Solute Effects in Ultrasound‐Induced Polymerizations
33 Y. Liu; H. C. Chou; J. O. Stoffer, J. Appl. Polym. Sci. 53, 247 (1994). 34 G. J. Price; M. Ashokkumar; F. Grieser, J. Phys. Chem. B 107, 14124 (2003). 35 N. Yin; K. Chen, Eur. Polym. J. 41, 1357 (2005). 36 N. Yin; K. Chen, Polymer 46, 12729 (2005). 37 A. Rudin, The Elements of Polymer Science and Engineering 2nd Ed. (Academic Press, San
Diego, 1999). 38 P. Alexander; M. Fox, J. Polym. Sci. 7, 533 (1954). 39 W. Foerst, Lösungsmittel bis Nitrochlorobenzole und –toluole, Ullmanns Encyklopädie der
Technische Chemie (Urban & Schwarzenberg, München ‐ Berlin, 1960). 40 G. J. Price; D. J. Norris; P. J. West, Macromolecules 25, 6447 (1992). 41 G. Fritz; V. Schadler; N. Willenbacher; N. J. Wagner, Langmuir 18, 6381 (2002). 42 G. J. Price, The Use of Ultrasound for the Controlled Degradation of Polymer Solutions,
Advances in Sonochemistry Vol. 1, 231 (Elsevier, Amsterdam, 1990). 43 G. Madras; V. Karmore, Polym. Int. 50, 683 (2001). 44 T. Aarthi; M. S. Shaama; G. Madras, Ind. Eng. Chem. Res. 46, 6204 (2007).
53

Chapter 3
54

4
High Yield Gas‐Phase Sonochlorination of Methane
Abstract
Ultrasound‐induced chemistry focuses on liquid‐phase reactions, thereby utilizing only a minor fraction of the radicals produced upon cavitational collapse. This work demonstrates for the chlorination of methane that the high radical concentration inside the collapsing cavity can effectively be used for performing gas‐phase reactions. The composition of the cavity interior is important to obtain significant yields. In contrast to liquid‐phase reactions, gas‐phase sonochemistry does not only require subtle balancing of the physical and chemical effects of acoustic cavitation, also deviations from thermodynamic equilibrium have to be taken into account. Due to the rapid cavity dynamics, the cavity interior is not in equilibrium with the surrounding liquid and as a result, the cavity interior and composition of the gas feed can be completely different.
M.M. van Iersel; M. A. van Schilt; N. E. Benes; J. T. F. Keurentjes, in preparation.
55
Chapter 4
4.1 Introduction
Ultrasonic irradiation of liquids provides a powerful technique for establishing unique chemical conditions.1 These conditions principally derive from acoustic cavitation, i.e. the growth and subsequent adiabatic collapse of microscopic cavities, leading to hot‐spots in the liquid. In the hot‐spots, temperatures of several thousands of Kelvins, pressures of hundreds of bars, and high heating and cooling rates can be obtained.2,3 The extreme conditions can lead to the dissociation of chemical bonds and the formation of radicals.4 Radicals are produced primarily inside the collapsing cavity and the majority recombines before entering the liquid.5 Consequently, relatively few radicals reach the liquid phase and induce chemical reactions. Examples of ultrasound‐induced liquid‐phase reactions include the free‐radical polymerization of acrylics and styrene in aqueous solution and the oxidation of organic pollutants.6‐8 Only few studies have explored the possibility to effectively use the high radical concentration inside the collapsing cavity by performing a gas‐phase reaction.9 In particular, a free‐radical reaction between two gaseous reactants will benefit from the high radical concentration inside the cavity. It has been investigated for the first time whether ultrasound irradiation can be employed for the efficient and controlled chlorination of methane. The chlorination of methane is a classical example of hydrocarbon halogenation reactions and the main product, methyl chloride, is of significant industrial importance.10,11 It is also important to realize that, in contrast to much of the studies on ultrasound‐induced chemistry, this reaction involves the selective formation of bonds and not merely their dissociation.1
4.2 Experimental Section
The experiments were performed in the set‐up schematically depicted in Figure 4.1. Ultrasound with a frequency of 20 kHz was applied from the top of the glass reactor (~ 300 mL) using a Sonics and Materials VC750 ultrasonic generator. The piezoelectric transducer was coupled to the liquid with a 13 mm diameter full wave titanium alloy horn. The temperature inside the reactor was controlled externally using a thermostatic bath and a Pt‐100 temperature sensor. Mass flow meters (Bronkhorst High‐Tech B.V., F‐201CV) were used to control the gas feed composition. For the chlorination experiments, the outgoing flow was forced through two 0.1 M sodium hydroxide solutions and dry sodium hydroxide pellets to neutralize the low pH. The composition of the outgoing flow was analyzed using a gas chromatograph equipped with thermal conductivity
56

High Yield Gas‐Phase Sonochlorination of Methane
detectors (Varian Inc., Micro‐GC CP4900). To separate and analyze the mixture two different columns were used: 10 meter Molsieve 5Å column with 1 meter Pora PLOT‐Q precolumn (argon as carrier) and 10 meter Pora PLOT‐Q column with 1 meter Pora PLOT‐Q precolumn (helium as carrier).
HornA
rgon
Hydrocarbon
Argon/C
lorine
21.91.81.71.61.51.41.31.21.110.90.80.70.60.50.40.30.20.10
3,000
2,500
2,000
1,500
1,000
500
0
-500
-1,000
-1,500
hydrogen
SPW
0.0
5S
TH 1
2.00
TI O
FF TI O
N
hydr
ogen
SPW
0.1
2
oxyg
en
met
hane
RT [min]
Exp 112_1.DATAuV
Figure 4.1: Experimental set‐up for chlorination experiments.
At the start of an experiment the reactor was filled with 250 mL of MilliQ filtered water (18 MΩ cm‐1) and the temperature of the thermostat was set to 293 K. Prior to sonication the solution was saturated for at least half an hour with the desired gas mixture, for which the following gases were used: argon (grade 5.0, Hoek Loos B.V.), methane (grade 5.5, Hoek Loos B.V.), ethylene (grade 3.0, Hoek Loos B.V.), iso‐butane (grade 2.5, Hoek Loos B.V.), and 10 v/v% clorine in argon (Linde Gas B.V.). During ultrasound, the gas flow was maintained at a total flow rate of 30 mL/min and at fixed time intervals a sample was taken from the outgoing flow for GC‐analysis. Ultrasound with an electrical energy input of 50 W was applied to the solution until the measured concentrations in the outgoing flow reached steady state.
57

Chapter 4
4.3 Results and Discussion
Hydrocarbon in the feed (v/v%)
0 20 40 60 80 1
The extent of radicalization inside the cavity strongly depends on the contents of the cavity and the temperature attained upon collapse.12 In the sonication of aqueous systems, hydrogen gas is one of the major products and hence, the hydrogen formation rate is considered as a direct measure for the radical production rate.13 The presence of methane leads to a higher reactant concentration in the cavity interior. On the contrary, polyatomic gasses have a relatively high heat capacity and thereby suppress the temperature increase upon collapse. As a result, the hydrogen and radical production rate from water saturated with methane is minimal (Figure 4.2). The addition of a monoatomic gas, e.g. argon, increases the temperature attained upon cavitational collapse, leading to a higher hydrogen formation rate. For the situation in which solely argon is used as saturation gas, radicals can only arise from the dissociation of water molecules and the rate of hydrogen formation remains relatively low. For a feed with a methane concentration of 8%, the physical and chemical effects are tuned such that the highest radical production rate is observed.
00
H2
form
atio
n ra
te (μm
ol m
in-1
)
0
1
2
3
4
5
CH4C2H4C4H10
Figure 4.2: Rate of hydrogen gas formation from water at 293 K for a gas feed containing argon and a
hydrocarbon.
Figure 4.2 also shows the strong dependency of the optimal gas feed composition on the type of polyatomic reactant. The concentration, at which maximum hydrogen production is obtained, varies for the different hydrocarbons in the following order:
58

High Yield Gas‐Phase Sonochlorination of Methane
C2H4 < CH4 < C4H10. This order implies that the cavities are not in thermodynamic equilibrium with the surrounding liquid.12 Under equilibrium conditions, the composition of the cavity interior equals the gas feed composition and the optimal hydrocarbon concentration would shift to a lower value with increasing specific heat capacity.14 On the contrary, the order in optimum hydrocarbon concentration corresponds to the order in gas solubility.15 Due to the rapid cavity dynamics the cavity interior deviates from equilibrium conditions, leading to an enrichment of the interior with the most soluble gas.16 The aqueous solubilities of methane and argon are approximately equal at 293 K (molar fraction ~ 2.5⋅10‐5). Since ethylene (~ 8.5⋅10‐5) is more soluble in water than argon, a relatively large amount of ethylene is present inside the cavity when it forms. Accordingly, the highest hydrogen formation rate for ethylene is observed at a hydrocarbon concentration lower than that in the presence of methane. The opposite holds for a gas feed containing iso‐butane, which has an aqueous solubility of 1.5⋅10‐5.
Taking the preceding analysis into account, a relatively high concentration of argon in the gas feed is required for an efficient chlorination of methane. Due to the pronounced effect of gas solubility on the composition of the cavity interior and the high aqueous solubility of chlorine (~ 1.5⋅10‐3), the ratio of chlorine to methane in the gas feed should be low when aiming at comparable reactant concentrations inside the cavity.15 In the chlorination experiments the ratio between methane and argon in the gas feed was varied, whereas the concentration of chlorine was kept constant at a value of 0.22 v/v%. The steady state concentration of methyl chloride was measured by GC‐analysis of the head space and from this the methyl chloride yield has been calculated. The results of these experiments are presented in Figure 4.3. For reasons of safety, the chlorine supply consisted of a mixture of chlorine and argon (10 v/v%) and therefore, it was not possible to determine the methyl chloride yield in the absence of argon.
This graph clearly demonstrates that ultrasound can effectively be used to perform gas‐phase reactions with significant yields. The highest yield is observed for a methane concentration in the feed of approximately 20%. Below this value the relatively low reactant concentration limits the overall yield, whereas above this value the high specific heat capacity results in lower conversions. The head space contained no detectable amounts of dichloromethane, indicating that multiple substitution of methane hardly occurred.
59

Chapter 4
CH4 (v/v%)
0 20 40 60 80 1
00
CH3C
l yie
ld (
%)
0
5
10
15
20
25
Figure 4.3: Methyl chloride yield from water at 293 K saturated with a mixture of methane, argon and
chlorine. The methyl chloride yield has been defined as the ratio of the molar concentration of methyl chloride in the outgoing flow and the molar concentration of chlorine in the gas feed, assuming that each chlorine molecule leads to the formation of a single methyl chloride molecule and hydrochloric acid.
4.4 Conclusions
It has been demonstrated that ultrasound irradiation can be used for the chlorination of methane, which represents a novel route for the chlorination of hydrocarbons. Yields of up to 20% have been obtained by optimizing the gas feed composition. The addition of a monoatomic gas can be used to achieve a sufficient temperature rise, whereas the reactant concentration inside the cavity is relevant for the chemical effect. When aiming at a particular reactant concentration inside the cavity, deviations from non‐equilibrium thermodynamics also have to be taken into account. Due to the rapid cavity dynamics, the composition of the cavity interior does not equal the gas feed composition, yet strongly relates to the relative gas solubilities in the liquid.
References
1 T. J. Mason; J. P. Lorimer, Applied Sonochemistry (Wiley‐VCH, Weinheim, 2002). 2 E. B. Flint; K. S. Suslick, Science 253, 1397 (1991). 3 K. S. Suslick; S. B. Choe; A. A. Cichowlas; M. W. Grinstaff, Nature 353, 414 (1991).
60
High Yield Gas‐Phase Sonochlorination of Methane
4 K. Makino; M. M. Mossoba; P. Riesz, J. Am. Chem. Soc. 104, 3537 (1982). 5 C. H. Fischer; E. J. Hart; A. Henglein, J. Phys. Chem. 90, 222 (1986). 6 H. C. Joe Chou; J. O. Stoffer, J. Appl. Polym. Sci. 72, 797 (1999). 7 S. Biggs; F. Grieser, Macromolecules 28, 4877 (1995). 8 T. J. Mason; C. Petrier, Ultrasound Processes, Advanced Oxidation Processes for Water and
Wastewater Treatment (IWA Publishing, London, 2004). 9 Supeno; P. Kruus, Ultrason. Sonochem. 9, 53 (2002). 10 K. A. Marshall, Chlorocarbons and Chlorohydrocarbons, Kirk‐Othmer Encyclopedia of
Chemical Technology Vol. 6 (J. Wiley & Sons, New York, 2003). 11 M. T. Holbrook, Methyl Chloride, Kirk‐Othmer Encyclopedia of Chemical Technology Vol. 16 (J.
Wiley & Sons, New York, 2003). 12 A. Henglein, Z. Naturforsch. 40b, 100 (1985). 13 D. N. Rassokhin; G. V. Kovalev; L. T. Bugaenko, J. Am. Chem. Soc. 117, 344 (1995). 14 Specific heat capacities have been determined from temperature dependent correlations
given in B. E. Poling; J. M. Prausnitz; J. P. O’Connell, The Properties of Gases and Liquids 5th Ed. (McGraw‐Hill, London, 2001).
15 Aqueous solubilities have been derived from Henry coefficients provided in P. J. Linstrom; W. G. Mallard, NIST Chemistry WebBook, NIST Standard Reference Database Number 69, National Institute of Standards and Technology, Gaithersburg MD, 20899 (June 2005).
16 M. M. van Iersel; J. Cornel; N. E. Benes; J. T. F. Keurentjes, J. Chem. Phys. 126, 064508 (2007).
61

Chapter 4
62
5
Pressure‐Induced Reduction of Shielding for Improving Sonochemical Activity
Abstract
It is well known that sonochemistry is less efficient at high acoustic intensities. Many authors have attributed this effect to decoupling losses and shielding of the acoustic wave. In this study we have demonstrated that, for a 20 kHz ultrasound field with an intensity ranging from 40 to 200 W/cm2, the void fraction below the ultrasound horn increases more than proportional with increasing power input. Nevertheless, decoupling losses are not reinforced for larger bubble clouds. On the contrary, microphone measurements have shown that due to the larger bubble cloud a substantial part of the supplied energy is lost at high power inputs. Additionally, it has been explored whether an increase in hydrostatic pressure can reduce shielding effects and enhance sonochemical reaction rates. The bubble cloud visualization studies and sound attenuation measurements have confirmed that shielding is less pronounced at elevated pressures, leading to a slight increase in the yield of iodine liberation. Above a certain threshold pressure, an increase in static pressure does not provide any additional advantage with respect to shielding. Accordingly, the less efficient cavitation dynamics prevail and the sonochemical reaction rate decreases rapidly with increasing pressure.
M. M. van Iersel; J. P. A. J. van den Manacker; N. E. Benes; J. T. F. Keurentjes, J. Phys. Chem. B 111, 3081 (2007).
M. M. van Iersel; N. E. Benes; J. T. F. Keurentjes, Ultrason. Sonochem. 14, 294 (2008).
63
Chapter 5
5.1 Introduction
The application of ultrasound in chemical processes has gained increasing interest over the past decades.1,2 Previous studies have demonstrated that ultrasound successfully initiates reactions, changes reaction pathways, and accelerates mixing. Its unique character predominantly arises from acoustic cavitation, i.e. the growth and subsequent adiabatic collapse of a microscopic cavity in a liquid, leading to a momentary increase of temperature and pressure. The extreme local conditions can cause bond breakage and free radical formation, thereby providing an alternative route for inducing chemical reactions (sonochemistry).
It seems evident to increase the ultrasound intensity to accelerate sonochemical reactions. The intensity can be increased either by reducing the radiating surface area or by increasing the power supplied to the system. In case of an existing experimental set‐up, the power input is generally used for adjusting the acoustic intensity. It has been reported that the sonochemical decomposition of organic solutes and the oxidation of potassium iodide increase linearly with increasing acoustic intensity, using low‐frequency ultrasound (20 – 60 kHz) of relatively low intensity. At high intensities, however, an increase in intensity leads to a relatively small increase or even a decrease in the sonochemical reaction rate.3‐8 Wu et al. has demonstrated that in a single experimental set‐up the dependency on acoustic intensity can vary for different reactions.9
Frequently, numerical modeling studies are employed to gain understanding on the governing phenomena of acoustic cavitation and to explain the effect of various process conditions on ultrasound‐induced reactivity.10 The remarkable effect of acoustic intensity, however, is difficult to explain using these numerical models. With increasing power input the sound field penetrates further into the liquid and consequently, the sonochemical active zone covers a larger region. This effect has been confirmed by previously reported studies using sonogenerated chemiluminescence.11,12 On the contrary, the increased number of cavitation bubbles can absorb and scatter the sound wave, thereby weakening the acoustic field substantially (shielding).13,14 Furthermore, these bubbles change the acoustic impedance of the medium and as a consequence, the energy transfer efficiency from the ultrasound emitter to the medium can decrease. The energy losses associated with this change in impedance are referred to as decoupling losses.15 It is anticipated that the volume of the bubble cloud decreases at elevated hydrostatic pressure, which could lead to a reduction in shielding and decoupling losses. This would imply a more intense sound field and a possible increase in
64
Pressure‐Induced Reduction of Shielding for Improving Sonochemical Activity
sonochemical reactivity. Conversely, single‐cavity dynamics models predict that cavitation is hindered at elevated static pressure, which is manifested by an increase in acoustic threshold pressure.16 Nevertheless, Henglein et al. observed a higher yield for the oxidation of potassium iodide at a slightly elevated pressure using 1 MHz ultrasound.17
In this study it has been investigated whether the employed sonication system, i.e. the combination of ultrasound horn and sonicated medium, suffers from a lower efficiency at elevated acoustic intensity and to what extent this can be attributed to shielding and decoupling losses. Subsequently, the effect of hydrostatic pressure on shielding, energy coupling between the horn and the medium, and sonochemical reactivity has been studied. The sonochemical efficiency has been evaluated by means of the liberation of iodine from an aqueous potassium iodide solution.18 Calorimetric measurements have been performed to determine the acoustic energy supplied to the liquid and to investigate the occurrence of decoupling losses.15 Laser light scattering has been used to visualize the bubble cloud and microphone measurements have been done to study the effect thereof on sound attenuation. It should be emphasized that in contrast to several other studies, the images of the bubble cloud are not used for detecting sonochemical activity, yet for investigating shielding effects.11,19
5.2 Experimental Section
An ultrasonic generator with variable power output (Sonics and Materials Inc., VC750) was used for producing ultrasound with a frequency of 20 kHz. The piezoelectric transducer was coupled to the liquid with a 13 mm diameter full wave titanium alloy horn. The horn was inserted at the top of the reactor, fixed at its nodal point and immersed 20 to 30 mm below the surface of the liquid. All experiments were executed at 293 K using MilliQ filtered water (18 MΩ cm‐1) and argon (grade 5.0, Hoek Loos B.V.) as saturation gas. For the experiments in which the acoustic intensity was varied the hydrostatic pressure was maintained at a value of 5 bar. In the study on the effect of hydrostatic pressure the electrical input was kept at 100 W. Each series of measurements was performed in consecutive order, starting with the lowest acoustic intensity or hydrostatic pressure.
65
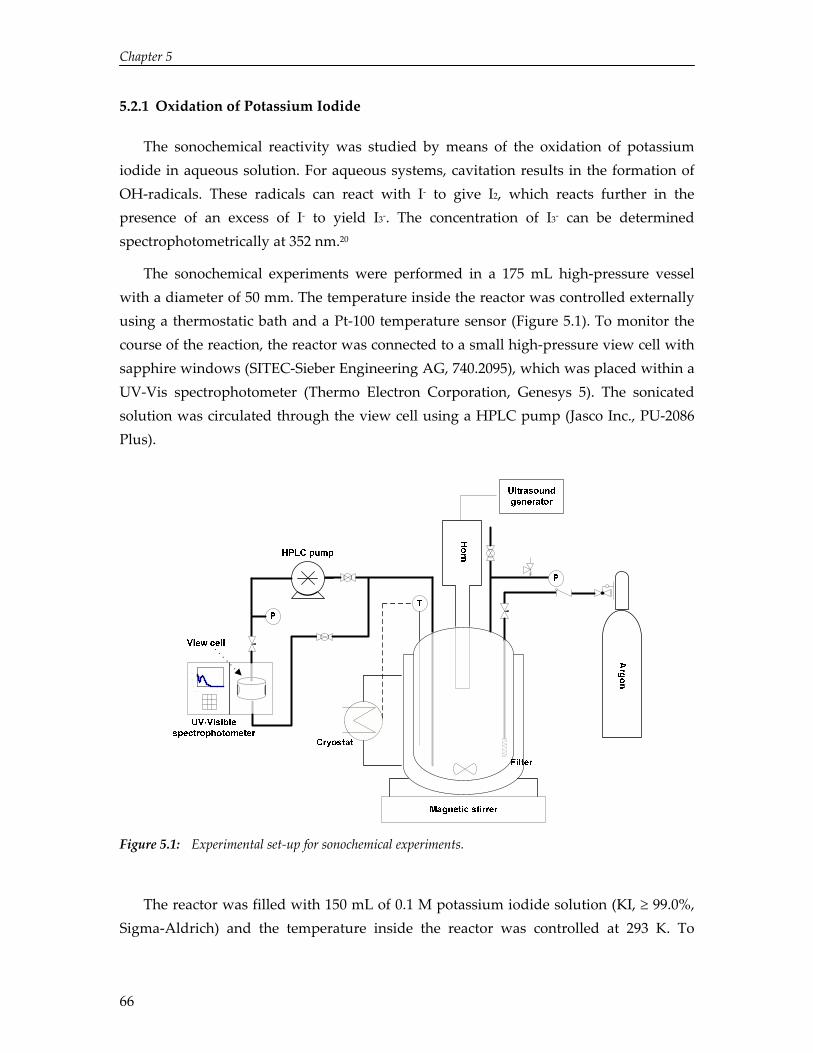
Chapter 5
66
5.2.1 Oxidation of Potassium Iodide
The sonochemical reactivity was studied by means of the oxidation of potassium iodide in aqueous solution. For aqueous systems, cavitation results in the formation of OH‐radicals. These radicals can react with I‐ to give I2, which reacts further in the presence of an excess of I‐ to yield I3‐. The concentration of I3‐ can be determined spectrophotometrically at 352 nm.20
The sonochemical experiments were performed in a 175 mL high‐pressure vessel with a diameter of 50 mm. The temperature inside the reactor was controlled externally using a thermostatic bath and a Pt‐100 temperature sensor (Figure 5.1). To monitor the course of the reaction, the reactor was connected to a small high‐pressure view cell with sapphire windows (SITEC‐Sieber Engineering AG, 740.2095), which was placed within a UV‐Vis spectrophotometer (Thermo Electron Corporation, Genesys 5). The sonicated solution was circulated through the view cell using a HPLC pump (Jasco Inc., PU‐2086 Plus).
0
0 .1
0 .2
0 .3
3 0 0 5 0 0
Figure 5.1: Experimental set‐up for sonochemical experiments.
The reactor was filled with 150 mL of 0.1 M potassium iodide solution (KI, ≥ 99.0%, Sigma‐Aldrich) and the temperature inside the reactor was controlled at 293 K. To
Pressure‐Induced Reduction of Shielding for Improving Sonochemical Activity
saturate the solution with argon and to remove all air present, argon was bubbled through the solution for at least half an hour prior to each experiment under vigorous stirring. Subsequently, the pressure was set to the desired value using argon. Ultrasound was applied to the solution for 4 minutes and after each cycle, the iodine concentration was measured spectrophotometrically (λmax = 352 nm). Although the acoustic intensities were high and the reaction volume relatively small, the temperature in the reactor was maintained at 20 ± 5 °C during sonication.
5.2.2 Calorimetric Measurements
The calorimetric measurements were performed in a commercially available 1.8 L high‐pressure reaction calorimeter RC1e (Mettler‐Toledo GmbH, HP60).21 This set‐up allows online monitoring of the reactor and jacket temperature during sonication, from which the heat flow through the reactor wall is calculated. This heat flow corresponds to the acoustic energy supplied to the liquid, assuming that all ultrasonic energy is converted into heat. It has been reported that the relation between electrical input and calorimetrically determined acoustic energy is relatively insensitive to vessel geometry, provided that the horn is fixed in a similar manner.22 Accordingly, this set‐up can be used to estimate the energy efficiency of the sonication system and provide information on the occurrence of decoupling losses.
The reactor was filled with 1.3 L water and was pressurized while stirring. The reactor was operated in the isothermal mode during an experiment. For each measurement, the ultrasonic generator was set at a specified electrical power input for 15 minutes. From this, the average acoustic power was determined.
5.2.3 Bubble Cloud Visualization and Sound Attenuation Measurements
The visual observations and the sound attenuation measurements were performed in a thermostated 300 mL high‐pressure view cell (Figure 5.2). To visualize the bubble cloud at the sonication tip, the reactor contents was illuminated from the bottom using a 200 mJ per pulse Nd:YAG laser system (Spectra‐Physics Quanta ray, GCR 150). The scattered light was recorded with a high frame rate CCD camera (Kodak, MEGAPLUS ES 1.0) and magnifying optics. The camera was positioned to capture the plane illuminated by the laser sheet, which was placed in line with the ultrasound horn. The images were acquired with Video Savant software and the analysis was performed using mathematical software (Mathematica, Wolfram Research Inc.). For the attenuation
67

Chapter 5
measurements, a microphone was used consisting of a lead zirconium titanate crystal embedded in polyurethane rubber to match it acoustically to water. The microphone was positioned 10 mm below the tip of the horn and at a radial distance of 10 mm from the symmetry axis of the horn. The signal was acquired with a 100 MHz, 8‐bit analog‐to‐digital converter (National Instruments, NI PCI‐5112). In LabVIEW, this digital signal was analyzed using Fast Fourier Transformation algorithms.
Nd:YAG laser
C
Lens
Mirror
P
A/D convertor
Ultrasoundgenerator
Microphone
CryostatCamera
Illuminated bubbles
Figure 5.2: Experimental set‐up for bubble cloud visualization and sound attenuation measurements.
The reactor was filled with 250 mL of water and pressurized with argon. The images and microphone signals were collected simultaneously.
5.3 Results and Discussion
First, the results obtained for the measurements with varying acoustic intensity are presented and discussed. Following this, the effect of hydrostatic pressure on bubble cloud volume, sound attenuation and sonochemical reactivity is described.
68
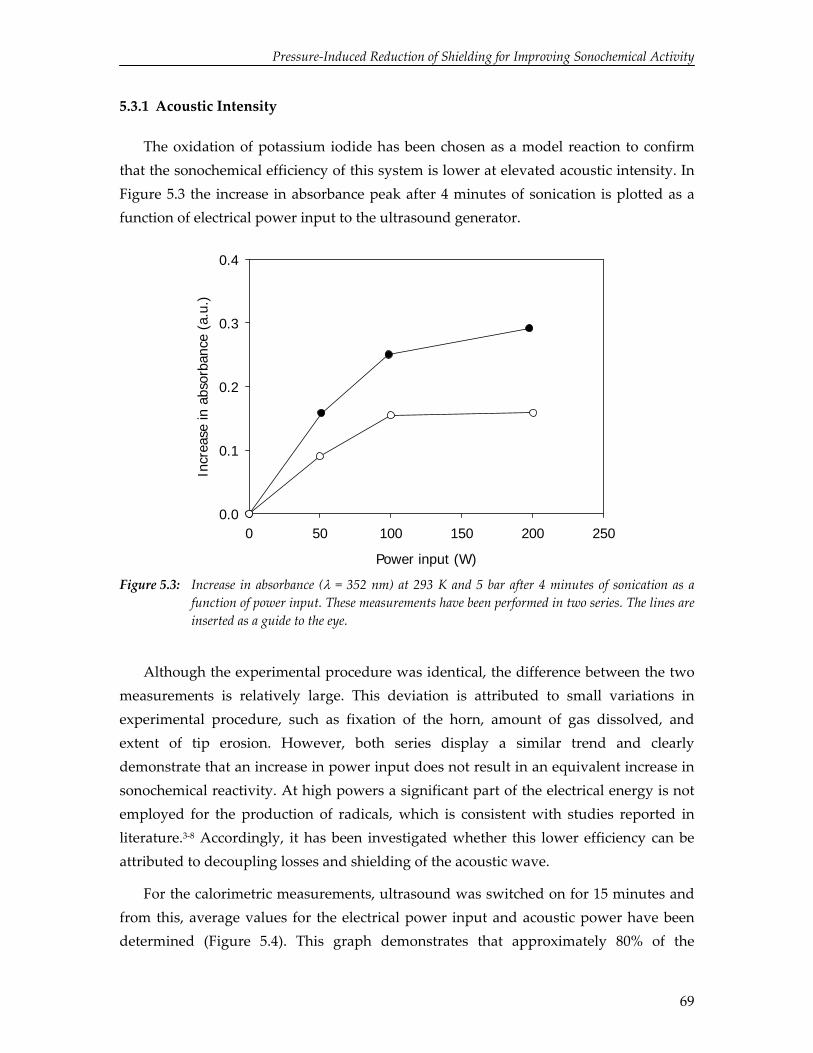
Pressure‐Induced Reduction of Shielding for Improving Sonochemical Activity
5.3.1 Acoustic Intensity
Power input (W)
0 50 100 150 200 250
Incr
ease
in a
bsor
banc
e (a
.u.)
0.0
0.1
0.2
0.3
0.4
The oxidation of potassium iodide has been chosen as a model reaction to confirm that the sonochemical efficiency of this system is lower at elevated acoustic intensity. In Figure 5.3 the increase in absorbance peak after 4 minutes of sonication is plotted as a function of electrical power input to the ultrasound generator.
Figure 5.3: Increase in absorbance (λ = 352 nm) at 293 K and 5 bar after 4 minutes of sonication as a function of power input. These measurements have been performed in two series. The lines are inserted as a guide to the eye.
Although the experimental procedure was identical, the difference between the two measurements is relatively large. This deviation is attributed to small variations in experimental procedure, such as fixation of the horn, amount of gas dissolved, and extent of tip erosion. However, both series display a similar trend and clearly demonstrate that an increase in power input does not result in an equivalent increase in sonochemical reactivity. At high powers a significant part of the electrical energy is not employed for the production of radicals, which is consistent with studies reported in literature.3‐8 Accordingly, it has been investigated whether this lower efficiency can be attributed to decoupling losses and shielding of the acoustic wave.
For the calorimetric measurements, ultrasound was switched on for 15 minutes and from this, average values for the electrical power input and acoustic power have been determined (Figure 5.4). This graph demonstrates that approximately 80% of the
69
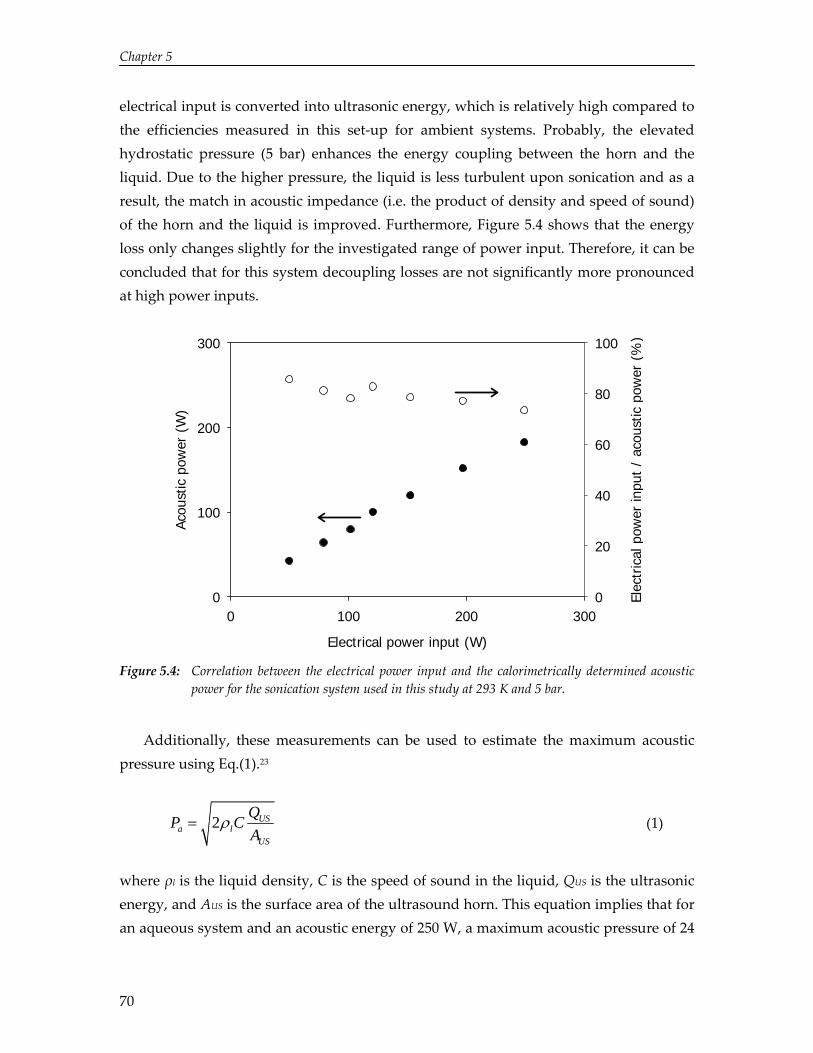
Chapter 5
electrical input is converted into ultrasonic energy, which is relatively high compared to the efficiencies measured in this set‐up for ambient systems. Probably, the elevated hydrostatic pressure (5 bar) enhances the energy coupling between the horn and the liquid. Due to the higher pressure, the liquid is less turbulent upon sonication and as a result, the match in acoustic impedance (i.e. the product of density and speed of sound) of the horn and the liquid is improved. Furthermore, Figure 5.4 shows that the energy loss only changes slightly for the investigated range of power input. Therefore, it can be concluded that for this system decoupling losses are not significantly more pronounced at high power inputs.
Electrical power input (W)
0 100 200 300
Acou
stic
pow
er (
W)
0
100
200
300
Elec
tric
al p
ower
inpu
t /
acou
stic
pow
er (
%)
0
20
40
60
80
100
Figure 5.4: Correlation between the electrical power input and the calorimetrically determined acoustic power for the sonication system used in this study at 293 K and 5 bar.
Additionally, these measurements can be used to estimate the maximum acoustic pressure using Eq.(1).23
2 USa l
US
QP CA
ρ= (1)
where ρl is the liquid density, C is the speed of sound in the liquid, QUS is the ultrasonic energy, and AUS is the surface area of the ultrasound horn. This equation implies that for an aqueous system and an acoustic energy of 250 W, a maximum acoustic pressure of 24
70
Pressure‐Induced Reduction of Shielding for Improving Sonochemical Activity
bar is attained at the sonication tip. Attenuation of the wave causes the acoustic pressure to decrease rapidly with increasing distance from the radiation source and the rate of attenuation strongly depends on the medium through which the wave travels. For intense sound fields a large cloud of gas and vapor bubbles is formed close to the sonication tip and the presence of this void fraction significantly enhances sound absorption, which can be explained using Eq.(2).24
0 exp( 2 )sI I dα= − 2 2
3
83s
l
fC
μπαρ
= (2)
I represents the acoustic intensity at a distance d from the radiation source with intensity I0. The value of the acoustic absorption coefficient, αs, depends on the medium through which the wave travels. The presence of a void fraction lowers the density and speed of sound of the medium. As a consequence, the absorption coefficient increases and the intensity of the sound wave levels off faster. Additionally, the bubbles perform volume oscillations and scatter the sound wave, which leads to a loss and redistribution of the acoustic wave.
The volume of the bubble cloud and the effect hereof on the sound field intensity has also been studied as a function of power input. In order to obtain a representative image of the bubble cloud, approximately 350 images have been captured during each measurement. These images have been digitized and averaged using Mathematica software. Subsequently, a background image has been subtracted from this average image. To enable a quantitative comparison, an average white value has been calculated for the resulting image. Since the bubbles act as light scattering sources, the white value of the resulting image represents a measure for the void fraction. Based on the white value, however, no distinction can be made between the size of the bubbles and the amount of bubbles. The calculated white values have been compared for the various power inputs (Figure 5.5). Figure 5.5 shows that an increase in power input results in a more than proportional increase in the volume of the bubble cloud as determined from the projected area. It is assumed that the majority of bubbles arises from local pressure and temperature fluctuations. At higher powers these fluctuations are more pronounced and accordingly, the bubble cloud volume increases. Microphone measurements have been performed to investigate whether sound attenuation increases with an increase in bubble cloud volume.
In Figure 5.6 the intensity level of the fundamental frequency component is plotted as a function of the electrical power input. Although the sound level increases with
71
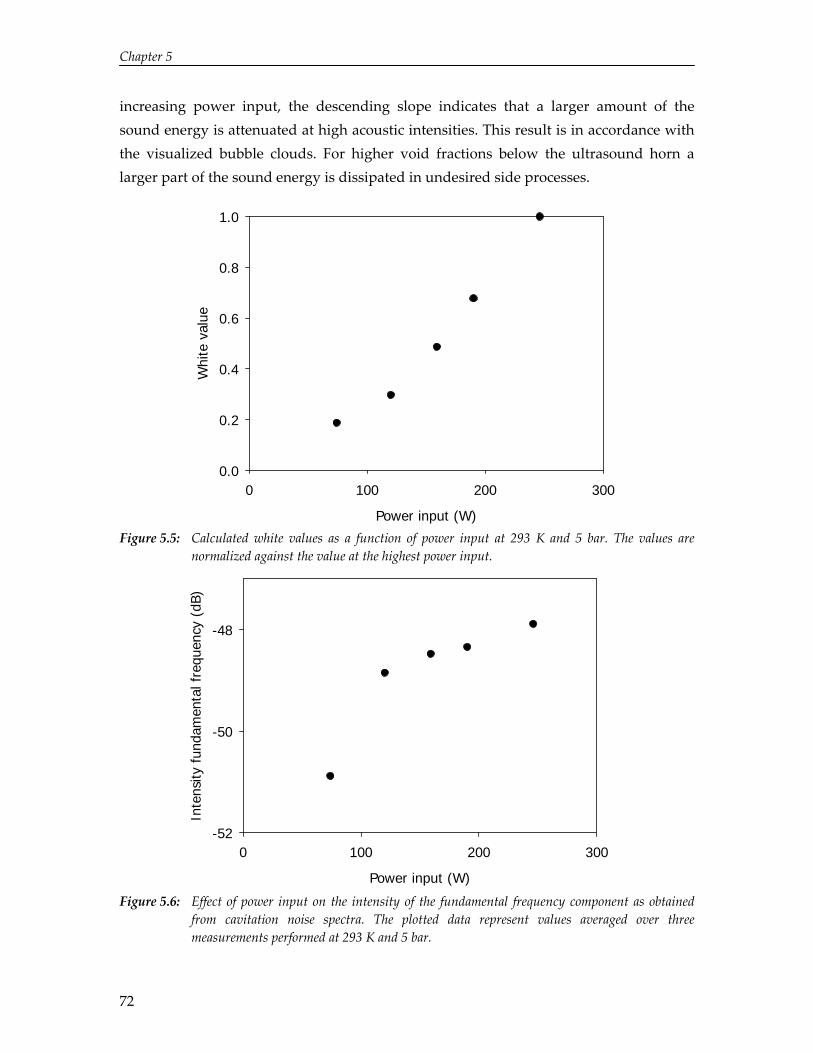
Chapter 5
Power input (W)
0 100 200 300
Whi
te v
alue
0.0
0.2
0.4
0.6
0.8
1.0
increasing power input, the descending slope indicates that a larger amount of the sound energy is attenuated at high acoustic intensities. This result is in accordance with the visualized bubble clouds. For higher void fractions below the ultrasound horn a larger part of the sound energy is dissipated in undesired side processes.
Power input (W)
0 100 200 300
Inte
nsity
fun
dam
enta
l fre
quen
cy (
dB)
-52
-50
-48
Figure 5.5: Calculated white values as a function of power input at 293 K and 5 bar. The values are normalized against the value at the highest power input.
Figure 5.6: Effect of power input on the intensity of the fundamental frequency component as obtained
from cavitation noise spectra. The plotted data represent values averaged over three measurements performed at 293 K and 5 bar.
72

Pressure‐Induced Reduction of Shielding for Improving Sonochemical Activity
In summary, these measurements have demonstrated that the lower sonochemical efficiency at elevated acoustic intensity predominantly arises from shielding of the acoustic wave. In the following section it will be explored whether an increase in hydrostatic pressure leads to a reduction in shielding and hence, a higher sonochemical reactivity.
5.3.2 Hydrostatic Pressure
Based on the acoustic intensity measurements, no changes in decoupling losses are expected for possible variations in bubble cloud volume due to changes in static pressure. However, hydrostatic pressure could also influence the energy coupling between the horn and the liquid and therefore, the effect of hydrostatic pressure on the acoustic power output has been determined calorimetrically (Figure 5.7). At higher pressures the energy coupling between the horn and the liquid seems more efficient, due to the previously discussed decrease in liquid turbulence. Since the aim of this study is to investigate the effect of hydrostatic pressure on sonochemical efficiency, this improved matching has not been corrected for and all measurements have been performed for an electrical power input of 100 W.
Col 1 vs Col 3 Col 1 vs Col 4
Hydrostatic pressure (bar)
2 4 6 8
Acou
stic
pow
er (
W)
0
20
40
60
80
100
Figure 5.7: Effect of hydrostatic pressure on the calorimetrically determined acoustic power for an
electrical power input of approximately 100 W.
73
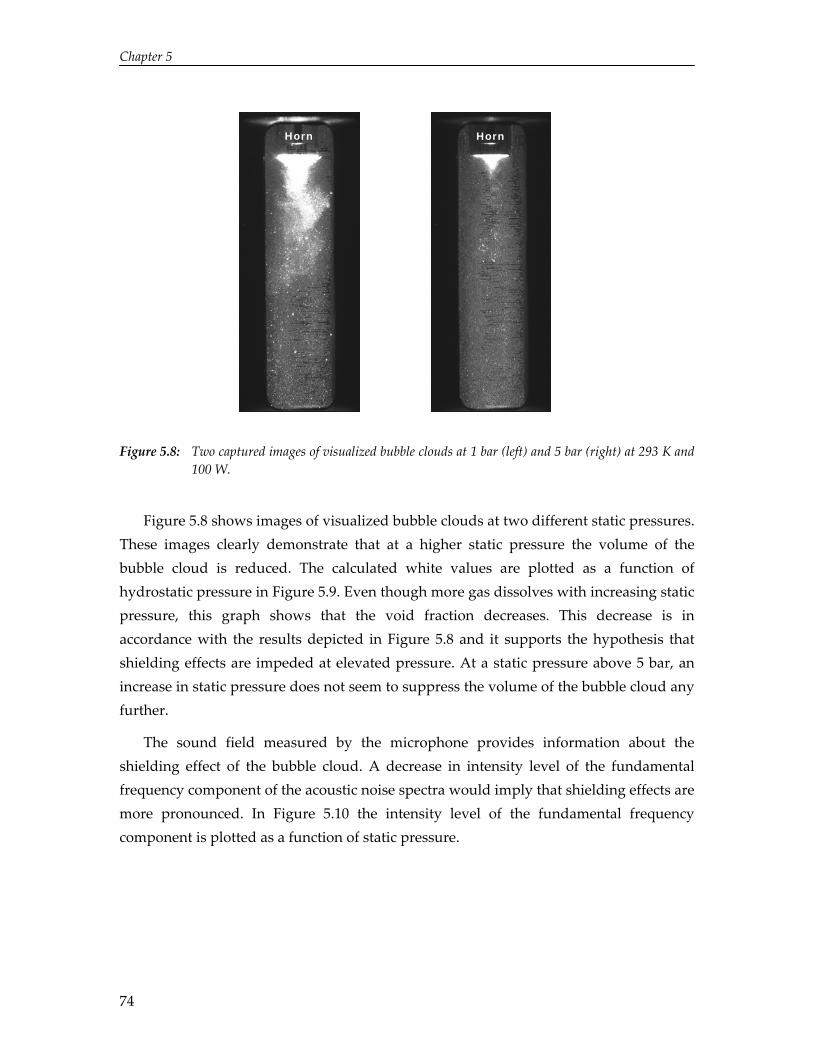
Chapter 5
Horn Horn
Figure 5.8: Two captured images of visualized bubble clouds at 1 bar (left) and 5 bar (right) at 293 K and
100 W.
Figure 5.8 shows images of visualized bubble clouds at two different static pressures. These images clearly demonstrate that at a higher static pressure the volume of the bubble cloud is reduced. The calculated white values are plotted as a function of hydrostatic pressure in Figure 5.9. Even though more gas dissolves with increasing static pressure, this graph shows that the void fraction decreases. This decrease is in accordance with the results depicted in Figure 5.8 and it supports the hypothesis that shielding effects are impeded at elevated pressure. At a static pressure above 5 bar, an increase in static pressure does not seem to suppress the volume of the bubble cloud any further.
The sound field measured by the microphone provides information about the shielding effect of the bubble cloud. A decrease in intensity level of the fundamental frequency component of the acoustic noise spectra would imply that shielding effects are more pronounced. In Figure 5.10 the intensity level of the fundamental frequency component is plotted as a function of static pressure.
74
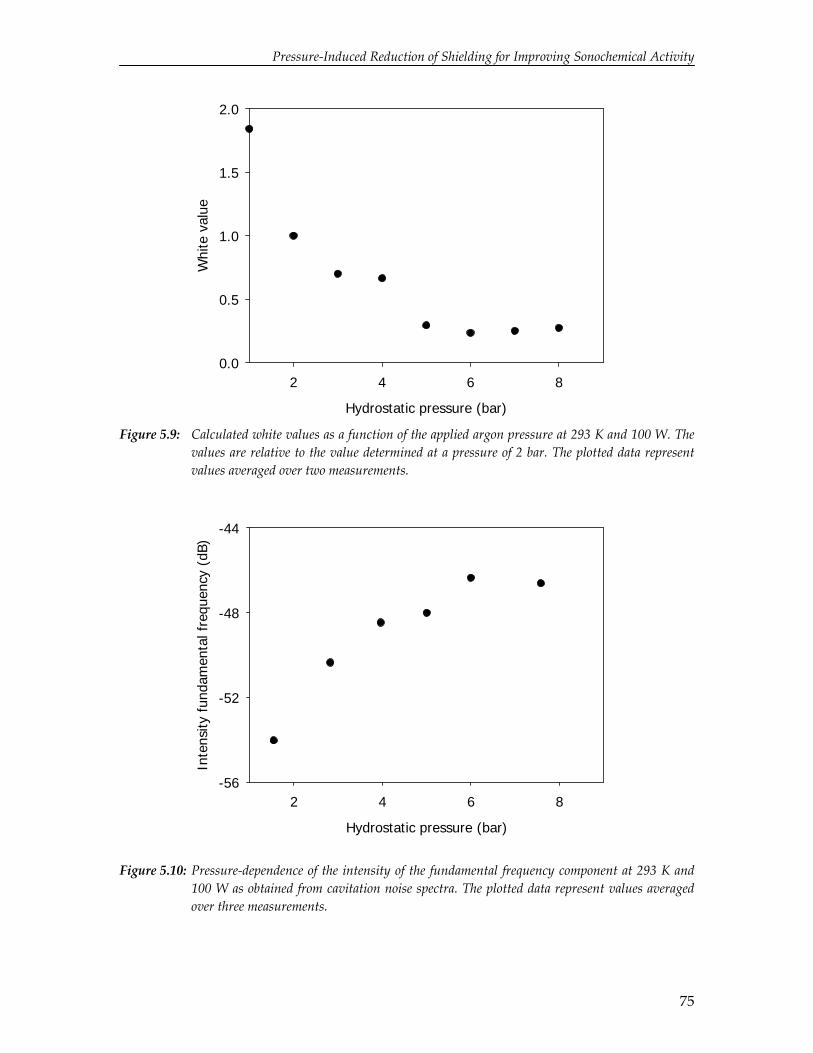
Pressure‐Induced Reduction of Shielding for Improving Sonochemical Activity
Hydrostatic pressure (bar)
2 4 6 8
Whi
te v
alue
0.0
0.5
1.0
1.5
2.0
Figure 5.9: Calculated white values as a function of the applied argon pressure at 293 K and 100 W. The
values are relative to the value determined at a pressure of 2 bar. The plotted data represent values averaged over two measurements.
Hydrostatic pressure (bar)
2 4 6 8
Inte
nsity
fun
dam
enta
l fre
quen
cy (
dB)
-56
-52
-48
-44
Figure 5.10: Pressure‐dependence of the intensity of the fundamental frequency component at 293 K and 100 W as obtained from cavitation noise spectra. The plotted data represent values averaged over three measurements.
75
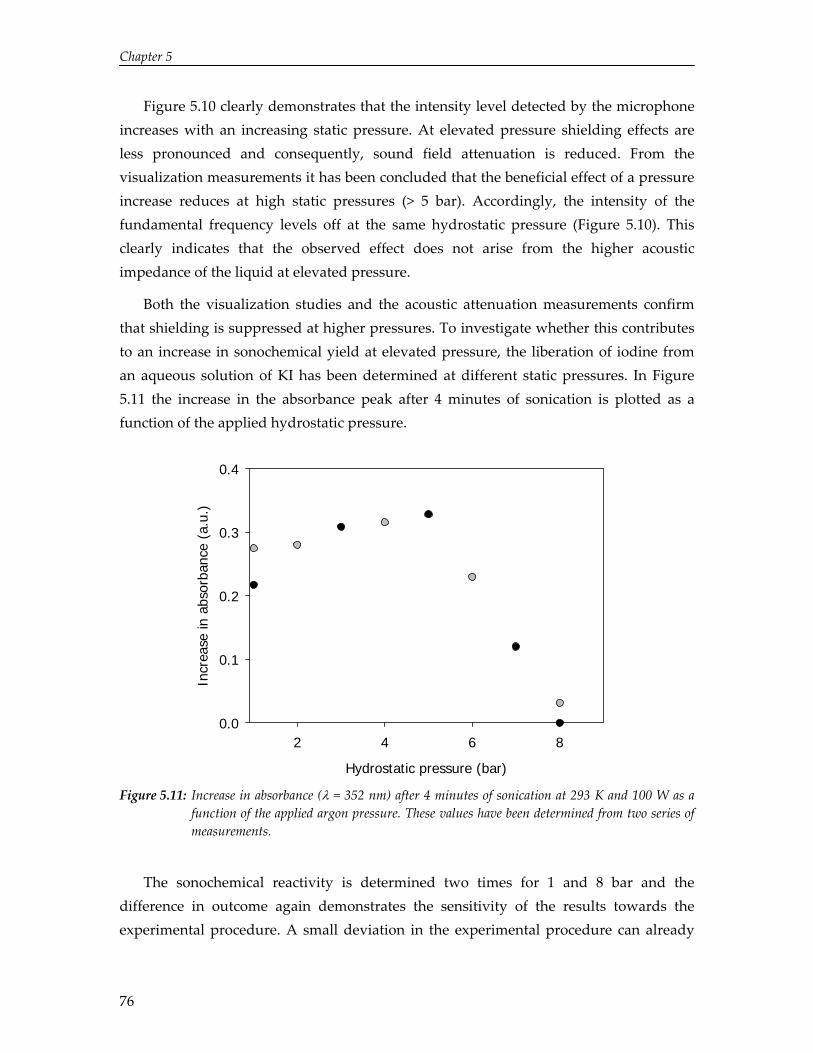
Chapter 5
Figure 5.10 clearly demonstrates that the intensity level detected by the microphone increases with an increasing static pressure. At elevated pressure shielding effects are less pronounced and consequently, sound field attenuation is reduced. From the visualization measurements it has been concluded that the beneficial effect of a pressure increase reduces at high static pressures (> 5 bar). Accordingly, the intensity of the fundamental frequency levels off at the same hydrostatic pressure (Figure 5.10). This clearly indicates that the observed effect does not arise from the higher acoustic impedance of the liquid at elevated pressure.
Both the visualization studies and the acoustic attenuation measurements confirm that shielding is suppressed at higher pressures. To investigate whether this contributes to an increase in sonochemical yield at elevated pressure, the liberation of iodine from an aqueous solution of KI has been determined at different static pressures. In Figure 5.11 the increase in the absorbance peak after 4 minutes of sonication is plotted as a function of the applied hydrostatic pressure.
Hydrostatic pressure (bar)
2 4 6 8
Incr
ease
in a
bsor
banc
e (a
.u.)
0.0
0.1
0.2
0.3
0.4
Figure 5.11: Increase in absorbance (λ = 352 nm) after 4 minutes of sonication at 293 K and 100 W as a function of the applied argon pressure. These values have been determined from two series of measurements.
The sonochemical reactivity is determined two times for 1 and 8 bar and the difference in outcome again demonstrates the sensitivity of the results towards the experimental procedure. A small deviation in the experimental procedure can already
76

Pressure‐Induced Reduction of Shielding for Improving Sonochemical Activity
have a major influence on the observed effects. Consequently, the effect of pressure on sonochemical reactivity has been determined by performing two series of measurements in sequential order of increasing hydrostatic pressure.
For low hydrostatic pressures an increase in static pressure leads to a small increase in absorbance. This effect could arise from two counteracting, pressure‐dependent phenomena. First, cavitation dynamic models predict that an increase in pressure implies a decrease in chemical reactivity. At elevated hydrostatic pressure, the gas pressure inside the cavity is higher to prevent it from dissolving. For a similar expansion the decrease in gas pressure upon expansion is larger at elevated pressure and a higher acoustic pressure is required to counteract this decrease. Accordingly, fewer cavities will undergo expansion for a similar acoustic intensity at high pressures and the sonochemical effect will reduce. Secondly, the visualization studies have demonstrated that the volume of the bubble cloud is reduced at elevated pressure. Although this implies that fewer cavitation nuclei are present, it appears that this suppression does not lower the reactivity. The majority of the bubbles present in the bubble cloud is relatively large (enhanced by coalescence effects) and therefore, less efficient towards cavitation.25 However, the sound attenuation measurements have shown that these bubbles strongly attenuate the sound field. Due to a reduction in shielding, the sound field is more effective at elevated pressure and radical formation increases. Furthermore, the enhanced energy coupling between horn and liquid, as determined from calorimetric measurements, contributes to this increase in reactivity. Since the liberation of iodine increases only slightly with increasing pressure, the decrease in reactivity predicted from the cavitation dynamics model seems to partially counteract these effects. At pressures above 5 bar, a further increase in static pressure does not have an additional advantage with regard to shielding effects. Accordingly, the effect resulting from the less efficient cavitation dynamics prevails and the sonochemical reaction rate decreases substantially.
5.4 Conclusions
This study has confirmed that the low sonochemical efficiency at elevated acoustic intensities can be attributed to shielding of the acoustic wave. An increasing power input results in a more than proportional increase in the volume of the bubble cloud, leading to a less efficient sound field. Conversely, calorimetric measurements have demonstrated that for this system the energy coupling between the transducer and the medium is only slightly affected by the void fraction. Due to shielding, a large amount
77
Chapter 5
of the supplied energy is wasted and experimentally determined reaction rates for the oxidation of potassium iodide increase relatively little for a more intense sound field. Visualization studies and sound attenuation measurements have verified that shielding effects can be reduced by increasing hydrostatic pressure. Together with the enhanced energy coupling, the reduction in shielding leads to an increase in yield for the oxidation of potassium iodide with increasing hydrostatic pressure. On the contrary, the corresponding cavitation dynamics are less efficient at elevated pressure. Above a certain threshold pressure, the latter effect prevails and the reaction rate decreases substantially.
References
1 K. S. Suslick, Sonochemistry, Kirk‐Othmer Encyclopedia of Chemical Technology 4th Ed. (J. Wiley & Sons, New York, 1998).
2 L. H. Thomson; L. K. Doraiswamy, Ind. Eng. Chem. Res. 38, 1215 (1999). 3 N. Ratoarinoro; F. Contamine; A. M. Wilhelm; J. Berlan; H. Delmas, Ultrason. Sonochem. 2,
S43 (1995). 4 M. H. Entezari; P. Kruus, Ultrason. Sonochem. 3, 19 (1996). 5 M. H. Entezari; P. Kruus; R. Otson, Ultrason. Sonochem. 4, 49 (1997). 6 M. Sivakumar; A. Gedanken; Ultrason. Sonochem. 11, 373 (2004). 7 S. Findik; G. Gündüz; E. Gündüz, Ultrason. Sonochem. 13, 203 (2006). 8 M. H. Lim; S. H. Kim; Y. K. Kim; J. Khim, Ultrason. Sonochem. 14, 93 (2007). 9 Z‐L. Wu; J. Lifka; B. Ondruschka, Chem. Eng. Technol. 29, 610 (2006). 10 M. P. Brenner; S. Hilgenfeldt; D. Lohse, Rev. of Mod. Phys. 74, 425 (2002). 11 H. N. McMurray; B. P. Wilson, J. Phys. Chem. A 103, 3955 (1999). 12 A. Moussatov; C. Granger; B. Dubus, Ultrason. Sonochem. 10, 191 (2003). 13 K. W. Commander; A. Prosperetti, J. Acoust. Soc. Am. 85, 732 (1988). 14 S. Dähnke; F. J. Keil, Ind. Eng. Chem. Res. 37, 848 (1998). 15 T. J. Mason, Practical Sonochemistry: User’s Guide to Applications in Chemistry and Chemical
Engineering (Ellis Horwood, West Sussex, 1991). 16 D. L. Goldfarb; H. R. Corti; F. Marken; R. G. Compton, J. Phys. Chem. A 102, 8888 (1998). 17 A. Henglein; M. Gutiérrez, J. Phys. Chem. 97, 158 (1993). 18 E. J. Hart; A. Henglein, J. Phys. Chem. 89, 4342 (1985). 19 T. Tuziuti; K. Yasui; Y. Iida; M. Sivakumar, J. Phys. Chem. A 108, 9011 (2004). 20 S. Koda; T. Kimura; T. Kondo; H. Mitome, Ultrason. Sonochem. 10, 149 (2003). 21 M. W. A. Kuijpers; M. F. Kemmere; J. T. F. Keurentjes, Ultrasonics 40, 675 (2002). 22 T. Kimura; T. Sakamoto; J‐M. Leveque; H. Sohmiya; M. Fujita; S. Ikeda; T. Ando, Ultrason.
Sonochem. 3, 157 (1996). 23 T.G. Leighton, The Acoustic Bubble (Academic Press, London, 1994). 24 V. S. Moholkar; S. P. Sable; A. B. Pandit, AIChE J. 46, 685 (2000). 25 P. R. Gogate; A. B. Pandit, AIChE J. 46, 372 (2000).
78
6
Inhibition of Non‐Linear Acoustic Cavitation Dynamics in Liquid CO2
Abstract
Ultrasound‐induced cavitation dynamics in liquid carbon dioxide (CO2) have been studied using a comprehensible single‐cavity dynamics model. First, numerical simulations are presented for an argon cavity in water to assist in the interpretation of the results for CO2. For aqueous systems, inertia effects and force accumulation lead to a non‐linear radial motion, resulting in an almost adiabatic compression of the cavity interior. The simulations for liquid CO2 suggest that transport limitations impede non‐linear cavitation dynamics and the corresponding temperature rise. Consequently, in liquid CO2 the ultrasound‐induced formation of radicals appears improbable.
M. M. van Iersel; J. Cornel; N. E. Benes; J. T. F. Keurentjes, J. Chem. Phys. 126, 064508 (2007).
79
Chapter 6
6.1 Introduction
Irradiation of a liquid with high‐intensity ultrasound is known to enhance or alter a wide variety of chemical reactions.1,2 It has been reported that ultrasound successfully increases conversion, changes reaction pathways, initiates reactions, and accelerates mixing.3 These physical and chemical effects of ultrasound predominantly arise from acoustic cavitation. Acoustic cavitation is the growth and subsequent contraction of a cavity in a liquid induced by pressure variations from a sound wave. During the contraction of the cavity, its contents can be almost adiabatically heated, leading to hot‐spots in the liquid in which temperatures of ∼5000 K and pressures of several hundreds of bars can be reached.1 These conditions enable demanding (sono)chemistry, while the macroscopically observable properties of the system remain unchanged.
Research in sonochemistry has evolved over the last decades. Up to now the focus has been on aqueous systems, e.g. for waste water treatment purposes.4 In this work, acoustic cavitation in liquid CO2 is investigated. In addition to its chemical inertness, CO2 has a relatively high gas solubility.5 This implies an increase in the number of cavitation nuclei and hence, in the number of hot‐spots. Furthermore, the physicochemical properties of CO2 are relatively easily tuneable with small variations in pressure and temperature. In view of these inherent advantages, Kuijpers et al. experimentally investigated acoustic cavitation in liquid CO2.6 Since then, several other experimental studies of acoustic cavitation in high‐pressure CO2 have been conducted, in which ultrasound enhanced mass transfer.7,8 To our knowledge, however, cavitation‐induced radicalization has not unambiguously been demonstrated in these types of systems. Accordingly, preliminary experiments have been performed in a high‐pressure ultrasound reactor to study the radicalization of methane in liquid CO2. Although the experimental conditions have been varied extensively, dissociation of methane could not be confirmed by GC‐analysis of the reaction mixture. It is unclear whether this indicates milder hot‐spot conditions in liquid CO2 compared to aqueous systems. Numerical modeling studies, in which the governing processes are captured, can reveal whether ‘soft’ cavitation is inherent for liquid CO2. Several models have been proposed in literature to describe cavitation dynamics.9,10,11 Starting from these models, a comprehensible single‐cavity dynamics model has been developed and applied to study acoustic cavitation in liquid CO2.
80
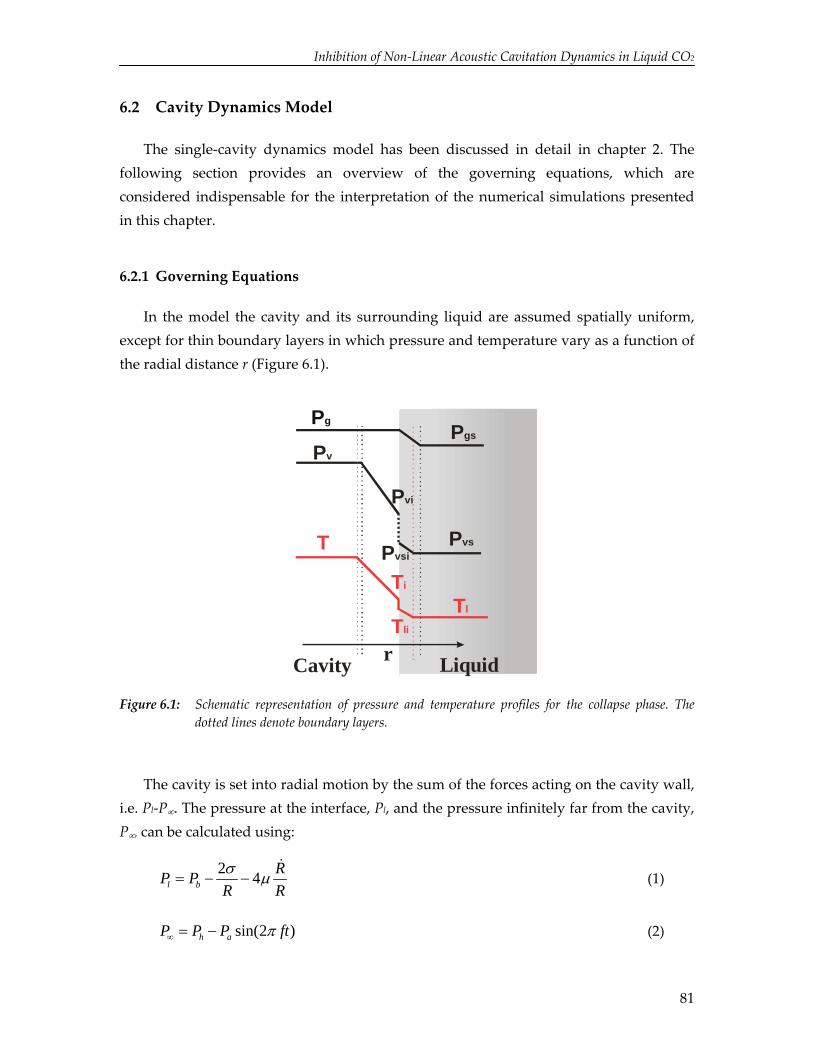
Inhibition of Non‐Linear Acoustic Cavitation Dynamics in Liquid CO2
6.2 Cavity Dynamics Model
The single‐cavity dynamics model has been discussed in detail in chapter 2. The following section provides an overview of the governing equations, which are considered indispensable for the interpretation of the numerical simulations presented in this chapter.
6.2.1 Governing Equations
In the model the cavity and its surrounding liquid are assumed spatially uniform, except for thin boundary layers in which pressure and temperature vary as a function of the radial distance r (Figure 6.1).
Pv
Pvi
Pg
T
Ti
Tl
r LiquidCavity
PvsiPvs
Tli
Pgs
Figure 6.1: Schematic representation of pressure and temperature profiles for the collapse phase. The
dotted lines denote boundary layers.
The cavity is set into radial motion by the sum of the forces acting on the cavity wall, i.e. Pl‐P∞. The pressure at the interface, Pl, and the pressure infinitely far from the cavity, P∞, can be calculated using:
2 4l bRP P
R Rσ μ= − −
& (1)
sin(2 )h aP P P ftπ∞ = − (2)
81
Chapter 6
The relation between these forces and the radial dynamics are modeled using the Keller‐Miksis equation, which also takes into account the effect of sound radiation and liquid compressibility:12,13
( )23 21 1 1 sin(2 )2 3l l b h a b 4R R R RRR R P P P ft P
C C C C Rσ R
Rρ ρ π⎛ ⎞ ⎛ ⎞ ⎛ ⎞− + − = + − + + − −⎜ ⎟ ⎜ ⎟ ⎜ ⎟
⎝ ⎠ ⎝ ⎠ ⎝ ⎠
& & &&& & & μ
& (3)
The cavity interior is filled with both non‐condensable gas and vapor and it evolves continuously during cavity motion. For the flux of gas molecules it is assumed that the transport rate is determined by diffusion in a thin stagnant liquid film surrounding the cavity. Using the Maxwell‐Stefan diffusion model the following expression emerges:14
24
2
l s ig
g s il
D C CN RC CC
πδ
−=
⎛ +⎛ ⎞− ⎜ ⎟⎜ ⎟⎝ ⎠⎝ ⎠
&⎞ (4)
The gas concentrations are calculated from Henry’s law and the corresponding partial gas pressures. In the description for the vapor flux non‐equilibrium phase transition across the interface as well as diffusion inside the cavity are taken into account by means of a continuity equation:
2 24 42
2
M
v vsi vi b vi vv t
m vi vg v li ib
M P P D P PN R R CP PR M T T P
α
π πδπ
⎡ ⎤ −= − =⎢ ⎥
⎛ +⎛ ⎞⎢ ⎥⎣ ⎦ − ⎜ ⎟⎜ ⎟⎝ ⎠⎝ ⎠
&⎞ (5)
The first expression corresponds to non‐equilibrium evaporation and condensation and it has been derived from the Hertz‐Knudsen‐Langmuir equation.9,15,16 Similar to the description for gas diffusion, the Maxwell‐Stefan model has been applied to describe the rate of vapor diffusion. The temperatures inside the cavity, at the interface and in the liquid boundary layer are calculated with an energy balance:17
d d( ) (d db v v g g g pg v pvQ PV h N h N N C T N Ct t
− = − − + +& & & )T (6)
It is assumed that heat conduction is the prevailing mechanism for heat transfer and that a temperature jump exists at the interface.18 Taking these effects and phase transition into account, the following continuity equation for the energy fluxes across the interface arises:
82
Inhibition of Non‐Linear Acoustic Cavitation Dynamics in Liquid CO2
2 24 4 ( )(l li il b v vap v pv g pg
l b
T T T T )i liR R N H N C N C Tπ κ π κδ δ− −
= + Δ + +& & & T− (7)
The assumptions used for calculating and estimating the initial conditions for these equations are similar to those reported in chapter 2.
6.2.2 Physical Parameters
Similar values and correlations for the properties of water and argon are used as those described in chapter 2. For liquefied CO2, the properties ρl, μ, C, Cpl, Pvs, and κl are obtained from [19]. The argon diffusion coefficient in CO2, Dl, is estimated from tracer diffusivity date and it is set to 2∙10‐8 m2/s.20 Temperature‐dependent correlations for the interface properties ΔHvap, σ, and Pvsi, are taken from [21]. The Van der Waals constants and the Lennard‐Jones parameters of CO2 are obtained from [22] and [23], respectively. The temperature‐dependent expressions for the thermal conductivity and heat capacity of CO2 vapor are acquired from [21]. The gas concentrations are calculated from vapor‐liquid equilibrium data, assuming a constant total molar concentration equal to the molar concentration of CO2.24 The saturation concentration of argon at a given hydrostatic pressure is determined using reported bubble‐point pressures. For the interface concentration, a second‐order polynomial is derived from the presented data, which describes the partial argon pressure as a function of liquid composition.
6.3 Results and Discussion
First, the model is applied to describe cavitation in water saturated with argon to assist in the interpretation of the results obtained for liquid CO2. Unless stated otherwise, the following base case conditions have been applied for these systems: R0 = 10 μm, f = 20 kHz, αM = 0.4, and αe = 0.6.9,25,26
6.3.1 Cavitation in aqueous systems
The cavity is set into radial motion by the forces acting on its wall. The driving force for motion is the sum of all these forces, i.e. Pl‐P∞. At the onset of the rarefaction phase, the acoustic pressure of the applied sound field causes the driving force to exceed zero, resulting in an expansion of the cavity (Figure 6.2).
83

Chapter 6
Time (μs)
0 10 20 30 40 50
R/R 0
0
1
2
3
4
5
Pres
sure
0A
B
CRadius
Pl - Pinf
a)
Acoustic pressure
Time (μs)
0 10 20 30 40 50
R/R
0
0
4
8
12
16
Pres
sure
0
Radius Pl - Pinf
Acoustic pressure
b)
Figure 6.2: Normalized radius‐time curve, total pressure force (Pl – Pinf), and acoustic pressure for an
argon cavity in water (Ph = 105 N/m2, Tl = 293 K). (a) Pa = 1.2∙105 N/m2 and (b) Pa = 2.0∙105 N/m2.
When the driving force equals zero (Figure 6.2a, point A) the cavity wall stops accelerating and a point of inflection is observed in the radius‐time curve (Point B). Although after this point Pl‐P∞ turns negative, cavity expansion continues for several
84

Inhibition of Non‐Linear Acoustic Cavitation Dynamics in Liquid CO2
microseconds due to inertia effects, until a maximum radius is observed (Point C). Hereafter, the negative value of Pl‐P∞ causes compression of the cavity. The driving force has accumulated from A to C. In addition, gas diffusion into and out of the cavity is relatively slow as compared to the cavity dynamics. Consequently, the pressure inside the large cavity has decreased significantly at C, resulting in a high driving force for compression compared to the driving force observed during expansion. Due to the increase in driving force from A to C and the low internal pressure, the cavity is set into a non‐linear motion and the collapse is relatively fast compared to the expansion. The sharp increase in Pl‐P∞ marks the collapse of the cavity. Subsequently, the cavity oscillates several times until the rarefaction phase of the acoustic field sets in again and a new cavitation cycle starts. During this after‐bounce, the motion of the cavity roughly approaches the resonance or Minnaert frequency.27 Note that the implosion of the cavity can occur before that the applied sound field turns compressive. For higher acoustic pressures, point A moves to the right and liquid inertia effects become more pronounced. Consequently, the onset of collapse is delayed and the implosion can occur during the compression cycle of the sound wave (Figure 6.2b).
In the preceding analysis, the effect of vapor transport on process dynamics has been omitted in the discussion. However, during expansion the vapor pressure inside the cavity decreases below its saturation value and consequently, molecules evaporate from the liquid into the cavity. Conversely, during compression the vapor pressure exceeds its saturation value and hence, condensation will occur at the cavity wall. The importance of vapor transport is demonstrated by numerical simulations for two hypothetical cases: no vapor pressure (Pv = 0), and thermodynamic equilibrium (Pv = Pvs). In addition, more physically realistic simulations have been carried out in which mass transfer limitations are incorporated using the vapor transport continuity equation across the interface as discussed in the previous section (non‐equilibrium). The results are depicted in Figure 6.3. It should be emphasized that for all three simulations the full numerical model has been applied, except for the changes in vapor transport description (Eq. (5)).
First of all, Figure 6.3a shows that the presence of vapor in the cavity results in an expansion to a larger maximum radius. This is due to the additional interior pressure force. During expansion, the evolution of the radius in time is almost similar for the hypothetical case Pv = Pvsat and the non‐equilibrium simulation. Furthermore, the cavity expands isothermally (Figure 6.3b). These observations indicate that the expansion occurs at conditions relatively close to thermodynamic equilibrium.
85
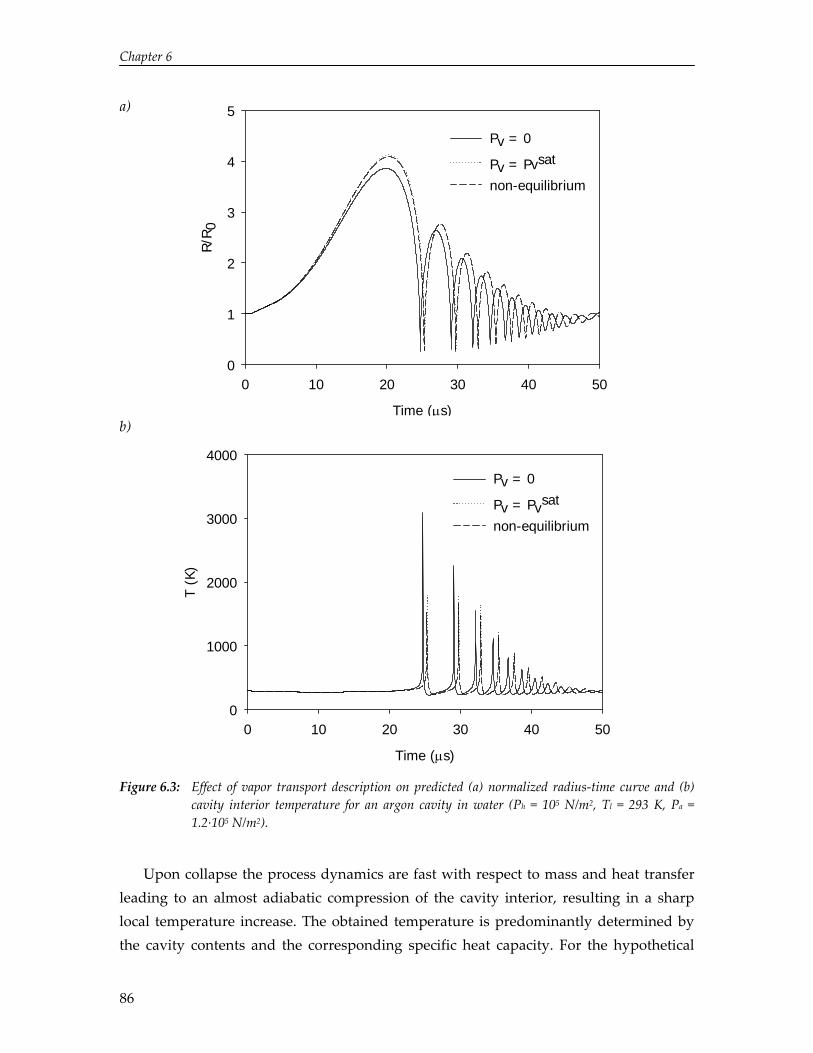
Chapter 6
Time (μs)
0 10 20 30 40 5
a)
0
R/R 0
0
1
2
3
4
5
Pv = 0
Pv = Pvsat
non-equilibrium
b)
Time (μs)
0 10 20 30 40 50
0
1000
4000
Pv = 0
Pv = Pvsat3000 non-equilibrium
T (K
)
2000
Figure 6.3: Effect of vapor transport description on predicted (a) normalized radius‐time curve and (b) cavity interior temperature for an argon cavity in water (Ph = 105 N/m2, Tl = 293 K, Pa = 1.2∙105 N/m2).
Upon collapse the process dynamics are fast with respect to mass and heat transfer leading to an almost adiabatic compression of the cavity interior, resulting in a sharp local temperature increase. The obtained temperature is predominantly determined by the cavity contents and the corresponding specific heat capacity. For the hypothetical
86
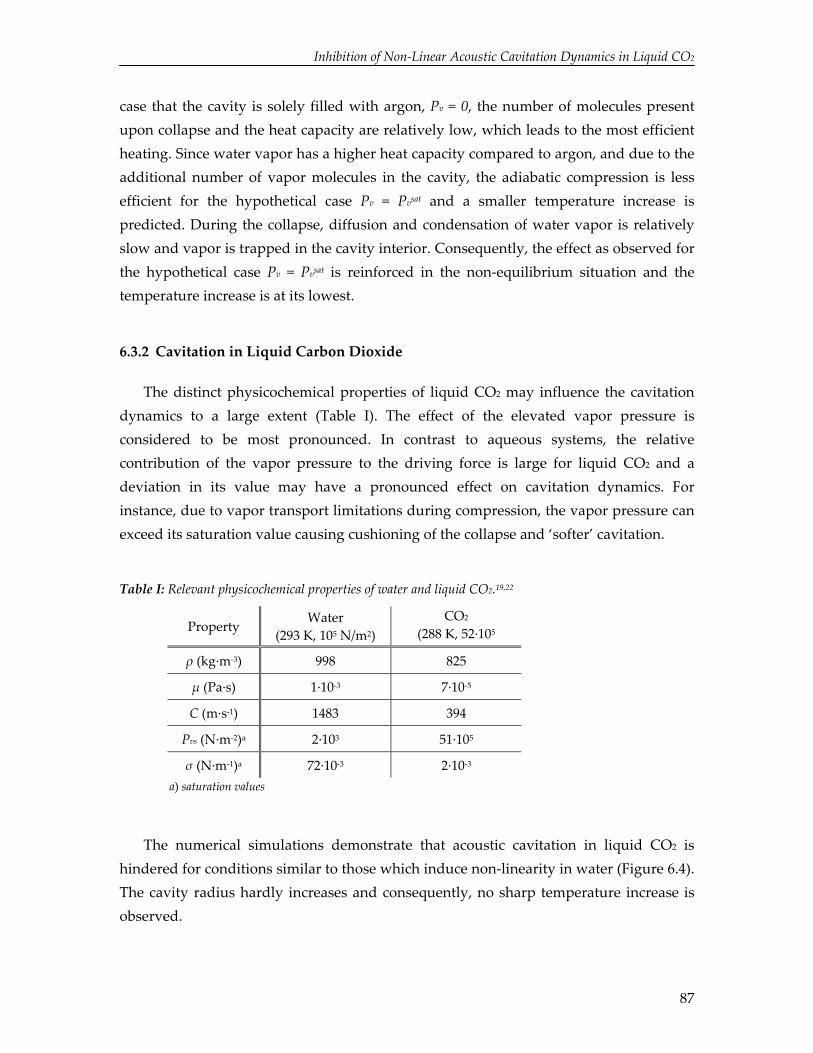
Inhibition of Non‐Linear Acoustic Cavitation Dynamics in Liquid CO2
case that the cavity is solely filled with argon, Pv = 0, the number of molecules present upon collapse and the heat capacity are relatively low, which leads to the most efficient heating. Since water vapor has a higher heat capacity compared to argon, and due to the additional number of vapor molecules in the cavity, the adiabatic compression is less efficient for the hypothetical case Pv = Pvsat and a smaller temperature increase is predicted. During the collapse, diffusion and condensation of water vapor is relatively slow and vapor is trapped in the cavity interior. Consequently, the effect as observed for the hypothetical case Pv = Pvsat is reinforced in the non‐equilibrium situation and the temperature increase is at its lowest.
6.3.2 Cavitation in Liquid Carbon Dioxide
The distinct physicochemical properties of liquid CO2 may influence the cavitation dynamics to a large extent (Table I). The effect of the elevated vapor pressure is considered to be most pronounced. In contrast to aqueous systems, the relative contribution of the vapor pressure to the driving force is large for liquid CO2 and a deviation in its value may have a pronounced effect on cavitation dynamics. For instance, due to vapor transport limitations during compression, the vapor pressure can exceed its saturation value causing cushioning of the collapse and ‘softer’ cavitation.
Table I: Relevant physicochemical properties of water and liquid CO2.19,22
Property Water
(293 K, 105 N/m2) CO2
(288 K, 52∙105
ρ (kg∙m‐3) 998 825
μ (Pa∙s) 1∙10‐3 7∙10‐5
C (m∙s‐1) 1483 394
Pvs (N∙m‐2)a 2∙103 51∙105
σ (N∙m‐1)a 72∙10‐3 2∙10‐3
a) saturation values
The numerical simulations demonstrate that acoustic cavitation in liquid CO2 is hindered for conditions similar to those which induce non‐linearity in water (Figure 6.4). The cavity radius hardly increases and consequently, no sharp temperature increase is observed.
87
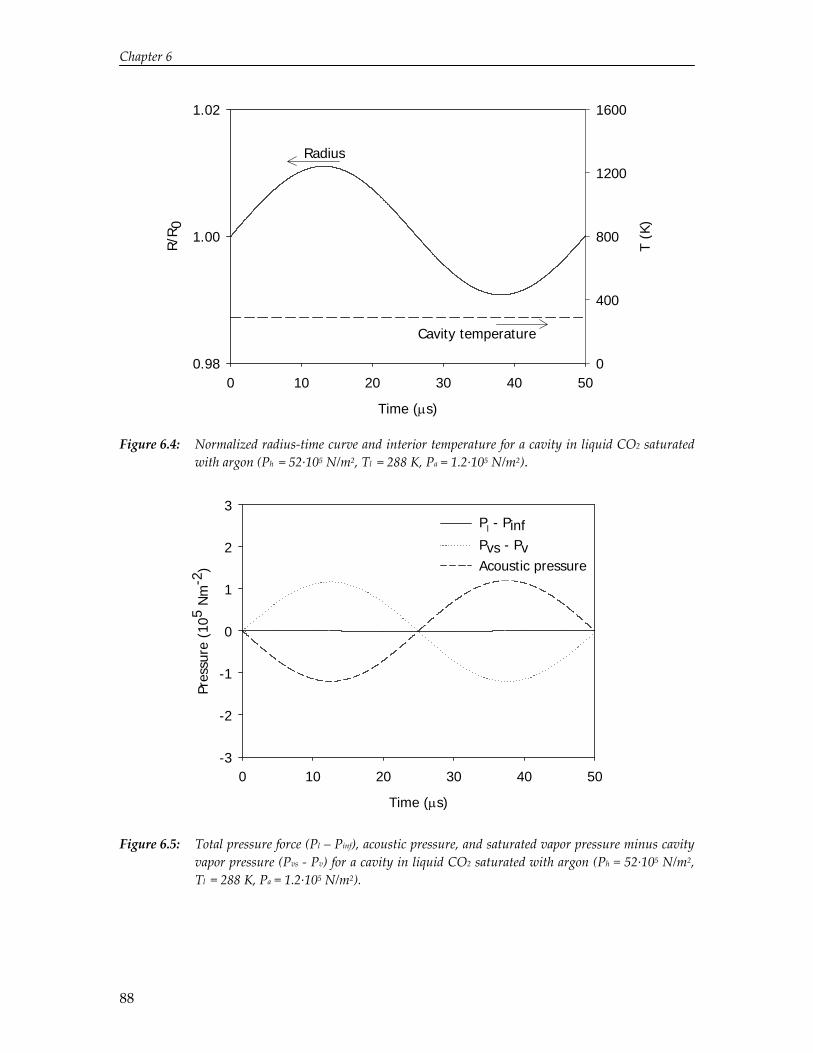
Chapter 6
Time (μs)
0 10 20 30 40 50
R/R 0
0.98
1.00
1.02
T (K
)
0
400
800
1200
1600
Radius
Cavity temperature
Time (μs)
0 10 20 30 40 50
Pres
sure
(10
5 N
m-2
)
-3
-2
-1
0
1
2
3Pl - PinfPvs - PvAcoustic pressure
Figure 6.4: Normalized radius‐time curve and interior temperature for a cavity in liquid CO2 saturated with argon (Ph = 52∙105 N/m2, Tl = 288 K, Pa = 1.2∙105 N/m2).
Figure 6.5: Total pressure force (Pl – Pinf), acoustic pressure, and saturated vapor pressure minus cavity vapor pressure (Pvs ‐ Pv) for a cavity in liquid CO2 saturated with argon (Ph = 52∙105 N/m2, Tl = 288 K, Pa = 1.2∙105 N/m2).
88

Inhibition of Non‐Linear Acoustic Cavitation Dynamics in Liquid CO2
At the beginning of the rarefaction phase, the negative acoustic pressure induces a driving force for radial motion, i.e. Pl‐P∞ > 0, leading to cavity expansion (Figure 6.5). This increase in cavity radius is accompanied by a sharp decrease in interior vapor pressure and hence, an increase in Pvs‐Pv. Due to the substantial contribution of the vapor pressure to the cavity interior pressure, a small deviation in this pressure strongly affects the driving force and the cavitation dynamics. The reduction in pressure slows down the cavity, which impedes inertia effects. As a result, acceleration of the cavity wall and an increase of the interior temperature are not observed.
In contrast to cavity expansion in aqueous systems, these results suggest that vapor transport limitations considerably affect cavity growth in liquid CO2. To investigate the exact cause of the decrease in interior vapor pressure, numerical simulations have been performed for two hypothetical cases: absence of vapor transport limitations (Pv = Pvs) and absence of heat transport limitations (T = Tl). In practice, this implies that for the respective simulations the vapor transport coefficients, αM and Db, and the heat transport coefficients, κl and κg, are increased by a factor of 105. The results for the two hypothetical cases are depicted in Figure 6.6. Even in the limiting case that vapor transport limitations are absent, the vapor pressure inside the cavity decreases significantly (Figure 6.6, Pv AVL). This suggests that the inhibition of cavity growth does not solely arise from vapor transport limitations. Due to the high vapor pressure of CO2, a high flux of vapor molecules is required to maintain dynamic equilibrium during expansion, and a large amount of energy has to be supplied to facilitate the corresponding phase transition of the CO2 molecules. Because the transfer of energy from the liquid is slow compared to the cavity dynamics, the temperature at the interface decreases (Figure 6.6, Tli AVL). The strong temperature‐dependency of the saturated vapor pressure of liquid CO2 forces the vapor pressure at the interface to decrease well below its saturation value at the bulk liquid conditions. As a result, the driving force for vapor transport diminishes (Eq.(5)) and the cavity interior pressure decreases.
To check the effect of heat transfer limitations, simulations have been performed in which the heat transfer coefficients are increased by a factor of 105. Even though the interface temperature remains constant, the interior vapor pressure decreases due to vapor transport limitations (Figure 6.6, Tli AHL and Pv AHL). This suggests that both heat and vapor transport impede non‐linear cavitation dynamics in liquid CO2. The decrease in vapor pressure is less pronounced compared to the hypothetical case Pv = Pvs and this indicates that the effect of heat transport limitations is most significant.
89
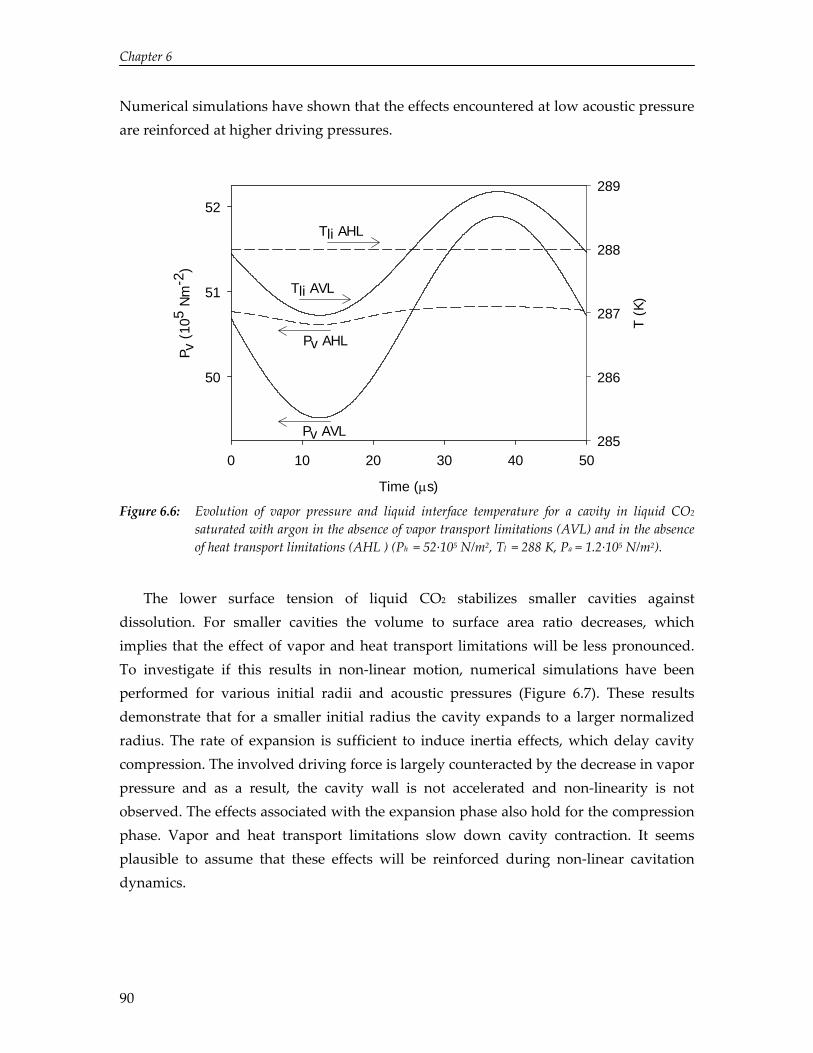
Chapter 6
Numerical simulations have shown that the effects encountered at low acoustic pressure are reinforced at higher driving pressures.
Time (μs)
0 10 20 30 40 50
P v (
105
Nm
-2)
50
51
52
T (K
)
285
286
287
288
289
Pv AHL
Tli AHL
Pv AVL
Tli AVL
Figure 6.6: Evolution of vapor pressure and liquid interface temperature for a cavity in liquid CO2
saturated with argon in the absence of vapor transport limitations (AVL) and in the absence of heat transport limitations (AHL ) (Ph = 52∙105 N/m2, Tl = 288 K, Pa = 1.2∙105 N/m2).
The lower surface tension of liquid CO2 stabilizes smaller cavities against dissolution. For smaller cavities the volume to surface area ratio decreases, which implies that the effect of vapor and heat transport limitations will be less pronounced. To investigate if this results in non‐linear motion, numerical simulations have been performed for various initial radii and acoustic pressures (Figure 6.7). These results demonstrate that for a smaller initial radius the cavity expands to a larger normalized radius. The rate of expansion is sufficient to induce inertia effects, which delay cavity compression. The involved driving force is largely counteracted by the decrease in vapor pressure and as a result, the cavity wall is not accelerated and non‐linearity is not observed. The effects associated with the expansion phase also hold for the compression phase. Vapor and heat transport limitations slow down cavity contraction. It seems plausible to assume that these effects will be reinforced during non‐linear cavitation dynamics.
90

Inhibition of Non‐Linear Acoustic Cavitation Dynamics in Liquid CO2
Time (μs)
0 10 20 30 40 50
R/R0
0
1
2
3
4
5
6R0 = 10, Pa = 1.2R0 = 1.0, Pa = 1.2R0 = 0.5, Pa = 1.2R0 = 0.5, Pa = 12
Figure 6.7: Effect of initial radius (μm) and acoustic pressure (105 N/m2) on predicted normalized
radius‐time curve for a cavity in liquid CO2 saturated with argon (Ph = 52 105 N/m2, Tl = 288 K).
In conclusion, the presented simulations indicate that transport limitations oppose non‐linear radial motion in liquid CO2. Although quantitative model predictions are complicated by the strong dependence of the physicochemical properties of CO2 on temperature and pressure, the presented model qualitatively captures cavity dynamics in liquid CO2.
6.4 Conclusions
In this work, a single‐cavity dynamics model has been applied to study the governing processes of acoustic cavitation in liquid CO2. To aid interpretation of simulation results for cavity dynamics in liquefied CO2, the model has first been used to describe cavitation in water at ambient conditions. The simulations show that in water inertia effects and force accumulation can lead to a non‐linear radial motion of the cavity. Especially during the collapse radial motion can be relatively fast compared to heat and mass transfer, resulting in an almost adiabatic compression of the cavity interior manifested by a sharp local pressure and temperature increase. Due to relatively slow vapor transport, water vapor is trapped in the cavity interior during collapse, leading to a lower temperature rise.
91
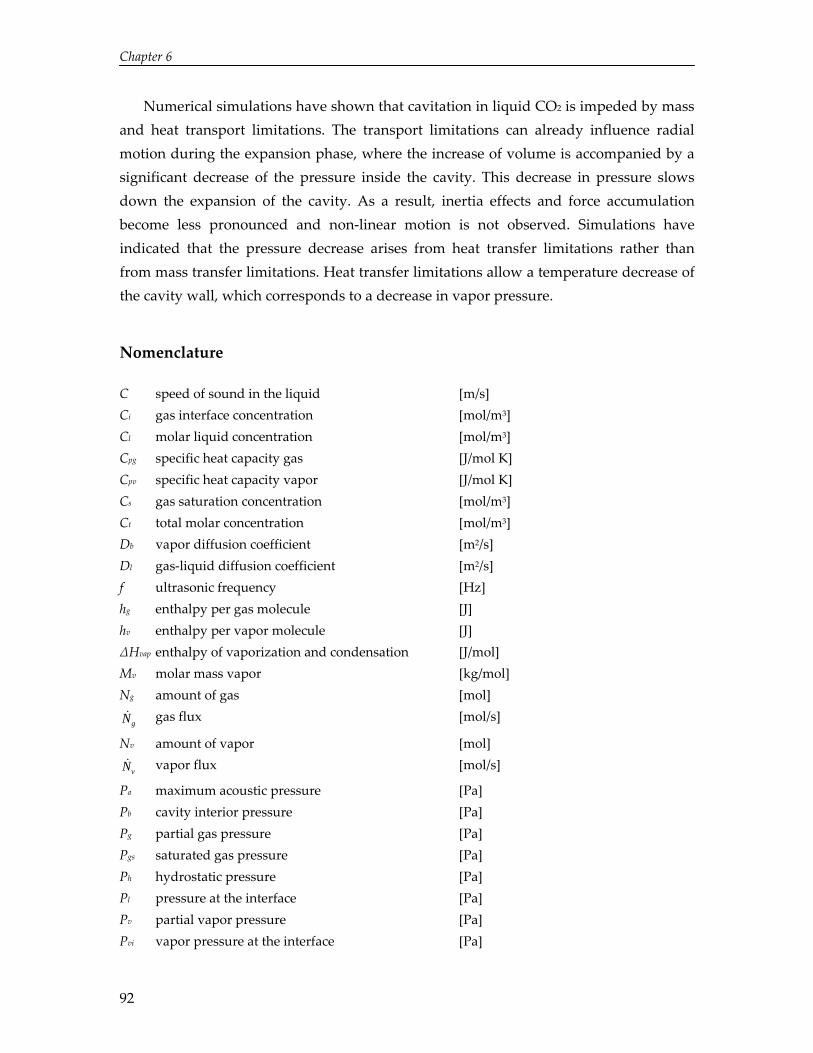
Chapter 6
Numerical simulations have shown that cavitation in liquid CO2 is impeded by mass and heat transport limitations. The transport limitations can already influence radial motion during the expansion phase, where the increase of volume is accompanied by a significant decrease of the pressure inside the cavity. This decrease in pressure slows down the expansion of the cavity. As a result, inertia effects and force accumulation become less pronounced and non‐linear motion is not observed. Simulations have indicated that the pressure decrease arises from heat transfer limitations rather than from mass transfer limitations. Heat transfer limitations allow a temperature decrease of the cavity wall, which corresponds to a decrease in vapor pressure.
Nomenclature
C speed of sound in the liquid [m/s] Ci gas interface concentration [mol/m3] Cl molar liquid concentration [mol/m3] Cpg specific heat capacity gas [J/mol K] Cpv specific heat capacity vapor [J/mol K] Cs gas saturation concentration [mol/m3] Ct total molar concentration [mol/m3] Db vapor diffusion coefficient [m2/s] Dl gas‐liquid diffusion coefficient [m2/s] f ultrasonic frequency [Hz] hg enthalpy per gas molecule [J] hv enthalpy per vapor molecule [J] ΔHvap enthalpy of vaporization and condensation [J/mol] Mv molar mass vapor [kg/mol] Ng amount of gas [mol]
gN& gas flux [mol/s]
Nv amount of vapor [mol]
vN& vapor flux [mol/s]
Pa maximum acoustic pressure [Pa] Pb cavity interior pressure [Pa] Pg partial gas pressure [Pa] Pgs saturated gas pressure [Pa] Ph hydrostatic pressure [Pa] Pl pressure at the interface [Pa] Pv partial vapor pressure [Pa] Pvi vapor pressure at the interface [Pa]
92
Inhibition of Non‐Linear Acoustic Cavitation Dynamics in Liquid CO2
Pvs saturated vapor pressure at infinity [Pa] Pvsi saturated vapor pressure at the interface [Pa] P∞ pressure infinitely far from the cavity [Pa]
Q& heat transfer [J/s]
R cavity radius [m] R& time derivative of the cavity radius [m/s] R&& second time derivative of the cavity radius [m/s2] Rg universal gas constant [J/mol K] R0 initial radius [m] t time [s] T temperature cavity interior [K] Ti cavity temperature at the interface [K] Tl bulk liquid temperature [K] Tli liquid temperature at the interface [K] V cavity volume [m3]
Greek symbols
αe thermal accommodation coefficient [‐] αM mass accommodation coefficient [‐] δb thermal boundary layer cavity interior [m] δg gas diffusion boundary layer liquid [m] δl thermal boundary layer liquid [m] δm vapor diffusion boundary layer cavity interior [m] κb thermal conductivity cavity interior [W/m K] κl thermal conductivity liquid [W/m K] μ dynamic viscosity [Pa s] ρl liquid density [kg/m3] σ surface tension [N/m]
References
1 K. S. Suslick, Science 247, 1439 (1990). 2 J. P. Luche, Synthetic Organic Sonochemistry (Plenum Publishing Corporation, New York,
1998). 3 L. H. Thompson; L. K Doraiswamy, Ind. Eng. Chem. Res. 38, 1215 (1999). 4 T. J. Mason; C. Petrier, Ultrasound Processes, Advanced Oxidation Processes for Water and
Wastewater Treatment (IWA Publishing, London, 2004). 5 E. J. Beckman, J. Supercrit. Fluids 28, 2‐3, 121 (2004). 6 M. W. A. Kuijpers; D. van Eck; M. F. Kemmere; J. T. F. Keurentjes, Science 298, 1969 (2002).
93

Chapter 6
7 S. Balachandran; S. E. Kentish; R. Mawson; M. Ashokkumar, Ultrason. Sonochem. 13, 471 (2006).
8 E. Riera; Y. Golás; A. Blanco; J. A. Gallego; M. Blasco; A. Mulet, Ultrason. Sonochem. 11, 241 (2004).
9 K. Yasui, Phys. Rev. E 56, 6750 (1997). 10 B. Storey; A. Szeri, J. Fluid. Mech. 396, 203 (1999). 11 R. Toegel; B. Gompf; R. Pecha; D. Lohse, Phys. Rev. Lett. 85, 3165 (2000). 12 J. B. Keller; M. Miksis, J. Acous. Soc. Am. 68, 628 (1980). 13 M. P. Brenner; S. Hilgenfeldt; D. Lohse, Rev. Mod. Phys. 74, 425 (2002). 14 J. A. Wesselingh; R. Krishna, Mass Transfer in Multicomponent Mixtures (Delft University
Press, Delft, 2000). 15 S. Fujikawa; T. Akamatsu, J. Fluid. Mech. 97, 481 (1980). 16 V. P. Carey, Statistical Thermodynamics and Microscale Thermophysics (Cambridge University
Press, Cambridge, 1999). 17 R. B. Byron; W. E. Stewart; E. N. Lightfoot, Transport Phenomena 2nd Ed. (Wiley, London,
2001). 18 M. N. Kogan, Rarefied Gas Dynamics (Plenum, New York, 1969). 19 P. J. Linstrom; W. G. Mallard, NIST Chemistry WebBook, NIST Standard Reference
Database Number 69, National Institute of Standards and Technology, Gaithersburg MD, 20899 (June 2005).
20 R. C. Robinson; W. E. Stewart, I&EC Fundamentals 7, 90 (1968). 21 T. E. Daubert; R. P. Danner, Physical and Thermodynamic Properties of Pure Compounds, Data
Compilation (Taylor and Francis, London, 2006). 22 D. R. Lide, Handbook of Chemistry & Physics 87th Ed. (CRC Press, Boca Raton, 2006). 23 B. E. Poling; J. M. Prausnitz; J. P. O’Connell, The Properties of Gases and Liquids 5th Ed.
(McGraw‐Hill, London, 2001). 24 E. Sarashina; Y. S. Arai, J. Chem. Eng. Japan 4, 379 (1971). 25 B. Barber; S. Putterman, Phys. Rev. Lett. 69, 3839 (1992). 26 M. Zientara; D. Jakubczyk; G. Derkachov; K. Kolwas; M. Kolwas, J. Phys. D: Appl. Phys. 38,
1978 (2005). 27 T. G. Leighton, The Acoustic Bubble (Academic Press, London, 1994).
94
7
Sound‐Driven High‐Frequency Phase Transitions in Pressurized CO2
Abstract
For a near‐critical mixture of carbon dioxide and argon, it has been demonstrated that ultrasound irradiation leads to an extremely fast phase separation, in which the system enters and leaves the two‐phase region with the frequency of the imposed sound field. This phase transition can propagate with the speed of sound, but can also be located at fixed positions in the case of a standing sound wave. Sonication of a vapor‐liquid interface creates a fine dispersion of liquid and vapor, irrespective whether the ultrasound horn is placed in the liquid or the vapor phase. In the absence of an interface, sonication of the liquid leads to ejection of a macroscopic vapor phase from the ultrasound horn with a velocity of several meters per second in the direction of wave propagation. The findings reported here provide a non‐invasive means for enhancing mass and heat transfer in high‐pressure fluids, for which the desired effect can be tuned by variations in pressure and temperature.
M.M. van Iersel; R. Mettin; N. E. Benes; D. Schwarzer; J. T. F. Keurentjes, in preparation.
95
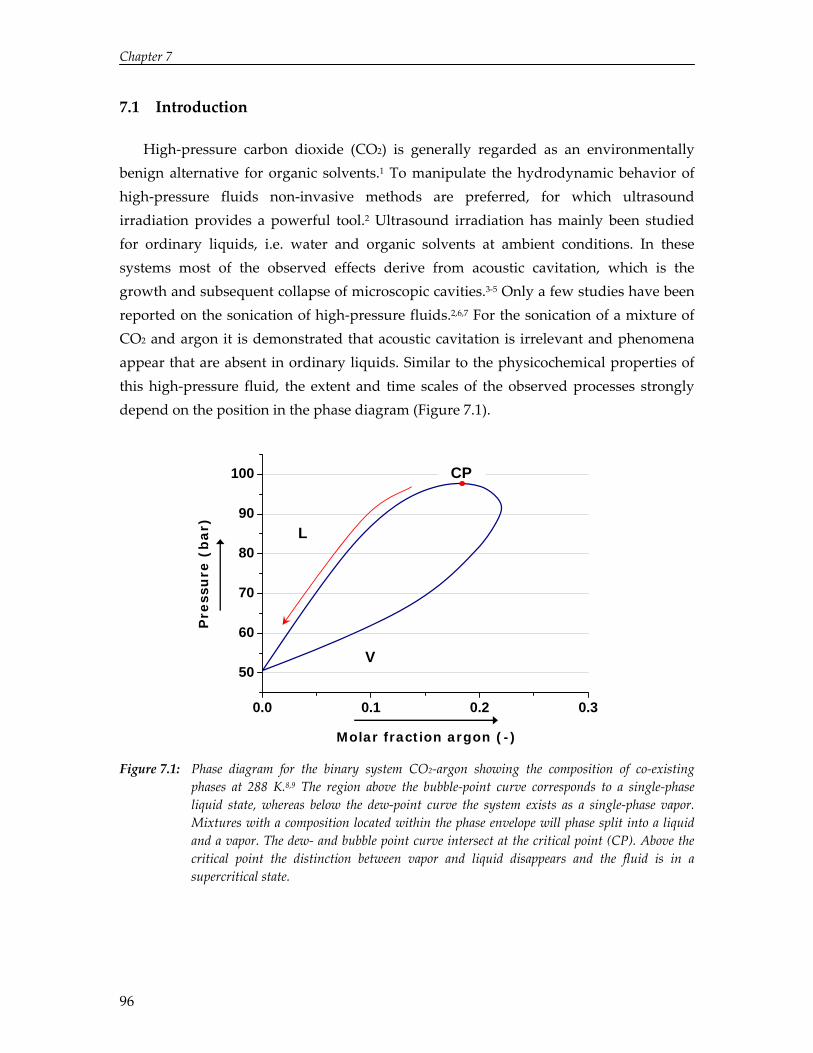
Chapter 7
96
7.1 Introduction
High‐pressure carbon dioxide (CO2) is generally regarded as an environmentally benign alternative for organic solvents.1 To manipulate the hydrodynamic behavior of high‐pressure fluids non‐invasive methods are preferred, for which ultrasound irradiation provides a powerful tool.2 Ultrasound irradiation has mainly been studied for ordinary liquids, i.e. water and organic solvents at ambient conditions. In these systems most of the observed effects derive from acoustic cavitation, which is the growth and subsequent collapse of microscopic cavities.3‐5 Only a few studies have been reported on the sonication of high‐pressure fluids.2,6,7 For the sonication of a mixture of CO2 and argon it is demonstrated that acoustic cavitation is irrelevant and phenomena appear that are absent in ordinary liquids. Similar to the physicochemical properties of this high‐pressure fluid, the extent and time scales of the observed processes strongly depend on the position in the phase diagram (Figure 7.1).
0.0 0.1 0.2 0
50
60
70
80
90
100
.3
Molar fraction argon (-)
Pre
ssu
re (
bar) L
V
CP
Figure 7.1: Phase diagram for the binary system CO2‐argon showing the composition of co‐existing phases at 288 K.8,9 The region above the bubble‐point curve corresponds to a single‐phase liquid state, whereas below the dew‐point curve the system exists as a single‐phase vapor. Mixtures with a composition located within the phase envelope will phase split into a liquid and a vapor. The dew‐ and bubble point curve intersect at the critical point (CP). Above the critical point the distinction between vapor and liquid disappears and the fluid is in a supercritical state.
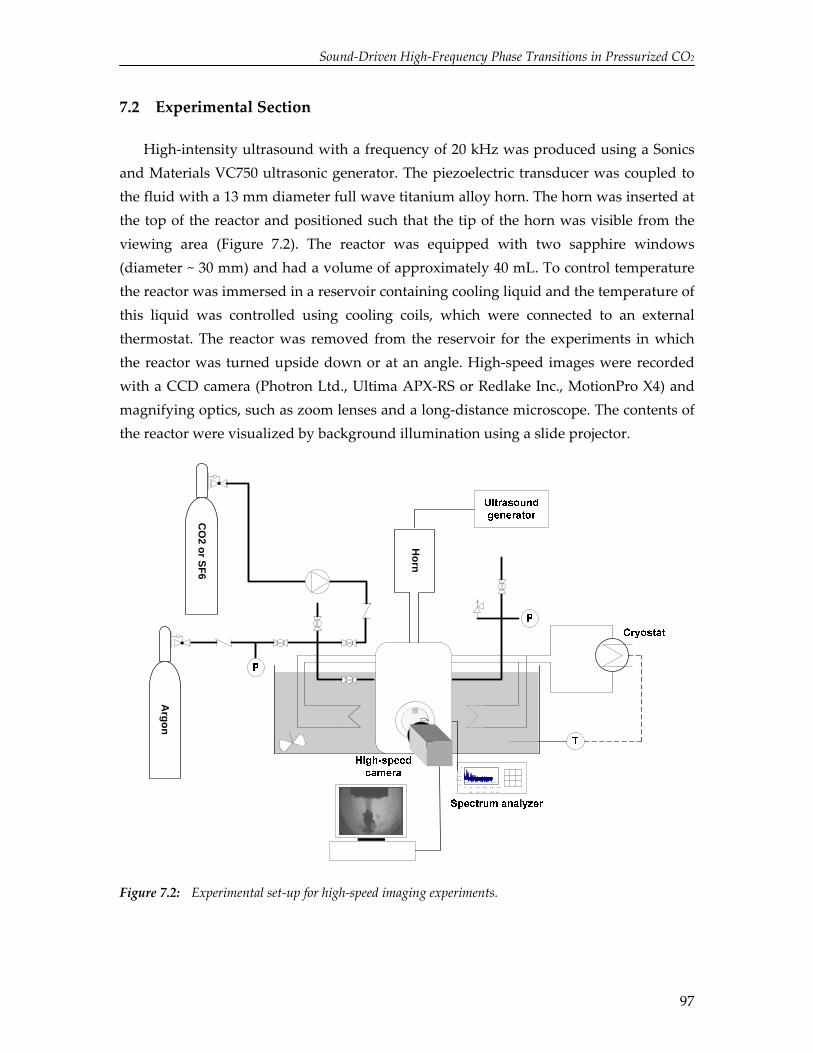
Sound‐Driven High‐Frequency Phase Transitions in Pressurized CO2
7.2 Experimental Section
High‐intensity ultrasound with a frequency of 20 kHz was produced using a Sonics and Materials VC750 ultrasonic generator. The piezoelectric transducer was coupled to the fluid with a 13 mm diameter full wave titanium alloy horn. The horn was inserted at the top of the reactor and positioned such that the tip of the horn was visible from the viewing area (Figure 7.2). The reactor was equipped with two sapphire windows (diameter ~ 30 mm) and had a volume of approximately 40 mL. To control temperature the reactor was immersed in a reservoir containing cooling liquid and the temperature of this liquid was controlled using cooling coils, which were connected to an external thermostat. The reactor was removed from the reservoir for the experiments in which the reactor was turned upside down or at an angle. High‐speed images were recorded with a CCD camera (Photron Ltd., Ultima APX‐RS or Redlake Inc., MotionPro X4) and magnifying optics, such as zoom lenses and a long‐distance microscope. The contents of the reactor were visualized by background illumination using a slide projector.
Horn
Argon
CO
2 or SF6
-2 0 0
-1 5 0
-1 0 0
-5 0
0
0 1 E
+ 0 5
2 E
+ 0 5
3 E
+ 0 5
4 E
+ 0 5
5 E
+ 0 5
Figure 7.2: Experimental set‐up for high‐speed imaging experiments.
97
Chapter 7
First, the temperature of the cooling liquid in the reservoir was controlled by adjusting the temperature of the external thermostat. The reactor was flushed several times with gaseous CO2 (grade 4.5, Linde Gas B.V.) to remove any air present and filled with liquid CO2 using a syringe pump (Teledyne Isco Inc., LC‐5000). Subsequently, the hydrostatic pressure was set to the desired value by applying an argon head pressure (grade 5.0, Linde Gas B.V.). After thermal and pressure equilibration, ultrasound was applied to the fluid and high‐speed images were recorded. Since the mixture turned turbid almost instantaneously, images were captured during the first seconds of sonication.
7.3 Results and Discussion
In the vicinity of the critical point (CP in Figure 7.1) local phase separation has been observed during each consecutive acoustic cycle, which implies that the system enters and leaves the two‐phase region with a frequency equal to the frequency of the imposed sound field (Figure 7.3A). Experiments confirmed that this process exclusively arises in the vicinity of the critical point, which can be shifted for the binary mixture by changing temperature. The extremely fast dynamics of phase separation can be attributed to the unique physicochemical properties around the critical point, where some of the thermodynamic and transport properties approach either zero or infinity.10 In particular, the heat of evaporation and the surface tension approach zero and hence, the change in Gibbs free energy required for phase separation is minute. The location of phase separation is determined by the spatial distribution of the sound field. For a traveling sound wave phase separation arises directly below the ultrasound horn and propagates in the direction of the wave with a velocity comparable to the speed of sound (~ 500 m/s), indicating that phase change occurs instantaneously in the negative pressure region of the sound wave. Propagation with the speed of sound suggests a strong resemblance with the well‐studied piston effect in near‐critical fluids, which refers to thermally‐induced acoustic waves responsible for enhanced thermalization.11,12 In contrast to the piston‐effect, the ultrasound process allows for direct manipulation of the time scale and the extent of phase separation by means of the frequency and acoustic pressure. The tuneability is also manifested by the possibility to induce phase separation at fixed positions in the sound field, i.e. at the pressure antinodes of a standing wave (Figure 7.3B).
98
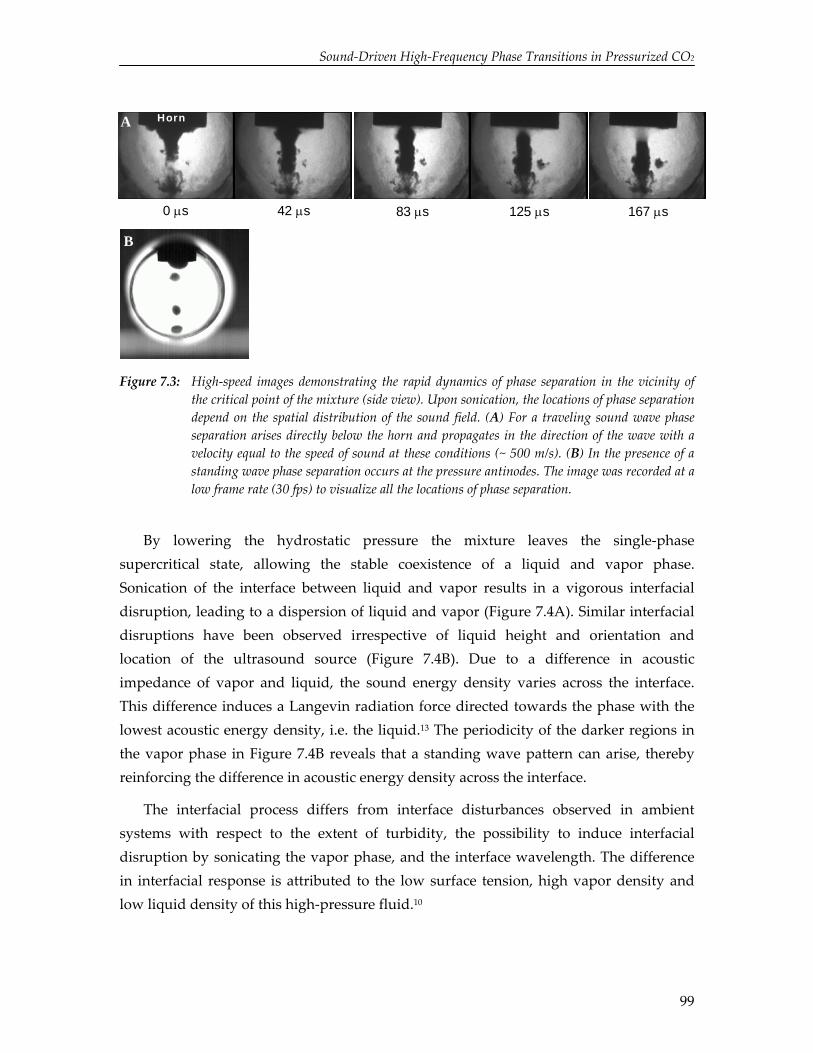
Sound‐Driven High‐Frequency Phase Transitions in Pressurized CO2
Horn A
0 μs 42 μs 83 μs 125 μs 167 μs
B
Figure 7.3: High‐speed images demonstrating the rapid dynamics of phase separation in the vicinity of
the critical point of the mixture (side view). Upon sonication, the locations of phase separation depend on the spatial distribution of the sound field. (A) For a traveling sound wave phase separation arises directly below the horn and propagates in the direction of the wave with a velocity equal to the speed of sound at these conditions (~ 500 m/s). (B) In the presence of a standing wave phase separation occurs at the pressure antinodes. The image was recorded at a low frame rate (30 fps) to visualize all the locations of phase separation.
By lowering the hydrostatic pressure the mixture leaves the single‐phase supercritical state, allowing the stable coexistence of a liquid and vapor phase. Sonication of the interface between liquid and vapor results in a vigorous interfacial disruption, leading to a dispersion of liquid and vapor (Figure 7.4A). Similar interfacial disruptions have been observed irrespective of liquid height and orientation and location of the ultrasound source (Figure 7.4B). Due to a difference in acoustic impedance of vapor and liquid, the sound energy density varies across the interface. This difference induces a Langevin radiation force directed towards the phase with the lowest acoustic energy density, i.e. the liquid.13 The periodicity of the darker regions in the vapor phase in Figure 7.4B reveals that a standing wave pattern can arise, thereby reinforcing the difference in acoustic energy density across the interface.
The interfacial process differs from interface disturbances observed in ambient systems with respect to the extent of turbidity, the possibility to induce interfacial disruption by sonicating the vapor phase, and the interface wavelength. The difference in interfacial response is attributed to the low surface tension, high vapor density and low liquid density of this high‐pressure fluid.10
99

Chapter 7
100
Horn A
Vapor
Liquid
7.5 ms 11.5 ms 13.5 ms 54 ms0 ms
B Vapor Liquid
Horn
0 ms 2 ms 5 ms 10 ms 21 ms
Figure 7.4: A sequence of high‐speed images showing the ultrasound‐induced disruption of the vapor‐liquid interface, in which the first image corresponds to the start of sonication. Ultrasound with a frequency of 20 kHz and a power input of 15 W was provided (A) from the top at 288 K and 52.5 bar and (B) from the bottom at 295 K and 57.5 bar. The darker regions in the vapor phase apparent from figure B imply the formation of a standing wave.
Studies on low‐frequency mechanical agitation of near‐critical CO2 have confirmed the special role of surface tension and density in the dynamics of the interfacial response.14‐16 In Figure 7.4 the observed interface wavelength is in the order of one centimeter, a value approximately three orders of magnitude larger as compared to sonication in ambient systems. For ambient systems ultrasound irradiation leads to Faraday excitation, which is characterized by waves of a few micrometers only.17 Magnified images of the interface reveal that waves of a few micrometers are superimposed on the waves shown in Figure 7.4. This superposition would explain the strong correlation between predictions based on the Faraday instability and the droplet size as measured in the ultrasound‐assisted emulsification of near‐critical CO2 – water mixtures.18
When the liquid‐vapor interface is located outside the reactor, interface disruption is irrelevant and the repeated formation and high‐velocity detachment of a macroscopic vapor phase becomes visible upon sonication of the liquid (Figure 7.5). Typically, formation and detachment occur during a number of acoustic cycles (~ 10 ‐ 500). Such a formation of a vapor phase (~ millimeters) is generally not observed for ambient systems, where sonication results in a cloud of oscillating cavities (~ micrometers).20,21
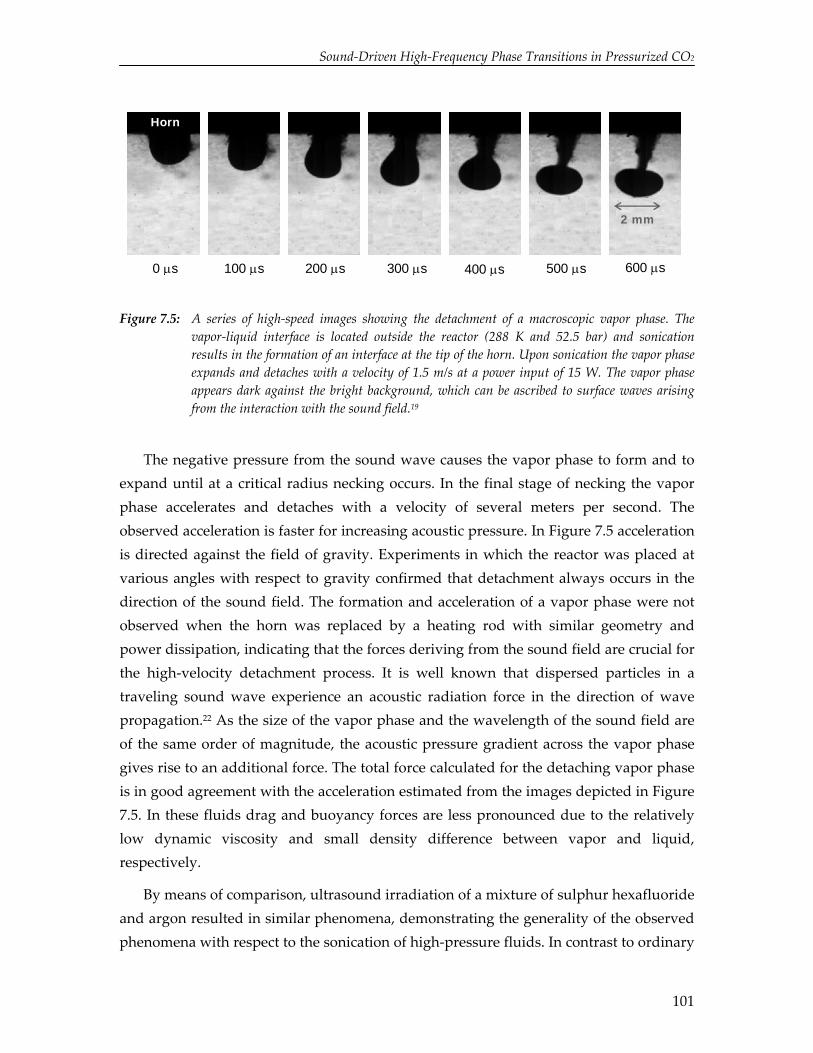
Sound‐Driven High‐Frequency Phase Transitions in Pressurized CO2
Horn
2 mm
600 μs 500 μs 0 μs 100 μs 200 μs 300 μs 400 μs
Figure 7.5: A series of high‐speed images showing the detachment of a macroscopic vapor phase. The
vapor‐liquid interface is located outside the reactor (288 K and 52.5 bar) and sonication results in the formation of an interface at the tip of the horn. Upon sonication the vapor phase expands and detaches with a velocity of 1.5 m/s at a power input of 15 W. The vapor phase appears dark against the bright background, which can be ascribed to surface waves arising from the interaction with the sound field.19
The negative pressure from the sound wave causes the vapor phase to form and to expand until at a critical radius necking occurs. In the final stage of necking the vapor phase accelerates and detaches with a velocity of several meters per second. The observed acceleration is faster for increasing acoustic pressure. In Figure 7.5 acceleration is directed against the field of gravity. Experiments in which the reactor was placed at various angles with respect to gravity confirmed that detachment always occurs in the direction of the sound field. The formation and acceleration of a vapor phase were not observed when the horn was replaced by a heating rod with similar geometry and power dissipation, indicating that the forces deriving from the sound field are crucial for the high‐velocity detachment process. It is well known that dispersed particles in a traveling sound wave experience an acoustic radiation force in the direction of wave propagation.22 As the size of the vapor phase and the wavelength of the sound field are of the same order of magnitude, the acoustic pressure gradient across the vapor phase gives rise to an additional force. The total force calculated for the detaching vapor phase is in good agreement with the acceleration estimated from the images depicted in Figure 7.5. In these fluids drag and buoyancy forces are less pronounced due to the relatively low dynamic viscosity and small density difference between vapor and liquid, respectively.
By means of comparison, ultrasound irradiation of a mixture of sulphur hexafluoride and argon resulted in similar phenomena, demonstrating the generality of the observed phenomena with respect to the sonication of high‐pressure fluids. In contrast to ordinary
101

Chapter 7
liquids, the practical implications of ultrasound irradiation for high‐pressure fluids do not derive from acoustic cavitation. The observed ultra‐fast phase separation and vigorous interfacial response provide a tuneable and non‐invasive means for enhancing mass and heat transfer in high‐pressure fluids, without undesired effects originating from radical formation. These implications are of interest for high‐pressure liquid/liquid biphasic systems, gas‐expanded solvents, and high‐pressure reaction and extraction media.
7.4 Conclusions
This work demonstrates that ultrasound irradiation of carbon dioxide leads to extraordinary phenomena that do not appear in water and organic solvents, allowing a substantial improvement of mass and heat transfer in high‐pressure fluids. In the vicinity of the critical point sonication creates an extremely fast and local phase separation, which propagates through the mixture with a velocity equal to the speed of sound. Ultrasound irradiation of a vapor‐liquid interface induces turbulent mixing of vapor and liquid, whereas in the absence of an interface a vapor phase is formed and ejected from the ultrasound source with a velocity of several meters per second. Similar phenomena have been observed for the sonication of pressurized sulphur hexafluoride, thereby demonstrating that these processes can be extended to other high‐pressure fluids.
References
1. P. G. Jessop; W. Leitner, Chemical Synthesis Using Supercritical Fluids (Wiley‐VCH, Weinheim, 1999).
2. E. Riera; Y. Golás; A. Blanco; J. A. Gallego; M. Blasco; A. Mulet, Ultrason. Sonochem. 11, 241 (2004).
3. K. S. Suslick, Science 247, 1439 (1990). 4. M. P. Brenner; S. Hilgenfeldt; D. Lohse, Rev. Modern Phys. 74, 425 (2002). 5. T. G. Leighton, The Acoustic Bubble (Academic Press, London, 1994). 6. M. W. A. Kuijpers; D. van Eck; M. F. Kemmere; J. T. F. Keurentjes, Science 298, 1969 (2002). 7. S. Balachandran; S. E. Kentish; R. Mawson; M. Ashokkumar, Ultrason. Sonochem. 13, 471
(2006). 8. M. A. McHugh; V. J. Krukonis, Supercritical Fluid Extraction (Butterworth‐Heinemann,
Boston, 1994). 9. E. Sarashina; Y. S. Arai, J. Chem. Eng. Japan 4, 379 (1971).
102
Sound‐Driven High‐Frequency Phase Transitions in Pressurized CO2
10. P. J. Lindstrom; W. G. Mallard, NIST Chemistry WebBook, NIST Standard Reference Database Number 69, National Institute of Standards and Technology, Gaithersburg MD, 20899 (June 2005).
11. A. Onuki; H. Hao; R. A. Ferrell, Phys. Rev. A 41, 2256 (1990). 12. Y. Miura; S. Yoshihara; M. Ohnishi; K. Honda; M. Matsumoto; J. Kawai; M. Ishikawa; H.
Kobayashi; A. Onuki, Phys. Rev. E 74, 010101 (2006). 13. B. T. Chu; R. E. Apfel, J. Acoust. Soc. Am. 72, 1673 (1982). 14. S. Fauve; K. Kumar; C. Laroche; D. Beysens; Y Garrabos, Phys. Rev. Lett. 68, 3160 (1992). 15. R. Wunenburger; P. Evesque; C. Chabot; Y. Garrabos; S. Fauve; D. Beysens, Phys. Rev. E 59,
5440 (1999). 16. W. González‐Viñas; J. Salán, Europhys. Lett. 26, 665 (1994). 17. J. Xu; D. Attinger, Phys. Fluids 19, 108107 (2007). 18. M. T. Timko; K. A. Smith; R. L. Danheiser; J. I. Steinfeld; J. W. Tester, AIChE J. 52, 1127
(2006). 19. R. Glynn Holt; E. H. Trinh, Phys. Rev. Lett. 77, 1274 (1996). 20. M. M. van Iersel; J. –P. A. J. van den Manacker; N. E. Benes; J. T. F. Keurentjes, J. Phys.
Chem. B 111, 3081 (2007). 21. R. Mettin, Bubble Structures in Acoustic Cavitation, Bubble and Particle Dynamics in Acoustic
Fields: Modern Trends and Applications (Research Signpost, Kerala, 2005). 22. A. A. Doinikov, Acoustic Radiation Forces: Classical Theory and Recent Advances, Bubble
and Particle Dynamics in Acoustic Fields: Modern Trends and Applications (Research Signpost, Kerala, 2005).
103

Chapter 7
104
8
Sensible Sonochemistry
Abstract
This final chapter reviews some important aspects concerning the application of ultrasound to chemical processes, including a comparison to alternative radical sources and a discussion on energy efficiency. Additionally, the potential of ionic liquids and compressed CO2 as a solvent alternative is addressed. The results presented in the preceding chapters on ultrasound and compressed CO2 are discussed in view of analogous studies reported in literature. Finally, some concluding remarks with respect to the work presented in this thesis and sonochemistry in general are presented.
105

Chapter 8
8.1 Introduction
The work described in this thesis can be subdivided into two main topics: (I) extensive study on physical, chemical, and macroscopic effects in sonochemistry and (II) the potential of ultrasound irradiation in compressed CO2. This final chapter aims to address some points of attention, which should be considered sensibly before deciding whether or not and how to apply ultrasound (Figure 8.1). First, the utilization of ultrasound as an alternative method to induce chemical reactions and the benefits and drawbacks of ultrasound initiation compared to alternative sources of radicals are dealt with in section 8.2. Section 8.3 focuses on the ultrasonic acceleration of chemical reactions that also proceed in the absence of ultrasound. One of the major future challenges is the low energy efficiency, for which the use of alternative solvents could provide significant improvements (section 8.4). Section 8.5 discusses the apparent contradiction between the results presented in this thesis and previous work on acoustic cavitation in pressurized CO2.
Sensible
Sonochemistry
Applications
Ultrasound-inducedradical chemistry
(8.2)
Ultrasound-assisted
chemistry
(8.3)
Challenges
Energy efficiency
(8.4)Scale-up
Acoustic cavitation ↔
other radical sources
(8.2.1)
Alternative solvents:
- Ionic liquids (8.4.1)
- Carbon dioxide (8.5)
Figure 8.1: Schematic overview of the points addressed in this chapter. The number between parentheses
refers to the section in which the subject is discussed.
106
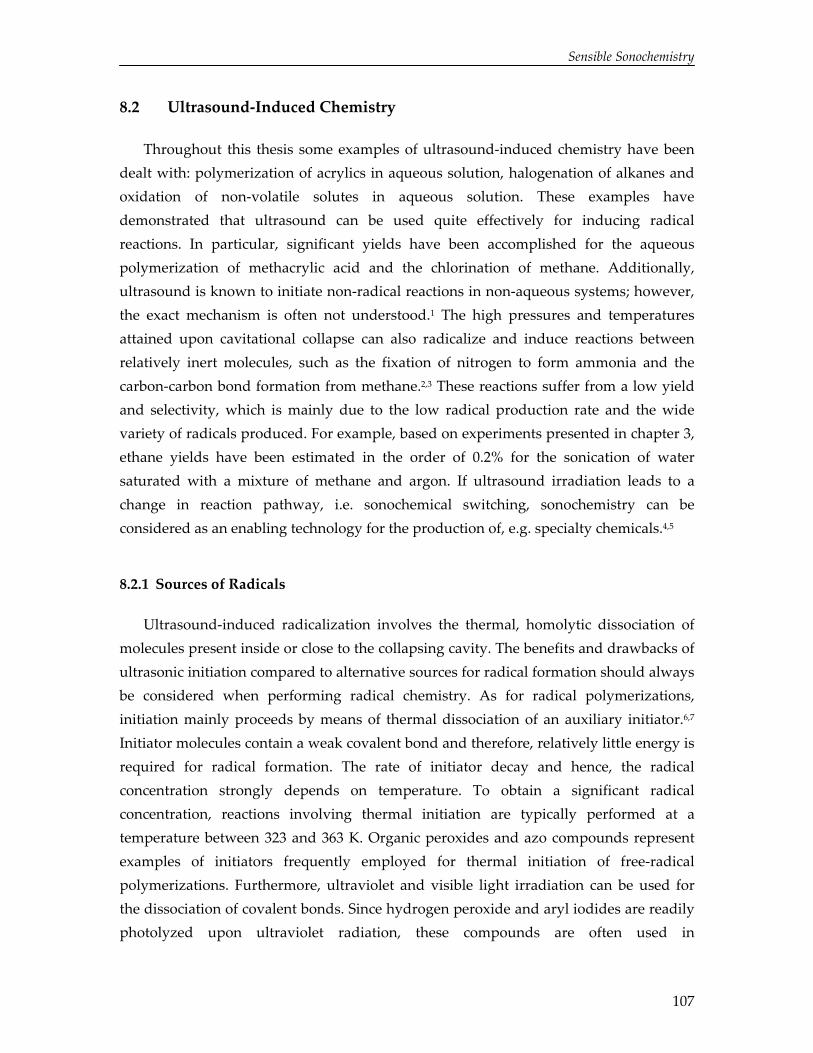
Sensible Sonochemistry
8.2 Ultrasound‐Induced Chemistry
Throughout this thesis some examples of ultrasound‐induced chemistry have been dealt with: polymerization of acrylics in aqueous solution, halogenation of alkanes and oxidation of non‐volatile solutes in aqueous solution. These examples have demonstrated that ultrasound can be used quite effectively for inducing radical reactions. In particular, significant yields have been accomplished for the aqueous polymerization of methacrylic acid and the chlorination of methane. Additionally, ultrasound is known to initiate non‐radical reactions in non‐aqueous systems; however, the exact mechanism is often not understood.1 The high pressures and temperatures attained upon cavitational collapse can also radicalize and induce reactions between relatively inert molecules, such as the fixation of nitrogen to form ammonia and the carbon‐carbon bond formation from methane.2,3 These reactions suffer from a low yield and selectivity, which is mainly due to the low radical production rate and the wide variety of radicals produced. For example, based on experiments presented in chapter 3, ethane yields have been estimated in the order of 0.2% for the sonication of water saturated with a mixture of methane and argon. If ultrasound irradiation leads to a change in reaction pathway, i.e. sonochemical switching, sonochemistry can be considered as an enabling technology for the production of, e.g. specialty chemicals.4,5
8.2.1 Sources of Radicals
Ultrasound‐induced radicalization involves the thermal, homolytic dissociation of molecules present inside or close to the collapsing cavity. The benefits and drawbacks of ultrasonic initiation compared to alternative sources for radical formation should always be considered when performing radical chemistry. As for radical polymerizations, initiation mainly proceeds by means of thermal dissociation of an auxiliary initiator.6,7 Initiator molecules contain a weak covalent bond and therefore, relatively little energy is required for radical formation. The rate of initiator decay and hence, the radical concentration strongly depends on temperature. To obtain a significant radical concentration, reactions involving thermal initiation are typically performed at a temperature between 323 and 363 K. Organic peroxides and azo compounds represent examples of initiators frequently employed for thermal initiation of free‐radical polymerizations. Furthermore, ultraviolet and visible light irradiation can be used for the dissociation of covalent bonds. Since hydrogen peroxide and aryl iodides are readily photolyzed upon ultraviolet radiation, these compounds are often used in
107

Chapter 8
photochemical reactions. In addition to light irradiation, so‐called ionizing radiation can induce initiation in the presence or absence of an auxiliary initiator. Ionizing radiation refers to high‐energy radiation using particles (e.g. electrons), X‐rays, or γ‐rays. Due to the higher cost and safety issues, this type of initiation is usually not preferred over the other methods. Redox initiation involves the formation of radicals by means of oxidation‐reduction reactions. A well‐known example is the Fenton reaction between iron(II) salts and hydrogen peroxide. Occasionally, several radical sources are used in conjunction to enhance radical production rates.8‐10
In contrast to thermal initiation, radicalization by means of ultrasound or any of the other discussed methods does not require elevated bulk temperatures. It should be noted, however, that higher temperatures also imply an increase in reaction rate, especially important for polymerization reactions. Furthermore, ultrasound‐, photo‐ and radiation‐induced radicalization is intrinsically safe as radical production stops when the source is switched off and it allows control of the location of radical formation. Ultrasonic initiation can proceed in the absence of any auxiliary component due to the extreme conditions obtained inside the collapsing cavities, whereas thermal, photolytic and redox initiation often require the addition of a compound containing a weak covalent bond. For example, the photochemical oxidation of pollutants in water is frequently associated with the addition of hydrogen peroxide or ozone.11 An exception is the halogenation of alkanes. The covalent bond between two halogen atoms is relatively weak and as a result, this reaction can proceed thermally and photochemically in the absence of an initiator.12,13 The various sources are compared in Table I.
Table I: Comparison of various sources of radicals.
Radical source Ambient temperature
On‐off production
Local radicalization
Auxiliary component
Safety
Thermal decomposition Ultrasound irradiation UV‐Visible radiation Ionizing radiation
Redox reaction
108

Sensible Sonochemistry
Although ultrasonic initiation seems promising, improvement of the energy efficiency is considered crucial for commercial applications.14,15 Nevertheless, only little is known about the relative efficiency of the various radical sources. Based on the hydrogen formation rates presented in chapter 3, rough estimates can be given for ultrasound‐induced radical production rates. For example, sonication of water saturated with argon at 293 K resulted in a hydrogen production rate of approximately 0.07 μmol s‐1 l‐1 using an electrical input of 50 W and argon. Assuming hydrogen gas arises from the recombination of two hydrogen radicals and each hydrogen radical is accompanied by the formation of a hydroxide radical, this implies a minimal radical production of 0.3 μmol s‐1 l‐1 and an energy efficiency of 6 nmol l‐1 J‐1. The majority of radicals produced inside the collapsing cavity recombines before entering the liquid, leading to the formation of e.g. hydrogen gas.16 Accordingly, only a small fraction of the estimated radical production rate is actually available for initiation and a radical energy efficiency of well below 6 nmol l‐1 J‐1 is expected, which is in line with previously reported hydroxyl radical yields as obtained from dosimeter studies.17 This radical energy efficiency is relatively high compared to values typically obtained for UV irradiation. Irradiation of a hydrogen peroxide solution using a mercury lamp (256 nm) results in a maximum radical energy efficiency of 0.1 nmol l‐1 J‐1.11 The values for ultrasonic and photochemical initiation should be compared to radical energy efficiencies encountered in polymerizations induced by thermal decomposition of an initiator. The decomposition constant of potassium persulfate in water at 353 K equals 6.9⋅10‐5 s‐1.18 For an initial concentration of 10 mmol l‐1 and an initiator efficiency of 0.5, this decomposition constant implies an average radical production rate during the first hour of 0.6 μmol s‐1 l‐1. The amount of energy required for radicalization depends on the heat that has to be supplied to the liquid to raise and maintain the temperature. Supposing that the reactor is thermally isolated and the energy required only consists of heating the mixture to the desired temperature, the average radical energy efficiency during the first hour resembles 9 nmol l‐1 J‐1.
The calculated radical energy efficiencies for thermal and ultrasonic initiation are roughly in the same order of magnitude. Since the energy efficiency estimated for ultrasonic initiation represents an upper limit, thermal initiation seems favored. Although this thesis has demonstrated that ultrasound‐induced reaction rates can be optimized by changing experimental conditions, e.g. liquid temperature and saturation gas, it is improbable that the maximum radical energy efficiency for a conventional sonication system will exceed that obtained for thermal initiation. With respect to emulsion polymerizations, ultrasound irradiation provides additional benefits which
109

Chapter 8
have not been taken into account in the preceding analysis. The shearing action of ultrasound leads to the formation of polymeric radicals from polymer scission and to smaller monomer droplets.19.20 As a consequence, ultrasound‐initiated emulsion polymerizations proceed at reasonable reaction rates.
When comparing the various sources for inducing radical reactions, the following observations can be made: - Halogenation reactions: ultrasonic initiation seems a promising technique for the
dissociation of halogen compounds. - Waste water treatment processes: ultrasound, UV‐Visible and redox initiation have
proven to be effective in the oxidation of organic pollutants; nevertheless, ultrasound and UV‐Visible initiation are less energy efficient.
- Free‐radical polymerizations: ultrasound irradiation provides unique advantages; however, its energy efficiency is relatively low compared to that of thermal initiation.
8.3 Ultrasound‐Assisted Chemistry
Ultrasound is not only known for initiating chemical reactions, but also for accelerating reactions that also proceed in the absence of sonication.1 For homogeneous systems acceleration could, for instance, derive from single‐electron‐transfer processes between radical species and reactants.14 Frequently, the exact reason for acceleration is unclear and researchers adopt a pragmatic approach; ultrasound seems or does not seem to accelerate a reaction at these conditions. The benefit of ultrasound for heterogeneous systems is less unambiguous. Due to macro and micro mixing, ultrasound leads to mass transfer enhancement and hence, to higher reaction rates.1 These studies often do not compare the additional costs of ultrasound irradiation against the benefit of a decreasing reaction time. The unique conditions obtained upon cavitational collapse have especially been recognized in the field of materials science.21 The associated effects often relate to the physical rather than chemical consequences of acoustic cavitation.
Sonication of a solution containing solid particles can result in solid surface modification and solid fragmentation by means of shock waves and microjets (Figure 8.2). The latter refers to the asymmetric collapse of a cavity close to an interface, leading to a high‐speed jet directed towards this interface. In case of reactive metals, these processes can remove surface oxides and other contaminated coatings, thereby significantly improving reaction rates.22
110
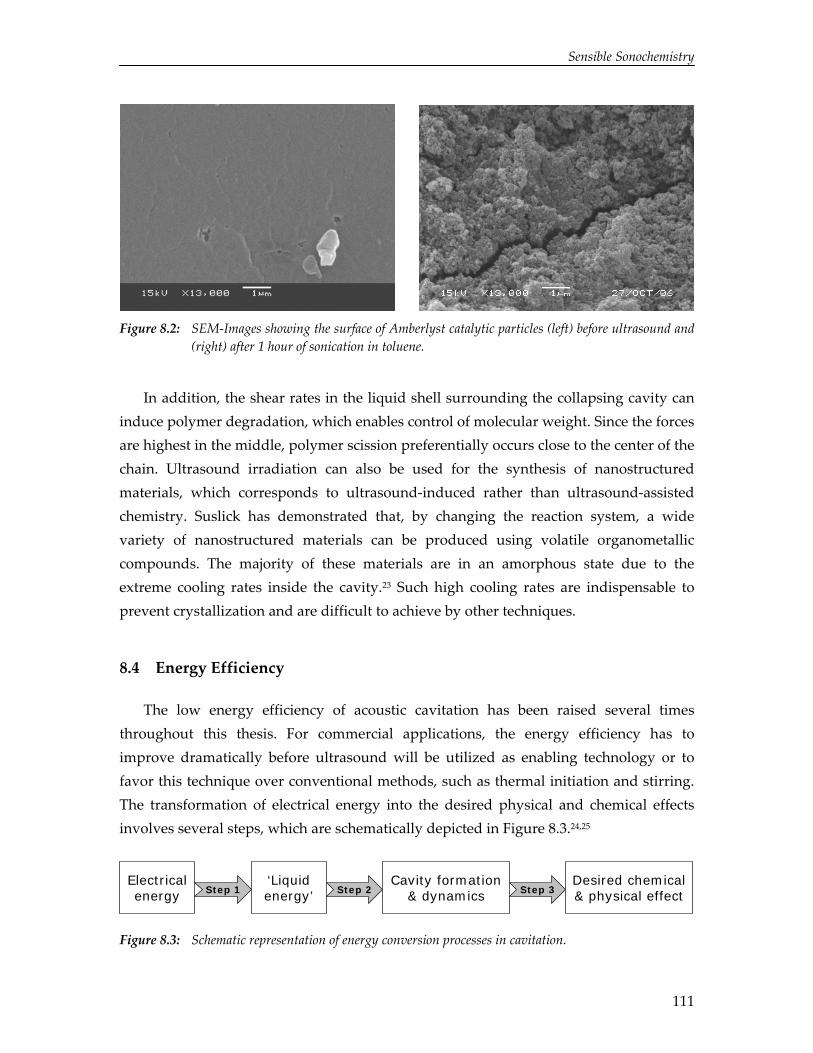
Sensible Sonochemistry
Figure 8.2: SEM‐Images showing the surface of Amberlyst catalytic particles (left) before ultrasound and
(right) after 1 hour of sonication in toluene.
In addition, the shear rates in the liquid shell surrounding the collapsing cavity can induce polymer degradation, which enables control of molecular weight. Since the forces are highest in the middle, polymer scission preferentially occurs close to the center of the chain. Ultrasound irradiation can also be used for the synthesis of nanostructured materials, which corresponds to ultrasound‐induced rather than ultrasound‐assisted chemistry. Suslick has demonstrated that, by changing the reaction system, a wide variety of nanostructured materials can be produced using volatile organometallic compounds. The majority of these materials are in an amorphous state due to the extreme cooling rates inside the cavity.23 Such high cooling rates are indispensable to prevent crystallization and are difficult to achieve by other techniques.
8.4 Energy Efficiency
The low energy efficiency of acoustic cavitation has been raised several times throughout this thesis. For commercial applications, the energy efficiency has to improve dramatically before ultrasound will be utilized as enabling technology or to favor this technique over conventional methods, such as thermal initiation and stirring. The transformation of electrical energy into the desired physical and chemical effects involves several steps, which are schematically depicted in Figure 8.3.24,25
Electricalenergy
‘Liquidenergy’
Cavity formation& dynamics
Desired chemical& physical effectStep 1 Step 2 Step 3
Figure 8.3: Schematic representation of energy conversion processes in cavitation.
111
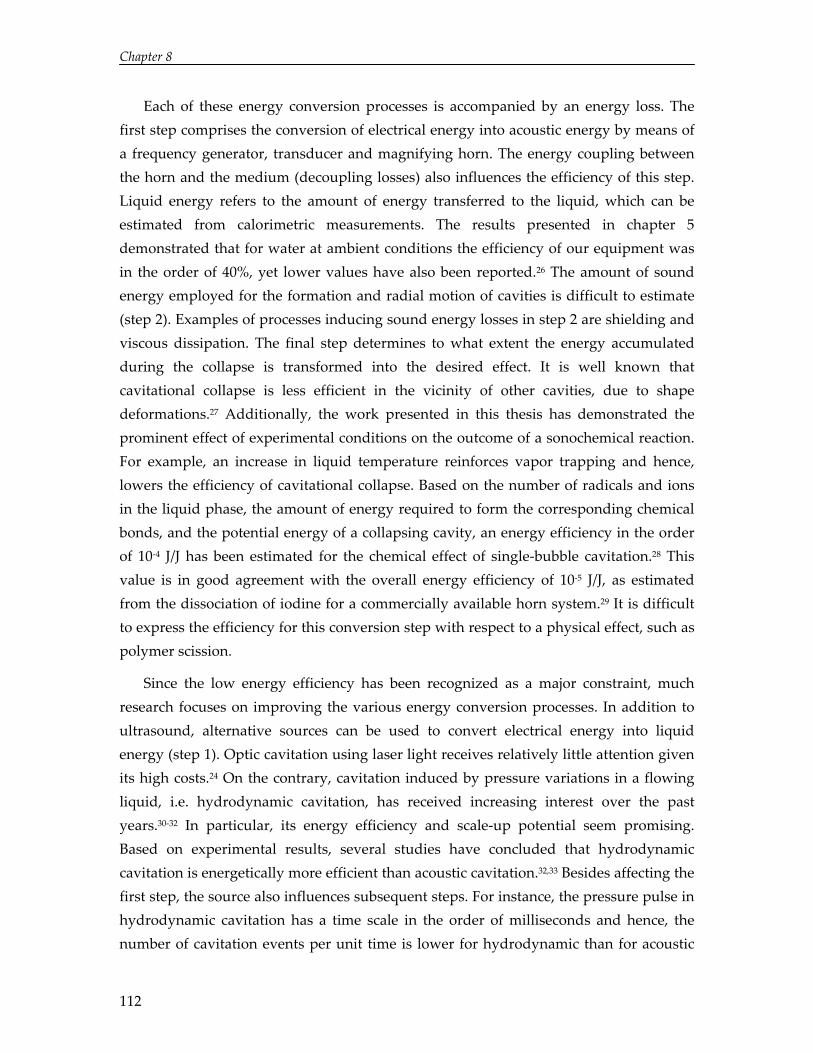
Chapter 8
Each of these energy conversion processes is accompanied by an energy loss. The first step comprises the conversion of electrical energy into acoustic energy by means of a frequency generator, transducer and magnifying horn. The energy coupling between the horn and the medium (decoupling losses) also influences the efficiency of this step. Liquid energy refers to the amount of energy transferred to the liquid, which can be estimated from calorimetric measurements. The results presented in chapter 5 demonstrated that for water at ambient conditions the efficiency of our equipment was in the order of 40%, yet lower values have also been reported.26 The amount of sound energy employed for the formation and radial motion of cavities is difficult to estimate (step 2). Examples of processes inducing sound energy losses in step 2 are shielding and viscous dissipation. The final step determines to what extent the energy accumulated during the collapse is transformed into the desired effect. It is well known that cavitational collapse is less efficient in the vicinity of other cavities, due to shape deformations.27 Additionally, the work presented in this thesis has demonstrated the prominent effect of experimental conditions on the outcome of a sonochemical reaction. For example, an increase in liquid temperature reinforces vapor trapping and hence, lowers the efficiency of cavitational collapse. Based on the number of radicals and ions in the liquid phase, the amount of energy required to form the corresponding chemical bonds, and the potential energy of a collapsing cavity, an energy efficiency in the order of 10‐4 J/J has been estimated for the chemical effect of single‐bubble cavitation.28 This value is in good agreement with the overall energy efficiency of 10‐5 J/J, as estimated from the dissociation of iodine for a commercially available horn system.29 It is difficult to express the efficiency for this conversion step with respect to a physical effect, such as polymer scission.
Since the low energy efficiency has been recognized as a major constraint, much research focuses on improving the various energy conversion processes. In addition to ultrasound, alternative sources can be used to convert electrical energy into liquid energy (step 1). Optic cavitation using laser light receives relatively little attention given its high costs.24 On the contrary, cavitation induced by pressure variations in a flowing liquid, i.e. hydrodynamic cavitation, has received increasing interest over the past years.30‐32 In particular, its energy efficiency and scale‐up potential seem promising. Based on experimental results, several studies have concluded that hydrodynamic cavitation is energetically more efficient than acoustic cavitation.32,33 Besides affecting the first step, the source also influences subsequent steps. For instance, the pressure pulse in hydrodynamic cavitation has a time scale in the order of milliseconds and hence, the number of cavitation events per unit time is lower for hydrodynamic than for acoustic
112
Sensible Sonochemistry
cavitation. Currently, much of the research on hydrodynamic cavitation focuses on identifying the effect of experimental parameters and on optimizing the chemical reactivity.30,32,33 The horn system used in this work leads to the formation of a large cloud of bubbles, thereby lowering the overall efficiency due to, amongst other things, shielding of the acoustic wave (step 2) and bubble‐bubble interactions (step 3). These effects could be minimized by using a micro reactor equipped with a low‐intensity transducer, in which the minimum distance between two oscillating cavities approximately equals five times their maximum bubble radius.34,35 The efficiency of the third step could be enhanced by using an inert solvent or a solvent with a lower vapor pressure.28 An inert solvent implies that less energy is consumed by thermal dissociation of solvent molecules present inside the collapsing cavity, whereas a lower vapor pressure reduces vapor trapping as well as solvent sonolysis. These effects would increase the temperature rise upon collapse. For argon‐saturated solvents, radicals arise from the thermal dissociation of solvent molecules and therefore, inert solvents and solvents with a low vapor pressure are not always preferred. However, for such inert and low‐volatile solvents the addition of molecules with a lower specific heat capacity and bond dissociation energy, e.g. hydrogen, could lead to higher radical production rates. Additionally, solvent participation could be undesirable when aiming at the selective formation of chemical bonds between two reactants, e.g. the halogenation of methane. In the latter case, solvent sonolysis merely lowers the hot‐spot temperature and overall selectivity without providing suitable radicals. Furthermore, the low vapor pressure of non‐volatile solvents reduces the minimum radius upon collapse and hence, reinforces the physical effect of cavitation.36 In view of these aspects, the potential of ultrasound‐induced chemistry in ionic liquids as well as liquid mercury have been explored.
8.4.1 Sonochemistry in Alternative Solvents
The physicochemical properties of ionic liquids are tailored by the choice of cation and anion combination.37 In general, ionic liquids exhibit a large liquid range, good solubility for various organic and inorganic compounds, and negligible vapor pressure. Their negligible vapor pressure prevents the emission of volatile organic compounds (VOC’s), facilitates product recovery, and makes them interesting with respect to sonochemical applications. The majority of sonochemical studies in ionic liquids has employed an ultrasonic bath to enhance mass transfer.38‐42 To investigate whether the relatively high viscosity and density of ionic liquids allow for non‐linear cavitation
113

Chapter 8
114
IL - 0
v/v%
IL - 1
3 v/v%
IL - 2
8 v/v%
IL - 8
v/v%
IL - 0
v/v%
Mercu
ry - 8
v/v%
Wate
r - 0
v/v%
H2
form
atio
n ra
te (μm
ol m
in-1
)
0.0
0.5
1.04.0
8.0
12.0
16.0
#1.1 #1.2 #1.3 #2.1 #2.2
dynamics and radicalization, hydrogen formation rates have been determined for 1‐butyl‐3‐methylimidazolium tetrafluoroborate ([BMIM][BF4]). [BMIM][BF4] belongs to the most commonly used ionic liquids that are commercially available.37 Hydrogen formation rates have been measured in the set‐up described elsewhere using an electrical input of 50 W and various argon to methane ratios in the gas feed.43 Since the solubilities of methane and argon are comparable in [BMIM][BF4], it is anticipated that the composition of the cavity interior approximately equals the gas feed composition.43,44 Due to the small reactor volume (~60 mL), low thermal conductivity and low specific heat capacity, the temperature of the ionic liquid increased up to 318 K during sonication.45 The results are depicted in Figure 8.4. This figure also displays the hydrogen production rate as determined for liquid mercury at 283 K.
Figure 8.4: Rate of hydrogen formation for different solvents and argon to methane ratios in the gas feed,
denoted by the volume‐volume percentages at the x‐axis. The ionic liquid experiments (IL) have been performed with two batches (#1 and #2) in consecutive series. For comparison, the hydrogen formation rate from water saturated with argon has also been given.
The negligible vapor pressure of an ionic liquid prevents thermal dissociation inside the cavity. Nevertheless, hydrogen is formed upon sonication of argon‐saturated [BMIM][BF4] (#1.1), which implies that the liquid temperature at the interface exceeds the decomposition temperature of [BMIM][BF4], i.e. 725 K.46 The hydrogen formation

Sensible Sonochemistry
rate is even much higher than that observed for argon‐saturated water. Sonication of [BMIM][BF4] also leads to the formation of methane and to darkening of the solution, thereby confirming the decomposition of [BMIM][BF4]. Decomposition has also been reported by previous studies on the sonication of ionic liquids.46,47 The relatively high hydrogen production rate as compared to water could derive from several factors, including: higher hot‐spot temperature, lower bond energies and lower solvent thermal conductivity. Although for 1‐ethyl‐3‐methylimidazolium‐ethyl sulfate hot‐spot temperatures have been reported in the same order of magnitude as those observed for water and organic solvents, it is assumed that at our sonication conditions the hot‐spot temperature is higher for an ionic liquid than for water.47 In [47] the hot‐spot temperature has been estimated using ultrasound with a frequency of 213 kHz. Numerical simulations for water have revealed that at these higher frequencies, the cavity expansion phase is relatively short and the cavity expands to a smaller maximum radius. Accordingly, the cavity only contains a small amount of water vapor and the effect hereof on hot‐spot temperature is less pronounced. In this work, low frequency ultrasound has been employed and due to the prolonged expansion phase, the presence of water vapor inside the cavity will have a considerable effect on collapse temperature. Therefore, it is anticipated that at 20 kHz sonication the negligible vapor pressure of an ionic liquid enhances the temperature attained upon collapse. Additionally, the results obtained with the first batch demonstrate that the hydrogen formation rate increases with increasing methane concentration in the feed. As no solvent evaporates into the cavity, the optimum methane concentration with respect to the hydrogen formation rate could shift to higher concentrations compared to that of water, i.e. the concentration of hydrogen atoms and specific heat capacity are balanced optimally at higher methane fractions in the feed. However, the results for #2.1 and #2.2 suggest that other factors are also of importance for the hydrogen formation rate and an example of this includes the accumulation of water and volatile decomposition products over time. The extensive utilization of ionic liquids for commercial applications is still mainly limited by their complicated and time‐consuming synthesis and hence, high cost price. Since our results have shown that cavitation leads to the decomposition of ionic liquids, ultrasonic applications only seem appealing if their cost price is reduced significantly.
Despite of its low gas solubility and high liquid density, the formation of hydrogen demonstrates the feasibility of cavitation in liquid mercury.48 However, its low sonochemical reactivity, toxicity, and low solubility for all kinds of reactants make that mercury is a less viable alternative. Carbon dioxide (CO2) represents another example of a relatively inert solvent. The high vapor pressure definitely lowers the energy efficiency
115
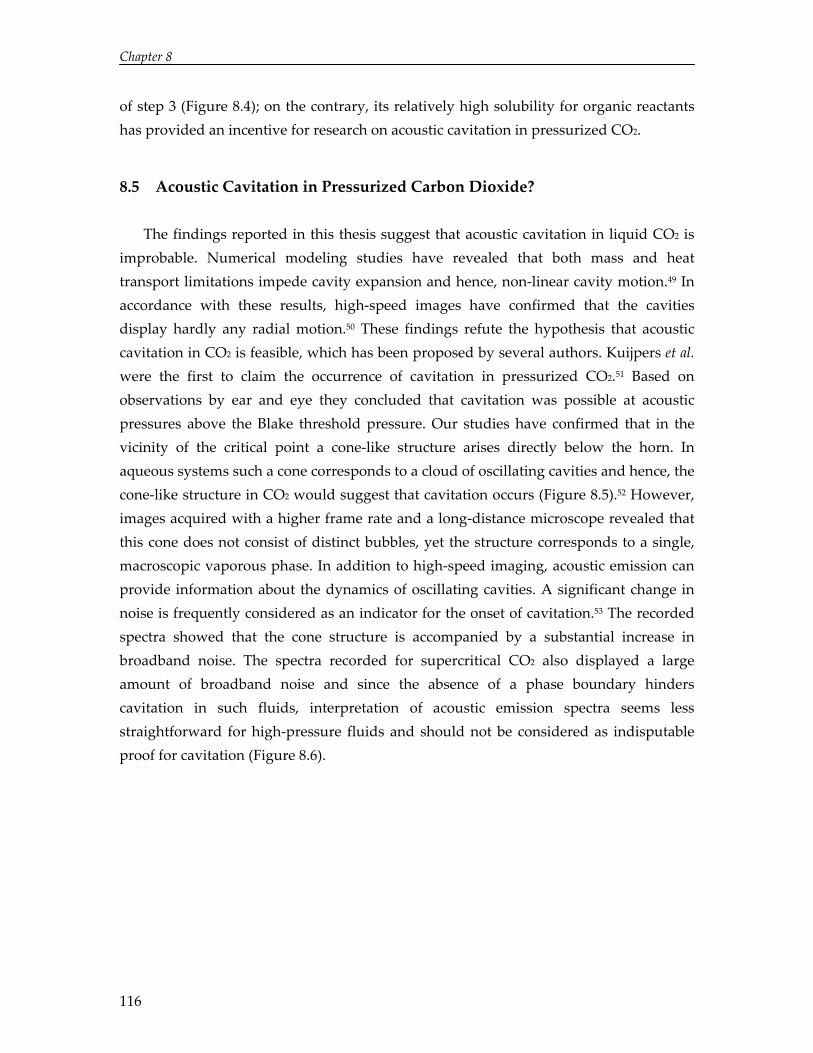
Chapter 8
of step 3 (Figure 8.4); on the contrary, its relatively high solubility for organic reactants has provided an incentive for research on acoustic cavitation in pressurized CO2.
8.5 Acoustic Cavitation in Pressurized Carbon Dioxide?
The findings reported in this thesis suggest that acoustic cavitation in liquid CO2 is improbable. Numerical modeling studies have revealed that both mass and heat transport limitations impede cavity expansion and hence, non‐linear cavity motion.49 In accordance with these results, high‐speed images have confirmed that the cavities display hardly any radial motion.50 These findings refute the hypothesis that acoustic cavitation in CO2 is feasible, which has been proposed by several authors. Kuijpers et al. were the first to claim the occurrence of cavitation in pressurized CO2.51 Based on observations by ear and eye they concluded that cavitation was possible at acoustic pressures above the Blake threshold pressure. Our studies have confirmed that in the vicinity of the critical point a cone‐like structure arises directly below the horn. In aqueous systems such a cone corresponds to a cloud of oscillating cavities and hence, the cone‐like structure in CO2 would suggest that cavitation occurs (Figure 8.5).52 However, images acquired with a higher frame rate and a long‐distance microscope revealed that this cone does not consist of distinct bubbles, yet the structure corresponds to a single, macroscopic vaporous phase. In addition to high‐speed imaging, acoustic emission can provide information about the dynamics of oscillating cavities. A significant change in noise is frequently considered as an indicator for the onset of cavitation.53 The recorded spectra showed that the cone structure is accompanied by a substantial increase in broadband noise. The spectra recorded for supercritical CO2 also displayed a large amount of broadband noise and since the absence of a phase boundary hinders cavitation in such fluids, interpretation of acoustic emission spectra seems less straightforward for high‐pressure fluids and should not be considered as indisputable proof for cavitation (Figure 8.6).
116
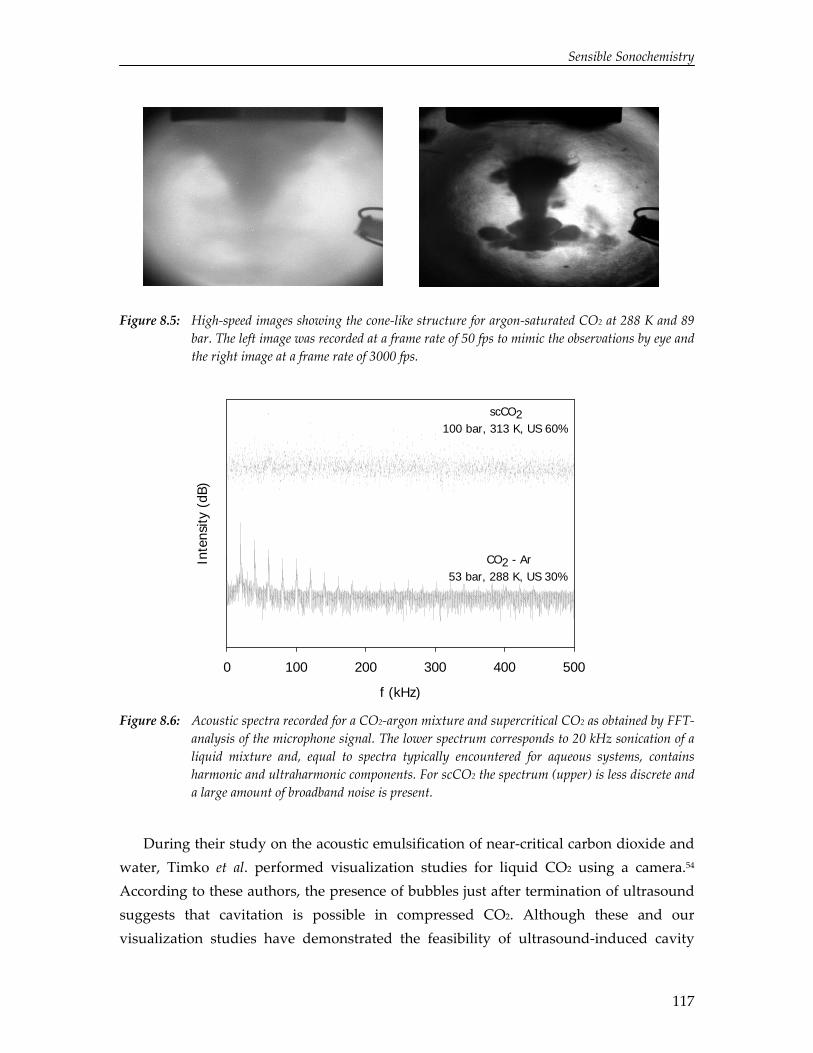
Sensible Sonochemistry
117
f (kHz)
0 100 200 300 400 500
Inte
nsity
(dB
)
CO2 - Ar53 bar, 288 K, US 30%
scCO2100 bar, 313 K, US 60%
Figure 8.5: High‐speed images showing the cone‐like structure for argon‐saturated CO2 at 288 K and 89 bar. The left image was recorded at a frame rate of 50 fps to mimic the observations by eye and the right image at a frame rate of 3000 fps.
Figure 8.6: Acoustic spectra recorded for a CO2‐argon mixture and supercritical CO2 as obtained by FFT‐
analysis of the microphone signal. The lower spectrum corresponds to 20 kHz sonication of a liquid mixture and, equal to spectra typically encountered for aqueous systems, contains harmonic and ultraharmonic components. For scCO2 the spectrum (upper) is less discrete and a large amount of broadband noise is present.
During their study on the acoustic emulsification of near‐critical carbon dioxide and water, Timko et al. performed visualization studies for liquid CO2 using a camera.54 According to these authors, the presence of bubbles just after termination of ultrasound suggests that cavitation is possible in compressed CO2. Although these and our visualization studies have demonstrated the feasibility of ultrasound‐induced cavity
Chapter 8
formation in CO2, none of these studies have been able to capture non‐linear cavity motion.
To demonstrate the feasibility of ultrasound‐induced radicalization and non‐linear cavitation dynamics in high‐pressure fluids, the free‐radical polymerization of methyl methacrylate and styrene in high‐pressure CO2‐systems has been investigated.51,55,56 These studies have revealed that ultrasonic initiation is possible at elevated CO2‐pressure. The sonochemical activities were low compared to those of aqueous systems, which have been attributed to the elevated vapor pressure and consequent cushioning of the collapse.57 However, the investigated monomer‐CO2 systems resemble CO2‐expanded solvents rather than high‐pressure liquid CO2. CO2‐expanded solvents refer to organic solvents containing a large amount of dissolved CO2, which readily forms at low to moderate CO2‐pressures.58 Due to the relatively low hydrostatic pressure, a lower acoustic pressure is sufficient to counteract the decrease in internal pressure upon cavity expansion and hence, it is relatively easy to induce non‐linear cavitation dynamics. Furthermore, CO2‐expanded solvents and liquid CO2 represent entirely different fluids, leading to very distinctive cavitation dynamics. In particular, this difference can have implications for the cavity expansion phase. Upon expansion, gas and vapor move from the liquid to the cavity to maintain dynamic equilibrium. Due to the high vapor pressure of liquid CO2, a high flux of vapor molecules is required during expansion, and a large amount of energy has to be supplied to facilitate the corresponding phase transition of CO2 molecules. Numerical simulations have shown that in liquid CO2 the transfer of energy from the liquid is relatively slow, thereby impeding non‐linear cavitation dynamics.49 Analogously, a large flux of CO2 molecules is required for cavity expansion in CO2‐expanded solvents. For these solvents, CO2 is dissolved in the liquid and hence, the amount of energy associated with the CO2‐flux is reduced. It should be emphasized that the rate of gas diffusion in these solvents is relatively high compared to e.g. argon diffusion in water. On account of the lower hydrostatic pressure and the distinct thermodynamic behavior of the monomer‐CO2 systems and liquid CO2, it can be argued that the polymerizations of MMA and styrene proof the feasibility of acoustic cavitation in liquefied CO2. Some studies have investigated the benefit of ultrasound irradiation for supercritical fluids extraction.59‐64 These studies report an increase in yield using ultrasound, which has been ascribed to enhanced stirring rather than cavitation. The phenomena described in chapter 7 could easily account for this mass transfer enhancement.
118

Sensible Sonochemistry
To our opinion, the studies reported in literature do not provide definite proof for the feasibility of acoustic cavitation in pressurized CO2. The numerical modeling studies as well as visualization experiments presented in this thesis suggest the opposite and ultrasound‐induced chemistry in compressed CO2 appears improbable. Nevertheless, ultrasound provides a non‐invasive means to enhance mass transfer in pressurized solvents.
8.6 Concluding Remarks
In contrast to rather pragmatic approaches frequently employed, this thesis has demonstrated the importance of considering several physical, chemical and macroscopic aspects for the application of ultrasound to chemical processes: Sensible Sonochemistry. In spite of its simplicity, the developed single‐cavity dynamics model has provided valuable insights into some important aspects and the effect of chosen experimental conditions. Chemical effects should also be considered carefully when performing sonochemistry. The presented chlorination experiments have illustrated, for example, the importance of deviations from thermodynamic equilibrium and of gas feed composition. Shielding effects limit the application and potential of high‐intensity ultrasound and future will tell whether micro‐reactor technology can offer a viable alternative. However, some of the results presented in this thesis (Fig. 2.6 and Fig. 5.3) showed large variations in experimental data, which illustrates that not all the aspects are yet complete understood and require further research. Other sonochemical studies have also identified this issue, realizing that it is difficult to compare measured data to data from literature. Therefore, conclusions should be derived and compared based on trends rather than absolute values.
Solvent replacement represents a central theme in green chemistry and therefore, we have employed the developed understanding to explore the potential of ultrasound in benign solvents, in which the focus has been on pressurized CO2. Our studies have shown that acoustic cavitation and ultrasound‐induced radicalization appear improbable in CO2. Accordingly, no significant benefits are expected with respect to chemical reactions. On the contrary, ultrasound irradiation induces some other intriguing effects, leading to significant improvements in mass and heat transfer. Despite of some disadvantages, such as low reactant solubility and chemical inertness, the cavitation dynamics and radical production rates typically observed for water and organic solvents make that these solvents are still favored over any of the alternatives addressed in this thesis.
119
Chapter 8
The concept of Sensible Sonochemistry also applies when considering whether to use ultrasound in any chemical process. In particular, chemical reactions involving radical species and heterogeneous systems can benefit from ultrasound irradiation. However, these benefits should always be compared to the additional amount of energy required. Due to the low energy efficiency, alternative radical sources are usually preferred and it is questionable whether the decrease in reaction time for heterogeneous systems appears really advantageous. The low energy efficiency of ultrasound is less problematic when it is used as an enabling technology, e.g. in the synthesis of amorphous materials.
As compared to alternative sources for radicals, ultrasound irradiation provides some distinct advantages: intrinsically safe operation, radicalization at ambient conditions, no need for auxiliary reactant, strong mechanical forces, and enhanced mixing. On the contrary, it suffers from a low energy efficiency and its application is mainly restricted to radical reactions. Nevertheless, ultrasound seems a promising technique to initiate and accelerate chemical reactions, for which a sensible approach is crucial to optimize the desired effect.
References
1 M. A. Margulis, High Energ. Chem. 38, 135 (2004). 2 Supeno; P. Kruus, Ultrason. Sonochem. 9, 53 (2002). 3 E. J. Hart; C. B. Fischer; A. Henglein, Radiat. Phys. Chem. 36, 511 (1990). 4 T. Ando; J. M. Leveque; J. P. Lorimer; J. L. Luche; T. J. Mason, J. Org. Chem. 63, 9561 (1998). 5 M. J. Dickens; J. L. Luche, Tetrahedron Lett. 32, 4709 (1991). 6 M. J. Perkins, Radical Chemistry (Ellis Horwood Limited, London, 1994). 7 G. Odian, Principles of Polymerization 3rd Ed. (Wiley, New York, 1991). 8 E. Naffrechoux; S. Chanoux; C. Petrier; J. Suptil, Ultrason. Sonochem. 7, 255 (2000). 9 P. R. Gogate; A. B. Pandit, Adv. Environ. Res. 8, 553 (2004). 10 T. S. Vivekanandam; A. Gopalan; T. Vasudevan; S. Umapathy, J. Polym. Sci., Part A: Polym.
Chem. 36, 2715 (1998). 11 T. Oppenländer, Photochemical Purification of Water and Air (Wiley‐VCH, Weinheim, 2003). 12 M. T. Holbrook, Methyl Chloride, Kirk‐Othmer Encyclopedia of Chemical Technology Vol. 16 (J.
Wiley & Sons, New York, 2003). 13 K. Ogura; N. Emura, J. Mol. Cat. 45, 319 (1988). 14 L. H. Thompson; L. K. Doraiswamy, Ind. Eng. Chem. Res. 38, 1215 (1999). 15 K. Yasui; T. Kozuka; T. Tuziuti; A. Towata; Y. Iida; J. King; P. Macey; Ultrason. Sonochem.
14, 605 (2007). 16 C. H. Fischer; E. J. Hart; A. Henglein, J. Phys. Chem. 90, 222 (1986). 17 G. Mark; A. Tauber; R. Laupert; H. P. Schuchmann; D. Schulz; A. Mues; C. von Sonntag,
Ultrason. Sonochem. 5, 41 (1998). 18 J. Brandrup; E. H. Immergut, Polymer Handbook 3rd Ed. (Wiley‐Interscience, London, 2000). 19 G. Cooper; F. Grieser; S. Biggs, J. Colloid Interface Sci. 184, 52 (1996).
120
Sensible Sonochemistry
20 B. M. Teo; S. W. Prescott; M. Ashokkumar; F. Grieser, Ultrason. Sonochem. 15, 89 (2008). 21 K. S. Suslick; G. J. Price, Annu. Rev. Mater. Sci. 29, 295 (1999). 22 K. S. Suslick; D. J. Casadonte; S. J. Doktycz, Solid State Ionics 32/33, 444 (1989). 23 K. S. Suslick; S. B. Choe; A. A. Cichowlas; M. W. Grinstaff, Nature 353, 414 (1991). 24 Y. T. Shah; A. B. Pandit; V. S. Moholkar, Cavitation Reaction Engineering (Plenum Publishers,
New York, 1999). 25 J. M. Löning; C. Horst; U. Hoffmann, Ultrason. Sonochem. 9, 169 (2002). 26 P. R. Gogate; R. K. Tayal; A. B. Pandit, Curr. Sci. 91, 35 (2006). 27 T. J. Matula; R. A. Roy; P. D. Mourad; W. B. McNamara III; K. S. Suslick, Phys. Rev. Lett. 75,
2602 (1995). 28 Y. T. Didenko; K. S. Suslick, Nature 418, 394 (2002). 29 M. W. A. Kuijpers; M. F. Kemmere; J. T. F. Keurentjes, Ultrasonics 40, 675 (2002). 30 S. Arrojo; Y. Benito, Ultrason. Sonochem. 15, 203 (2008). 31 K. S. Suslick; M. M. Mdleleni; J. T. Ries, J. Am. Chem. Soc. 119, 9303 (1997). 32 P. R. Gogate; A. B. Pandit, Ultrason. Sonochem. 12, 21 (2005). 33 P. Senthil Kumar; M. Siva Kumar; A. B. Pandit; Chem. Eng. Sci. 55, 1633 (2000). 34 Y. Iida; K. Yasui; T. Tuziuti; M. Sivakumar; Y. Endo, Chem. Comm. 20, 2280 (2004). 35 A. J. Serzi; B. D. Storey; A. Pearson; J. R. Blake, Phys. Fluids 15, 2576 (2003). 36 G. J. Price; P. F. Smith, Polymer 34, 4111 (1993). 37 P. Wasserscheid; T. Welton, Ionic Liquids in Synthesis (Wiley‐VCH, Weinheim, 2003). 38 R. R. Deshmukh; R. Rajagopal; K. V. Srinivasan, Chem. Commun. 17, 1544 (2001). 39 R. Rajagopal; D. V. Jarikote; K. V. Srinivasan, Chem. Commun. 6, 616 (2002). 40 R. Rajagopal; K. V. Srinivasan, Ultrason. Sonochem. 10, 41 (2003). 41 A. R. Gholap; K. Venkatesan; T. Daniel; R. J. Lahoti; K. V. Srinivasan, Green. Chem. 5, 693
(2003). 42 J. L. Bravo; I. López; P. Cintas; G. Silvero; M. J. Arévalo, Ultrason. Sonochem. 13, 408 (2006). 43 M. M. Van Iersel; M. A. van Schilt; N. E. Benes; J. T. F. Keurentjes, in preparation. 44 J. Jacquemin; M. F. Costa Gomes; P. Husson; V. Majer, J. Chem. Thermodyn. 38, 490 (2006). 45 M. E. van Valkenburg; R. L. Vaughn; M. Williams; J. S. Wilkes; Thermochim. Acta 425, 181
(2005). 46 J. D. Oxley; T. Prozorov; K. S. Suslick, J. Am. Chem. Soc. 125, 11138 (2005). 47 P. M. Kanthale; M. Ashokkumar; F. Grieser, J. Phys. Chem. C 111, 18461 (2007). 48 P. J. Linstrom; W. G. Mallard, NIST Chemistry WebBook, NIST Standard Reference
Database Number 69, National Institute of Standards and Technology, Gaithersburg MD, 20899 (June 2005).
49 M. M. van Iersel; J. Cornel; N. E. Benes; J. T. F. Keurentjes, J. Chem. Phys. 126, 064508 (2007). 50 M. M. van Iersel; N. E. Benes; R. Mettin; D. Schwarzer; J. T. F. Keurentjes, in preparation. 51 M. W. A. Kuijpers; D. van Eck; M. F. Kemmere; J. T. F. Keurentjes, Science 298, 1969 (2002). 52 A. Moussatov; C. Granger; B. Dubus, Ultrason. Sonochem. 10, 191 (2003). 53 T. G. Leighton, The Acoustic Bubble (Academic Press, London, 1994). 54 M. T. Timko, Acoustic Emulsions of Liquid, Near‐Critical Carbon Dioxide and Water: Application
to Synthetic Chemistry through Reaction Engineering, PhD dissertation (Massachusetts Institute of Technology, 2004).
55 K. Makino; M. M. Mossoba; P. Riesz, J. Am. Chem. Soc. 104, 3537 (1982). 56 R. Wang; H. M. Cheung, J. Supercrit. Fluids 33, 269 (2005). 57 D. L. Goldfarb; H. R. Corti; F. Marken; R. G. Compton, J. Phys. Chem. A 102, 8888 (1998). 58 C. A. Eckert; C. L. Liotta; D. Bush; J. S. Brown; J. P. Hallett, J. Phys. Chem. B 108, 18108
(2004).
121
Chapter 8
59 Y. Enokida; S. A. El‐Fatah; C. M. Wai, Ind. Eng. Chem. Res. 41, 2282 (2002). 60 E. Riera; Y. Golás; A. Blanco; J. A. Gallego; M. Blasco; A. Mulet, Ultrason. Sonochem. 11, 241
(2004). 61 M. T. Timko, K. A. Smith, R. L. Danheiser, J. I. Steinfeld, J. W. Tester, AIChE J. 52, 1127
(2006). 62 S. Balachandran; S. E. Kentish; R. Mawson; M. Ashokkumar, Ultrason. Sonochem. 13, 471
(2006). 63 A. Hu; S. Zhao; H. Liang; T. Qiu; G. Chen, Ultrason. Sonochem. 14, 219 (2007). 64 D. Luo; T. Qiu; Q. Lu, J. Sci. Food. Agric. 87, 431 (2007).
122

Dankwoord
Dit proefschrift is het tastbare resultaat van 4 jaar promotieonderzoek, waarin ik zowel wetenschappelijk als maatschappelijk een hoop geleerd heb. Deze periode zou nooit zo leerzaam en prettig zijn geweest zonder de hulp van een groot aantal mensen.
Allereerst wil ik natuurlijk mijn promotor, Jos Keurentjes, bedanken voor de mogelijkheid om een promotieonderzoek binnen zijn groep uit te voeren. Jos, bedankt voor het vertrouwen dat je in mij gesteld hebt en de vrijheid die je mij in mijn onderzoek gegeven hebt. Niet al mijn (soms wilde) ideeën zijn even succesvol gebleken, maar ik heb er zeker een hoop van geleerd. Ook ben ik veel dank verschuldigd aan mijn dagelijkse begeleider Nieck Benes. Nieck, ik heb onze manier van samenwerken altijd als heel prettig ervaren. Je daadkracht, onze oneindige discussies om onverklaarbare resultaten toch te verklaren en je altijd kritische blik hebben me zeker veel geholpen bij het schrijven van dit proefschrift. Daarnaast voelde je perfect aan hoe je mij moest motiveren als ik weer eens in een onderzoeksdipje zat. Ik wens je het allerbeste toe in je verdere wetenschappelijke carrière, waarbij ik je mee wil geven om ultrasoon geluid gerelateerde zaken zoveel mogelijk te vermijden.
Ook wil ik graag ‘mijn’ afstudeerders Jeroen Cornel, Emmy van der Heijden, Aukje van Houtum, Patrick Olsthoorn, Joey van Eekelen en Jean‐Paul van den Manacker bedanken voor hun inzet en bijdrage aan mijn promotieonderzoek. Ondanks dat niet alle resultaten van jullie werk beschreven staan in dit proefschrift, hebben jullie een flinke bijdrage geleverd aan mijn onderzoek. Ik hoop dan ook dat jullie met plezier terug kijken op je afstudeerwerk. Wil Kortsmit wil ik graag bedanken voor zijn hulp bij het implementeren van het beldynamica model in Mathematica en Paul Bloemen voor zijn hulp bij het opzetten en uitvoeren van de bellenwolk visualisatie experimenten. Hans Wijtvliet, Erwin Dekkers, en het overige personeel van de Gemeenschappelijke Technische Dienst ben ik veel dank verschuldigd voor hun altijd pragmatische aanpak. Ondanks jullie vakmanschap heeft de sferische resonator helaas niet opgeleverd waar we van tevoren op gehoopt hadden. Chris Luyk en Dolf van Liempt van onze eigen werkplaats wil ik ook graag bedanken voor hun inzet en creatieve oplossingen. I would like to thank Dr. Robert Mettin from the DPI‐institute in Göttingen for his hospitality
123
and the opportunity to use their facilities for the visualization experiments with carbon dioxide. Although we did not manage to explain all results, our high‐speed recordings have certainly helped me in the interpretation of other experimental results. Daarnaast wil ik Marcus van Schilt bedanken voor zijn hulp tijdens mijn onderzoek. Marcus, in het begin van mijn promotie hebben we aardig wat discussies gehad over de fundamentele kant van mijn project en deze discussies hebben zeker bijgedragen aan het resultaat zoals dat er nu ligt. Bovendien stond je deur ook altijd open als ik advies wilde over experimentele of andere praktische zaken. Tijdens je post‐doc periode hebben we nog eens laten zien dat onze typische manier van samenwerken wel degelijk vruchtbaar kan zijn.
Daarnaast zijn er een aantal mensen die een mindere tastbare, maar niet minder belangrijke, bijdrage hebben geleverd aan de totstandkoming van dit proefschrift. Allereerst wil ik de collega’s en ex‐collega’s van SPD bedanken voor het scheppen van zo’n fijne werksfeer. Met name Marcus, Johan, Micky, Leon, Stefan, Ana, Ard, Zwannet en Thijs wil ik bedanken voor de vele koffiepauzes, onze manier van sport bedrijven en de studiereizen naar Brazilië en Zuid‐Afrika. Micky, bedankt voor de prettige samenwerking tijdens het organiseren van de studiereis naar Zuid‐Afrika. Mede door het gebruik van allerlei handige overzichtjes hebben we naar mijn idee een leuke en leerzame studiereis verzorgd. Bovendien hebben onze si’s ervoor gezorgd dat ik iedere dag mijn opstartproblemen wist te overwinnen.
De mensen van buiten de TU/e hebben natuurlijk ook voor de noodzakelijke afleiding en steun gezorgd. Carlijn, jouw steun heeft me erg veel geholpen tijdens het moeizame begin van mijn promotieonderzoek en ik wil je daar dan ook van harte voor bedanken. Verder wil ik de PiPo‐club (Arno, Clemens, Koen, Maurits, Peter, Pim en Tom) en Roel bedanken voor alle gezellige dingen die we samen gedaan hebben. Bedankt jongens! Tom, jou wil ik in het bijzonder nog even bedanken voor je altijd luisterende oor zowel ten aanzien van mijn promotie als ook daarbuiten. Tenslotte wil ik mijn ouders en Denise bedanken voor de goede zorgen en de steun die jullie mij altijd gegeven hebben!
124

Curriculum Vitae
Maikel van Iersel was born on June 29, 1980 in Tilburg. After obtaining his VWO diploma (cum laude) from the Theresialyceum, he started his studies Chemical Engineering and Chemistry at the Eindhoven University of Technology in September 1998. In 2004 he obtained his MSc degree (cum laude) after completing his graduation project involving the copolymerization of cyclohexene oxide and carbon dioxide for the production of aliphatic polycarbonates. The graduation project was performed within the Process Development Group and he decided to perform his doctoral research in the same group under the supervision of prof. dr. ir. J.T.F. Keurentjes and dr. ir. N.E. Benes. The most important findings of his PhD research are reported in this thesis. Since the 1st of August 2008 he works for AkzoNobel as an innovation technologist for the business unit Base Chemicals. Maikel van Iersel werd op 29 juni 1980 geboren te Tilburg. Na het behalen van zijn VWO diploma (met lof) op het Thersialyceum startte hij in september 1998 aan de opleiding Scheikundige Technologie aan de Technische Universiteit Eindhoven. In 2004 behaalde hij de ingenieurstitel (met lof) na het voltooien van zijn afstudeeropdracht met als onderwerp de copolymerisatie van cyclohexeenoxide en kooldioxide voor de productie van alifatische polycarbonaten. Zijn afstudeeronderzoek werd uitgevoerd binnen de capaciteitsgroep Procesontwikkeling en hij besloot om zijn promotieonderzoek uit te voeren binnen dezelfde groep onder begeleiding van prof. dr. ir. J.T.F. Keurentjes en dr. ir. N.E. Benes. De belangrijkste bevinden van zijn promotieonderzoek staan beschreven in dit proefschrift. Vanaf 1 augustus 2008 werkt hij voor AkzoNobel als innovatie technoloog binnen de business unit Base Chemicals.
125
