sensitivities in rock mass properties
TRANSCRIPT
Title of the journal. Volume X – no X/2002, pages 1 to n
Sensitivities in rock mass properties
A DEM insight
Cédric Lambert* — John Read**
* Department of Civil and Natural Resources Engineering,
University of Canterbury
Private Bag 4800, Christchurch 8140, New Zealand
** CSIRO, Earth Science and Resource Engineering
Queensland Centre for Advanced Technologies
PO Box 883, Kenmore QLD 4069, Australia
ABSTRACT. This work proposes to look at the variation of some engineering properties of a
rock mass (strength and stiffness) with respect to some structural and mechanical properties.
Based on standard laboratories properties and field measurements, a discrete element model
of a particular rock mass has been generated using the Synthetic Rock Mass approach (SRM).
Large scale specimens are generated combining DEM to represent the rock and 3D discrete
fracture network models to represent the structure pattern. The specimens of rock mass are
then numerically tested. Series of compression tests have been performed on different samples
varying loading direction, sample size, intact rock strength, joint size and joint spacing.
Results of the simulations are presented here and sensitivity of the rock mass mechanical
properties to these parameters is discussed.
RÉSUMÉ. Ce travail propose d’étudier la variation de propriétés mécaniques d’un massif
rocheux avec certaines caractéristiques géologiques et mécaniques. Une approche dite «
Synthetic Rock Mass » (SRM) a été utilisée pour développer un modèle éléments discrets du
massif rocheux. Ces modèles SRM sont élaborés sur la base de propriétés mesurées in situ ou
en laboratoire. Cette méthode permet de construire et de tester numériquement des
échantillons de roche de grande échelle pour lesquels la fracturation naturelle du massif est
introduite. Plusieurs séries d’essais numériques de compression simple ont ainsi été réalisées
pour différentes valeurs de la résistance à la compression simple de la roche intacte,
différents tailles et espacements des discontinuités. Les résultats de ces essais sont présentés
et la sensibilité des propriétés mécaniques du massif rocheux discutée.
KEY WORDS: DEM, jointed rock mass, anisotropy, scale effects
MOTS-CLÉS: MED, massifs rocheux fracturés, anisotropie, effets d’échelle
Sensitivities in rock mass properties 2
1. Introduction
A fundamental characteristic of jointed rock mass is the presence of structural
defects. These geological structures vary in nature (joints, faults, bedding planes)
and in scale (from centimetres to hundreds of meters). Being a key component of
rock masses, they affect the geomechanical behaviour of jointed rock. Extrapolating
field measurements and laboratory testing results to geotechnical properties of
jointed rock mass is a challenging exercise and practitioners usually refer to
empirical classification systems (e.g. RMR, GSI). The recent development of the
synthetic rock mass approach (SRM) and other equivalent is offering new
perspectives in our understanding of rock mass behaviour. The SRM approach is a
methodology that has been developed by Pierce et al. (2007) within PFC3D in order
to predict the mechanical behaviour of jointed rock masses. The methodology
involves the construction and testing of a 3D SRM sample. SRM samples represent
the rock mass as an assembly of bonded particles where a joint network is
introduced as a series of disc-shaped fractures. The methodology describes the joints
behaviour using a smooth joint model. This approach brings together the benefits of
two methods, the bonded particle model proposed by Potyondy and Cundall (2004)
to simulate intact rock and DFN simulations to construct a 3D joint pattern ( Rogers
et al., 2009; Elmouttie et al., 2010). Many different loading paths can then be
applied to SRM samples of different shapes to predict the behaviour of the rock
mass. Using only data obtained from standard rock mass characterisation methods,
the methodology has proven its ability to reproduce a wide range of typical
behaviours of a rock mass. For a detailed description of the methodology one can
refer to Pierce et al. (2007) or Mas Ivars et al. (2008). In the present work, the SRM
methodology has been used to study the rock mass mechanical properties in a
complex geological environment. The models have been developed using real mine
data, coming from an open pit mine in Western Australia. A particular emphasis has
been made on one geotechnical domain, namely 1900S1. Sensitivities of the
mechanical properties of the SRM models are presented and effects of lithology,
joint size and fracture frequency are discussed.
2. Development of the Discrete Fracture Network model
2.1. Discrete fracture network generation
Discrete Fracture Network (DFN) modelling provides powerful means of
representing fracture systems based on available structural data. These stochastic
approaches aim at generating representative models of the structural conditions,
observed in the field, accounting for structural data coming borehole, scan lines or
window mapping. Structural information from one geotechnical domain, namely
1900S1, has been used to develop a DFN using JointStats, a discontinuity data
management system developed at the University of Queensland (JKMRC, 2000).
Sensitivities in rock mass properties 3
Joints are assumed to be circular discs distributed according to a Poisson process.
The persistence of joints is estimated from trace length information. Once a shape
for the size distribution has been chosen (log normal, exponential or beta
distribution), the parameters of the distribution are fitted using the maximum
likelihood theory (Lyman, 2003). To ensure that the fracture frequencies are also in
agreement with the logged data, JointStats returns a value of the density of the joints
in space (number of joint centres per cubic meter). In broad terms, the observed
shapes of the trace length distributions on the various scan lines will determine the
persistence parameters and the numbers of traces will control the value of the joint
density.
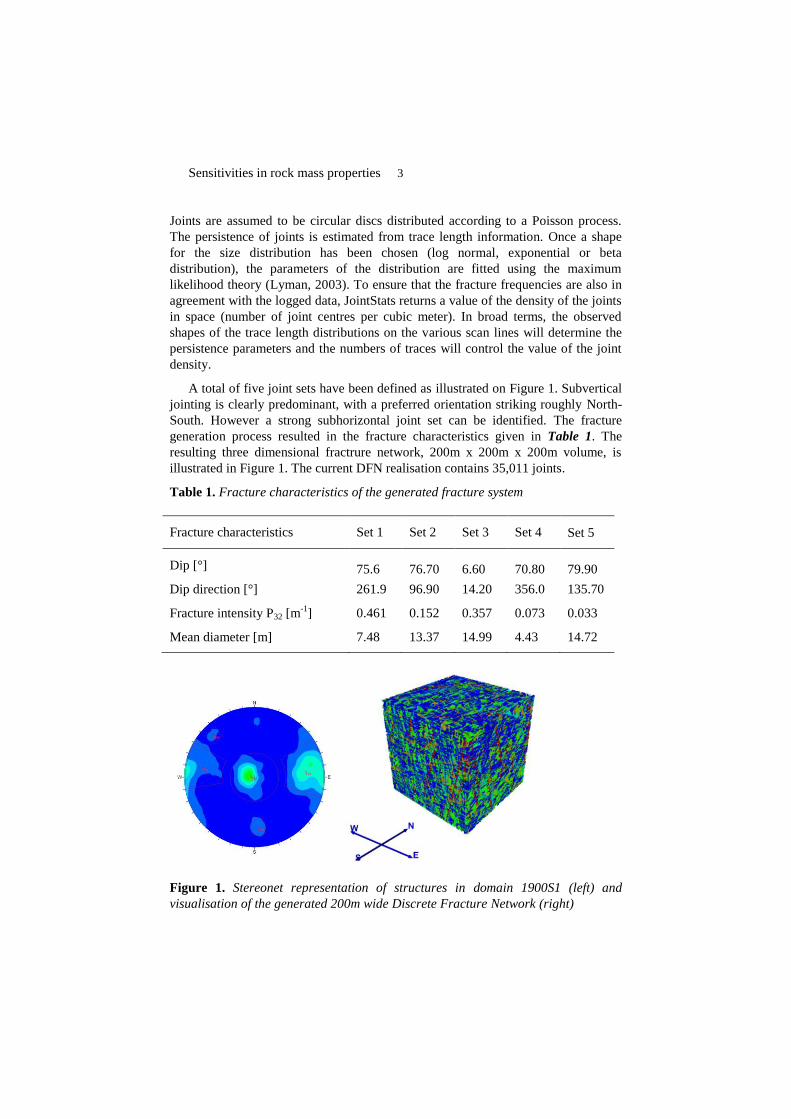
A total of five joint sets have been defined as illustrated on Figure 1. Subvertical
jointing is clearly predominant, with a preferred orientation striking roughly North-
South. However a strong subhorizontal joint set can be identified. The fracture
generation process resulted in the fracture characteristics given in Table 1. The
resulting three dimensional fractrure network, 200m x 200m x 200m volume, is
illustrated in Figure 1. The current DFN realisation contains 35,011 joints.
Table 1. Fracture characteristics of the generated fracture system
Fracture characteristics Set 1 Set 2 Set 3 Set 4 Set 5
Dip [°] 75.6 76.70 6.60 70.80 79.90
Dip direction [°] 261.9 96.90 14.20 356.0 135.70
Fracture intensity P32 [m-1
] 0.461 0.152 0.357 0.073 0.033
Mean diameter [m] 7.48 13.37 14.99 4.43 14.72
Figure 1. Stereonet representation of structures in domain 1900S1 (left) and
visualisation of the generated 200m wide Discrete Fracture Network (right)
Sensitivities in rock mass properties 4
The joints will be represented as planar surfaces with the newly developed
smooth joint contact model (Itasca, 2008). In this new contact scheme, a sliding
plane is introduced through a dip and dip direction for each contact between
particles that lie upon opposite sides of the specified plane. This plane defines the
general direction of sliding of the particles which are set free to overlap each-other.
This new formulation has proven its ability to capture the behaviour of jointed rock
masses (Pierce et al., 2007; Deisman et al., 2010; Esmaieli et al., 2010) and the
behaviour of rock joints (Lambert and Coll, 2010). Joints have been considered to be
purely frictional (no cohesion) with a friction angle of 30°. Normal and shear
stiffness have been set to 150e9 Pa/m and 20e9 Pa/m respectively. No dilation has
been introduced in the description. The same mechanical properties were assigned to
all fractures.
3. Development of an equivalent rock mass model
The general workflow of the Synthetic Rock Mass approach consists of
generating a Discrete Fracture Network (DFN) model incorporating all the joint
attributes (e.g. spacing, trace length and orientation). The DFN closely represents
the true rock mass fabric/structure. The intact rock blocks/bridges between the
structures (e.g. joints) are represented as an assembly of spherical bonded particles.
Large rock mass samples are hence numerically constructed and tested under many
loading conditions (confining stress, loading directions, sample size). The results
provide directional constitutive behaviour at different scales, which can then be used
for more conventional engineering analysis.
3.1. Properties
Intact rock has been modelled as a bonded particle assembly using PFC3D.
Microproperties have been calibrated for each rock type against laboratory test
results using standard sample generation and testing procedures (Potyondy and
Cundall, 2004). The DFN presented in section 2 unveils a maximum fracture
frequency, or joint frequency, of 0.61 in an East-West direction (0.18 North-South
and 0.54 vertically). The maximum fracture frequency relates to the typical
minimum size of a rock bridge in the rock mass (i.e. average size of pieces of intact
rock). The E-W direction exhibits the smallest average rock bridge size, 1.64m.
Numerical specimens of a similar size are used for the calibration of
microproperties. Behaviour of rock bridges will hence match the behaviour of intact
rock, estimated through standard laboratory testing. 2m x 2m x 4m core specimen
have been used for the calibration with a minimum particle radius of 0.2m and a
maximum to minimum ratio of 1.66 resulting in a particle resolution (i.e. number of
particle across the width of the sample) of 4. For each rock type microproperties
have been adjusted until a reasonable match between the behaviour of the particle
assembly and the target properties, as given in Table 2.
Sensitivities in rock mass properties 5
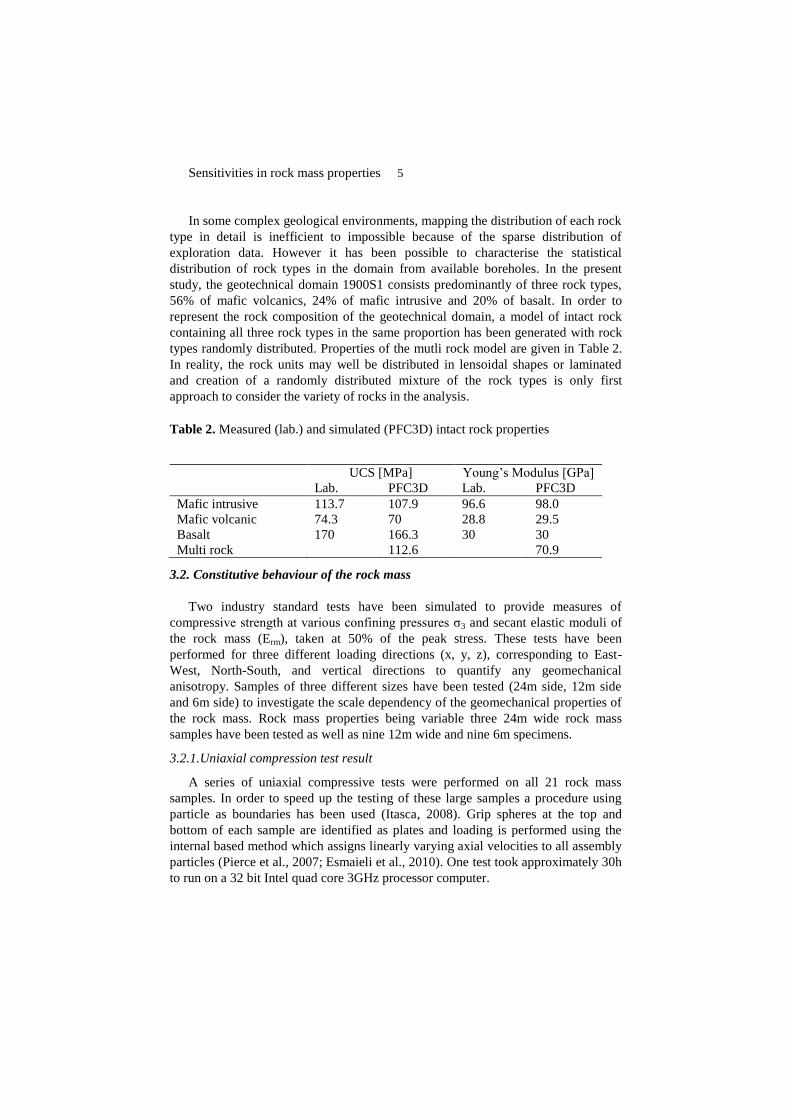
In some complex geological environments, mapping the distribution of each rock
type in detail is inefficient to impossible because of the sparse distribution of
exploration data. However it has been possible to characterise the statistical
distribution of rock types in the domain from available boreholes. In the present
study, the geotechnical domain 1900S1 consists predominantly of three rock types,
56% of mafic volcanics, 24% of mafic intrusive and 20% of basalt. In order to
represent the rock composition of the geotechnical domain, a model of intact rock
containing all three rock types in the same proportion has been generated with rock
types randomly distributed. Properties of the mutli rock model are given in Table 2.
In reality, the rock units may well be distributed in lensoidal shapes or laminated
and creation of a randomly distributed mixture of the rock types is only first
approach to consider the variety of rocks in the analysis.
3.2. Constitutive behaviour of the rock mass
Two industry standard tests have been simulated to provide measures of
compressive strength at various confining pressures σ3 and secant elastic moduli of
the rock mass (Erm), taken at 50% of the peak stress. These tests have been
performed for three different loading directions (x, y, z), corresponding to East-
West, North-South, and vertical directions to quantify any geomechanical
anisotropy. Samples of three different sizes have been tested (24m side, 12m side
and 6m side) to investigate the scale dependency of the geomechanical properties of
the rock mass. Rock mass properties being variable three 24m wide rock mass
samples have been tested as well as nine 12m wide and nine 6m specimens.
3.2.1. Uniaxial compression test result
A series of uniaxial compressive tests were performed on all 21 rock mass
samples. In order to speed up the testing of these large samples a procedure using
particle as boundaries has been used (Itasca, 2008). Grip spheres at the top and
bottom of each sample are identified as plates and loading is performed using the
internal based method which assigns linearly varying axial velocities to all assembly
particles (Pierce et al., 2007; Esmaieli et al., 2010). One test took approximately 30h
to run on a 32 bit Intel quad core 3GHz processor computer.
UCS [MPa] Young’s Modulus [GPa]
Lab. PFC3D Lab. PFC3D
Mafic intrusive 113.7 107.9 96.6 98.0
Mafic volcanic 74.3 70 28.8 29.5
Basalt 170 166.3 30 30
Multi rock 112.6 70.9
Table 2. Measured (lab.) and simulated (PFC3D) intact rock properties

Sensitivities in rock mass properties 6
24m rock mass specimens can be seen in Figure 2. The distinct levels of shading
correspond to contiguous blocks, within which any particles can be reached from
any other via one or more intact bonds. Between such blocks there are unbounded
contacts. Between such blocks, there unbounded contacts associated with joint
segments. During loading, samples become more fragmented as bonds break.
Although a block is identified with uniform shading, it may contain many dead-end
fractures, or partially through going, that may extend during loading.
Figure 2 shows the stress strain plots for three 24m wide rock mass samples. The
fracture patterns were taken from different locations of the same DFN realisation
and are referred to as A, B and C. The models exhibited a fracture intensity ranging
from 1.96 m-1
to 2.37 m-1
and a number of individual blocks ranging from 548 to
927. Samples B and C show a similar peak strength, 31.6 MPa and 31.1 MPa
respectively, and a similar secant Young’s modulus, 31 GPa and 26.7 GPa
respectively. Sample A exhibited higher peak strength, 53 MPa, and higher secant
Young’s modulus, 50 GPa. This variability can be attributed to the initial degree of
fracturation of the models as number of blocks and fracture intensity were
significantly lower for sample A.
3.2.2. Anisotropy
The strength of a rock mass cannot be defined only through its UCS. The SRM
samples have been submitted to a series of numerical triaxial compression tests at
various confining pressures (0, 2 and 10 MPa) from which a partial strength
Figure 2. Stress-strain plots during unconfined compression tests and
visualisation of 24m wide SRM specimens.
Sensitivities in rock mass properties 7
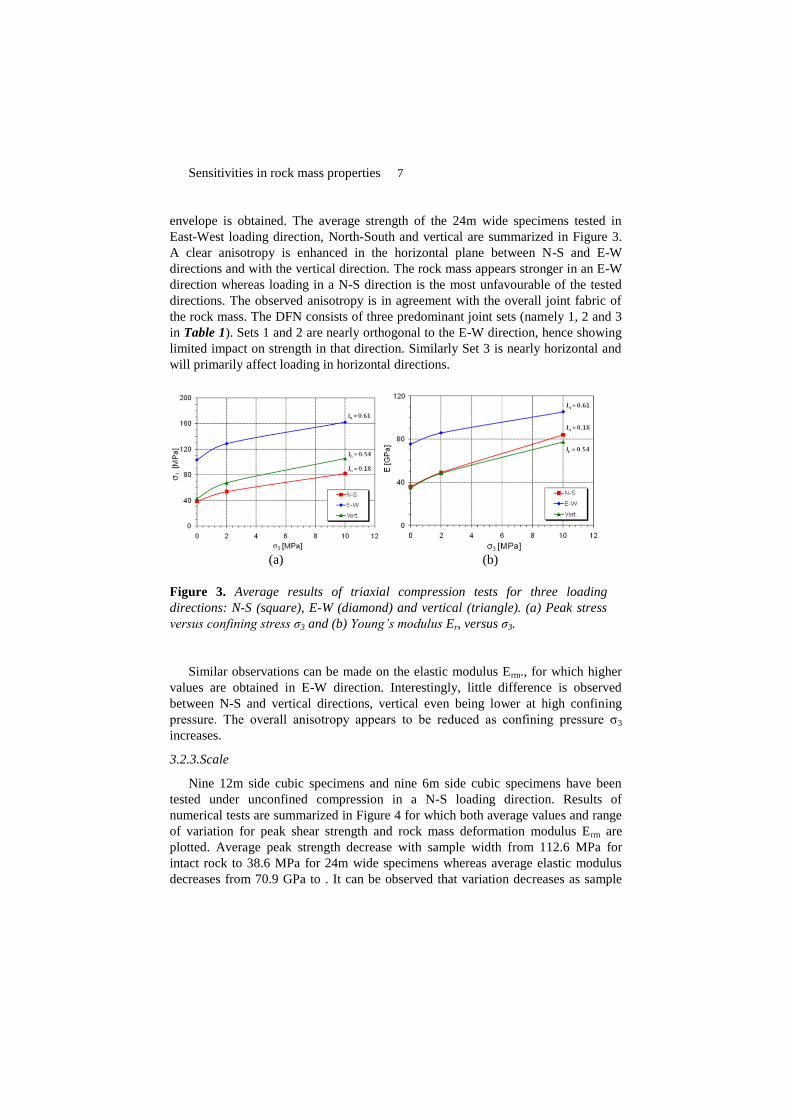
envelope is obtained. The average strength of the 24m wide specimens tested in
East-West loading direction, North-South and vertical are summarized in Figure 3.
A clear anisotropy is enhanced in the horizontal plane between N-S and E-W
directions and with the vertical direction. The rock mass appears stronger in an E-W
direction whereas loading in a N-S direction is the most unfavourable of the tested
directions. The observed anisotropy is in agreement with the overall joint fabric of
the rock mass. The DFN consists of three predominant joint sets (namely 1, 2 and 3
in Table 1). Sets 1 and 2 are nearly orthogonal to the E-W direction, hence showing
limited impact on strength in that direction. Similarly Set 3 is nearly horizontal and
will primarily affect loading in horizontal directions.
Similar observations can be made on the elastic modulus Erm., for which higher
values are obtained in E-W direction. Interestingly, little difference is observed
between N-S and vertical directions, vertical even being lower at high confining
pressure. The overall anisotropy appears to be reduced as confining pressure σ3
increases.
3.2.3. Scale
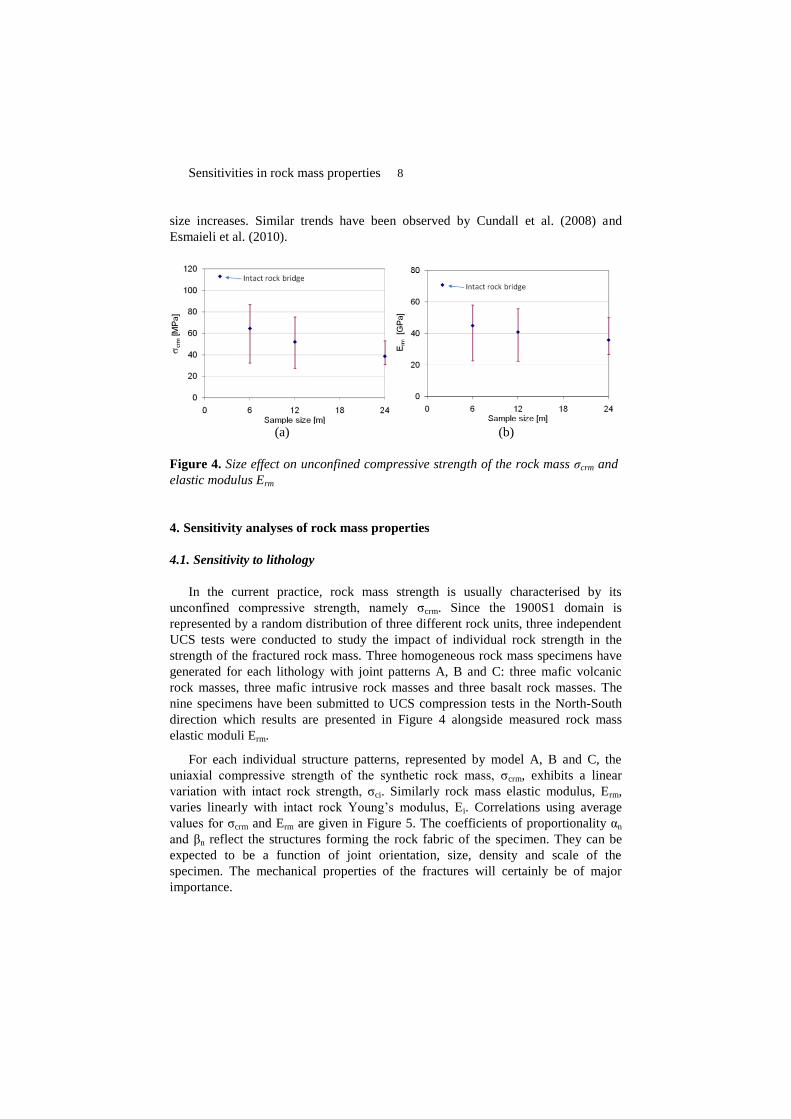
Nine 12m side cubic specimens and nine 6m side cubic specimens have been
tested under unconfined compression in a N-S loading direction. Results of
numerical tests are summarized in Figure 4 for which both average values and range
of variation for peak shear strength and rock mass deformation modulus Erm are
plotted. Average peak strength decrease with sample width from 112.6 MPa for
intact rock to 38.6 MPa for 24m wide specimens whereas average elastic modulus
decreases from 70.9 GPa to . It can be observed that variation decreases as sample
(a) (b)
Figure 3. Average results of triaxial compression tests for three loading
directions: N-S (square), E-W (diamond) and vertical (triangle). (a) Peak stress
versus confining stress σ3 and (b) Young’s modulus Er, versus σ3.
Sensitivities in rock mass properties 8
size increases. Similar trends have been observed by Cundall et al. (2008) and
Esmaieli et al. (2010).
4. Sensitivity analyses of rock mass properties
4.1. Sensitivity to lithology
In the current practice, rock mass strength is usually characterised by its
unconfined compressive strength, namely σcrm. Since the 1900S1 domain is
represented by a random distribution of three different rock units, three independent
UCS tests were conducted to study the impact of individual rock strength in the
strength of the fractured rock mass. Three homogeneous rock mass specimens have
generated for each lithology with joint patterns A, B and C: three mafic volcanic
rock masses, three mafic intrusive rock masses and three basalt rock masses. The
nine specimens have been submitted to UCS compression tests in the North-South
direction which results are presented in Figure 4 alongside measured rock mass
elastic moduli Erm.
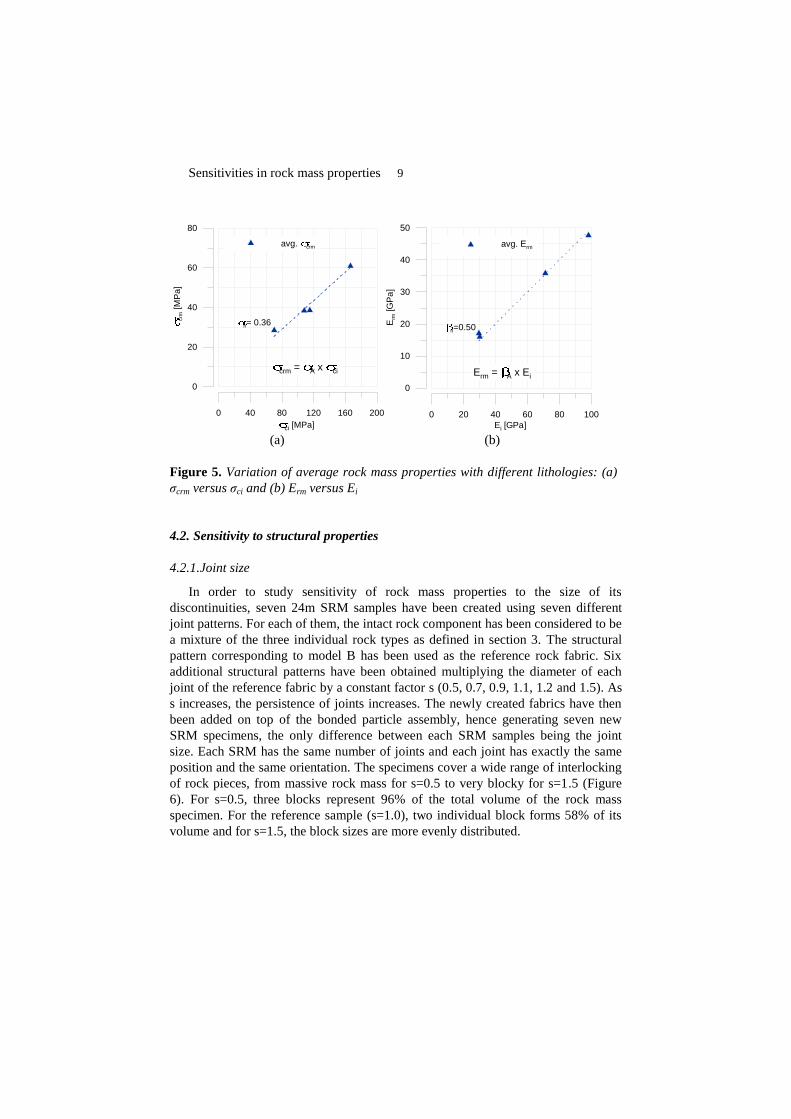
For each individual structure patterns, represented by model A, B and C, the
uniaxial compressive strength of the synthetic rock mass, σcrm, exhibits a linear
variation with intact rock strength, σci. Similarly rock mass elastic modulus, Erm,
varies linearly with intact rock Young’s modulus, Ei. Correlations using average
values for σcrm and Erm are given in Figure 5. The coefficients of proportionality αn
and βn reflect the structures forming the rock fabric of the specimen. They can be
expected to be a function of joint orientation, size, density and scale of the
specimen. The mechanical properties of the fractures will certainly be of major
importance.
(a) (b)
Figure 4. Size effect on unconfined compressive strength of the rock mass σcrm and
elastic modulus Erm
Sensitivities in rock mass properties 9
4.2. Sensitivity to structural properties
4.2.1. Joint size
In order to study sensitivity of rock mass properties to the size of its
discontinuities, seven 24m SRM samples have been created using seven different
joint patterns. For each of them, the intact rock component has been considered to be
a mixture of the three individual rock types as defined in section 3. The structural
pattern corresponding to model B has been used as the reference rock fabric. Six
additional structural patterns have been obtained multiplying the diameter of each
joint of the reference fabric by a constant factor s (0.5, 0.7, 0.9, 1.1, 1.2 and 1.5). As
s increases, the persistence of joints increases. The newly created fabrics have then
been added on top of the bonded particle assembly, hence generating seven new
SRM specimens, the only difference between each SRM samples being the joint
size. Each SRM has the same number of joints and each joint has exactly the same
position and the same orientation. The specimens cover a wide range of interlocking
of rock pieces, from massive rock mass for s=0.5 to very blocky for s=1.5 (Figure
6). For s=0.5, three blocks represent 96% of the total volume of the rock mass
specimen. For the reference sample (s=1.0), two individual block forms 58% of its
volume and for s=1.5, the block sizes are more evenly distributed.
0 40 80 120 160 200
ci [MPa]
0
20
40
60
80
crm
[M
Pa
]
avg. crm
n= 0.36
crm = A x ci
0 20 40 60 80 100
Ei [GPa]
0
10
20
30
40
50
Erm
[G
Pa
]
avg. Erm
Erm = A x Ei
n=0.50
(a) (b)
Figure 5. Variation of average rock mass properties with different lithologies: (a)
σcrm versus σci and (b) Erm versus Ei
Sensitivities in rock mass properties 10
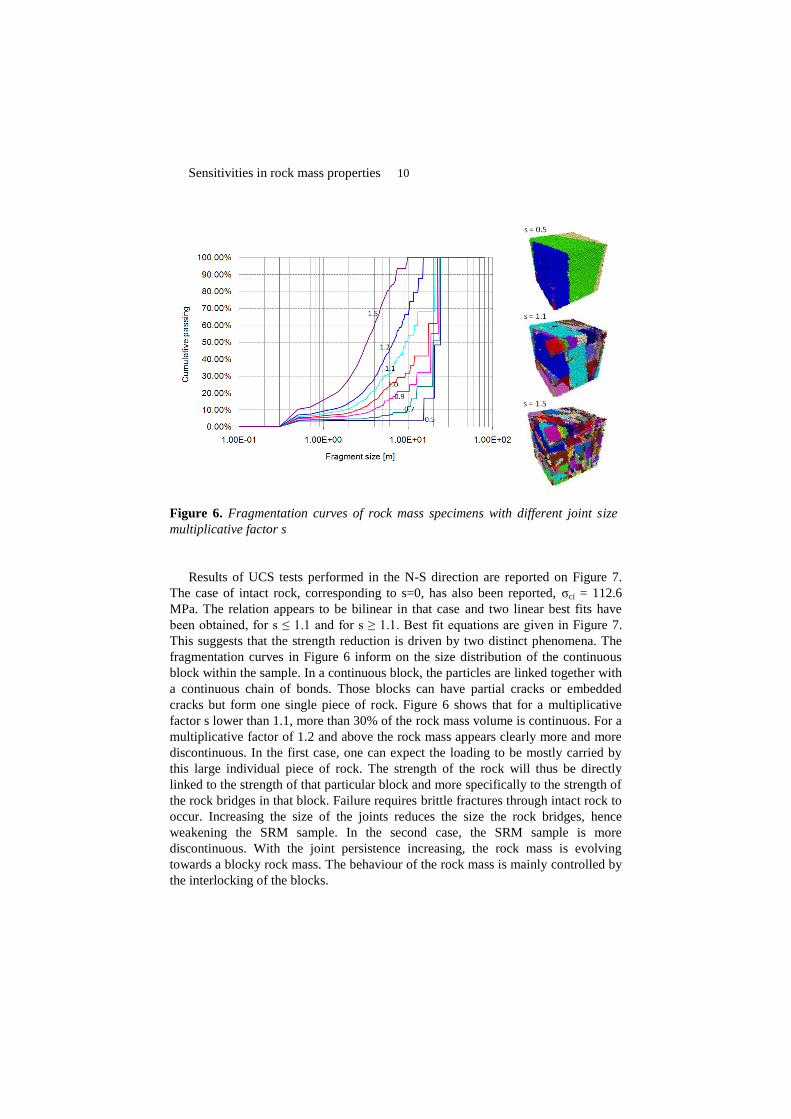
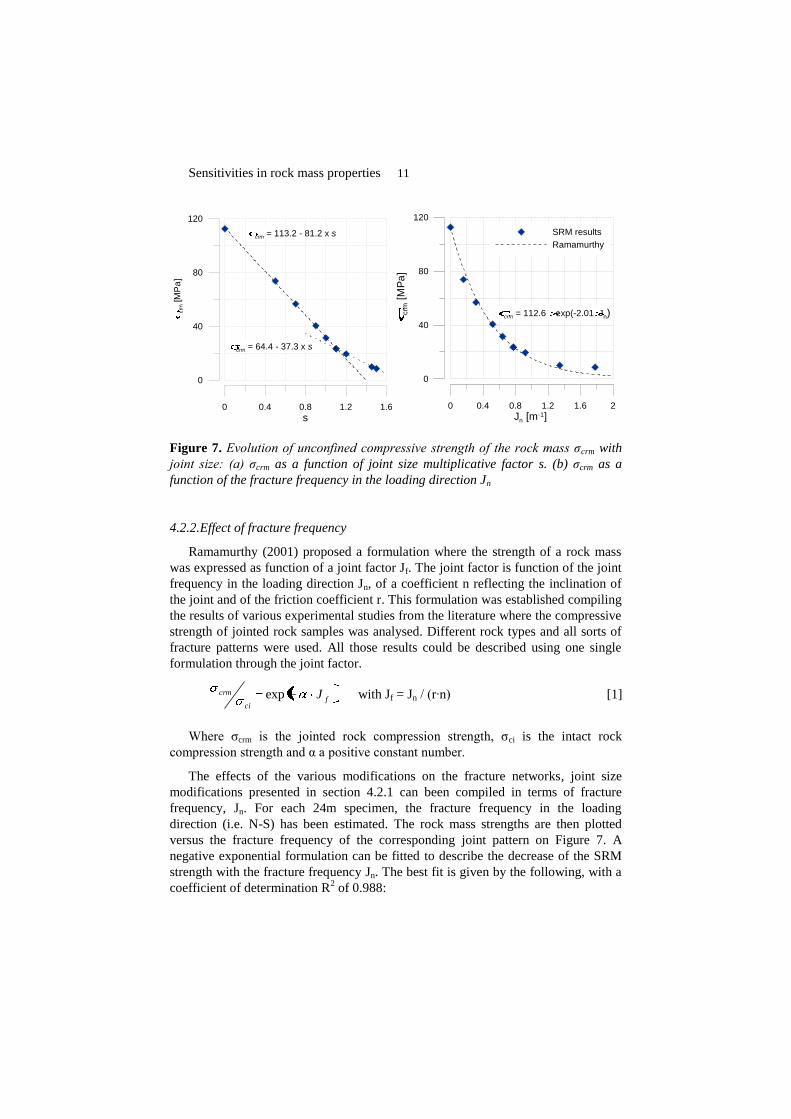
Results of UCS tests performed in the N-S direction are reported on Figure 7.
The case of intact rock, corresponding to s=0, has also been reported, σci = 112.6
MPa. The relation appears to be bilinear in that case and two linear best fits have
been obtained, for s ≤ 1.1 and for s ≥ 1.1. Best fit equations are given in Figure 7.
This suggests that the strength reduction is driven by two distinct phenomena. The
fragmentation curves in Figure 6 inform on the size distribution of the continuous
block within the sample. In a continuous block, the particles are linked together with
a continuous chain of bonds. Those blocks can have partial cracks or embedded
cracks but form one single piece of rock. Figure 6 shows that for a multiplicative
factor s lower than 1.1, more than 30% of the rock mass volume is continuous. For a
multiplicative factor of 1.2 and above the rock mass appears clearly more and more
discontinuous. In the first case, one can expect the loading to be mostly carried by
this large individual piece of rock. The strength of the rock will thus be directly
linked to the strength of that particular block and more specifically to the strength of
the rock bridges in that block. Failure requires brittle fractures through intact rock to
occur. Increasing the size of the joints reduces the size the rock bridges, hence
weakening the SRM sample. In the second case, the SRM sample is more
discontinuous. With the joint persistence increasing, the rock mass is evolving
towards a blocky rock mass. The behaviour of the rock mass is mainly controlled by
the interlocking of the blocks.
Figure 6. Fragmentation curves of rock mass specimens with different joint size
multiplicative factor s
Sensitivities in rock mass properties 11
0 0.4 0.8 1.2 1.6
s
0
40
80
120
crm
[M
Pa
]
crm = 113.2 - 81.2 x s
crm = 64.4 - 37.3 x s
0 0.4 0.8 1.2 1.6 2
Jn [m-1]
0
40
80
120
crm
[M
Pa
]
SRM results
Ramamurthy
crm = 112.6 exp(-2.01 Jn)
Figure 7. Evolution of unconfined compressive strength of the rock mass σcrm with
joint size: (a) σcrm as a function of joint size multiplicative factor s. (b) σcrm as a
function of the fracture frequency in the loading direction Jn
4.2.2. Effect of fracture frequency
Ramamurthy (2001) proposed a formulation where the strength of a rock mass
was expressed as function of a joint factor Jf. The joint factor is function of the joint
frequency in the loading direction Jn, of a coefficient n reflecting the inclination of
the joint and of the friction coefficient r. This formulation was established compiling
the results of various experimental studies from the literature where the compressive
strength of jointed rock samples was analysed. Different rock types and all sorts of
fracture patterns were used. All those results could be described using one single
formulation through the joint factor.
fci
crm Jexp with Jf = Jn / (r∙n) [1]
Where σcrm is the jointed rock compression strength, σci is the intact rock
compression strength and α a positive constant number.
The effects of the various modifications on the fracture networks, joint size
modifications presented in section 4.2.1 can been compiled in terms of fracture
frequency, Jn. For each 24m specimen, the fracture frequency in the loading
direction (i.e. N-S) has been estimated. The rock mass strengths are then plotted
versus the fracture frequency of the corresponding joint pattern on Figure 7. A
negative exponential formulation can be fitted to describe the decrease of the SRM
strength with the fracture frequency Jn. The best fit is given by the following, with a
coefficient of determination R2 of 0.988:
Sensitivities in rock mass properties 12
ncrm J01.2exp6.112 [2]
Where 112.6 corresponds to the compressive strength of the intact mixture σci
and Jn represents the joint fracture frequency in the North-South direction. The
results obtained with the SRM exhibit a qualitative match with Ramamurthy’s
formulation. However a significant difference persists regarding the exponential
constant (2.01 for the SRM and between 0.004 and 0.01 for Ramamurthy, 2001).
This difference cannot be explained only by the introduction of the coefficient n and
the friction r in the joint factor definition and requires further investigation.
5. Conclusions
The development of the SRM methodology and equivalents has been a step
forwards for the characterisation of the constitutive behaviour of a rock mass. In this
study, the SRM approach has been applied to complex mining environment where it
is not possible to divide geotechnical domains with respect to lithology. An
alternative approach has been developed combining the different rock types on the
basis of their relative proportion observed in the field. Typical behaviour of jointed
rock masses have been observed including fractures induced anisotropy, scale
dependence. The observed anisotropy in the constitutive behaviour of the SRM
samples was in agreement with the orientation of the joint sets introduced in the
model.
Sensitivity analyses have been performed on the mechanical properties of the
synthetic rock mass. Influences of lithology, joint size, spacing and frequency have
been investigated. Simulations have enhanced a strong linear relationship between
unconfined compression strengths of the rock mass σcrm and of its intact rock.
Similarly Young’s modulus of the rock mass has been observed to vary linearly with
Young’s modulus of intact rock. Another aspect that has been investigated is the
effect on rock mass behaviour of some parameters of the fracture network. SRM
samples varying joint size have been generated and tested. As expected the strength
of the rock mass decreased as joint size increased. The results show a bilinear
relation suggesting the decrease having two distinct sources. For small joints, failure
required brittle failure through rock bridges. Strength decrease was hence attributed
to the size reduction of rock bridges. For larger joints, the rock mass could be
described as blocky, limited brittle fracturing was required. Strength was attributed
mainly to interlocking. The relation between rock mass strength and joint frequency
could be described with a negative exponential, showing a qualitative agreement
with experimental data from the literature.
Sensitivities in rock mass properties 13
6. References
Cundall P.A., Pierce M.E., Mas Ivars D. « Quantifying the Size Effect of Rock Mass
Strength », in Proc. 1st Southern Hemisphere International Rock Mechanics Symposium,
Perth, 2008, p 3-15.
Deisman N., Mas Ivars D., Darcel C., Chalaturnyk R.J., « Empirical and numerical
approaches for geomechanical characterization of coal seam reservoirs », International
Journal of Coal Geology, 82, 2010, p. 2204-212.
Elmouttie M., Poropat G., Krähenbühl G., « Polyhedral modelling of underground
excavations », Computers and Geotechnics, 37, 2010, p. 529-535
Esmaieli K, Hadjigeorgiou J. and Grenon M. « Estimating geometrical and mechanical REV
based on synthetic rock mass models at Brunswick Mine », International Journal of Rock
Mechanics & Mining Sciences, 47, 2010, p 915-920.
Itasca Consulting Group Inc., Particle Flow Code in 3 Dimensions, Version 4.0, 2008.
JKMRC, JoinStats, Version 1.15, 2000.
Lambert C., Coll C., « A DEM approach to rock joint strength estimates », in Rock Slope
Stability in Open Pit Mining and Civil Engineering, Santiago,2009.
Lyman G.J., « Rock fracture mean trace length estimation and confidence interval calculation
using maximum likelihood methods », International Journal of Rock Mechanics &
Mining Sciences, 40(6), 2003, p. 825–832.
Mas Ivars D., Pierce M., DeGagnné D., Darcel C., « Anisotropy and scale dependency in
jointed rock-mass strength – A Synthetic Rock Mass Study », in Proceedings First
International FLAC/DEM Symposium on Numerical Modeling, Minneapolis, USA, 2008.
Pierce M., Cundall P., Potyondy D. and Mas Ivars D., « A Synthetic Rock Mass Model for
Jointed Rock », in Rock Mechanics: Meeting Society's Challenges and Demands, 1st
Canada–US Rock Mechanics Symposium, Vancouver, 2007, p. 341–349.
Potyondy D.O., Cundall, P.A. (2004) « A Bonded-Particle Model for Rock », International
Journal of Rock Mechanics & Mining Sciences, 41(8), pp. 1329–1364.
Ramamurthy, T., « Shear strength response of some geological materials in triaxial
compression », International Journal of Rock Mechanics & Mining Sciences, 38(5), 2001,
p. 683–697.
Rogers S., Elmo D., Beddoes R., Dershowitz W., « Mine scale DFN modelling and rapid
upscaling in geomechanical simulations of large open pits », in Proc. Rock Slope Stability
in Open Pit Mining and Civil Engineering, Stantiago, 2009.