sensor-based phenotyping technology facilitates science and breeding
TRANSCRIPT
LemnaTecTHE PHENOTYPING COMPANY
SINCE 1998
Sensor-based phenotyping technology facilitates science and breeding
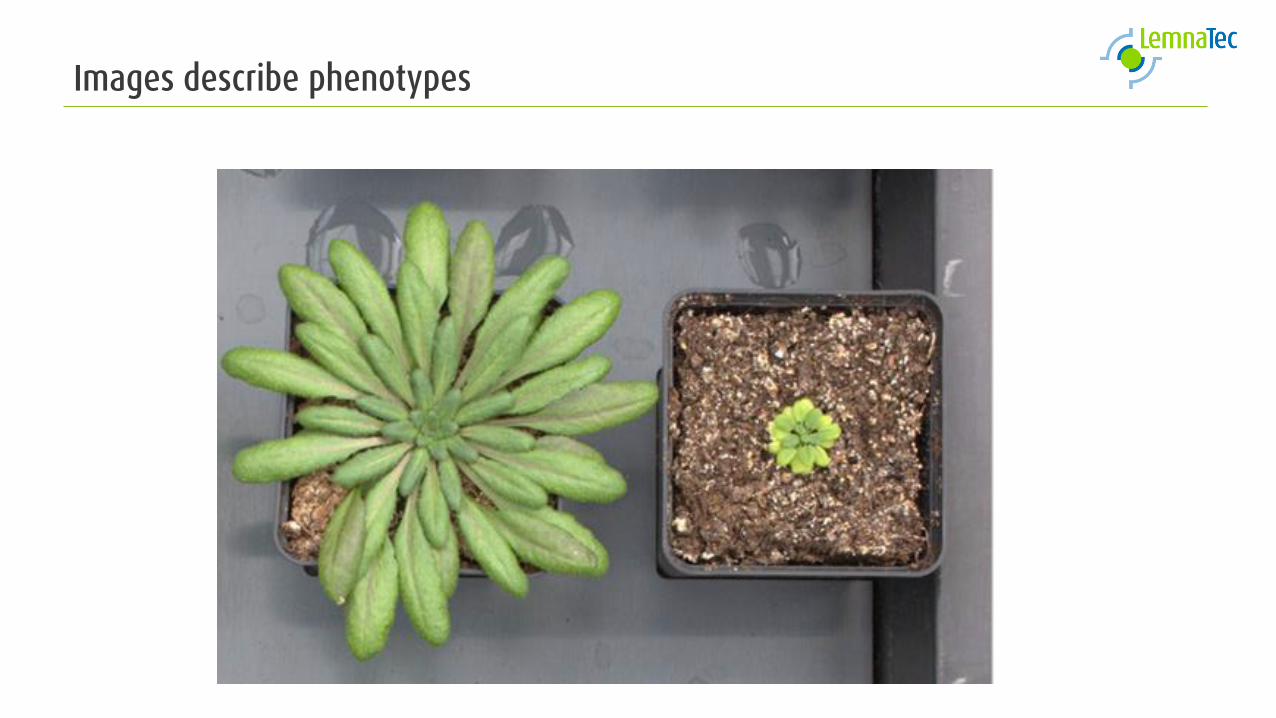
Images describe phenotypes
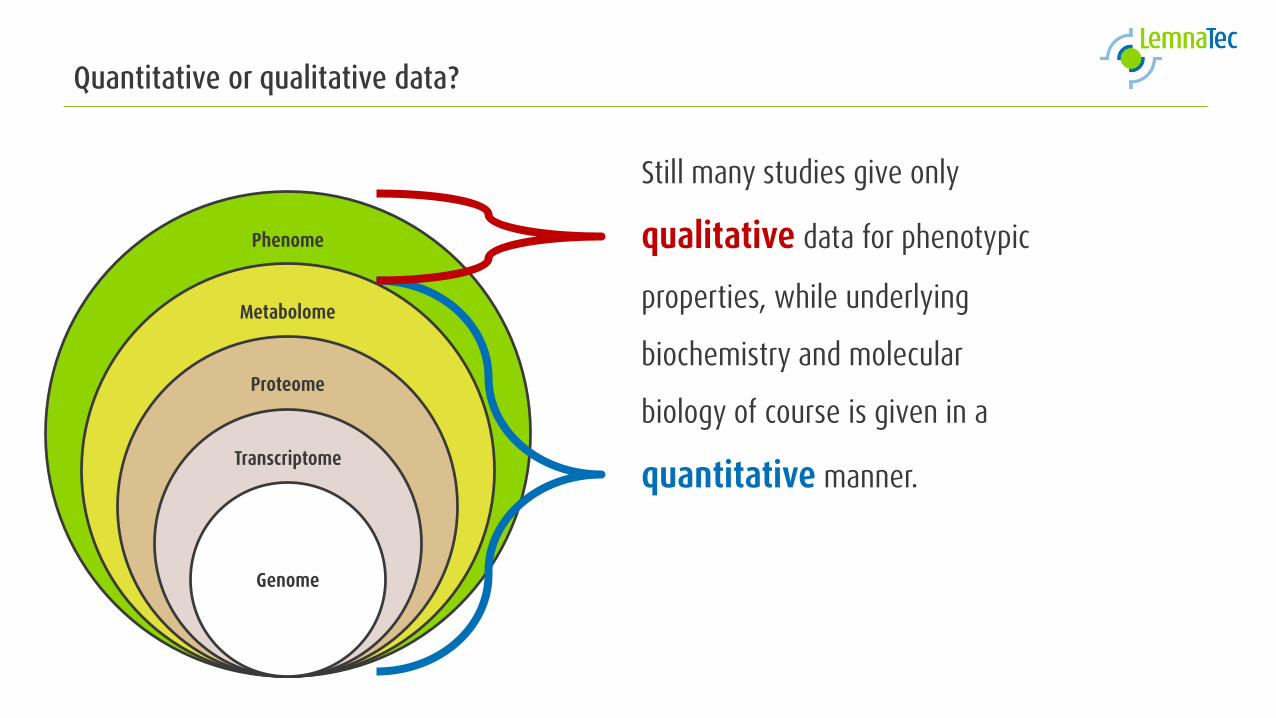
Quantitative or qualitative data?
Phenome
Metabolome
Proteome
Transcriptome
Genome
Still many studies give only
qualitative data for phenotypic
properties, while underlying
biochemistry and molecular
biology of course is given in a
quantitative manner.
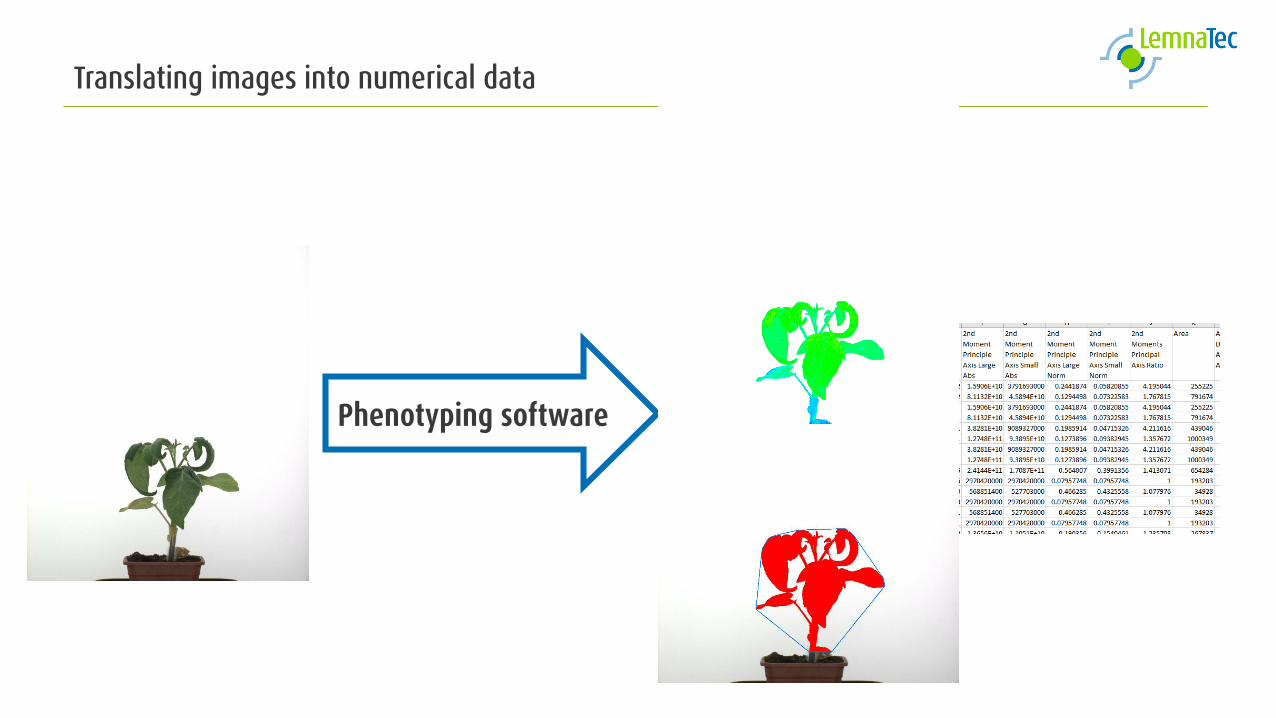
Phenotyping software
Translating images into numerical data
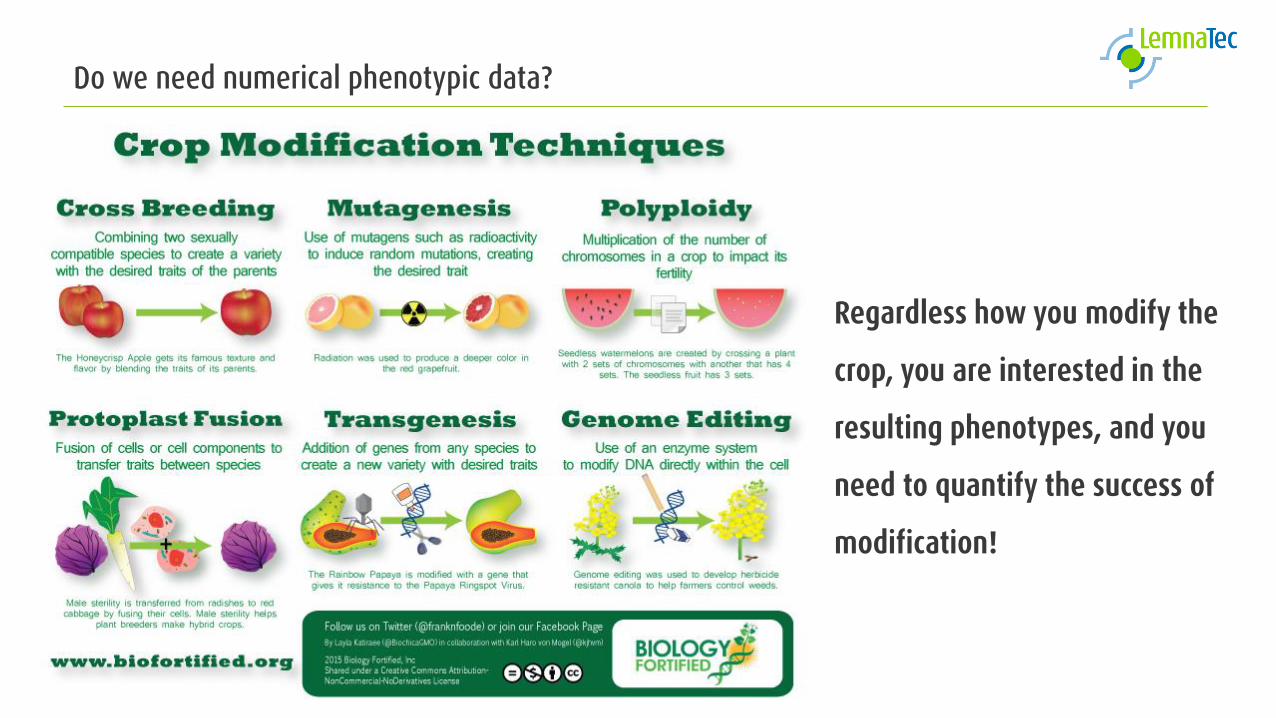
Do we need numerical phenotypic data?
Regardless how you modify the
crop, you are interested in the
resulting phenotypes, and you
need to quantify the success of
modification!
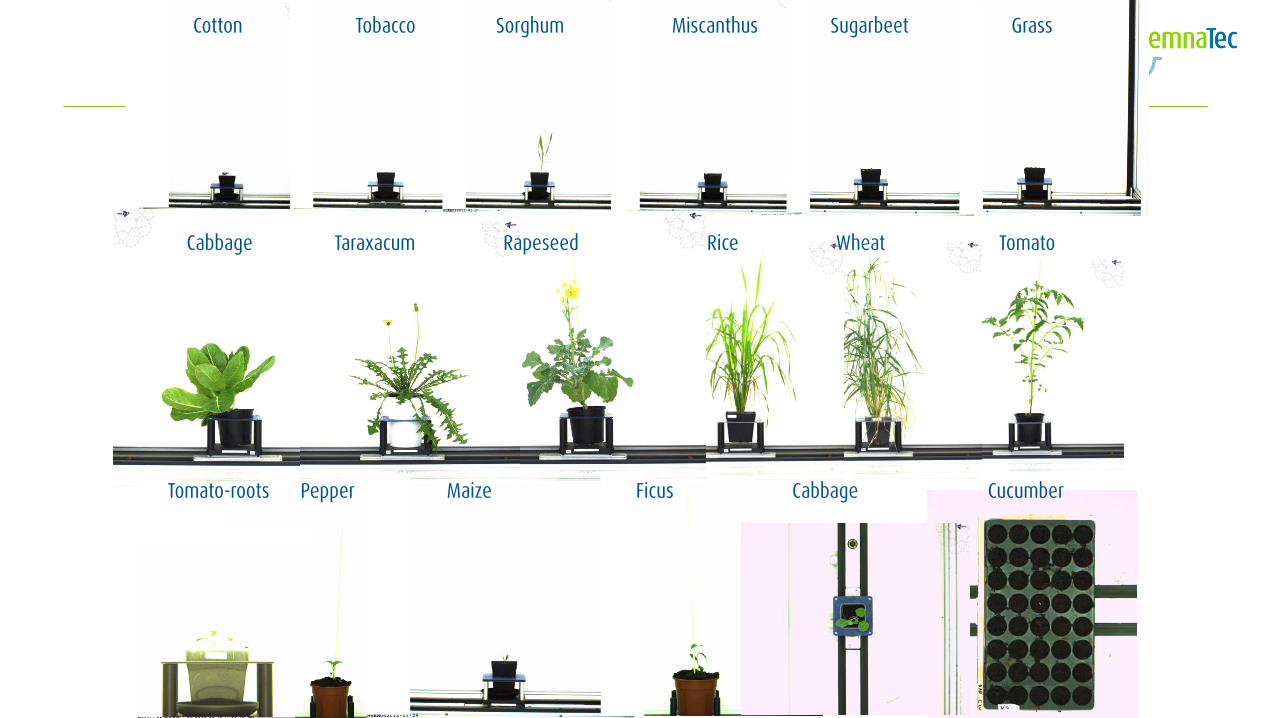
Cabbage Taraxacum Rapeseed Rice Wheat Tomato
Tomato-roots Pepper Maize Ficus Cabbage Cucumber
Cotton Tobacco Sorghum Miscanthus Sugarbeet Grass
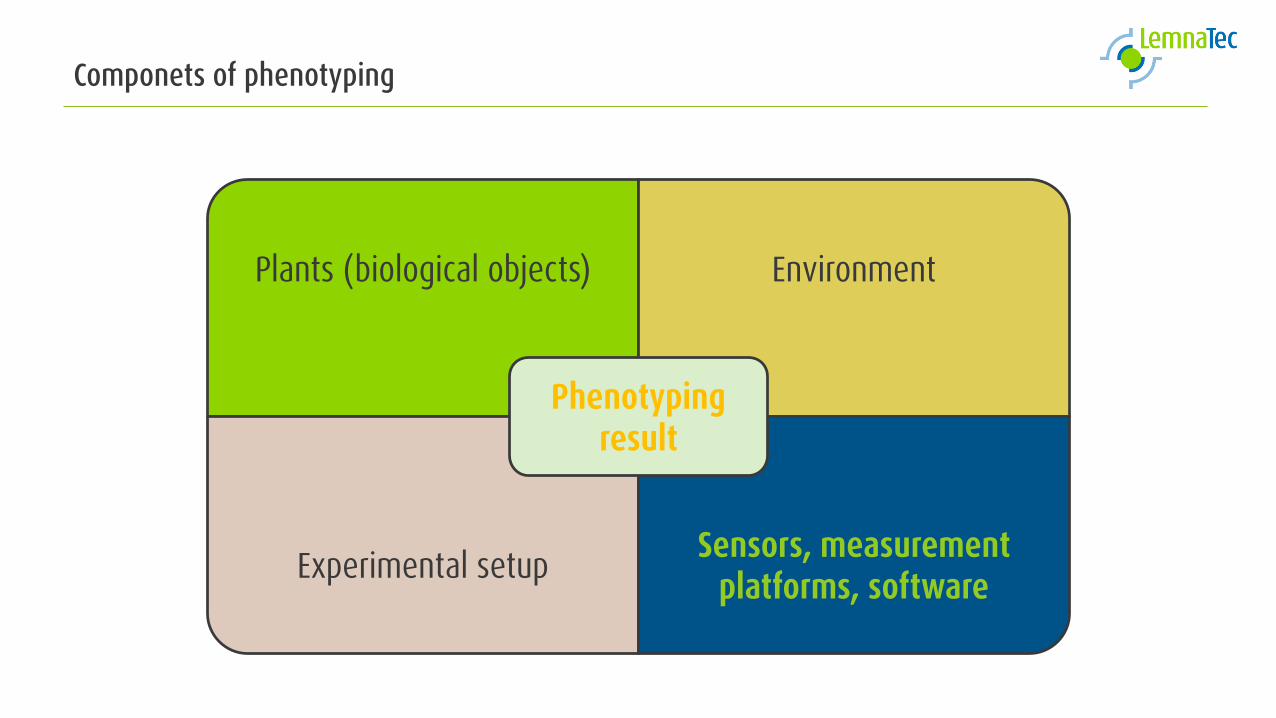
Componets of phenotyping
Plants (biological objects) Environment
Experimental setupSensors, measurement
platforms, software
Phenotyping result
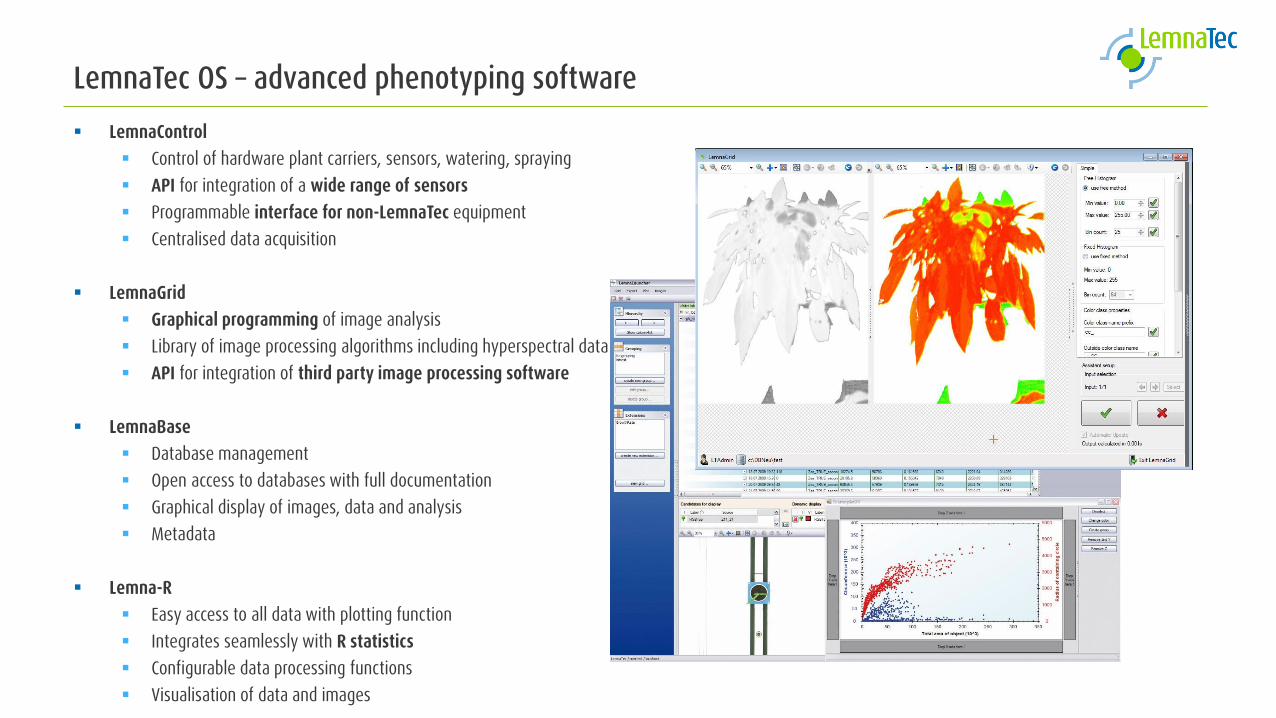
LemnaTec OS – advanced phenotyping software
LemnaControl
Control of hardware plant carriers, sensors, watering, spraying
API for integration of a wide range of sensors
Programmable interface for non-LemnaTec equipment
Centralised data acquisition
LemnaGrid
Graphical programming of image analysis
Library of image processing algorithms including hyperspectral data
API for integration of third party image processing software
LemnaBase
Database management
Open access to databases with full documentation
Graphical display of images, data and analysis
Metadata
Lemna-R
Easy access to all data with plotting function
Integrates seamlessly with R statistics
Configurable data processing functions
Visualisation of data and images
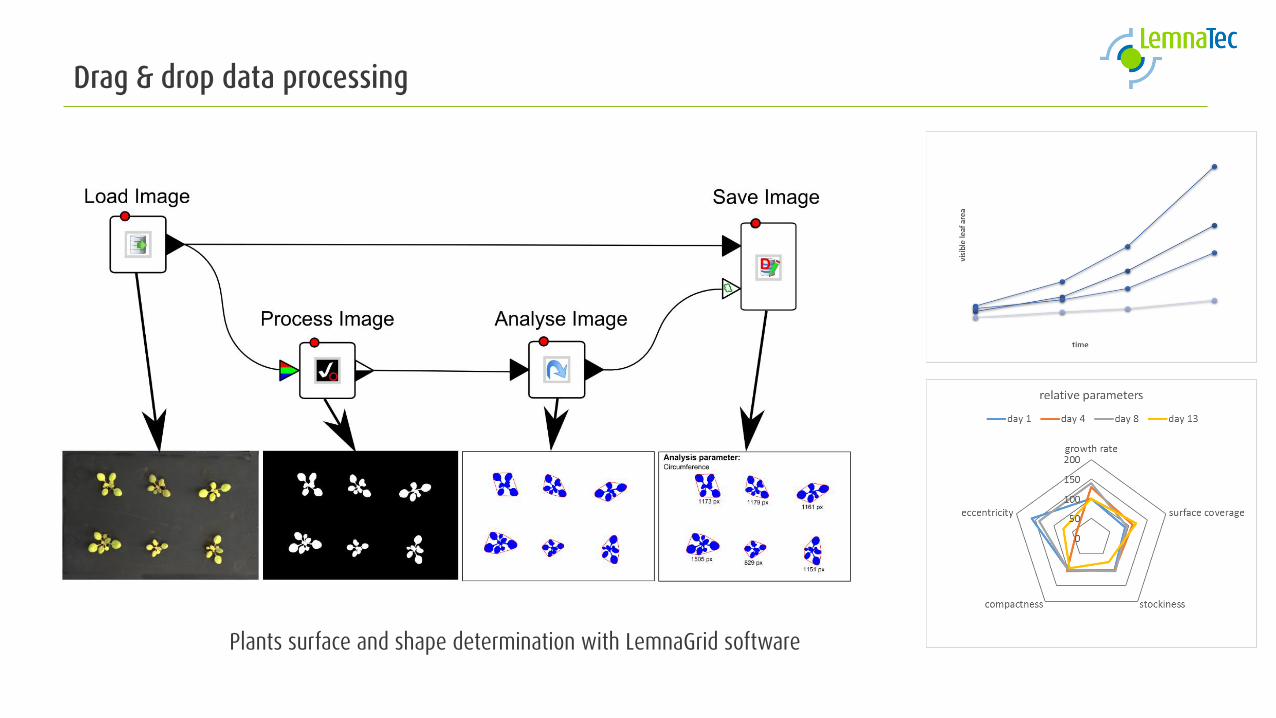
Drag & drop data processing
Plants surface and shape determination with LemnaGrid software
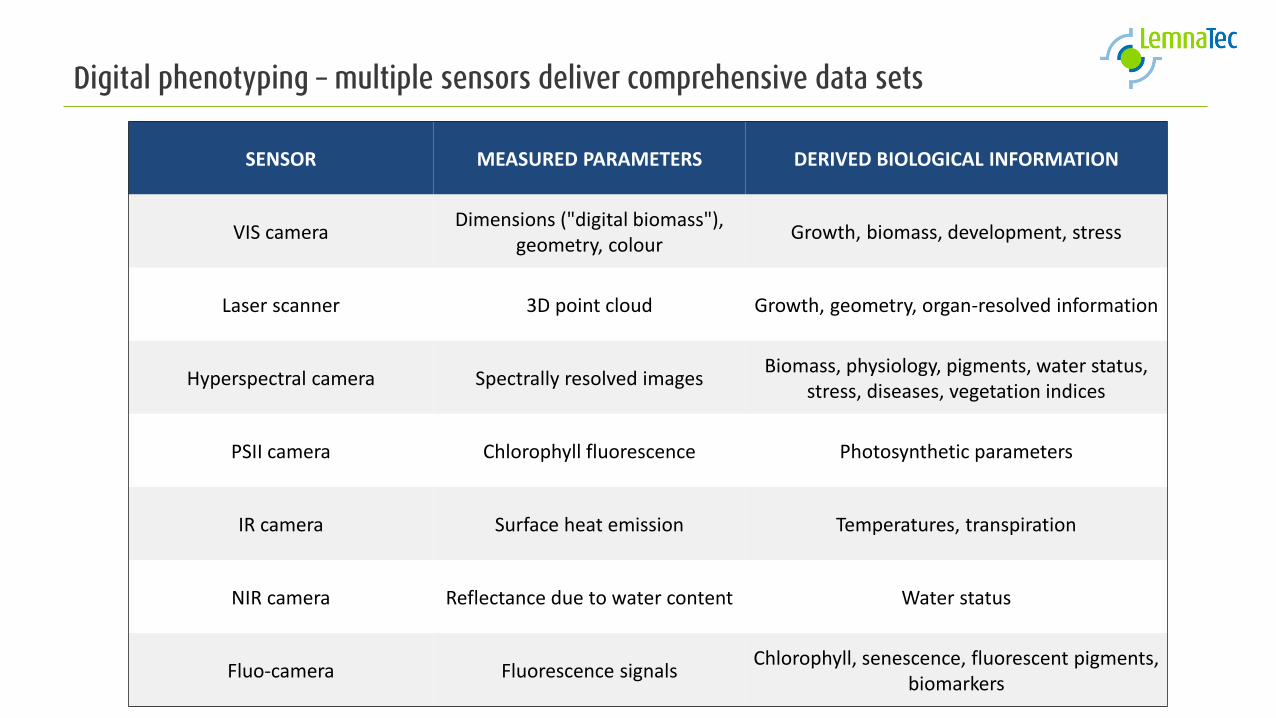
Digital phenotyping – multiple sensors deliver comprehensive data sets
SENSOR MEASURED PARAMETERS DERIVED BIOLOGICAL INFORMATION
VIS cameraDimensions ("digital biomass"),
geometry, colourGrowth, biomass, development, stress
Laser scanner 3D point cloud Growth, geometry, organ-resolved information
Hyperspectral camera Spectrally resolved imagesBiomass, physiology, pigments, water status,
stress, diseases, vegetation indices
PSII camera Chlorophyll fluorescence Photosynthetic parameters
IR camera Surface heat emission Temperatures, transpiration
NIR camera Reflectance due to water content Water status
Fluo-camera Fluorescence signalsChlorophyll, senescence, fluorescent pigments,
biomarkers
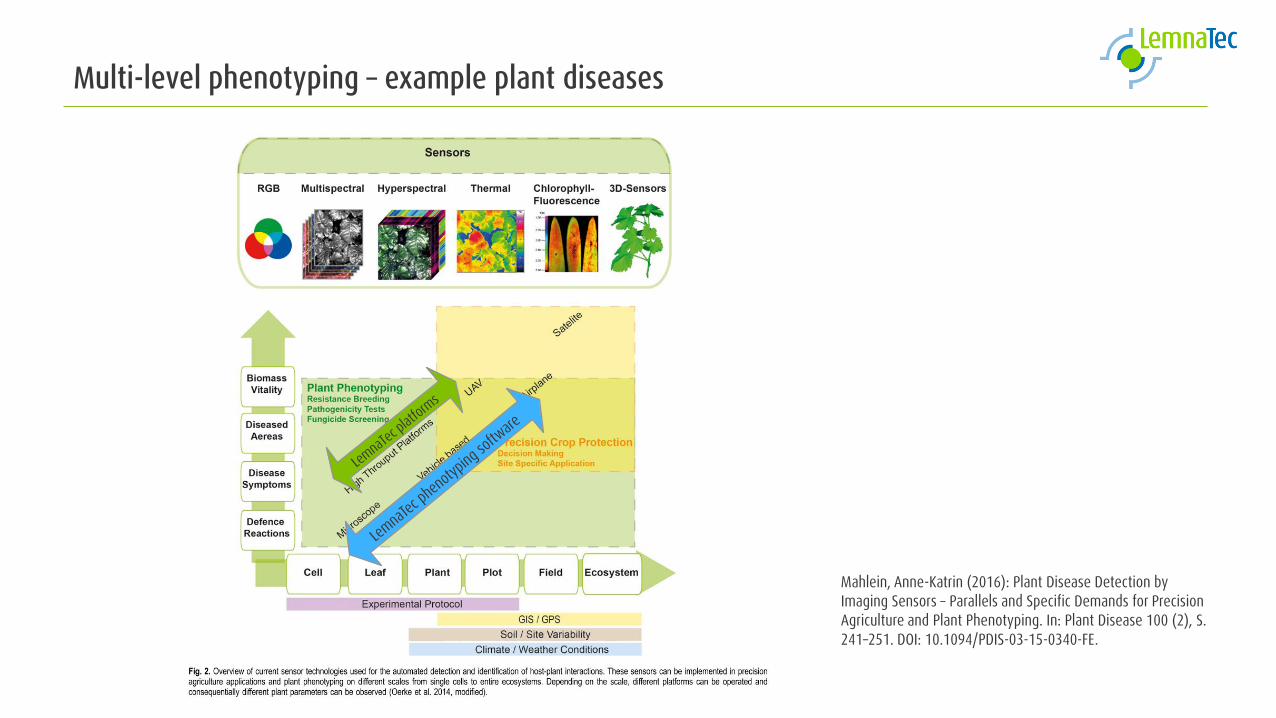
Mahlein, Anne-Katrin (2016): Plant Disease Detection by Imaging Sensors – Parallels and Specific Demands for Precision Agriculture and Plant Phenotyping. In: Plant Disease 100 (2), S. 241–251. DOI: 10.1094/PDIS-03-15-0340-FE.
Multi-level phenotyping – example plant diseases
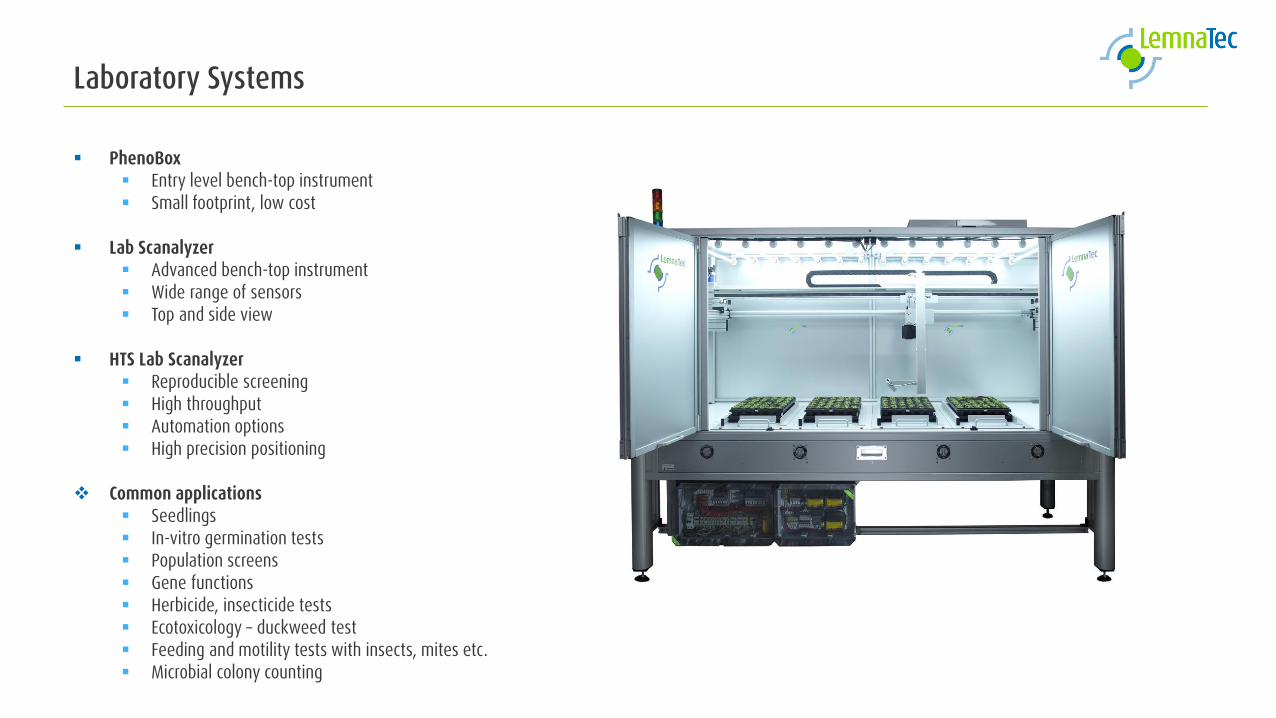
Laboratory Systems
PhenoBox Entry level bench-top instrument Small footprint, low cost
Lab Scanalyzer Advanced bench-top instrument Wide range of sensors Top and side view
HTS Lab Scanalyzer Reproducible screening High throughput Automation options High precision positioning
Common applications Seedlings In-vitro germination tests Population screens Gene functions Herbicide, insecticide tests Ecotoxicology – duckweed test Feeding and motility tests with insects, mites etc. Microbial colony counting
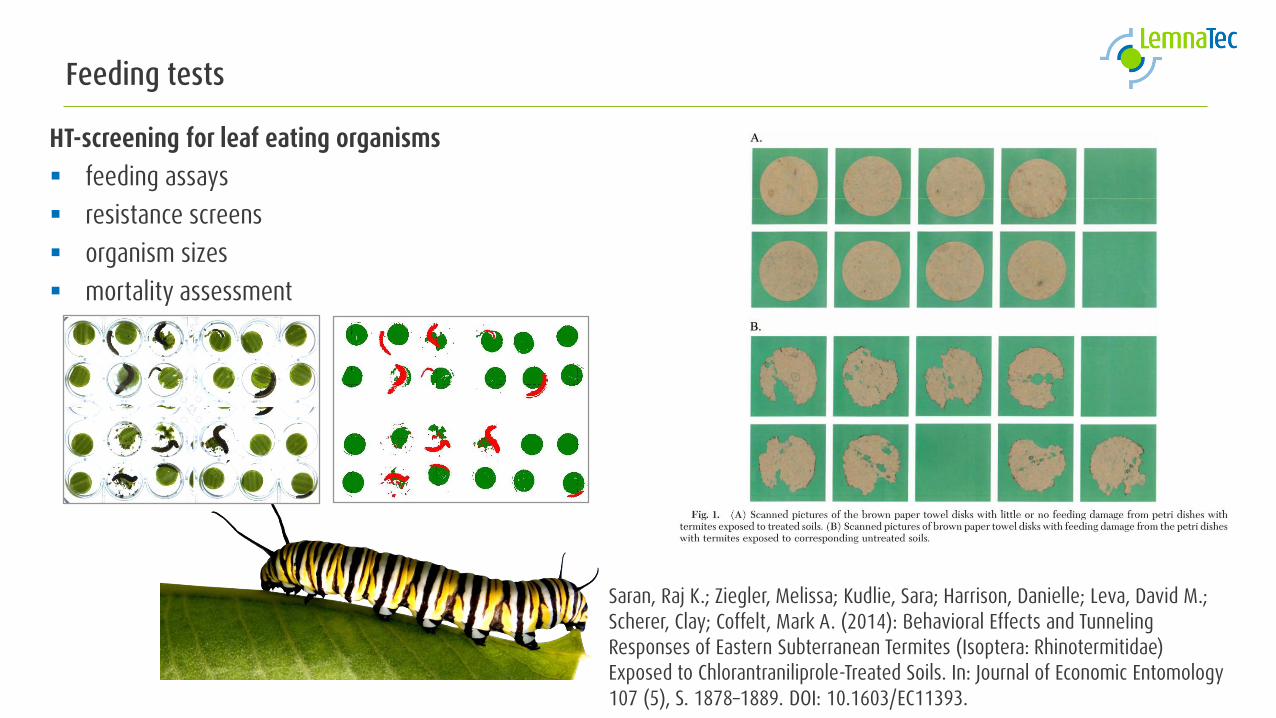
Feeding tests
HT-screening for leaf eating organisms
feeding assays
resistance screens
organism sizes
mortality assessment
Saran, Raj K.; Ziegler, Melissa; Kudlie, Sara; Harrison, Danielle; Leva, David M.; Scherer, Clay; Coffelt, Mark A. (2014): Behavioral Effects and Tunneling Responses of Eastern Subterranean Termites (Isoptera: Rhinotermitidae) Exposed to Chlorantraniliprole-Treated Soils. In: Journal of Economic Entomology107 (5), S. 1878–1889. DOI: 10.1603/EC11393.
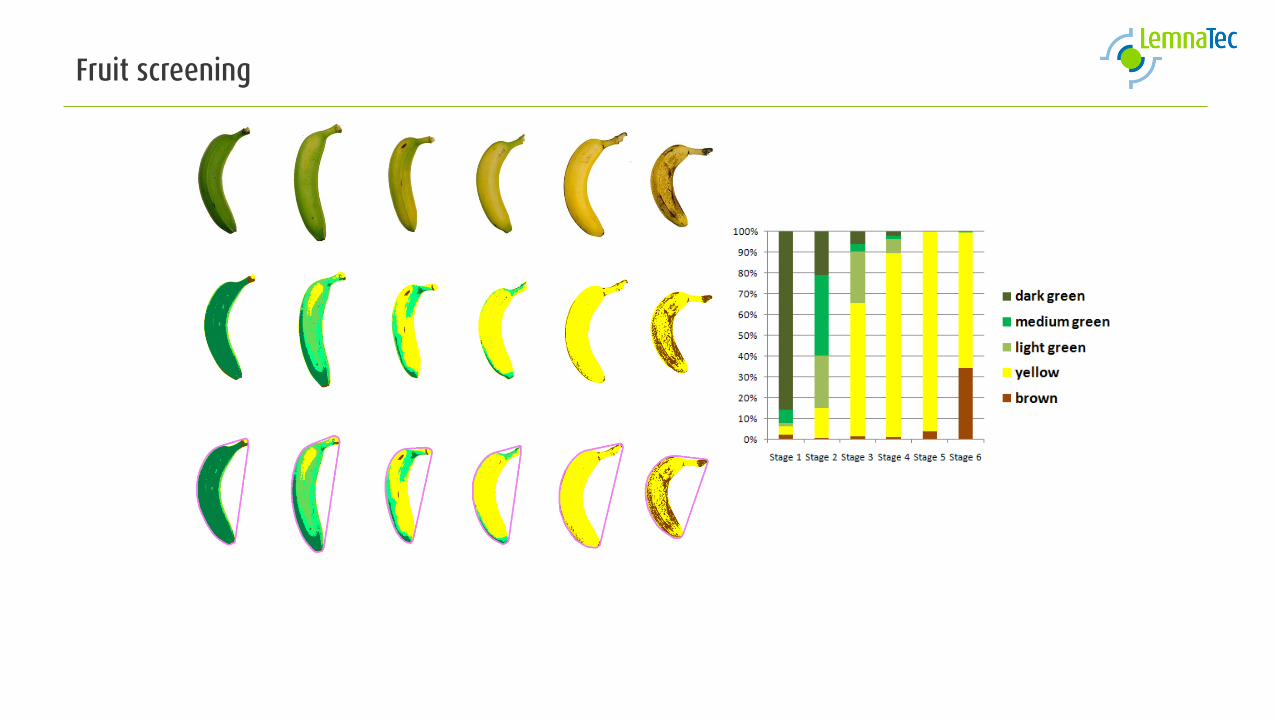
Fruit screening
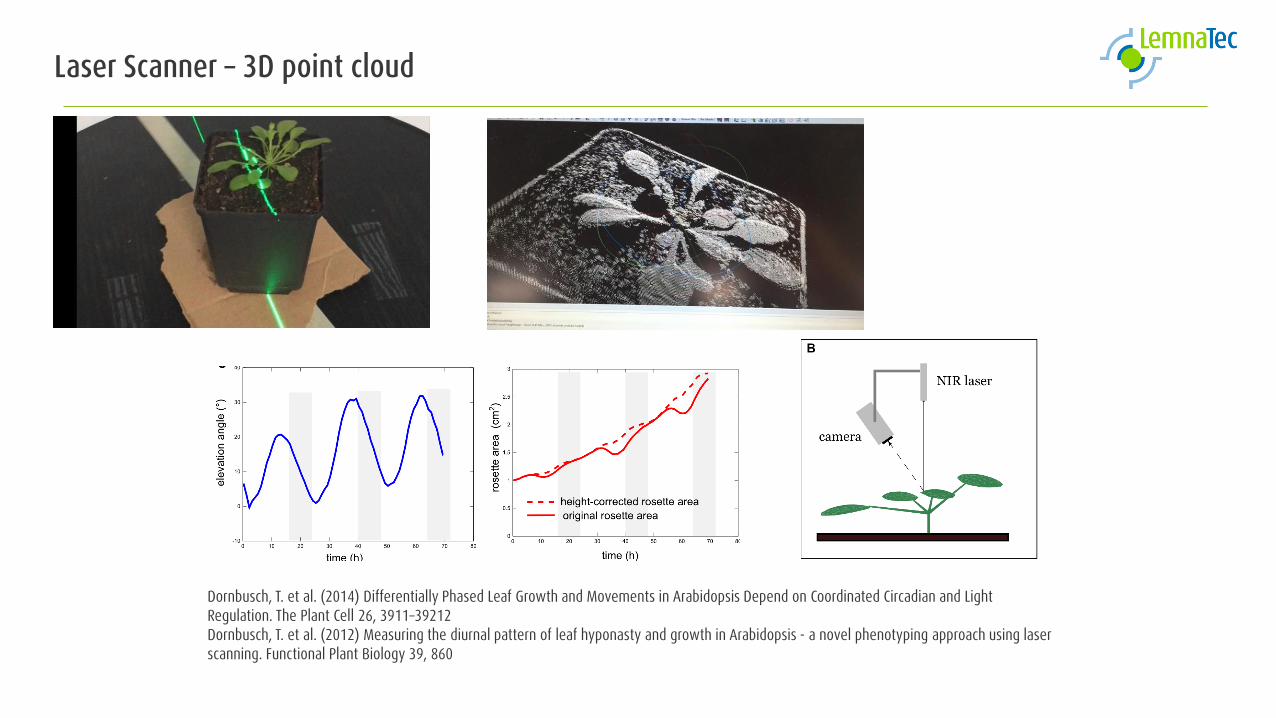
Laser Scanner – 3D point cloud
Dornbusch, T. et al. (2014) Differentially Phased Leaf Growth and Movements in Arabidopsis Depend on Coordinated Circadian and Light Regulation. The Plant Cell 26, 3911–39212 Dornbusch, T. et al. (2012) Measuring the diurnal pattern of leaf hyponasty and growth in Arabidopsis - a novel phenotyping approach using laserscanning. Functional Plant Biology 39, 860
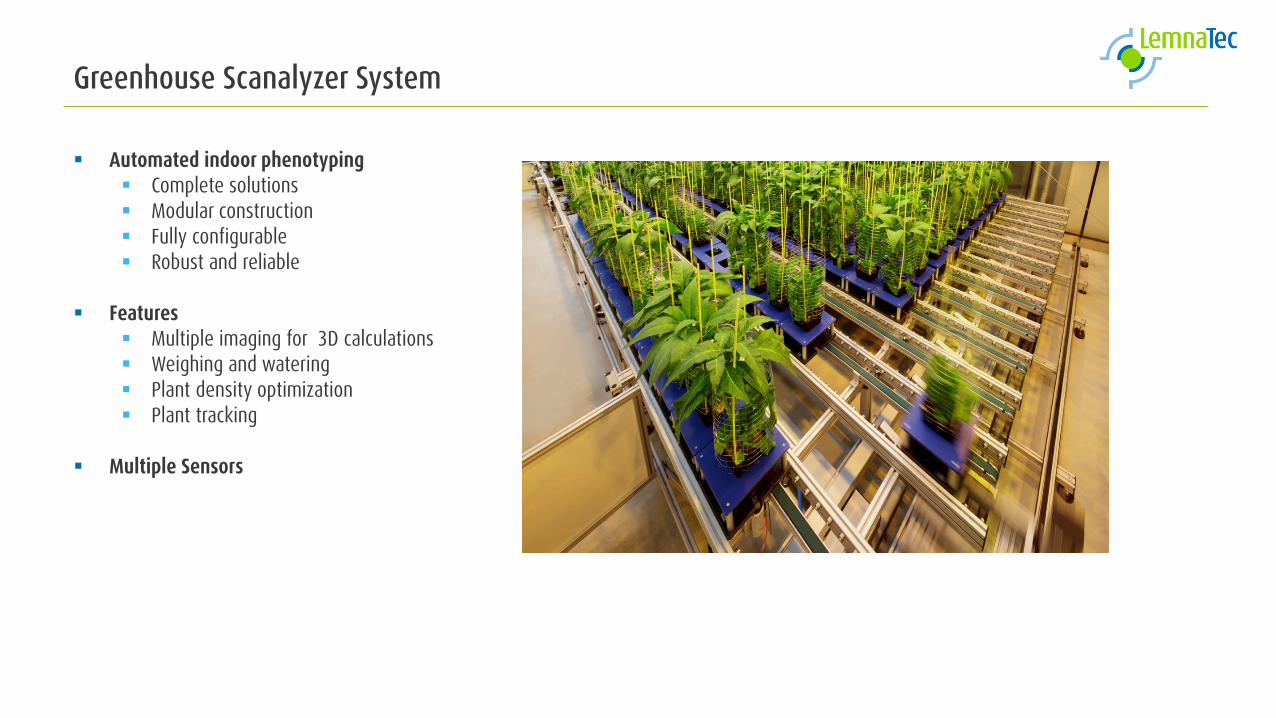
Greenhouse Scanalyzer System
Automated indoor phenotyping Complete solutions Modular construction Fully configurable Robust and reliable
Features Multiple imaging for 3D calculations Weighing and watering Plant density optimization Plant tracking
Multiple Sensors
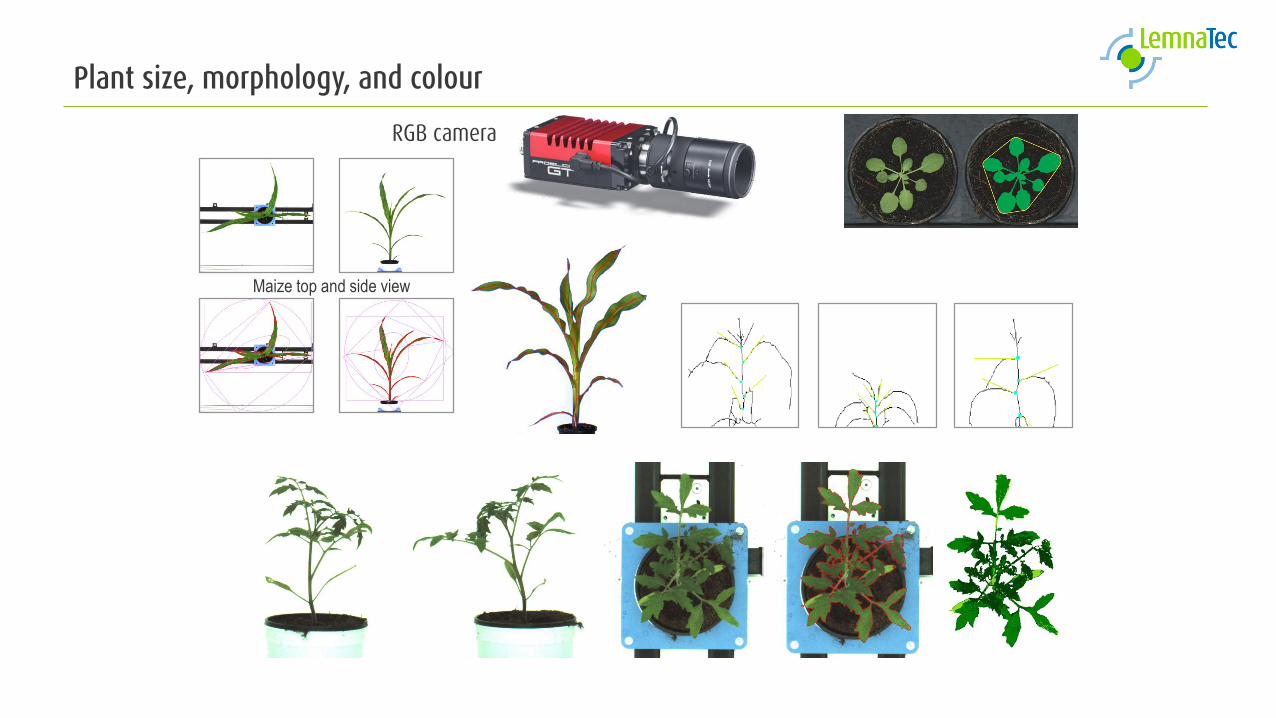
Plant size, morphology, and colour
Maize top and side view
RGB camera
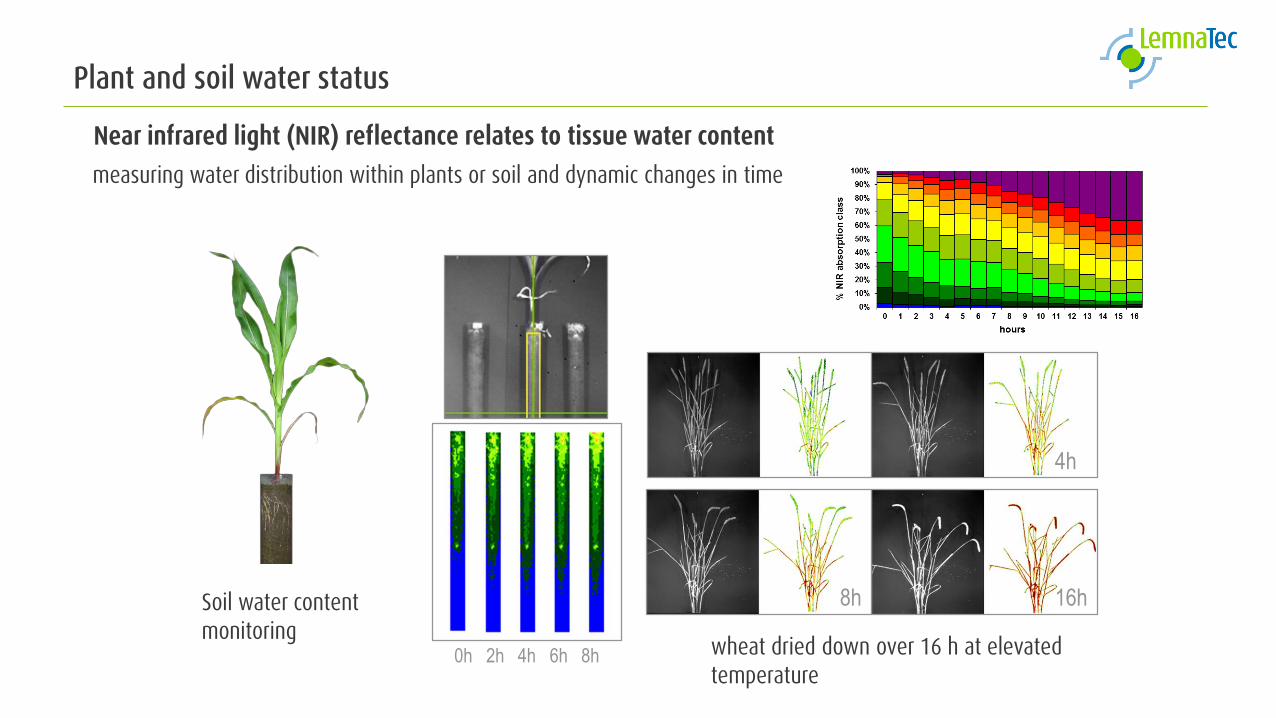
Plant and soil water status
Near infrared light (NIR) reflectance relates to tissue water content
measuring water distribution within plants or soil and dynamic changes in time
wheat dried down over 16 h at elevated temperature
0h
8h
4h
16h
0h 2h 4h 6h 8h
Soil water contentmonitoring
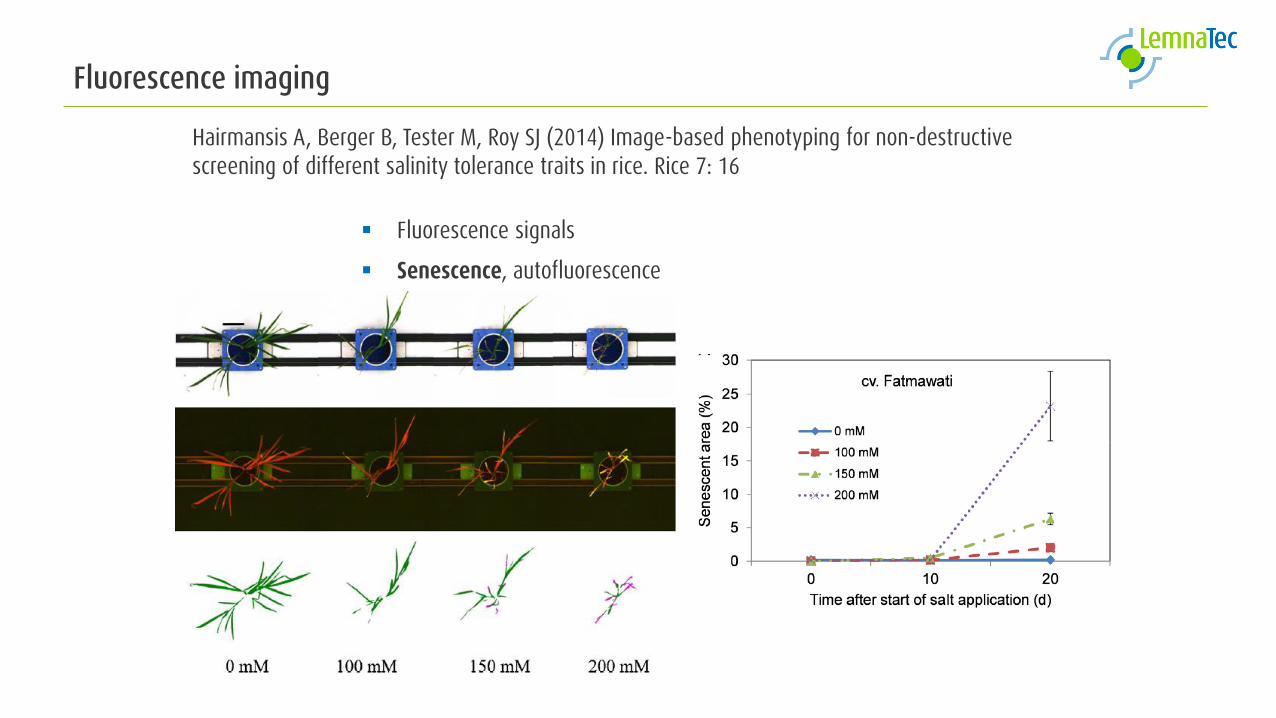
Fluorescence imaging
Fluorescence signals
Senescence, autofluorescence
Hairmansis A, Berger B, Tester M, Roy SJ (2014) Image-based phenotyping for non-destructive screening of different salinity tolerance traits in rice. Rice 7: 16
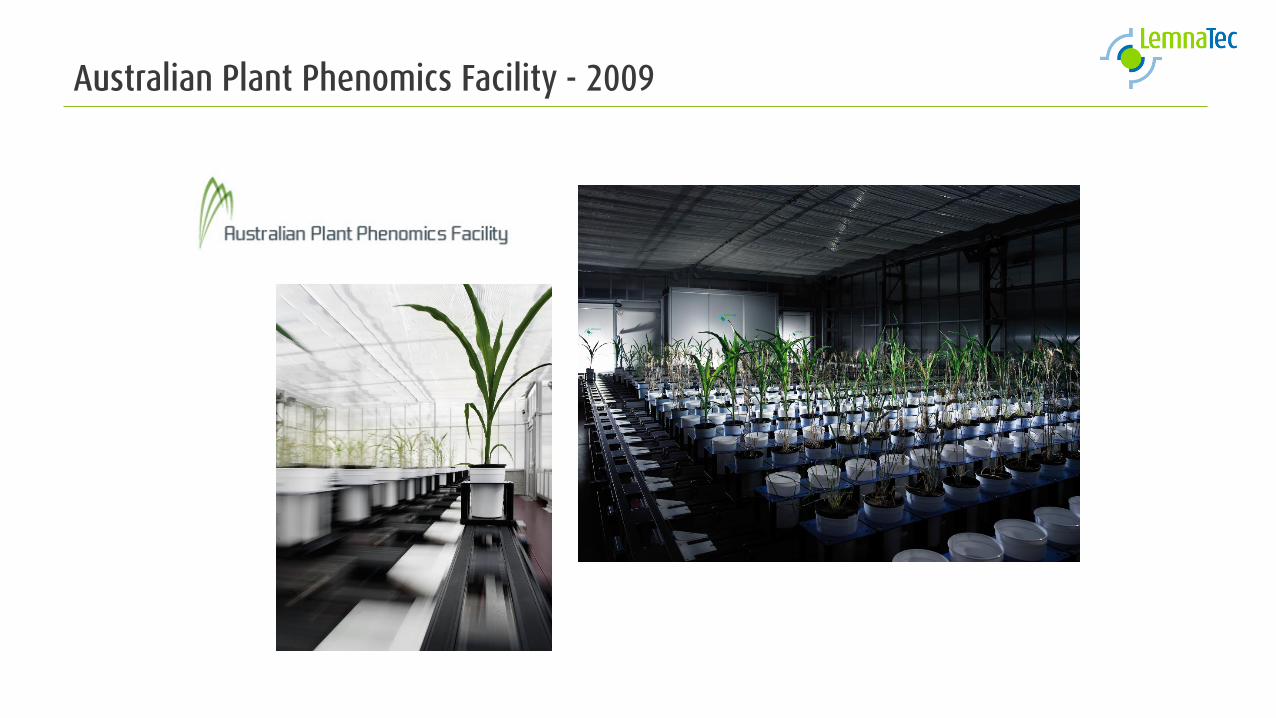
Australian Plant Phenomics Facility - 2009
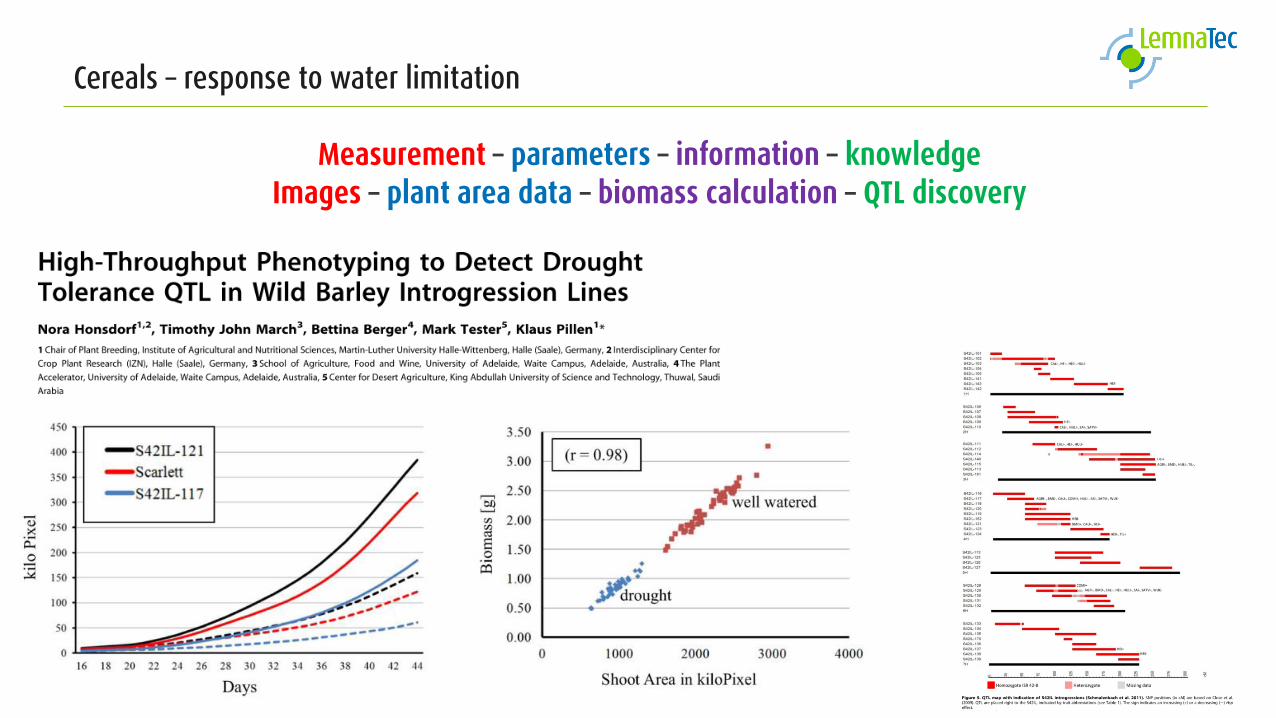
Cereals – response to water limitation
Measurement – parameters – information – knowledgeImages – plant area data – biomass calculation – QTL discovery
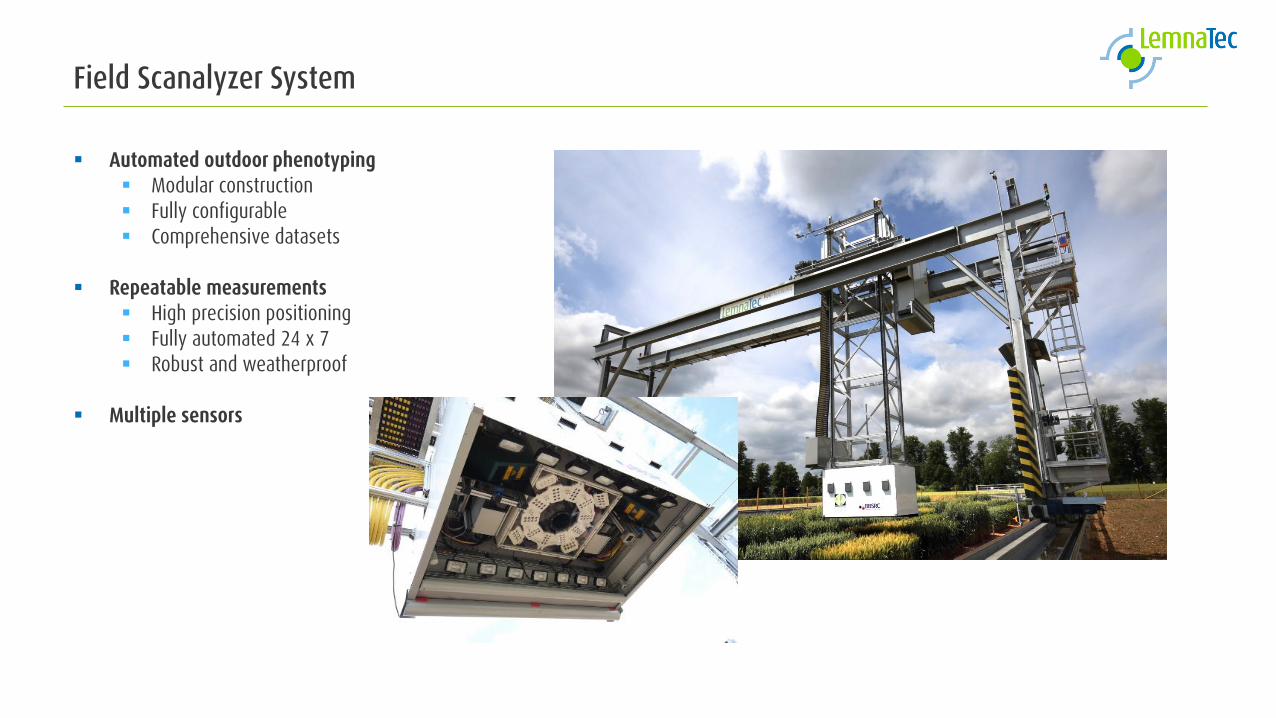
Field Scanalyzer System
Automated outdoor phenotyping Modular construction Fully configurable Comprehensive datasets
Repeatable measurements High precision positioning Fully automated 24 x 7 Robust and weatherproof
Multiple sensors
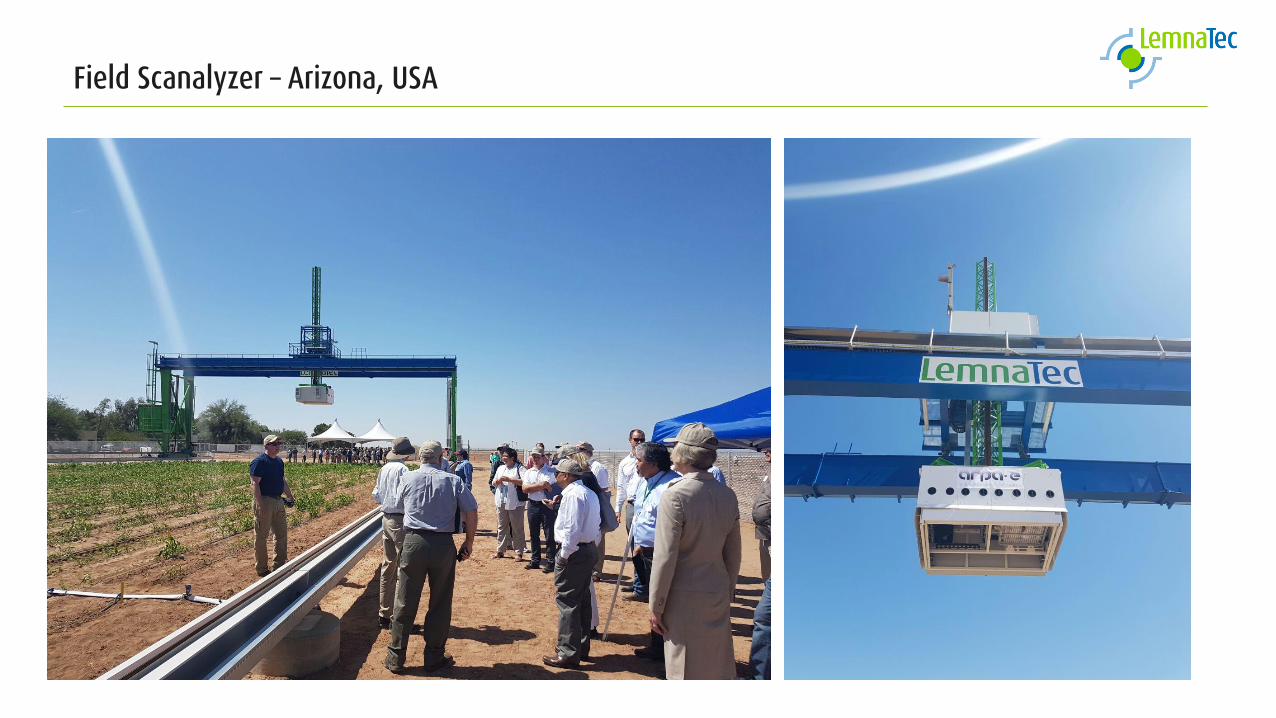
Field Scanalyzer – Arizona, USA
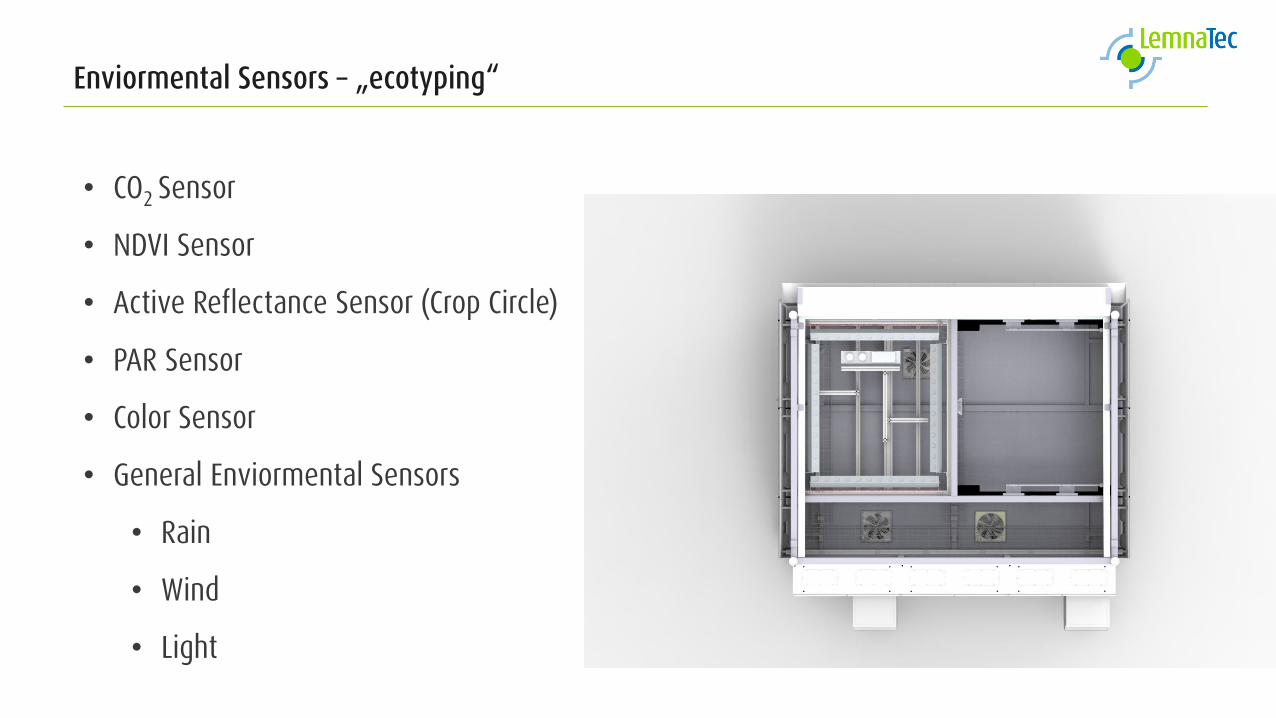
Enviormental Sensors – „ecotyping“
• CO2 Sensor
• NDVI Sensor
• Active Reflectance Sensor (Crop Circle)
• PAR Sensor
• Color Sensor
• General Enviormental Sensors
• Rain
• Wind
• Light
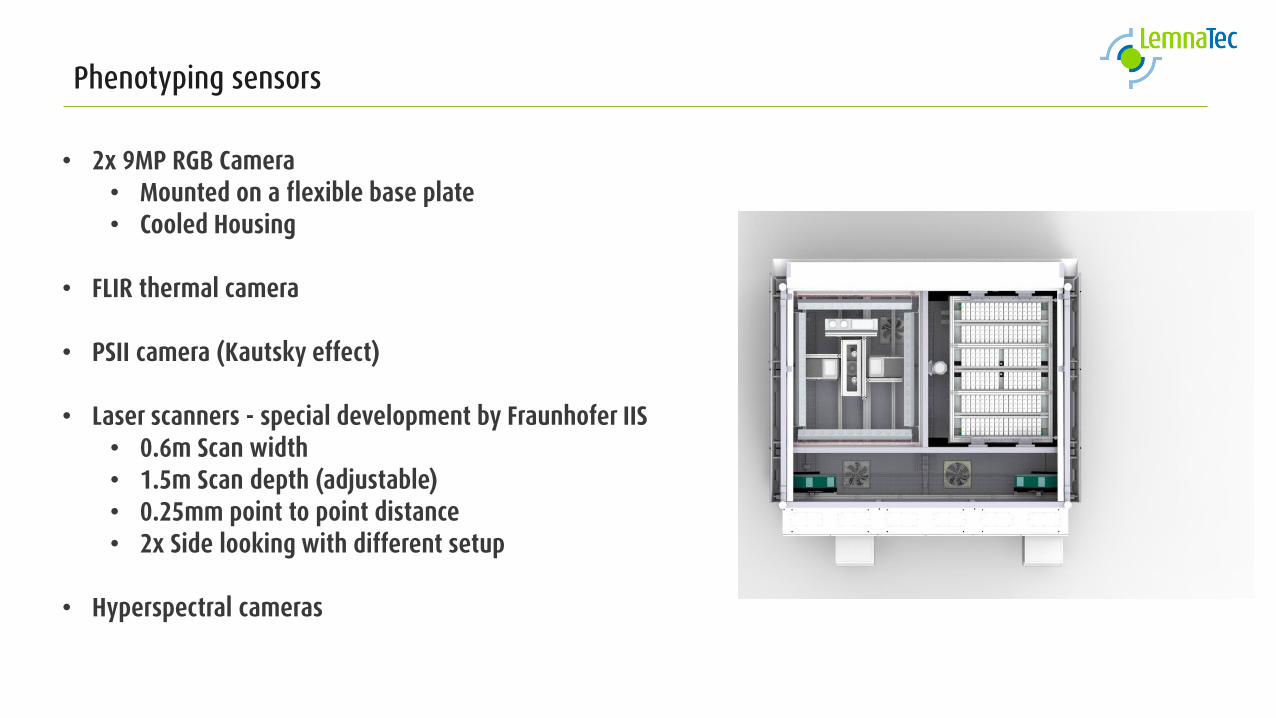
Phenotyping sensors
• 2x 9MP RGB Camera• Mounted on a flexible base plate• Cooled Housing
• FLIR thermal camera
• PSII camera (Kautsky effect)
• Laser scanners - special development by Fraunhofer IIS• 0.6m Scan width• 1.5m Scan depth (adjustable)• 0.25mm point to point distance• 2x Side looking with different setup
• Hyperspectral cameras
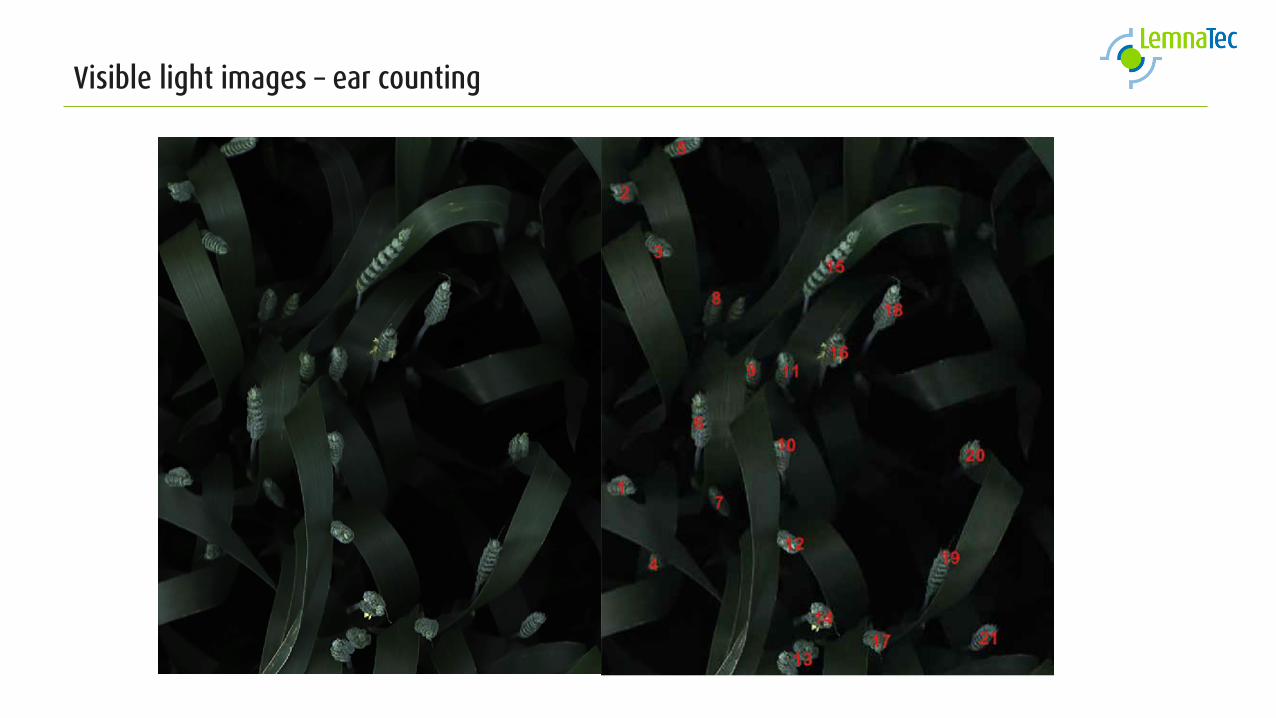
Visible light images – ear counting
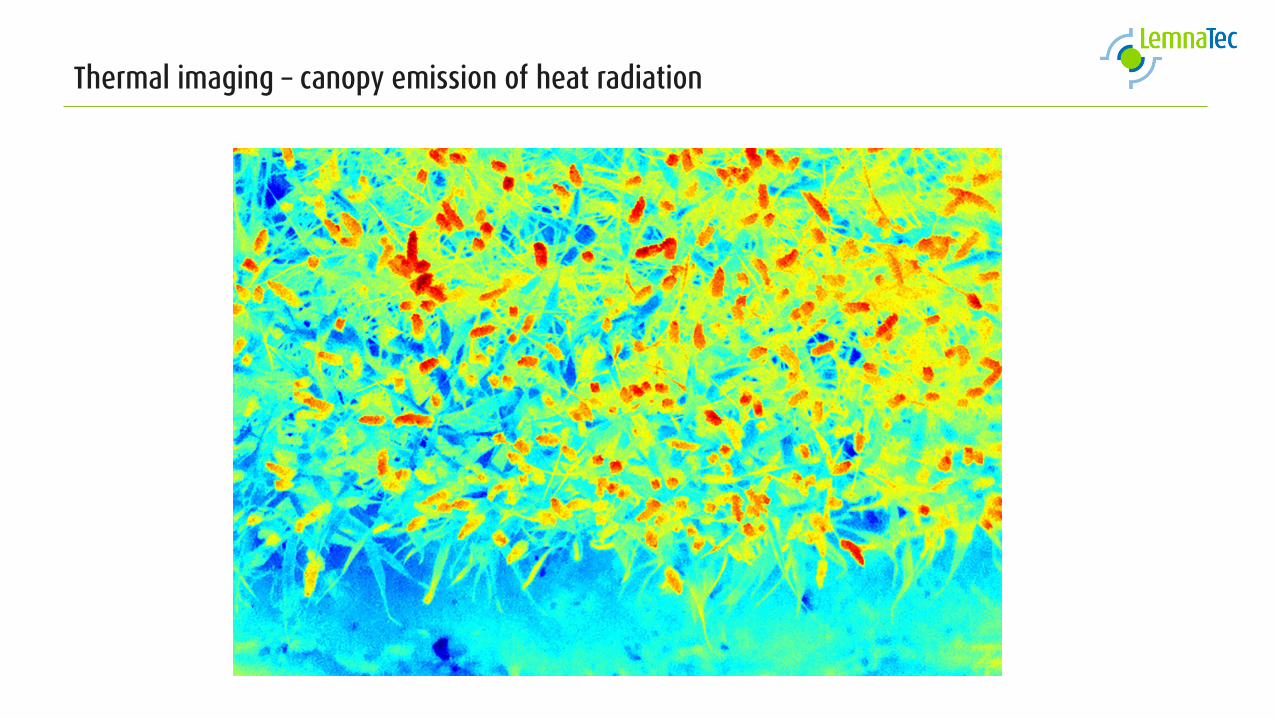
Thermal imaging – canopy emission of heat radiation
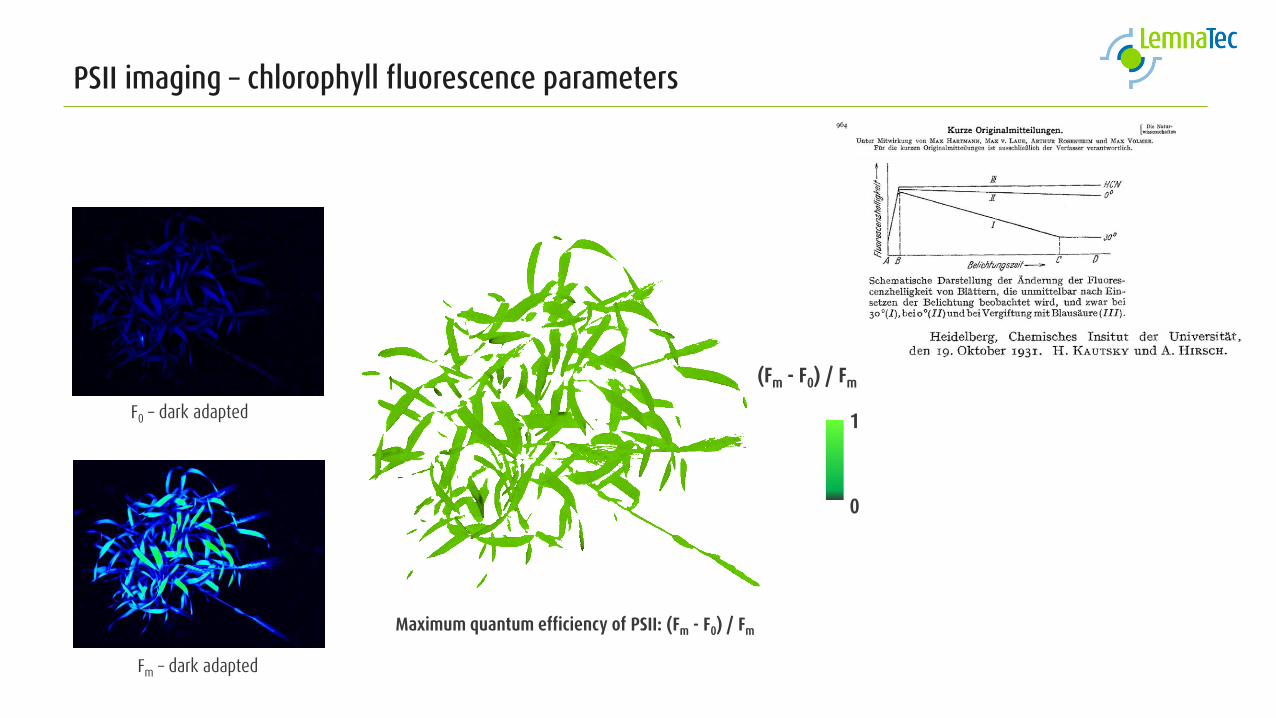
PSII imaging – chlorophyll fluorescence parameters
F0 – dark adapted
Fm – dark adapted
Maximum quantum efficiency of PSII: (Fm - F0) / Fm
(Fm - F0) / Fm
1
0
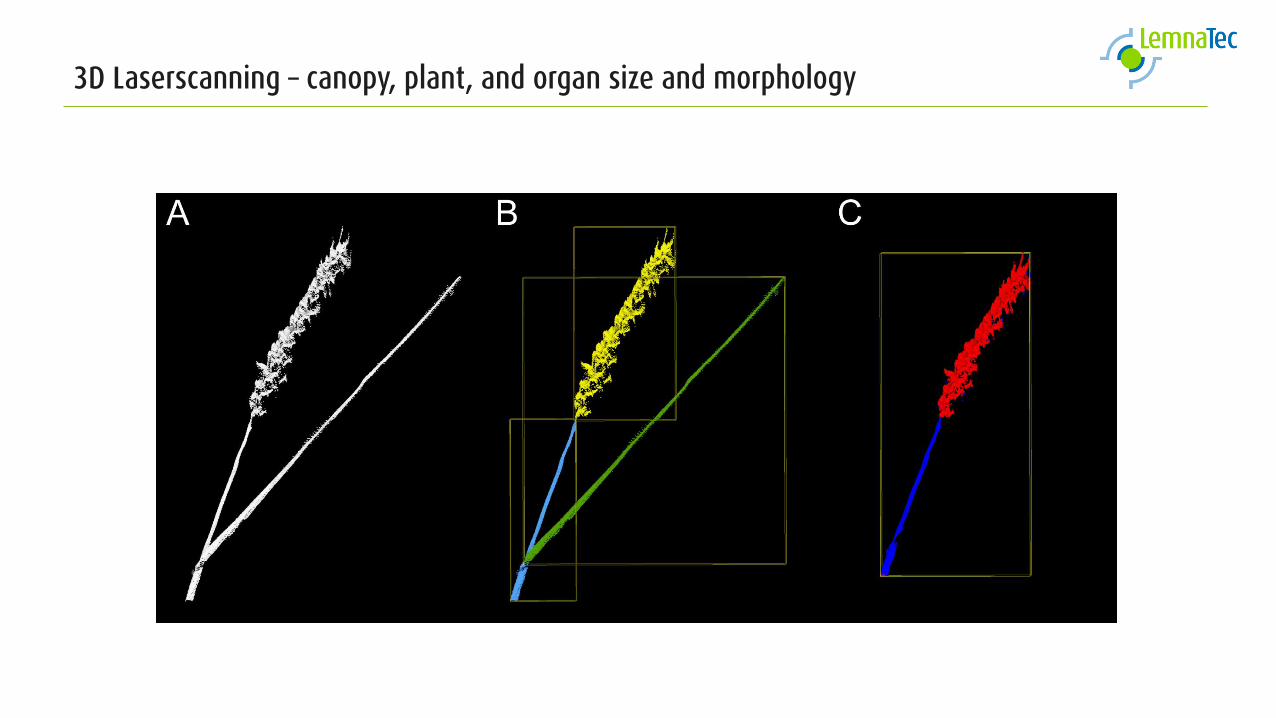
3D Laserscanning – canopy, plant, and organ size and morphology
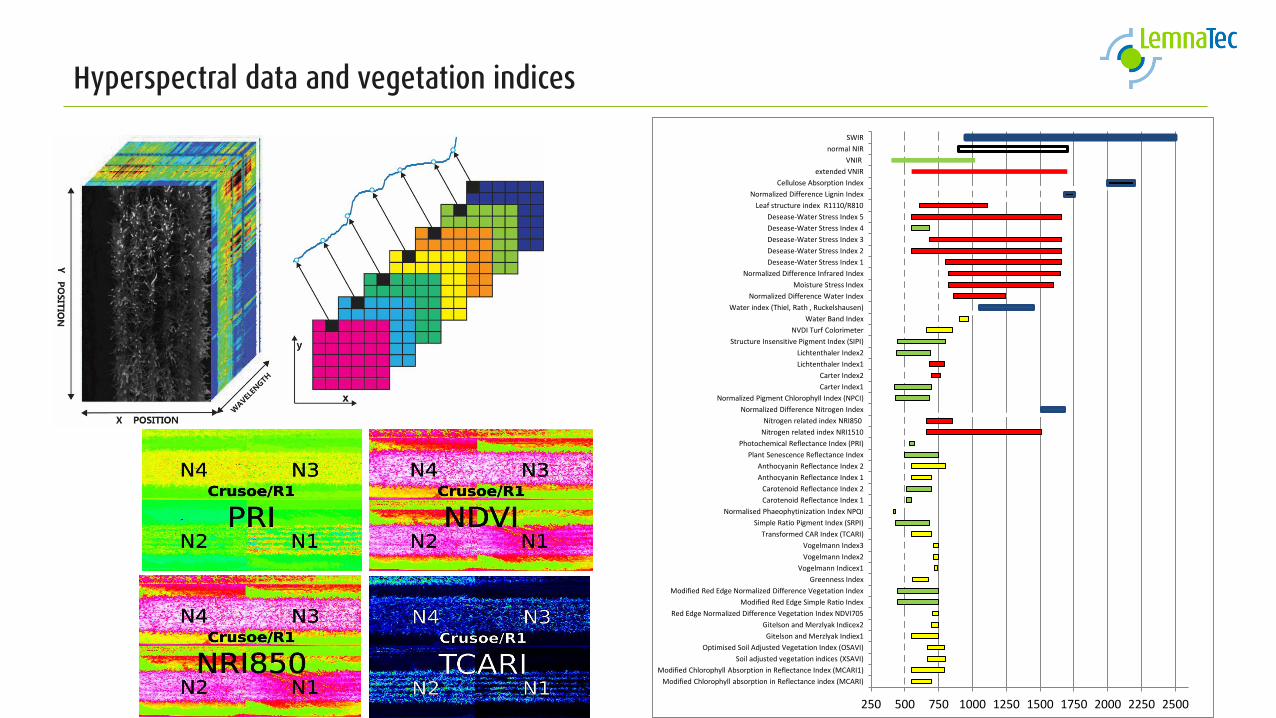
Hyperspectral data and vegetation indices
Modified Chlorophyll absorption in Reflectance index (MCARI)
Modified Chlorophyll Absorption in Reflectance Index (MCARI1)
Soil adjusted vegetation indices (XSAVI)
Optimised Soil Adjusted Vegetation Index (OSAVI)
Gitelson and Merzlyak Indiex1
Gitelson and Merzlyak Indicex2
Red Edge Normalized Difference Vegetation Index NDVI705
Modified Red Edge Simple Ratio Index
Modified Red Edge Normalized Difference Vegetation Index
Greenness Index
Vogelmann Indicex1
Vogelmann Index2
Vogelmann Index3
Transformed CAR Index (TCARI)
Simple Ratio Pigment Index (SRPI)
Normalised Phaeophytinization Index NPQI
Carotenoid Reflectance Index 1
Carotenoid Reflectance Index 2
Anthocyanin Reflectance Index 1
Anthocyanin Reflectance Index 2
Plant Senescence Reflectance Index
Photochemical Reflectance Index (PRI)
Nitrogen related index NRI1510
Nitrogen related index NRI850
Normalized Difference Nitrogen Index
Normalized Pigment Chlorophyll Index (NPCI)
Carter Index1
Carter Index2
Lichtenthaler Index1
Lichtenthaler Index2
Structure Insensitive Pigment Index (SIPI)
NVDI Turf Colorimeter
Water Band Index
Water index (Thiel, Rath , Ruckelshausen)
Normalized Difference Water Index
Moisture Stress Index
Normalized Difference Infrared Index
Desease-Water Stress Index 1
Desease-Water Stress Index 2
Desease-Water Stress Index 3
Desease-Water Stress Index 4
Desease-Water Stress Index 5
Leaf structure index R1110/R810
Normalized Difference Lignin Index
Cellulose Absorption Index
extended VNIR
VNIR
normal NIR
SWIR
250 500 750 1000 1250 1500 1750 2000 2250 2500
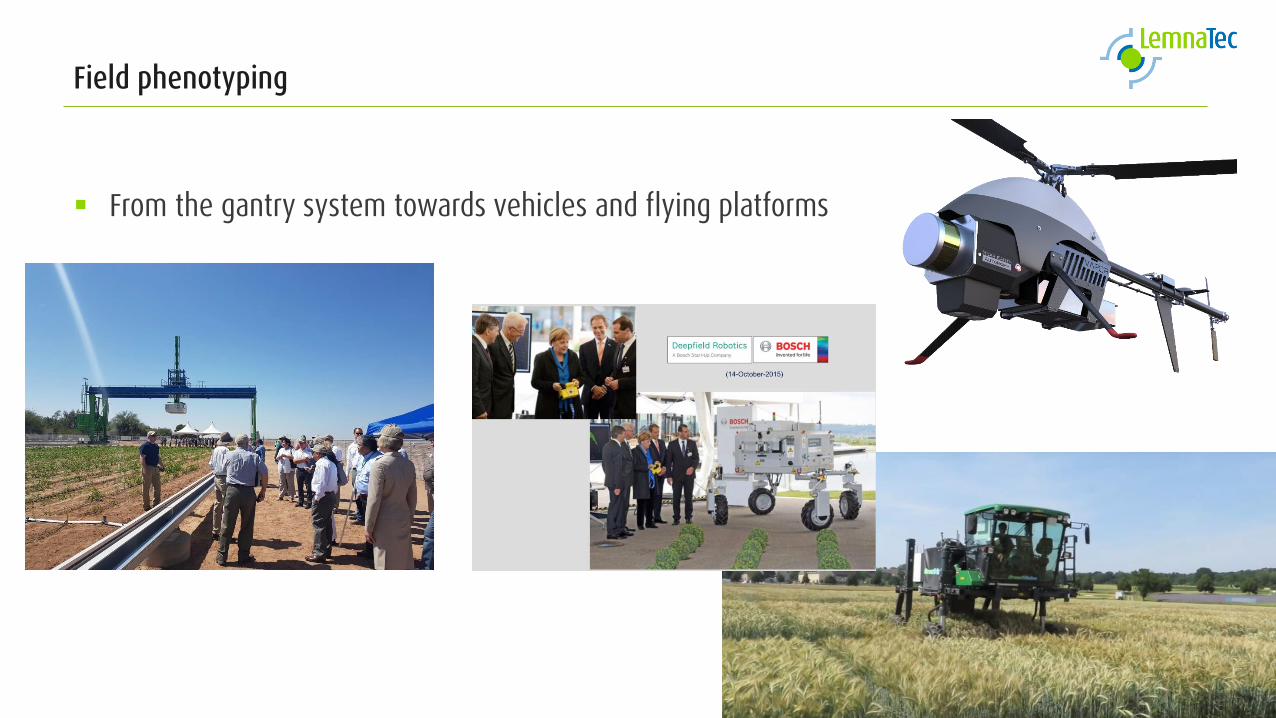
Field phenotyping
From the gantry system towards vehicles and flying platforms
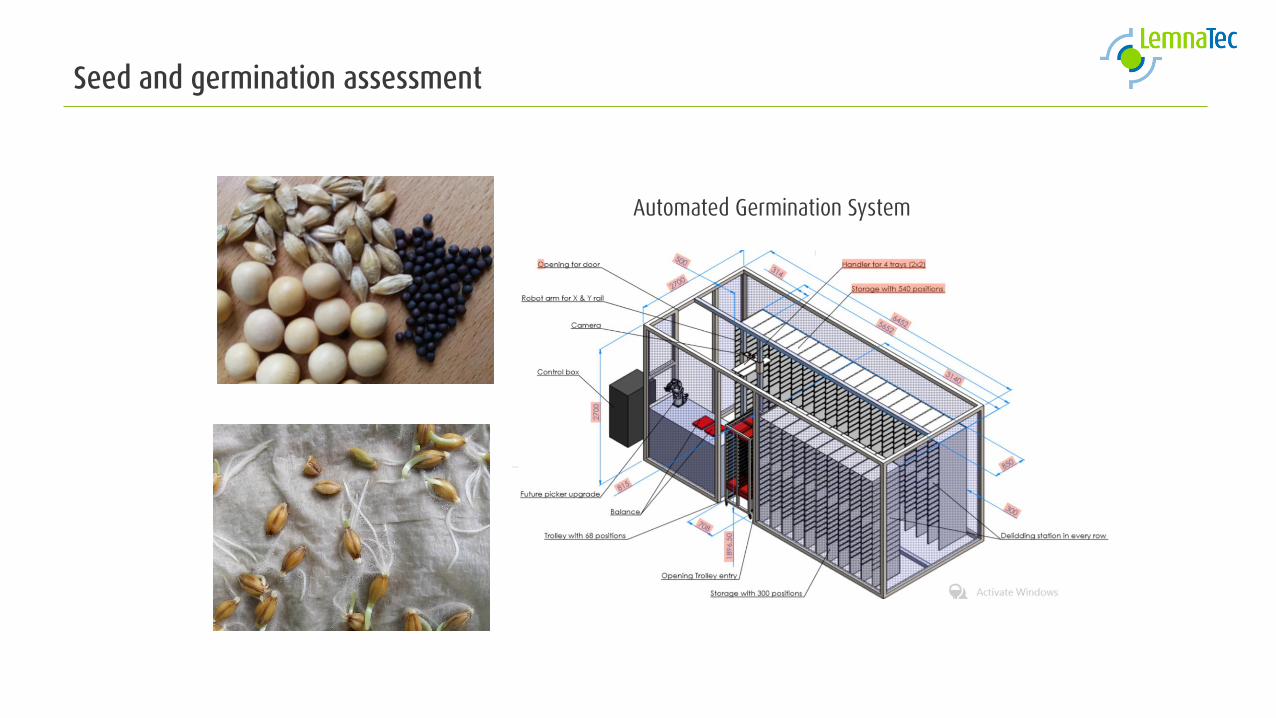
Seed and germination assessment
Automated Germination System
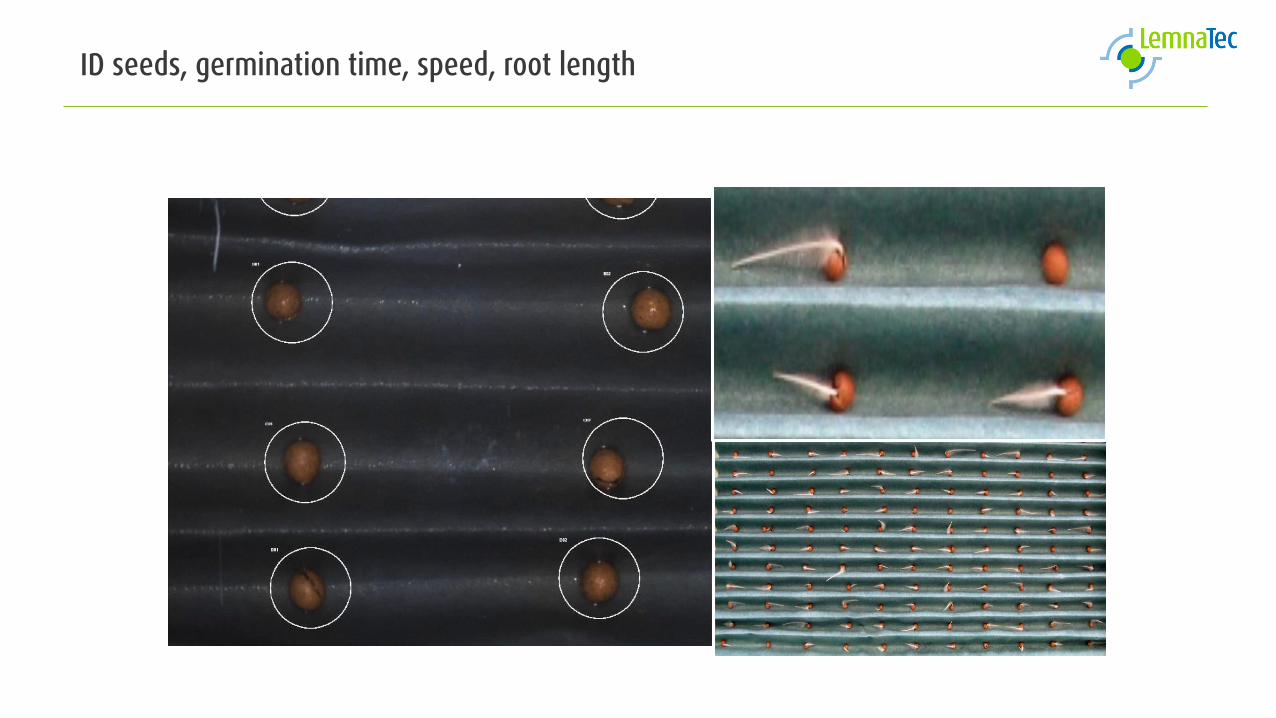
ID seeds, germination time, speed, root length
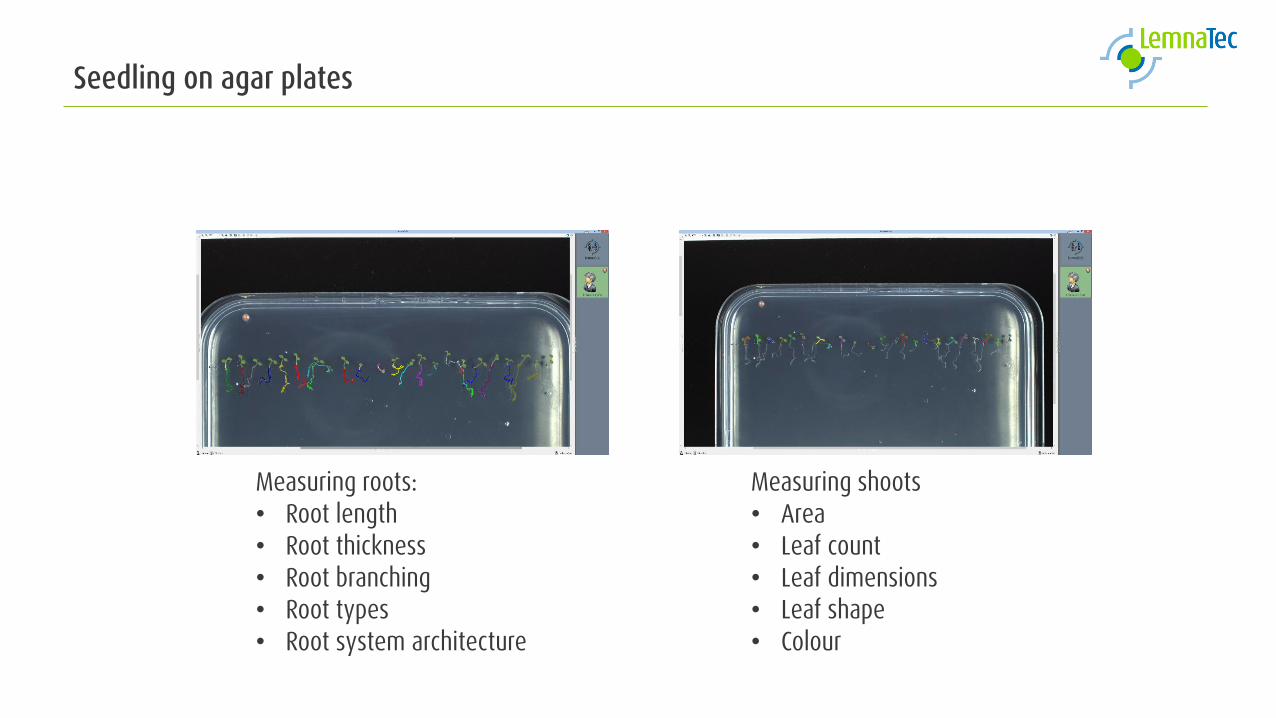
Seedling on agar plates
Measuring roots:• Root length• Root thickness• Root branching• Root types• Root system architecture
Measuring shoots• Area• Leaf count• Leaf dimensions• Leaf shape• Colour
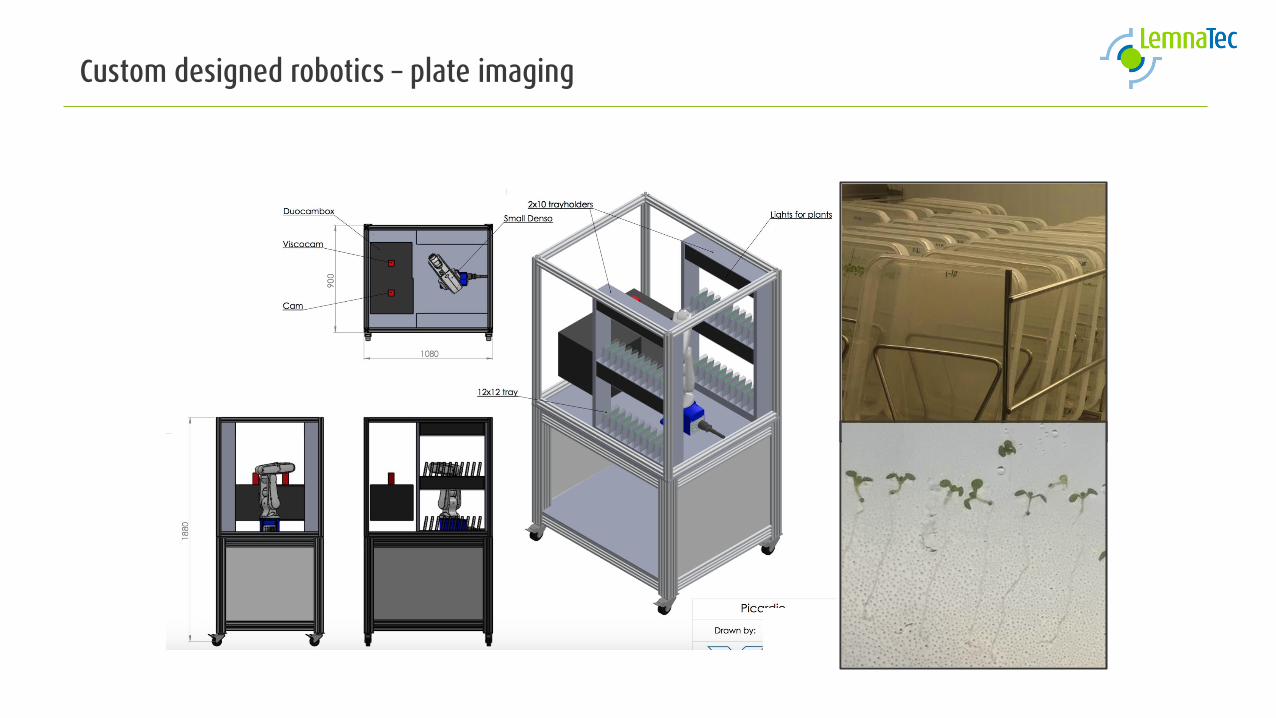
Custom designed robotics – plate imaging
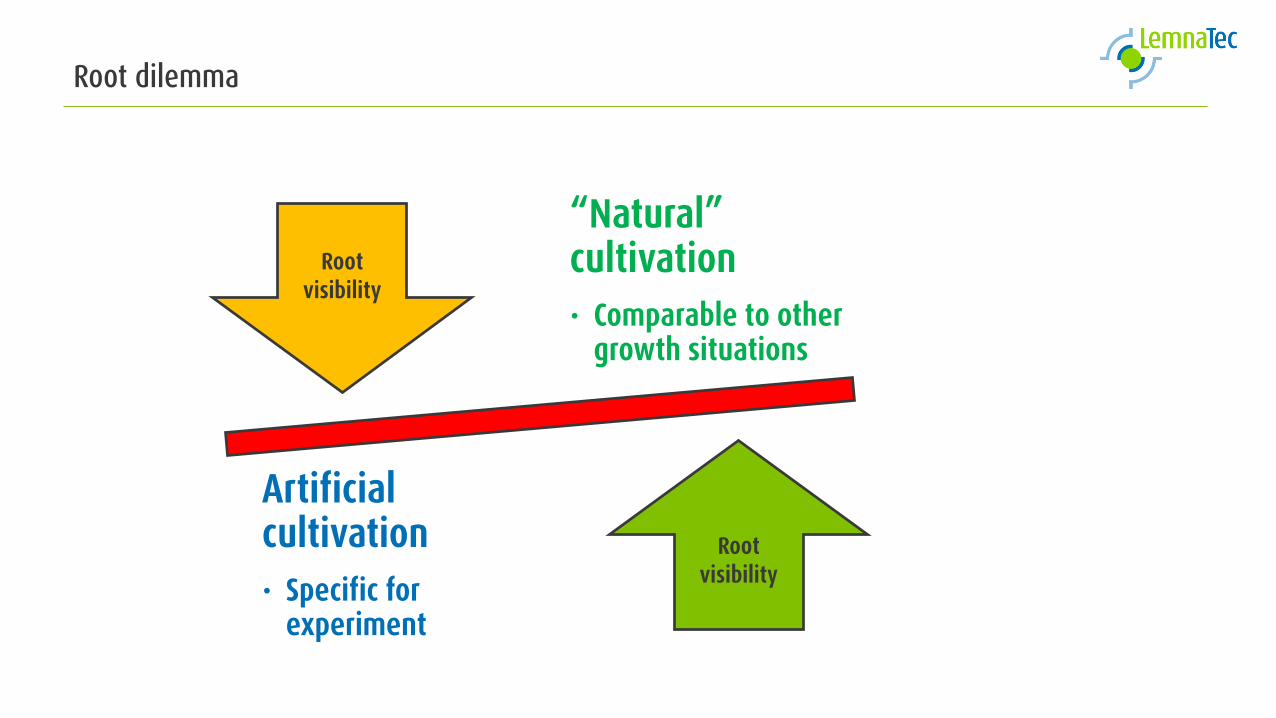
Root dilemma
Root visibility
“Natural” cultivation
• Comparable to other growth situations
Root visibility
Artificial cultivation
• Specific for experiment
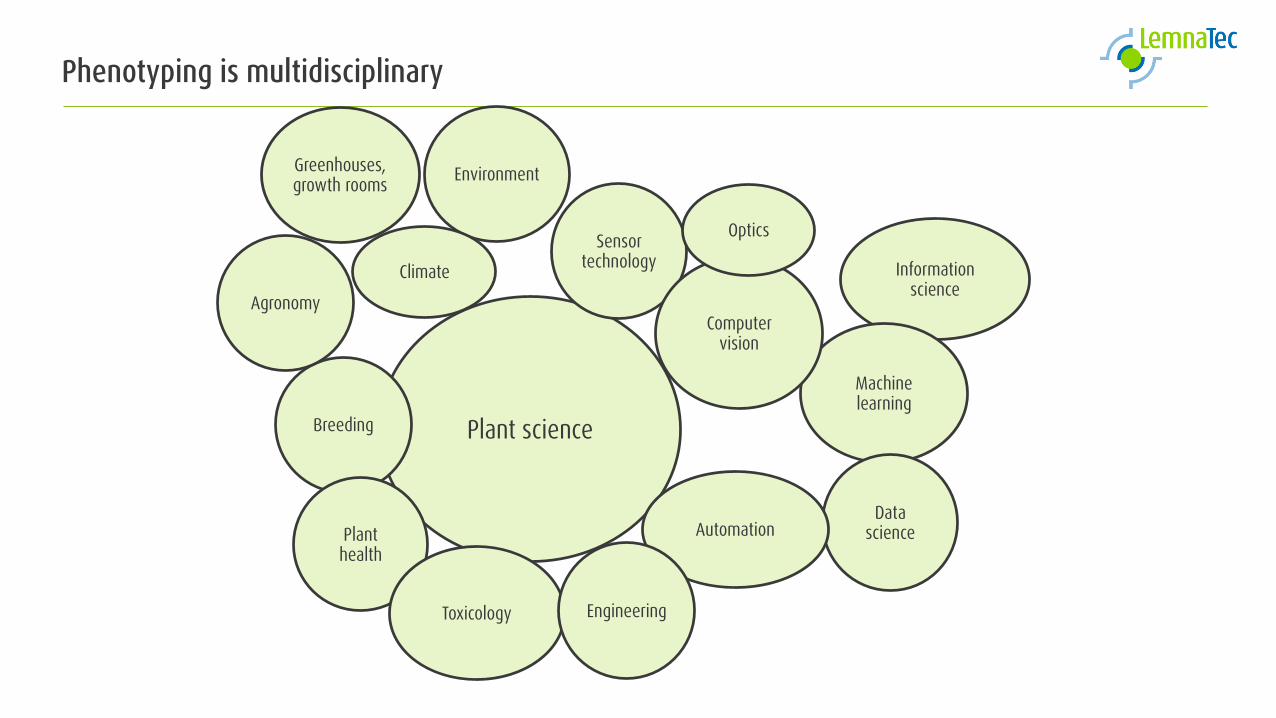
Phenotyping is multidisciplinary
Plant science
Information science
Machinelearning
Breeding
Plant health
Agronomy
Toxicology
Data scienceAutomation
Engineering
Sensor technology
Computer vision
Optics
Environment Greenhouses, growth rooms
Climate
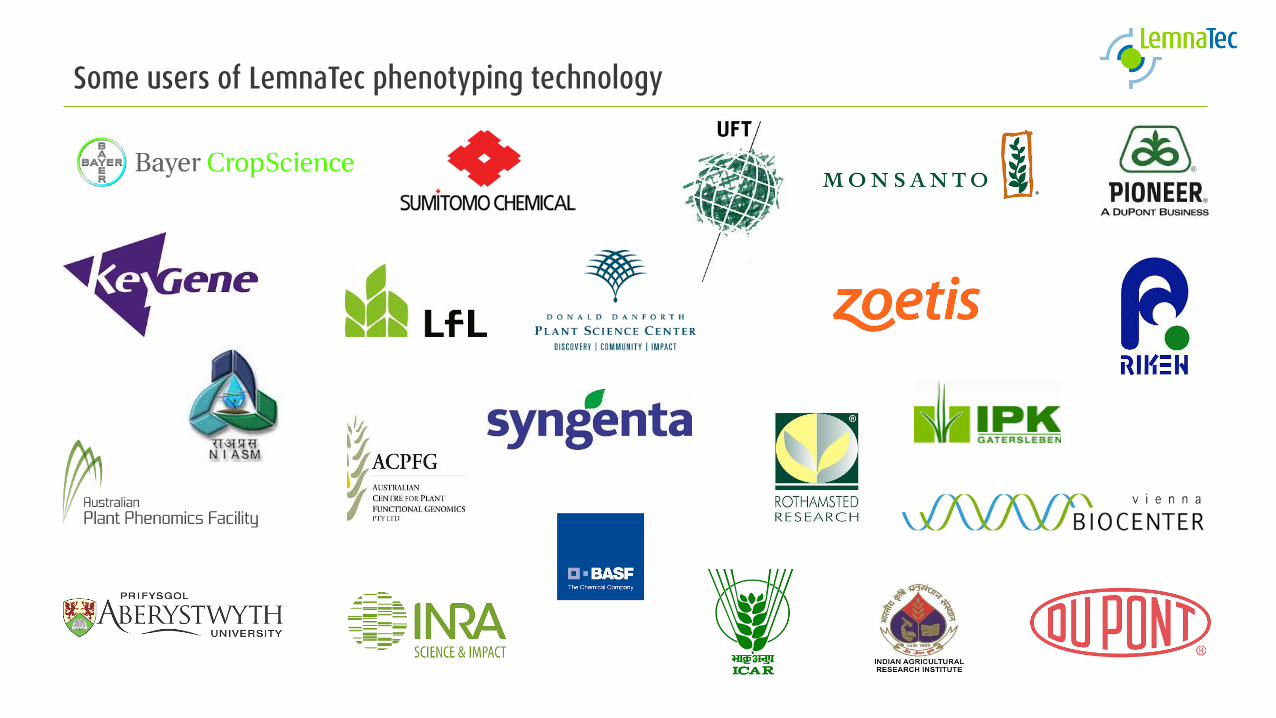
Some users of LemnaTec phenotyping technology
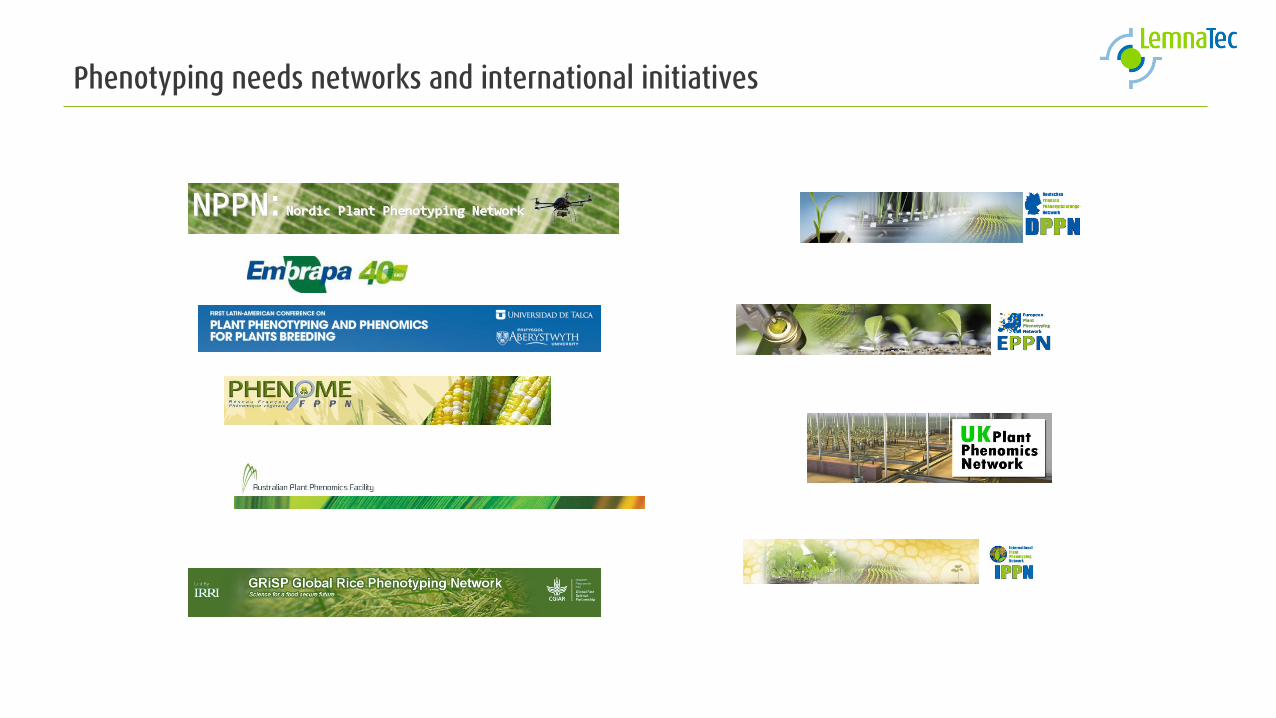
Phenotyping needs networks and international initiatives
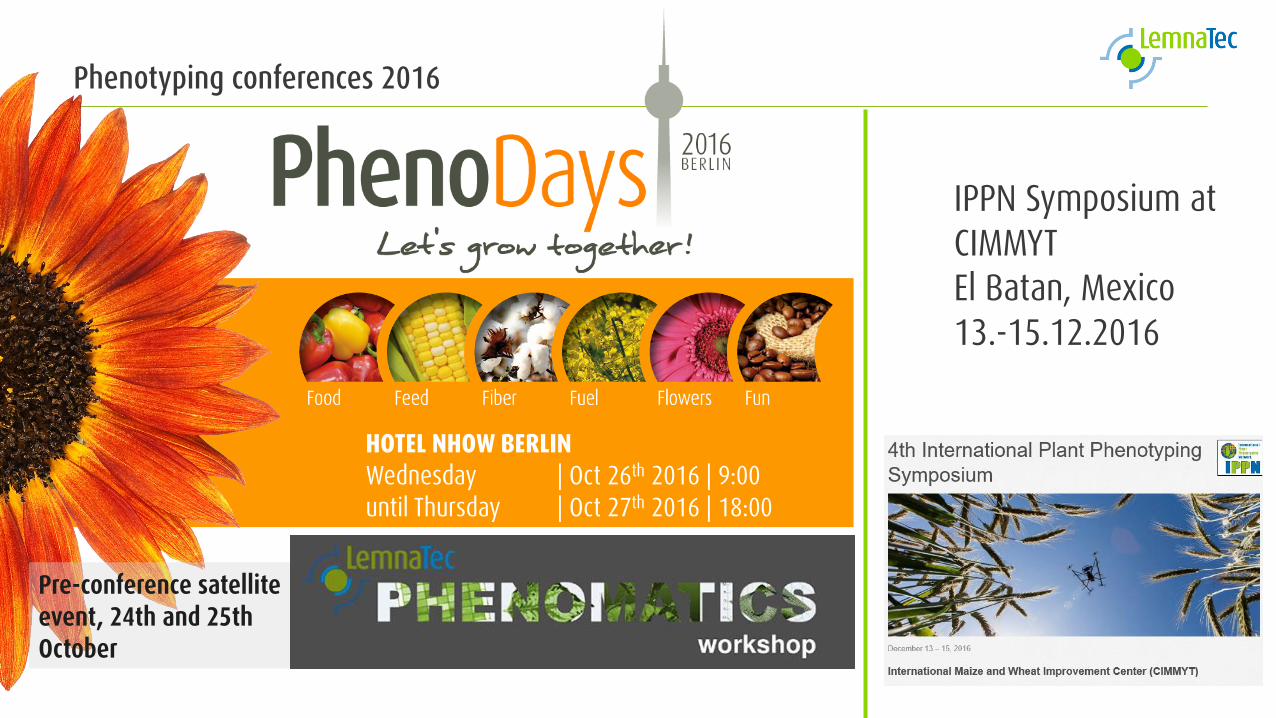
Pre-conference satelliteevent, 24th and 25th October
HOTEL NHOW BERLINWednesday | Oct 26th 2016 | 9:00until Thursday | Oct 27th 2016 | 18:00
IPPN Symposium at CIMMYTEl Batan, Mexico13.-15.12.2016
Phenotyping conferences 2016