sensors and actuators in smart cities mdpi
TRANSCRIPT

Sensors and Actuators in Smart Cities
Mohammad Hammoudeh and Mounir Arioua
www.mdpi.com/journal/jsan
Edited by
Printed Edition of the Special Issue Published in JSAN
Sensor
Books
MDPI

Sensors and Actuators in Smart Cities
Special Issue EditorsMohammad HammoudehMounir Arioua
MDPI • Basel • Beijing • Wuhan • Barcelona • Belgrade
Books
MDPI

Special Issue Editors
Mohammad Hammoudeh
Manchester Metropolitan University
UK
Mounir Arioua
Abdelmalek Essaadi University
Morocco
Editorial Office
MDPI
St. Alban-Anlage 66
Basel, Switzerland
This edition is a reprint of the Special Issue published online in the open access journal Journal of Sensor
and Actuator Networks (ISSN 2224-2708) from 2013–2014 (available at: http://www.mdpi.com/journal/
jsan/special issues/smart cities).
For citation purposes, cite each article independently as indicated on the article page online and as
indicated below:
Lastname, F.M.; Lastname, F.M. Article title. Journal Name Year, Article number, page range.
First Editon 2018
ISBN 978-3-03842-873-2 (Pbk)
ISBN 978-3-03842-874-9 (PDF)
Articles in this volume are Open Access and distributed under the Creative Commons Attribution
(CC BY) license, which allows users to download, copy and build upon published articles even
for commercial purposes, as long as the author and publisher are properly credited, which ensures
maximum dissemination and a wider impact of our publications. The book taken as a whole isc© 2018 MDPI, Basel, Switzerland, distributed under the terms and conditions of the Creative Commons
license CC BY-NC-ND (http://creativecommons.org/licenses/by-nc-nd/4.0/).
Books
MDPI

Table of Contents
About the Special Issue Editors . . . . . . . . . . . . . . . . . . . . . . . . . . . . . . . . . . . . . v
Mohammad Hammoudeh and Mounir Arioua
Sensors and Actuators in Smart Citiesdoi: 10.3390/jsan7010008 . . . . . . . . . . . . . . . . . . . . . . . . . . . . . . . . . . . . . . . . 1
Tianyu Zhang, Qian Zhao, Kilho Shin and Yukikazu Nakamoto
Bayesian-Optimization-Based Peak Searching Algorithm for Clustering in WirelessSensor Networksdoi: 10.3390/jsan7010002 . . . . . . . . . . . . . . . . . . . . . . . . . . . . . . . . . . . . . . . . 5
Abdelhamied A. Ateya, Ammar Muthanna, Irina Gudkova, Abdelrahman Abuarqoub,
Anastasia Vybornova and Andrey Koucheryavy
Development of Intelligent Core Network for Tactile Internet and Future Smart Systemsdoi: 10.3390/jsan7010001 . . . . . . . . . . . . . . . . . . . . . . . . . . . . . . . . . . . . . . . . 24
Jie Jiang, Riccardo Pozza, Kristrun Gunnarsdottir, Nigel Gilbert and Klaus Moessner
Using Sensors to Study Home Activities †
doi: 10.3390/jsan6040032 . . . . . . . . . . . . . . . . . . . . . . . . . . . . . . . . . . . . . . . . 44
Diego Castro, William Coral, Camilo Rodriguez, Jose Cabra and Julian Colorado
Wearable-Based Human Activity Recognition Using an IoT Approachdoi: 10.3390/jsan6040028 . . . . . . . . . . . . . . . . . . . . . . . . . . . . . . . . . . . . . . . . 70
Youness Riouali, Laila Benhlima and Slimane Bah
Extended Batches Petri Nets Based System for Road Traffic Management in WSNs †
doi: 10.3390/jsan6040030 . . . . . . . . . . . . . . . . . . . . . . . . . . . . . . . . . . . . . . . . 90
Yorghos Voutos, Phivos Mylonas, Evaggelos Spyrou and Eleni Charou
A Social Environmental Sensor Network Integrated within a Web GIS Platformdoi: 10.3390/jsan6040027 . . . . . . . . . . . . . . . . . . . . . . . . . . . . . . . . . . . . . . . . 109
Vincenzo Catania, Giuseppe La Torre, Salvatore Monteleone, Daniela Panno and
Davide Patti
User-Generated Services Composition in Smart Multi-User Environmentsdoi: 10.3390/jsan6030020 . . . . . . . . . . . . . . . . . . . . . . . . . . . . . . . . . . . . . . . . 126
Alex Adim Obinikpo and Burak Kantarci
Big Sensed Data Meets Deep Learning for Smarter Health Care in Smart Citiesdoi: 10.3390/jsan6040026 . . . . . . . . . . . . . . . . . . . . . . . . . . . . . . . . . . . . . . . . 145
Dhafer Ben Arbia, Muhammad Mahtab Alam, Abdullah KadrI, Elyes Ben Hamida and
Rabah Attia
Enhanced IoT-Based End-To-End Emergency and Disaster Relief Systemdoi: 10.3390/jsan6030019 . . . . . . . . . . . . . . . . . . . . . . . . . . . . . . . . . . . . . . . . 167
iii
Books
MDPI

Books
MDPI

About the Special Issue Editors
Mohammad Hammoudeh, PhD, is currently the Head of the MMU IoT Laboratory and a Senior
Lecturer in computer networks and security with the School of Computing, Math and Digital
Technology, Manchester Metropolitan University. He has been a researcher and publisher in the field
of big sensory data mining and visualization. Dr. Hammoudeh is a highly proficient, experienced, and
professionally certified cybersecurity professional, specializing in threat analysis, and information
and network security management. His research interests include highly decentralized algorithms,
communication, cross-layered solutions to the Internet of Things, and wireless sensor networks.
Mounir Arioua, PhD, is currently an associate professor at the National School of Applied Sciences
of Tetuan, University of Abdelmalek Essaadi. He received his PhD degree in Telecommunications
and Computer Science and joined the National School of Applied Sciences of Marrakech as a research
assistant. He is a member of various international scientific organizations and organizing and scientific
committees of many international workshops and conferences and a referee of several international
journals. He has authored or co-authored more than 50 papers in recognized journals and international
conferences. His research interests include communication reliability, data compression in wireless
sensor networks and embedded system-based wireless communication, and the Internet of Things.
v
Books
MDPI

Books
MDPI

Journal of
Actuator NetworksSensor and
Editorial
Sensors and Actuators in Smart Cities
Mohammad Hammoudeh 1,*,† and Mounir Arioua 2,†
1 School of Computing, Mathematics & Digital Technology, Manchester Metropolitan University,Manchester M15 6BH, UK
2 National School of Applied Sciences, Abdelmalek Essaadi University, Tétouan 93000, Morocco;[email protected]
* Correspondence: [email protected]; Tel.: +44-(0)161-247-2845† These authors contributed equally to this work.
Received: 9 February 2018; Accepted: 14 February 2018; Published: 16 February 2018
1. Scope and Aim
With the city, from its earliest emergence in the Near East between 4500 and 3100 BCE, came awide range of new discoveries and inventions, from synthetic materials to wheeled vehicles. Throughits dense population, irrigation, social continuity and physical security, emerged civil engineering,monumental construction, sculpture, mathematics, arts and law. Today, there is an enormous setof ideas and notions with respect to our ways of living, e.g., the ramp and the lever, which arestill fundamental to cities’ environmental, social, and economic structures. Modern-day smart citiescompete for the introduction of smart technologies and applications to improve key areas of urbancommunities, such as system automation, sustainability, and quality of life. Technology researchexperts paint thrilling images of futuristic cities. What’s glossed over, however, is the sensor andactuator technologies that enable these smart cities; in particular, the reliable, heterogeneous, wirelessnetworks specifically designed to provision communication across a countless number of sensorsembedded in almost everything.
The world is on the verge of a new epoch of innovation and change with the emergence of WirelessSensor Networks (WSN). The convergence of smaller, more powerful processors, smart mobile devices,low-cost sensing, big data analytics, cloud hosting and new levels of connectivity allowed by theInternet is fuelling the latest wave of Machine-to-Machine (M2M) technology. The merits of thismarriage of machines and the digital world are multiple and significant. It holds the potential todramatically alter the way in which most global industries, such as buildings, rail transportation,power grids and healthcare operate on daily basis. WSNs expand to include our vehicles and homes, aswell as newly developed wearable and implanted sensors, which brings fundamental transformationsto many aspects of daily life.
WSN innovations promise to integrate and optimise smart buildings, autonomous vehicles,power grids, etc., to enable a successful transition towards smart, user-driven and demand-focusedcity infrastructures and services [1,2]. There is a wide range of current smart cities applications,which make our lives easier and more efficient, e.g., a smart phone application that let users find freeparking spaces in the centre of town. However, cities are notoriously inefficient. As populations grow,everything from garbage collection and public transport becomes more expensive and complex. Awayfrom increasing spending, there is also a demand from citizens for smarter services driven by sensor-and actuator-based infrastructure.
In this Special Issue, we accepted submissions that focus on implementing intelligent sensinginfrastructure to solve the smart cities conundrum. This Special Issue attracted contributions fromacademic researchers in computer science, communication engineering and physics, as well asinformation technology industry consultants and practitioners, in various aspects of sensors and
J. Sens. Actuator Netw. 2018, 7, 8 1 www.mdpi.com/journal/jsan
Books
MDPI

J. Sens. Actuator Netw. 2018, 7, 8
actuators for smart cities. In the next section, we present a brief review of the papers published,highlighting their objectives and contributions.
2. A Review of Contributions in this Special Issue
Zhang et al. [3] address the challenge of large scale data analytics for smart cities. Typically,multi-modal sensor data collected from cyber physical environments, such as smart cities, mustbe processed before it can be can be used by data discovery, integration and mash-up protocols.With heterogeneous, noisy and incomplete data, clustering algorithms are used to organise the datain a dataset into clusters. The authors propose a new peak searching algorithm that uses Bayesianoptimisation to find probability peaks in a dataset to increase the speed and accuracy of data clusteringalgorithms. This proposed clustering algorithm was thoroughly evaluated in simulation and resultsshow that it significantly decreases the required number of clustering iterations (by 1.99 to 6.3 times),and produce clustering which, for a synthetic dataset, is 1.69 to 1.71 times more accurate than it is fortraditional expectation-maximization (EM). Moreover, the algorithm correctly identified the outliers ina real dataset, decreasing iterations by approximately 1.88 times, while being 1.29 times more accuratethan EM at a maximum.
Ateya et al. [4] contribution addresses the development of intelligent core network for TactileInternet and future smart systems. Tactile Internet is an extremely low latency communication networkwith high availability, reliability and security. Tactile Internet is predicted to bring a new dimension tohuman-to-human and human-to-machine interaction in a multitude of different smart city aspectssuch transport, power grid, education, healthcare and culture. This paper presents a Tactile Internetsystem structure, which employs software defined networking in the core of the cellular network andmobile edge computing at multi-levels. The contribution focuses on the structure of the core network.The proposed system is simulated under reliable environmental conditions and results shows that itachieved a round trip latency of orders of 1ms by the reducing the number of intermediate nodes thatare involved in the communication process.
Jiang et al. [5] address the problem of establishing a good measure of the agreement betweenthe activities detected from sensor-generated data and those recorded in self-reported data.The contribution reports on a trial conducted in three single-occupancy households from which data iscollected from a set of sensors and from time use diaries completed by the occupants. The authorsdemonstrate the application of Hidden Markov Models with features extracted from mean-shiftclustering and change points analysis. Then, a correlation-based feature selection is applied toreduce the computational cost. Finally, a method based on Levenshtein distance for measuring theagreement between the sensor-detected activities and that reported by the participants is demonstrated.The authors conclude their paper by an exciting discussion on lessons learnt on how the featuresderived from sensor data can be used in activity recognition and how they relate to activities recordedin time use diaries.
Taking the work in the previous contribution [5] one step further, Castro et al. [6] present asystem based on the Internet of Things (IoT) to Human Activity Recognition (HAR) that monitorsvital body signs remotely. The authors employ machine learning algorithms to determine activitiesthat occur within four pre-defined categories (lie, sit, walk and jog). Evaluation using advancedreal-world hardware platform shows that the proposed system is able to give feedback during andafter the activity is performed, using a remote monitoring component with remote visualization andprogrammable alarms. This system was successfully implemented with a 95.83% success ratio.
The contribution of Riouali et al. [7] addresses another vital area of sensing and actuation insmart cities. The authors present a road traffic management system based on wireless sensor networks.This paper introduces the functional and deployment architecture of this system with particular focuson the data analytics component, which uses a new extension of batches Petri nets for modelling roadtraffic flow. The evaluation of the proposed system was performed using a real world implementationof visualization and data analysis components.
2
Books
MDPI

J. Sens. Actuator Netw. 2018, 7, 8
Voutos et al. [8] present a social environmental sensor network integrated within a web GISplatform. Controls, user interface and extensions of the proposed system are presented. The key novelaspect of this contribution is the fact that the gathered data from the proposed system carries spatialinformation, which is fundamental for the successful correlation between pollutants and their place oforigin. The latter is implemented by an interactive Web GIS platform operating oversight in situ andon a timeline basis.
Catania et al. [9] contribute a user-generated services composition in smart multi-user environments.In this contribution, the focus is on security issues raised by services generated by users, User-GeneratedServices (UGSs). UGSs are characterized by a set of features that distinguish them from conventionalservices. To cope with UGS security problems, the authors introduce three different policy managementmodels, analysing benefits and drawbacks of each approach. Finally, a cloud-based solution that enablesthe composition of multiple UGSs and policy models, allowing users’ devices to share features andservices in IoT based scenarios is proposed.
Obinikpo et al.’s [10] contribution demonstrates how big sensed data meets deep learning forsmarter health care in smart cities. Healthcare lends itself as a natural fit for IoT technology andsmart city concepts. The authors advocate that integrating sensory data (hard sensing) with externaldata sources (soft sensing, e.g., crowd-sensing) could reveal new data patterns and information.This research addresses this challenge through hidden perception layers in the conventional artificialneural networks, namely by deep learning. The paper starts by reviewing deep learning techniquesthat can be applied to sensed data to improve prediction and decision making in smart health services.Then, a comparison and taxonomy of these methodologies based on types of sensors and sensed data ispresented. Finally, a thorough discussions on the open issues and research challenges in each categoryis given.
Arbia et al.’s [11] contribution targets smart city critical infrastructure, particularly, an IoT enabledend-to-end emergency and disaster relief system. This paper presents a new enhancement for anemergency and disaster relief system called Critical and Rescue Operations using Wearable Wirelesssensors networks (CROW 2). CROW 2 addresses the reliability challenges in setting up a wirelessautonomous communication system to offload data from the disaster area (rescuers, trapped victims,civilians, media, etc.) back to a command centre. The proposed system connects deployed rescuersto extended networks and the Internet. The system integrates heterogeneous wireless devices anddifferent communicating technologies to enable end-to-end network connectivity, which is monitoredby a cloud-based IoT platform. The overall performance of CROW 2 is evaluated using end-to-endlink quality estimation, throughput and end-to-end delay. Finally, the system architecture is validatedthrough deployment and motion detection and links unavailability prevention are highlighted.
3. Conclusions and Remarks
Sensors and actuators are the building blocks for the forth industrial revolution. They havealready transformed the way humans perceive their environment. Sensor-enabled smart cities arepaving the way for a more sustainable future, from urban planning to social conscience. The paperspublished in this special issue put humans at the centre of smart cities. From traffic managementto assisted living, human centred design of smart city services is a detrimental factor to the successof smart cities. It is evident that we are still at the start of the smart cities revolution and the fulleconomical, environmental and social benefits are yet to be achieved.
Conflicts of Interest: The authors declare no conflict of interest.
References
1. Coates, A.; Hammoudeh, M.; Holmes, K.G. Internet of Things for Buildings Monitoring: Experiences andChallenges. In Proceedings of the International Conference on Future Networks and Distributed Systems,ICFNDS ’17, Cambridge, UK, 19–20 July 2017; ACM: New York, NY, USA, 2017.
3
Books
MDPI

J. Sens. Actuator Netw. 2018, 7, 8
2. Jogunola, O.; Ikpehai, A.; Anoh, K.; Adebisi, B.; Hammoudeh, M.; Son, S.Y.; Harris, G. State-of-the-art andprospects for peer-to-peer transaction-based energy system. Energies 2017, 10, 2106.
3. Zhang, T.; Zhao, Q.; Shin, K.; Nakamoto, Y. Bayesian-Optimization-Based Peak Searching Algorithm forClustering in Wireless Sensor Networks. J. Sens. Actuator Netw. 2018, 7, 2.
4. Ateya, A.A.; Muthanna, A.; Gudkova, I.; Abuarqoub, A.; Vybornova, A.; Koucheryavy, A. Development ofIntelligent Core Network for Tactile Internet and Future Smart Systems. J. Sens. Actuator Netw. 2018, 7, 1.
5. Jiang, J.; Pozza, R.; Gunnarsdóttir, K.; Gilbert, N.; Moessner, K. Using Sensors to Study Home Activities.J. Sens. Actuator Netw. 2017, 6, 32.
6. Castro, D.; Coral, W.; Rodriguez, C.; Cabra, J.; Colorado, J. Wearable-Based Human Activity RecognitionUsing and IoT Approach. J. Sens. Actuator Netw. 2017, 6, 28.
7. Riouali, Y.; Benhlima, L.; Bah, S. Extended Batches Petri Nets Based System for Road Traffic Management inWSNs. J. Sens. Actuator Netw. 2017, 6, 30.
8. Voutos, Y.; Mylonas, P.; Spyrou, E.; Charou, E. A Social Environmental Sensor Network Integrated within aWeb GIS Platform. J. Sens. Actuator Netw. 2017, 6, 27.
9. Catania, V.; La Torre, G.; Monteleone, S.; Panno, D.; Patti, D. User-Generated Services Composition in SmartMulti-User Environments. J. Sens. Actuator Netw. 2017, 6, 20.
10. Obinikpo, A.A.; Kantarci, B. Big Sensed Data Meets Deep Learning for Smarter Health Care in Smart Cities.J. Sens. Actuator Netw. 2017, 6, 26.
11. Ben Arbia, D.; Alam, M.M.; Kadri, A.; Ben Hamida, E.; Attia, R. Enhanced IoT-Based End-To-End Emergencyand Disaster Relief System. J. Sens. Actuator Netw. 2017, 6, 19.
c© 2018 by the authors. Licensee MDPI, Basel, Switzerland. This article is an open accessarticle distributed under the terms and conditions of the Creative Commons Attribution(CC BY) license (http://creativecommons.org/licenses/by/4.0/).
4
Books
MDPI

Journal of
Actuator NetworksSensor and
Article
Bayesian-Optimization-Based Peak SearchingAlgorithm for Clustering in WirelessSensor Networks
Tianyu Zhang *, Qian Zhao, Kilho Shin and Yukikazu Nakamoto
Graduate School of Applied Informatics, University of Hyogo, Computational Science Center Building 5-7F7-1-28 Minatojima-minamimachi, Chuo-ku Kobe, Hyogo 6570047, Japan; [email protected] (Q.Z.);[email protected] (K.S.); [email protected] (Y.N.)* Correspondence: [email protected]
Received: 31 October 2017; Accepted: 29 December 2017; Published: 2 January 2018
Abstract: We propose a new peak searching algorithm (PSA) that uses Bayesian optimization to findprobability peaks in a dataset, thereby increasing the speed and accuracy of clustering algorithms.Wireless sensor networks (WSNs) are becoming increasingly common in a wide variety of applicationsthat analyze and use collected sensing data. Typically, the collected data cannot be directly usedin modern data analysis problems that adopt machine learning techniques because such data lacksadditional information (such as data labels) specifying its purpose of users. Clustering algorithmsthat divide the data in a dataset into clusters are often used when additional information is notprovided. However, traditional clustering algorithms such as expectation–maximization (EM) andk-means algorithms require massive numbers of iterations to form clusters. Processing speeds aretherefore slow, and clustering results become less accurate because of the way such algorithms formclusters. The PSA addresses these problems, and we adapt it for use with the EM and k-meansalgorithms, creating the modified PSEM and PSk-means algorithms. Our simulation results showthat our proposed PSEM and PSk-means algorithms significantly decrease the required numberof clustering iterations (by 1.99 to 6.3 times), and produce clustering that, for a synthetic dataset,is 1.69 to 1.71 times more accurate than it is for traditional EM and enhanced k-means (k-means++)algorithms. Moreover, in a simulation of WSN applications aimed at detecting outliers, PSEMcorrectly identified the outliers in a real dataset, decreasing iterations by approximately 1.88 times,and PSEM was 1.29 times more accurate than EM at a maximum.
Keywords: peak searching; clustering; Gaussian mixture model; Bayesian optimization;Gaussian process; outlier detection
1. Introduction
Over the past decade, wireless sensor networks (WSNs) have been widely applied in applicationsthat involve analyzing collected data to improve quality of life or secure property. For example,sensor nodes are present in homes, vehicle systems, natural environments, and even satellites andouter space. These sensors collect data for many different purposes, such as health monitoring,industrial safety and control, environmental monitoring, and disaster prediction [1–4]. In such WSNapplications, sensing data can be manually or automatically analyzed for specific purposes. However,in the age of big data, an increasing amount of sensing data is required for precise analysis in the WSNapplications. Consequently, it is difficult or, in some cases, even impossible to manually analyze all ofthe collected data.
There are several conventional ways to automatically manage the collected data. The most typicaland the easiest method is to set threshold values that correspond to sensing events. Events are triggered
J. Sens. Actuator Netw. 2018, 7, 2 5 www.mdpi.com/journal/jsan
Books
MDPI

J. Sens. Actuator Netw. 2018, 7, 2
once the data exceed these thresholds. However, the thresholds in large-scale WSNs vary, and changedue to environment changes. Moreover, precise analysis results cannot be obtained through the use ofthresholds alone.
A complementary approach uses supervised machine learning. In this approach, a model istrained that can categorize sensing data into the different states required by an application. However,because sensing data labels are required in the training phase, extra work is required to managethe data. This process is particularly difficult when the dataset is large. Moreover, if the sensingenvironment changes, certain labels must also change. It is difficult to maintain a functional modelunder conditions where labels change frequently; this affects the analysis results.
Unsupervised machine learning methods are feasible and well-studied, and are not associatedwith the data labeling problems described above. Clustering is an important and commonmethod in such approaches. In clustering, the overall features of the dataset are extracted. Then,the data are divided into clusters according to their features. As a result, data labeling is notrequired, and the data-labeling difficulties that occur in supervised approaches can be avoided.However, in state-of-the-art clustering methods such as the expectation-maximization (EM) [5] andk-means [6] algorithms, a massive number of iterations must be performed in order to form clusters,and a significant amount of computation time is required. Furthermore, because these algorithmsuse random starting data points as initial center points to form clusters, and because the number ofclusters is not precisely determined, the clustering results become less accurate. To address theseproblems, in this paper, we propose a peak searching algorithm (PSA) for improving clusteringalgorithm capabilities.
Our approach should be applicable to different dataset distributions. Therefore, the collectedsensing dataset is considered to be generated by a Gaussian mixture model composed of severaldifferent Gaussian distributions. If the number of Gaussian distributions and appropriate initial centerpoints are known, clustering algorithms can appropriately divide the dataset into different clustersbecause each Gaussian distribution corresponds to a cluster. The proposed PSA employs a Bayesianoptimization (BO) strategy that uses a Gaussian process [7]. Bayesian optimization is typically usedfor hyper-parameter optimizations; to the best of our knowledge, our approach is the first to use BOto improve clustering. Moreover, other Bayesian theorem based algorithms, such as [8–11], are alsoappropriate optimization strategies for training online and offline machine learning algorithms.
Given a collected dataset, the PSA searches for the data points with the highest probability values(i.e., peaks in the dataset). A Gaussian distribution peak is a point that corresponds to the mean.By searching the peaks, we can obtain appropriate initial center points of Gaussian distributions,hence, the corresponding clusters. This method overcomes the difficulties associated with the harddetermination of starting data points in traditional cluster algorithms, thereby reducing the number ofiterations. By using the PSA, cluster algorithms can form clusters using peak points instead of randomstarting points, which improves the clustering accuracy.
We used simulations to investigate the potential of the proposed PSA for improving algorithmperformance. To measure performance improvements, we applied the PSA to the EM andk-means algorithms. We refer to these modified algorithms as PSEM and PSk-means, respectively.The simulation results showed that, for PSEM and PSk-means, the required numbers of clusteringiterations were significantly reduced by 1.99 to 6.3 times. Additionally, for synthetic datasets, clusteringaccuracy was improved by 1.69 to 1.71 times relative to the traditional EM and enhanced version ofk-means, i.e., k-means++ [12].
The proposed method can accurately group data into clusters. Therefore, any outliers in a datasetcan be clustered together, making them possible to identify. Because outliers obviously reduce thecapabilities of the WSN applications, we also conducted a simulation using a real WSN dataset fromthe Intel Berkeley Research lab (Berkeley, CA , USA). This allowed us to compare the outlier-detectioncapabilities of PSEM and EM. Our simulation results showed that PSEM correctly identified outliers,decreased iterations by approximately 1.88 times, and improved accuracy by 1.29 times at a maximum.
6
Books
MDPI

J. Sens. Actuator Netw. 2018, 7, 2
The remainder of this paper is organized as follows. Section 2 outlines related works, whileSection 3 introduces BO. Section 4 describes the proposed PSA and Section 5 presents the simulationresults. Section 6 presents a discussion of this work. Section 7 summarizes key findings, presentsconclusions, and describes potential future work.
2. Related Works
This section describes the techniques used in the clustering algorithms, which are used toautomatically divide a collected dataset into different clusters. There are two main types of clusteringapproaches. The first is based on parametric techniques. To cluster a dataset, the parameters ofthe statistical model for a dataset must be calculated. The EM algorithm is a parametric technique.The second type of clustering approach uses non-parametric techniques, in which the calculatedparameters of a statistical model are not required for clustering a dataset. k-means and k-means++ arenon-parametric techniques.
We describe the two clustering approaches in the following subsections. Moreover, because outlierdetection is critical in the WSN applications, we describe some relevant outlier detection approaches.
2.1. Parametric Techniques
Parametric techniques assume that a dataset is generated from several parametric models, such asGaussian mixture models. The clustering process is conducted by calculating the parameters of eachGaussian model, and assuming that data points in the same cluster can be represented by the sameGaussian model. Usually, a Gaussian model is chosen as the default model because it conforms to thecentral limit theorem [13,14] parametric techniques used. From the collected dataset, they calculateddetailed a priori estimates of statistical parameters for the assumed statistical model (for example,the mean, median, and variance). This allowed them to fit statistical models.
EM [5] is a famous and widely used algorithm for clustering datasets using parametric techniques.The EM algorithm first calculates responsibilities with respect to given parameters (means andvariances). This is referred to as the E-step. Then, the EM algorithm uses the responsibilities toupdate the given parameters. This is referred to as the M-step. These two steps are iterativelyexecuted until the parameters approach the true parameters of the dataset. When those parameters aredetermined, the Gaussian models in the Gaussian mixture model are fixed. Therefore, clustering canbe accomplished using the Gaussian models.
There are many benefits associated with parametric techniques: (i) such techniques assign aprobability criterion to every data point to determine whether or not it belongs to a cluster; and (ii) suchtechniques do not require additional information (for example, labels on data points that indicate theirstatuses). On the other hand, parametric techniques cannot be deployed in a distributed way becausea significant number of data points are required to estimate the mean and variance. Thus, methodsthat use parametric techniques are deployed in a centralized way.
2.2. Non-Parametric Techniques
Some algorithms use non-parametric techniques, which cluster datasets without using statisticalmodels. Non-parametric techniques make certain assumptions, such as density smoothness.Typical methods use histograms, as in [15–17]. Histogram-based approaches are appropriate fordatasets in low-dimensional spaces because the calculations in histogram-based techniques have anexponential relationship with the dimensions of a dataset. Therefore, this type of approach has lowscalability to problems with larger numbers of data points and higher-dimensional spaces.
One typical non-parametric cluster algorithm is k-means [6]. In k-means, when candidate clustercenters are first provided to the algorithm, the number of centers is equal to the number of clusters.Then, k-means is used to calculate the sum of the distances from the center of each cluster toevery data point. These two steps are iteratively executed, and k-means updates the given clustercenters by minimizing the calculated sum. When cluster centers are determined, clusters are formed.
7
Books
MDPI

J. Sens. Actuator Netw. 2018, 7, 2
However, k-means cannot guarantee that the candidate centers will be close to the true cluster centers.The iterations and clustering accuracy of the algorithm are not satisfying.
To overcome the disadvantages of k-means, Arthur and Vassilvitskii [12] proposed k-means++,which is based on the k-means algorithm. k-means++ and k-means are different because k-means++uses the number of k values to execute a calculation that identifies the appropriate data points to useas the initial centers. In contrast, in the k-means algorithm, the initial centers are randomly selected,which increases the number of clustering iterations. Therefore, k-means++ requires fewer iterationsthan k-means.
In conclusion, there are disadvantages associated with the use of both parametric andnon-parametric techniques in the WSNs. Parametric techniques can only estimate a modelwhen sufficient data is available, and they are therefore difficult to use in a distributed way.While non-parametric techniques can be executed in a distributed way in the WSNs, they cannotprovide a probability criterion for detection. Moreover, both techniques require a massive number ofiterations to form clusters and use random starting data points. These require significant computingpower and have low accuracy.
2.3. Outlier Detection in WSN Applications
Outliers are very common in collected datasets for two reasons. First, sensor nodes are vulnerableto failure because the WSNs are often deployed in harsh environments [18–21]. Outliers are commonlyfound in datasets collected by the WSNs installed in harsh environments [22,23]. Second, noisein wireless signals and malicious attacks both create outliers [24,25], which obviously reduce theWSN capabilities.
The clustering methods are also used for outlier detection in the WSN applications. For instance,to robustly estimate the positions of sensor nodes, Reference [26] used the EM algorithm to iterativelydetect outlier measurements. The EM algorithm was used to calculate variables that could indicatewhether or not a particular measurement was an outlier. Reference [27] conducted similar workusing EM algorithms to detect outliers. Additionally, Reference [28] proposed a novel flow-basedoutlier detection scheme based on the k-means clustering algorithm. This method separated a datasetcontaining unlabeled flow records into normal and anomalous clusters. Similar research by [29] usedk-means to detect heart disease. However, approaches using EM and k-means to detect outliers sufferfrom the previously mentioned problems of clustering iteration and accuracy. The approach that weintroduce later in this paper can solve such problems.
3. Bayesian Optimization
Before a dataset can be divided into clusters, the starting data points of clusters in the dataset mustbe determined. In particular, the number of peak points (a peak point is a data point corresponding tothe maximum probability) in a dataset corresponds to the number of clusters. In this study, we useBO to identify peak points. Typically, we do not know the form of the probability density functionp(x). Nevertheless, we can obtain the approximate value f (x) of p(x) at data point x, with somenoise. For example, we can approximately compute the density of a certain volume. This density is anapproximate value of the probability density (see Section 4). However, obtaining the maximum densitycan be computationally expensive because of the large number of data points. To reduce computationcosts, we used BO [30,31], a very powerful strategy that fully utilizes prior experience to obtain themaximum posterior experience at each step. This allows the maximum density to be approached.Thus, fewer data points are required to obtain the maximum density. In the following subsection,we introduce the Gaussian process used in BO.
3.1. Gaussian Process
In BO, a Gaussian process (GP) is used to build a Gaussian model from the provided information.The model is then updated with each new data point. Assume that a set of data points contains t
8
Books
MDPI

J. Sens. Actuator Netw. 2018, 7, 2
elements: {x1, x2, · · · , xt}. We use the notation x1:t to represent the set of data points. Each of thesepoints exists in a D-dimensional space. An example data point is xi = (xi1, · · · , xiD).
There is an intuitive analogy between a Gaussian distribution and a GP. A Gaussian distributionis a distribution over a random variable. In contrast, the random variables of a GP are functions.The mean and covariance are both functions. Hence, function f (x) follows a GP and is definedas follows:
f (x) ∼ GP(m(x), k(x, x′)), (1)
where m(x) is the mean function, and k(x, x′) is the kernel function of the covariance function.Suppose that we have a set of data points x1:t and their corresponding approximate probability
density { f (x1), f (x2), · · · , f (xt)}. We assume that function f (xi) can map a data point xi toits probability density p(xi) with some noise. For concision, we will use f1:t to representthe set of functions for each data point { f (x1), f (x2), · · · , f (xt)}. For the collected dataset,D1:t = {(x1, f1), (x2, f2), · · · , (xt, ft)} is the given information. For convenience, we assume thatD1:t follows the GP model, which is given by an isotropic Gaussian N (0, K) whose initial meanfunction is zero and covariance function is calculated using K, as follows: (k(xi, xj) consists of thekernel functions)
K =
⎡⎢⎣k (x1, x1) · · · k (x1, xt)...
. . ....
k (xt, x1) · · · k (xt, xt)
⎤⎥⎦Once, we have calculated K, we build a GP model from the information provided.A new data point xt+1 also follows ft+1 = f (xt+1). According to the GP properties, f1:t and ft+1
are jointly Gaussian: [f1:tft+1
]= N
(0,
[K kkT k (xt+1, xt+1)
])where
k =[k (xt+1, x1) k (xt+1, x2) · · · k (xt+1, xt)
]Moreover, we want to predict the approximate probability density ft+1 of the new data point xt+1.
Using Bayes’ theorem and D1:t, we can obtain an expression for the prediction:
P ( ft+1|D1:t, xt+1) = N(
μt(xt+1), σ2t (xt+1)
)(2)
where
μt (xt+1) = kTK−1 f1:t,
σ2t (xt+1) = k(xt+1, xt+1)− kTK−1k (3)
We can observe that μt and σ2t are independent of ft+1 and that we can calculate ft+1 using the
given information.
3.2. Acquisition Functions for Bayesian Optimization
Above, we briefly describe how to use the given information to fit a GP and update the GPby incorporating a new data point. At this point, we must select an appropriate new data pointxi+1 to use to update the GP, so that we can obtain the maximum value of f (xi+1). To achievethis, we could use BO to realize exploitation and exploration. Here, exploitation means that weshould use the data point with the maximum mean in the GP because that point fully uses the giveninformation. However, this point cannot provide additional information about the unknown space.Exploration means that a point with a larger variance in the GP can provide additional information
9
Books
MDPI

J. Sens. Actuator Netw. 2018, 7, 2
about the unknown area. The acquisition functions used to find an appropriate data point are designedon the basis of exploitation and exploration. There are three popular acquisition functions: probabilityof improvement, expectation of improvement, and upper confidence bound criterion.
The probability of improvement (PI) function is designed to maximize the probability ofimprovement over f (x+), where x+ = argmaxxi∈x1:t
f (xi). The resulting cumulated distributionfunction is:
PI(x) = P(
f (x) ≥ f (x+) + ξ)
= Φ(
μ(x)− f (x+)− ξ
σ(x)
)(4)
where ξ is the exploration strength, which is provided by the user.The expectation of improvement (EI) is designed to account for not only the probability of
improvement, but also the potential magnitude of improvement that could be yielded by a point.The EI is expressed as
EI(x) =
{(μ(x)− f (x+)− ξ)Φ(Z) + σ(x)φ(Z) i f σ(x) > 0
0 i f σ(x) = 0(5)
Z =
⎧⎨⎩μ(x)− f (x+)−ξ
σ(x), i f σ(x) > 0
0, i f σ(x) = 0(6)
The upper confidence bound (UCB) criterion uses the confidence bound, which is the arearepresenting the uncertainty between the mean function and variance function in Equation (3).The UCB is compared with the other two acquisition functions, and is relatively simple and intuitive.In detail, it directly uses the mean and variance functions obtained from the given information.A potential new data point is presented by the sum of (i) the mean function, and (ii) a constant ν timesthe variance function. That is, given several potential new data points, the data point with the largestUCB will be selected as the next new data point. Moreover, ν, which is greater than 0, indicates howmany explorations are expected. The UCB formula is
UCB(x) = μ(x) + νσ(x) (7)
These three acquisition functions are suited to different datasets, and allow us to obtain anappropriate new data point. The BO algorithm (Algorithm 1) is shown below.
Algorithm 1: BO
1 for i = 1, 2, . . . do
2 Fit a GP to the given information D1:t;3 Use acquisition functions to find a data point x that has the maximum value μ(x|D1:t) over
GP;4 Calculate the value of f (x) at xi;5 Augment the dataset D1:t+1 = {D1:t, (xi, fi)} and update the GP;6 end
4. Peak Searching Algorithm
In this section, we first introduce some preliminary information related to our proposed algorithm.Then, we explain the algorithm.
10
Books
MDPI

J. Sens. Actuator Netw. 2018, 7, 2
4.1. Preliminary Investigations
In most cases, the environment can be represented as a collection of statuses that indicate whetheror not certain events have occurred. Such events include fires, earthquakes, and invasions. The datapoints collected by the sensor nodes contain measurements that describe the statuses of these events.One can assume that the collected dataset is generated by a Gaussian mixture model (GMM) because thedata points contained in the dataset are collected from the normal environment, or from natural events.Thus, before fitting a GMM, it is necessary to clarify the peaks of the GMM because each peak is a pointthat has the largest probability corresponding to a Gaussian distribution. Therefore, we need to knowthe probability of each data point when we search for the dataset peaks. Although the probabilitydensity function is unknown, it can be approximated using alternative methods, which are shownas follows.
One type of method assumes that the set of data points exists in a D-dimensional space.The probability of data point x can then be approximated as follows: (i) set x as the center of a volumewith side h. Figure 1 shows an example of a volume in 3D space, where the length of each side is h;and (ii) the density of the volume with center x, calculated using Equation (8) [31], is approximatelyequal to the probability at data point x. The density p(x) in this formula depends on the length of sideh in the volume and the number T (that is, the number of neighbors of data point x in the volume).N is the total number of data points in the dataset and hD is the size of the volume. Thus, to searchfor the peaks, we must calculate the densities of all of the different data points using Equation (8).However, this is computationally expensive:
p (x) =T
NhD . (8)
Figure 1. A volume in three-dimensional space.
Another method fixes h and applies a kernel density estimator [31]. In this case, the probability ofdata point x can be calculated as
p(x) =1
NhD
T
∑i=1
K(
x − xih
), (9)
where K(•) is the kernel function and T is the number of data points in a volume with side h.Then, the largest value of p(x) occurs along the gradient of Equation (9), which is
∇p(x) =1
NhD
T
∑i=1
K′(
x − xih
). (10)
By setting Equation (10) equal to zero, we can calculate the point along the gradient that hasthe largest p(x). With this method, we do not need to search through the unimportant data points,which reduces the time required to identify peaks. However, Equations (9) and (10) are difficult to
11
Books
MDPI

J. Sens. Actuator Netw. 2018, 7, 2
solve. Moreover, the length of side h affects the peak search results. Firstly, it supposes that all of thevolumes have the same size because they have the same h. Secondly, an inappropriate h value will leadto an incorrect result. In particular, h values that are too large cause over-smoothing in high-densityareas, while h values that are too small cause significant noise in low-density areas. To overcome theseshortcomings, we introduce the PSA, which we describe in the following subsection.
4.2. The Algorithm
We propose a peak searching algorithm (PSA) that does not consider parameter h. We will usesimulations to investigate the details of the PSA, which can be used to improve the speed and accuracyof clustering algorithms such as EM and k-means.
In Equation (10), x−xih is a vector that starts at point x and ends at neighboring point xi. Because a
kernel function is used to calculate the inner product of the vector, in this case, the inner product isequal to the vector mode. Moreover, it calculates the largest p(x) and the location of data point xwhere x on the vector at 1
NhD times the mode of the vector. Therefore, the largest probability for findingthe peak lays on this vector. This allows us to concentrate only on the vector, without consideringconstants 1
NhD and h. Hence, we propose using Vx to represent the vector in the PSA as
Vx =∑T
i=1(x − xi)
‖∑Ti=1(x − xi)‖
. (11)
In Equation (11), only Vx is searched. A significant amount of non-important space is not searched.However, many probabilities must be calculated along Vx. Moreover, because there are too manydata points on the vector Vx, it becomes impossible to search for the best data point with the largestprobability in a limited amount of time. Hence, we apply BO when searching for the largest probabilityalong Vx. BO optimizes the method for searching the maximum probability value mentioned inAlgorithm 1. However, as we mentioned in Section 3, the form of probability function p(x) is notknown, and it can instead be represented by an approximate probability function, which is f (x)in Algorithm 1 line 4. Therefore, in this paper, we use Equation (8) to calculate the approximateprobability function, which we use in the proposed algorithm. Equation (8) is simpler and morepractical for finding dataset peaks. The following describes the details of the proposed PSA.
Next, we will explain how the PSA works in accordance with Algorithm 2. The initializingstep requires a number of starting data points from which to begin the search for peaksbecausethe dataset may contain multiple peaks. Therefore, the PSA randomly selects M starting points,{x(1), x(2), · · · , andx(M)}. For convenience, we will use starting point x(j) to describe the details of themethod. Vector x(j) is calculated using Equation (11) in line 1. The peak searching process shownin Figure 2 contains four steps. In Step 1, the PSA uses Algorithm 1 to search for the peak. That is,data point x(j)
i , which has a maximum probability along V (j)x . The probability denoted by p
(x(j)
i
)is
calculated using Equation (8) as shown in line 4. In Step 2 in line 5, a new vector V (j)xi is calculated on
the basis of x(j)i and its T neighboring data points. In Step 3, the method searches for the peak x(j)
i+1
along V (j)xi in line 6. Notice that data points x(j)
i and x(j)i+1 are possible dataset peaks. Step 4 starts from
line 7 to 14, and the method repeats these steps until the difference between p(
x(j)i
)and p
(x(j)
i+1
)gets
close enough to zero. At this point, data point x(j)i+1 is selected as a dataset peak. The same four steps
are used with the other starting data points to identify all peaks in the dataset.
12
Books
MDPI

J. Sens. Actuator Netw. 2018, 7, 2
Algorithm 2: PSA
1 Given a starting data point x(j), and calculate the V (j)x ;
2 i = 0 ;3 while True do
4 Search for Max p(
x(j)i
)along V (j)
x by using Algorithm 1 ;
5 Set x(j)i as a peak and calculate V (j)
xi with x(j)i ’s K neighbors;
6 Search for Max p(
x(j)i+1
)along V (j)
xi by using Algorithm 1 ;
7 if∣∣∣p (x(j)
i
)− p
(x(j)
i+1
)∣∣∣ < ε then
8 x(j)i+1 is a peak of the dataset ;
9 break ;10 else
11 Set x(j)i+1 as a peak and calculate V (j)
xi+1 with x(j)i+1’s T neighbors ;
12 V (j)x ← V (j)
xi+1 ;13 i ← i + 1 ;14 end
15 end
Figure 2. Peak searching.
5. Simulation and Analysis
In this section, we investigate the efficiency of the proposed PSA. Because the PSA is a method forimproving clustering algorithms, we must use it in state-of-the-art clustering algorithms to evaluate theextent to which the PSA can improve those algorithms. As mentioned in Section 2, EM and k-meansare common clustering algorithms. Here, variations of those algorithms using the PSA are referred toas PSEM and PSk-means, respectively. In PSEM and PSk-means, the PSA first searches the peaks ofthe collected dataset. Then, EM and k-means use the obtained peaks as the initial starting points tostart clustering. In the simulations, we assume that the collected datasets follow GMMs, and that thenumber of peaks found by the PSA is equal to the number of Gaussian distributions.
13
Books
MDPI

J. Sens. Actuator Netw. 2018, 7, 2
We conducted simulations using synthetic datasets and a real dataset. In simulations withsynthetic datasets, we compared the accuracies and iterations of PSEM and PSk-means with those ofthe original EM (OEM), k-means, and k-means++ algorithms. Moreover, because recall and precisionare important evaluation indicators, we also used the simulations to compare recalls and precisions.In the simulation using a real dataset, we simulated our methods in order to detect outliers. Becausea real dataset could be either isotropic or anisotropic, and because k-means has a weak effect onanisotropic datasets, we only compared PSEM to OEM for the real dataset.
5.1. Simulation on Synthetic Datasets
5.1.1. Synthetic Dataset
We generated two synthetic datasets, whose data points contained two features. Each datasetwas generated using a GMM that contained two different Gaussian distributions. The Gaussiandistributions in the first dataset were isotopically distributed; their true peaks (means) were (1, 1)and (2, 2) and their variances were 0.6 and 0.5, respectively. The Gaussian distributions in thesecond synthetic dataset were transformed using the following matrix to create anisotropicallydistributed datasets: [
0.6 −0.6−0.4 0.8
].
The two synthetic datasets are shown in Figure 3. The two synthetic datasets are appropriate forthese types of simulations because they can represent both easy and difficult clustering situations. Thisallows us to evaluate the effects of our algorithm.
Figure 3. Synthetic dataset.
5.1.2. Simulations and Results
To estimate the extent to which the PSA can improve clustering capabilities, we compared PSEMwith the original EM (OEM) algorithm. Both PSEM and OEM use EM to fit a GMM, and have a timecomplexity of O(N3), where N is the number of data points. Hence, we cannot use time complexity tocompare PSEM and EM. Computational efficiency can also be measured from the number of iterations.The EM algorithm contains two steps: the E-step and the M-step. These two steps are iterativelyexecuted to fit a GMM, and are the core calculations of this algorithm. Hence, we compared thenumber of iterations in PSEM (i.e., how many E-steps and M-steps were executed) with the numberof iterations in OEM. Note that the OEM algorithm does not use PSA, so its calculations start atrandomly selected initial starting points.
14
Books
MDPI

J. Sens. Actuator Netw. 2018, 7, 2
PSEM and OEM were executed 200 times for the two different datasets. Figure 3 shows 200 peaksearching results for PSA. The dark crosses indicate the peaks identified by PSA. We can see that,in the isotropically distributed dataset, the identified peaks are very close to the true peaks. In theanisotropically distributed dataset, the identified peaks are also close to the true peaks. Figure 4illustrates the number of iterations (y-axis) for each size of dataset (x-axis). In the peak searching step,three different acquisition functions are used (UCB, EI, and PI), and their calculation efficiencies arecompared. According to the results shown in Figure 4, there were 3.06 to 6.3 times fewer iterations forPSEM than OEM. In other words, the PSA improved the calculation efficiency of OEM by 73.9% to86.3%. Moreover, we can see that there is no obvious difference between the three acquisition functions.q
Figure 4. Comparison of iterations: OEM.
Because we wanted to fairly estimate the extent to which the proposed PSA improves clusteringcapabilities, we compared the PSA to k-means++ in another simulation. k-means++ uses a specialmethod to calculate its initial points, and its clustering method increases the speed of convergence.Note that both PSk-means and k-means++ are based on k-means, which has a time complexity O(N2T),where N is the number of data points and T is the number of iterations. Similarly, we cannot use timecomplexity to compare calculation efficiencies. However, we can compare the number of iterationsrequired for PSk-means to that required for k-means++. Both of these algorithms were executed200 times with the two different datasets, and the results are shown in Figure 5.
Figure 5. Comparison of iterations: k-means++.
The simulation results are shown in Figure 5. The average number of iterations for PSk-means isreduced by 1.04 to 1.99 times compared with the number of iterations for k-means++. In other words,
15
Books
MDPI

J. Sens. Actuator Netw. 2018, 7, 2
the PSA improved the calculation efficiency of OEM by 51% to 67%. Additionally, there was noobvious difference between the three acquisition functions.
5.1.3. Performance Estimation of Clustering
Accuracy, precision, and recall are three commonly used measurements for estimating machinelearning algorithm performance. Therefore, we adopt these measurements to quantify the performancesof our proposed algorithm. In simulations, a dataset containing two clusters is generated by GMM. Toexplain these measurements, we assume that the two clusters are cluster A and cluster B. Data pointsbelonging to cluster A are considered to be positive instances, while those that belong to cluster B areconsidered to be negative instances. If a data point from cluster A is correctly clustered into clusterA, it is a true positive (TP) result. Otherwise, it is a false positive result (FP). Similarly, if a data pointfrom cluster B is correctly clustered into cluster B, that is a true negative (TN); otherwise, it is a falsenegative (FN). Overall accuracy can be calculated as follows:
accuracy =TP + TN
TP + FP + TN + FN. (12)
Recall is equal to the ratio of TP to the total number of positive instances. It is based on the totalpositive instances, and shows how many positive instances can be detected by the algorithm. It iscalculated as
recall =TP
TP + FN. (13)
From a prediction standpoint, Precision indicates how many TPs occur in the detected positiveinstances. It presents the proportion of TP to the total number of data points that are detected aspositive, which is equal to TP + FP. Precision is calculated as
precision =TP
TP + FP. (14)
We estimated the accuracy, precision, and recall of the PSk-means and PSEM clusteringalgorithms, and compared the values with those for k-means, k-means++, and OEM. We repeatedthis estimation 200 times for each dataset; the average accuracy of each algorithm is shown inFigures 6 and 7. The isotropic datasets shown in Figure 3 are difficult to cluster because the twoclusters partially overlap and their centers are very close together. We can see from the simulationresults shown in Figure 6 that the estimations of k-means, k-means++, and OEM are similar. However,PSk-means and PSEM show a great improvement over their original algorithms. The accuracy ofPSk-means is 1.69 times higher than that of k-means++, while that of PSEM is 1.71 times higher thanthat of OEM. The recall of PSk-means is 1.66 times higher than that of k-means++, and the recall ofPSEM is 1.83 times higher than that of OEM. Moreover, the precision of PSk-means is 1.64 timeshigher than that of k-means++’s. The precision of PSEM is 1.84 times higher than that of OEM.
16
Books
MDPI

J. Sens. Actuator Netw. 2018, 7, 2
Figure 6. Measurements for isotropic dataset.
Figure 7. Measurements for anisotropic dataset.
The results for the anisotropic datasets are shown in Figure 7. Because the anisotropic datasetsare elliptical, as shown in Figure 3, and the two datasets are very close together, the datasets arevery difficult to cluster. As a result, k-means and k-means++ exhibit low estimation performance,and PSk-means yields little improvement. However, the accuracy of PSEM was 1.48 times higher thanthat of OEM, and its recall and precision were 1.44 and 1.48 times higher, respectively, than they werefor OEM. Accordingly, we can see that the PSA can improve clustering accuracy.
5.2. Simulation on a Real Dataset from Intel Berkeley Research Laboratory
We used a real sensor dataset from the Intel Berkeley Research Laboratory [32] to assess outlierdetection performance. In the simulation, we only considered two features for each data point:temperature and humidity. Each sensor node contained 5000 data points, which are shown in Figure 8.
Because the original dataset did not provide any outlier information or labels, we manuallycleaned the data by removing values that fell outside a normal data range. All of the remaining datapoints were considered to be normal. Table 1 lists the normal data ranges.
17
Books
MDPI

J. Sens. Actuator Netw. 2018, 7, 2
Figure 8. Dataset from Intel Berkeley Research Laboratory.
Table 1. Normal data ranges.
Range Average
Temperature (◦C) 21.32–28.14 23.14Humidity (%) 26.39–44.02 37.69
After completing this step, a uniform distribution was used to generate artificial outliers.Temperature outliers were generated within a range of (27–30) ◦C, and humidity outliers weregenerated within a range of (42–46)%. Thus, some outliers can fall inside the normal range withthe same probability. Outliers were then inserted into the normal dataset. We produced four differentcases, in which the outliers accounted for 5%, 15%, 20%, and 25% of the total normal data points.
5.2.1. Setting of WSNs
PSEM and OEM were run for a real dataset from the Intel Berkeley Research Laboratory.The deployment of the WSNs is shown in Figure 9. There were 54 sensor nodes, each of whichhad a Mica2Dot sensor for collecting humidity, temperature, light, and voltage values. Temperatureswere provided in degrees Celsius. Humidity was provided as temperature-corrected relative humidity,and ranged from 0–100%. Light was expressed in Lux (1 Lux corresponds to moonlight, 400 Lux to abright office, and 100, 000 Lux to full sunlight), and voltage was expressed in volts, ranging from 2–3.The batteries were lithium ion cells, which maintain a fairly constant voltage over their lifetime; notethat variations in voltage are highly correlated with temperature. We selected data from 10 sensornodes (nodes 1 to 10) to test our method, and used only humidity and temperature values.
In this simulation, we assumed that the WSN was hierarchical and consisted of classes. (“Cluster”is used in the WSNs to describe a group of sensor nodes. However, “cluster” can also refer to a groupof similar data points in data mining. In this paper, we use “class” instead of cluster to describe agroup of sensor nodes). Each class contained one class head (CH) and other member sensor nodes(MSNs). The MSNs sent the data points collected over a certain time period to the CH, which usedthe proposed method to monitor whether the dataset collected from its members contained outliers.The configuration of the WSNs is shown in Figure 10.
18
Books
MDPI

J. Sens. Actuator Netw. 2018, 7, 2
Figure 9. Floor plan of Intel Berkeley Research Laboratory.
Figure 10. WSN configuration.
5.2.2. Results
Using the real dataset, we tested the proposed PSEM and compared it with the OEM. The CHexecuted the PSEM or OEM to detect outliers, and sent outlier reports to the base station. We generatedfour different datasets, containing 5%, 15%, 20%, and 25% outliers. (Figures 11 and 12).
Figure 11. Accuracy of real dataset.
19
Books
MDPI

J. Sens. Actuator Netw. 2018, 7, 2
Figure 12. No. of iterations for dataset.
It was relatively easy to detect outliers in the test dataset containing only 5% outliers becausethe proportion of outliers was so low. Thus, the accuracy of our method approached 100% for 5%outliers. In contrast, the accuracy of the OEM was only approximately 85%. In the other datasets,more outliers fell within the normal dataset. In such cases, it was difficult to detect the outliers;the accuracies of both methods decreased as the proportion of outliers increased. However, PSEMremained more accurate than OEM. In the worst case, with 25% outliers in the test dataset, its accuracyof PSEM was approximately 80%, while the accuracy of OEM was only approximately 60%. That is,PSEM was about 1.09 to 1.29 times more accurate than OEM. Moreover, Figure 12 shows the numberof iterations was 1.52 to 1.88 times lower for PSEM, meaning that PSEM improved the calculationefficiency of OEM by 60% to 65.2%. Because accuracy and iteration numbers are very important metricsfor assessing the clustering algorithm efficiency, this simulation result demonstrated the practicalsignificance of PESM, and, therefore, of the PSA.
6. Discussion
In this section, we describe other important aspects of the WSNs, such as WSN powerconsumptions and lifetime. We also discuss the advantages and disadvantages of the proposed method.
Because most sensor nodes in the WSNs are powered by batteries, sensor node powerconsumptions, WSN lifetime, and energy efficiency are also important problems affecting the qualityof a WSN. Mostafaei et al. [33] proposed an algorithm PCLA to schedule sensors into active or sleepstates, utilizing learning automata to extend network lifetime. Our previous work attempted to extendbattery life by reducing peak power consumption. We scheduled sensor execution times [34], and usedoptimized wireless communication routes to reduce energy consumption, with the goal of prolongingnetwork lifetimes [35,36]. If the proposed PSA can be applied in such approaches to analyze datausing clustering methods, then energy consumption can be further reduced. Because the PSA canreduce clustering iterations, the required computational power decreases, leading to energy savings.
The proposed algorithm has advantages and disadvantages. In conventional clustering methodssuch as EM and k-means, cluster-forming procedures are started at random data points. There aretwo disadvantages associated with this. First, correct clusters may not be able to form from randomstarting points. Second, because random staring points may not occur near cluster centers, massiveiterations may be needed to update random points to approach the cluster centers. However, becausethe PSA can identify the peak points near cluster centers, it is a better approach for forming clustersthan an algorithm starting from a random point. Therefore, clustering algorithms using the PSA canform clusters more accurately. Moreover, using peak points as the starting points to form clusters cansignificantly reduce clustering iterations because peak points are the desired points.
20
Books
MDPI

J. Sens. Actuator Netw. 2018, 7, 2
There are some disadvantages associated with the PSA. The PSA use BO and are, therefore,affected by the problems associated with BO. A particular issue is that a priori design is criticalto efficient BO. As mentioned in Section 3, BO uses GPs to build Gaussian models with Gaussiandistributions, making the resulting datasets transcendental. If a dataset does not have a Gaussiandistribution, the PSA may be less efficient. Another weak point of the PSA is that it is centralized. It isnot suited for highly distributed WSNs where data analyses are conducted at each sensor node.
7. Conclusions
In this paper, we proposed a new PSA for improving the performance of clustering algorithms(i.e., for improving accuracy and reducing clustering iterations). BO is used to search for the peaks of acollected dataset in the PSA. To investigate the efficiency of the PSA, we used the PSA to modify EMand k-means algorithms. The new algorithms were named PSEM and PSk-means, respectively.
Using simulations, we investigated the performance of PSEM and PSk-means relative to thatof OEM and k-means++. We conducted simulations using both synthetic datasets and a real dataset.For synthetic datasets, PSEM and PSk-means reduced iterations by approximately 6.3 and 1.99 times,respectively, at a maximum. Moreover, they improved clustering accuracy by 1.71 times and 1.69 times,respectively, at a maximum. On a real dataset for outliers’ detection purpose, PSEM reduced iterationsabout 1.88 times, and improved clustering accuracy by 1.29 times at a maximum. These results showthat our proposed algorithm significantly improves performance. We obtained the same conclusionsby illustrating the recall and precision improvements for PSEM and PSk-means.
In the future, we will improve this method so that it can be used with high-dimensional data, suchas images collected by a camera. Moreover, we would like to deploy the peak searching algorithm withsensor nodes, in order to allow CHs to obtain peak searching results from their neighbors; this willreduce the calculation time required for the peak search. Thus, clustering can be implemented in thesensor node and communication costs can be reduced.
Acknowledgments: This work was supported by the Japan Society for the Promotion of Science (JSPS KAKENHIGrant Numbers 16H02800, 17K00105, and 17H00762).
Author Contributions: Tianyu Zhang, Qian Zhao, and Kilho Shin conceived and designed the algorithm andexperiments. Tianyu Zhang performed the experiments, analyzed the data, and was the primary author of thispaper. Yukikazu Nakamoto gave advice on this work and helped revise the paper. Additionally, Qian Zhao andKilho Shin helped revise the paper.
Conflicts of Interest: The authors declare no conflict of interest.
References
1. Sung, W.T. Multi-sensors data fusion system for wireless sensors networks of factory monitoring via BPNtechnology. Expert Syst. Appl. 2010, 37, 2124–2131.
2. Hackmann, G.; Guo, W.; Yan, G.; Sun, Z.; Lu, C.; Dyke, S. Cyber-physical codesign of distributed structuralhealth monitoring with wireless sensor networks. IEEE Trans. Parallel Distrib. Syst. 2014, 25, 63–72.
3. Oliveira, L.M.; Rodrigues, J.J. Wireless Sensor Networks: A Survey on Environmental Monitoring.J. Clin. Microbiol. 2011, 6, 143–151.
4. Wu, C.I.; Kung, H.Y.; Chen, C.H.; Kuo, L.C. An intelligent slope disaster prediction and monitoring systembased on WSN and ANP. Expert Syst. Appl. 2014, 41, 4554–4562.
5. Dempster, A.P.; Laird, N.M.; Rubin, D.B. Maximum likelihood from incomplete data via the EM algorithm.J. R. Stat. Soc. Ser. B 1977, 39, 1–38.
6. Huang, Z. Extensions to the k-means algorithm for clustering large data sets with categorical values. Data Min.Knowl. Discov. 1998, 2, 283–304.
7. Rasmussen, C.E.; Williams, C.K. Gaussian Processes for Machine Learning; MIT Press: Cambridge, MA, USA,2006; Volume 1.
8. Papaioannou, I.; Papadimitriou, C.; Straub, D. Sequential importance sampling for structural reliabilityanalysis. Struct. Saf. 2016, 62, 66–75.
21
Books
MDPI

J. Sens. Actuator Netw. 2018, 7, 2
9. Behmanesh, I.; Moaveni, B.; Lombaert, G.; Papadimitriou, C. Hierarchical Bayesian model updating forstructural identification. Mech. Syst. Signal Proc. 2015, 64, 360–376.
10. Azam, S.E.; Bagherinia, M.; Mariani, S. Stochastic system identification via particle and sigma-point Kalmanfiltering. Sci. Iran. 2012, 19, 982–991.
11. Azam, S.E.; Mariani, S. Dual estimation of partially observed nonlinear structural systems: A particle filterapproach. Mech. Res. Commun. 2012, 46, 54–61.
12. Arthur, D.; Vassilvitskii, S. k-means++: The advantages of careful seeding. In Proceedings of the EighteenthAnnual ACM-SIAM Symposium on Discrete Algorithms, Society for Industrial and Applied Mathematics,Orleans, LA, USA, 7–9 January 2007; pp. 1027–1035.
13. Wu, W.; Cheng, X.; Ding, M.; Xing, K.; Liu, F.; Deng, P. Localized outlying and boundary data detection insensor networks. IEEE Trans. Knowl. Data Eng. 2007, 19, 1145–1157.
14. Breunig, M.M.; Kriegel, H.P.; Ng, R.T.; Sander, J. LOF: Identifying density-based local outliers. In Proceedingsof the 2000 ACM SIGMOD International Conference on Management of Data, Dallas, TX, USA,15–18 May 2000; Volume 29, pp. 93–104.
15. Sheela, B.V.; Dasarathy, B.V. OPAL: A new algorithm for optimal partitioning and learning in non parametricunsupervised environments. Int. J. Parallel Program. 1979, 8, 239–253.
16. Eskin, E. Anomaly detection over noisy data using learned probability distributions. In Proceedings of theInternational Conference on Machine Learning, Citeseer, Stanford, CA, USA, 29 June–2 July 2000.
17. Eskinand, E.; Stolfo, S. Modeling system call for intrusion detection using dynamic window sizes.In Proceedings of DARPA Information Survivability Conference and Exposition, Anaheim, CA, USA,12–14 June 2001.
18. Dereszynski, E.W.; Dietterich, T.G. Spatiotemporal models for data-anomaly detection in dynamicenvironmental monitoring campaigns. ACM Trans. Sens. Netw. (TOSN) 2011, 8, 3.
19. Bahrepour, M.; van der Zwaag, B.J.; Meratnia, N.; Havinga, P. Fire data analysis and feature reductionusing computational intelligence methods. In Advances in Intelligent Decision Technologies; Springer:Berlin/Heidelberg, Germany, 2010; pp. 289–298.
20. Phua, C.; Lee, V.; Smith, K.; Gayler, R. A comprehensive survey of data mining-based fraud detection research.arXiv 2010, arXiv:1009.6119. Available online: https://arxiv.org/ftp/arxiv/papers/1009/1009.6119.pdf(access on 29 July 2017).
21. Aqeel-ur-Rehman; Abbasi, A.Z.; Islam, N.; Shaikh, Z.A. A review of wireless sensors and networks’applications in agriculture. Comput. Stand. Interfaces 2014, 36, 263–270.
22. Misra, P.; Kanhere, S.; Ostry, D. Safety assurance and rescue communication systems in high-stressenvironments: A mining case study. IEEE Commun. Mag. 2010, 48, 11206229.
23. García-Hernández, C.F.; Ibarguengoytia-Gonzalez, P.H.; García-Hernández, J.; Pérez-Díaz, J.A. Wirelesssensor networks and applications: A survey. Int. J. Comput. Sci. Netw. Secur. 2007, 7, 264–273.
24. John, G.H. Robust Decision Trees: Removing Outliers from Databases. In Proceedings of the FirstInternational Conference on Knowledge Discovery and Data Mining (KDD’95), Montreal, QC, Canada,20–21 August 1995; pp. 174–179.
25. Han, J.; Pei, J.; Kamber, M. Data Mining: Concepts and Techniques; Elsevier: Amsterdam, The Netherlands, 2011.26. Ash, J.N.; Moses, R.L. Outlier compensation in sensor network self-localization via the EM algorithm.
In Proceedings of the IEEE International Conference on Acoustics, Speech, and Signal Processing,Philadelphia, PA, USA, 23–23 March 2005; Volume 4, pp. iv–749.
27. Yin, F.; Zoubir, A.M.; Fritsche, C.; Gustafsson, F. Robust cooperative sensor network localization via the EMcriterion in LOS/NLOS environments. In Proceedings of the 2013 IEEE 14th Workshop on Signal ProcessingAdvances in Wireless Communications (SPAWC), Darmstadt, Germany, 16–19 June 2013; pp. 505–509.
28. Münz, G.; Li, S.; Carle, G. Traffic anomaly detection using k-means clustering. In Proceedings of the GI/ITGWorkshop MMBnet, Hamburg, Germany, September 2007.
29. Devi, T.; Saravanan, N. Development of a data clustering algorithm for predicting heart. Int. J. Comput. Appl.2012, 48, doi:10.5120/7358-0095.
30. Brochu, E.; Cora, V.M.; De Freitas, N. A tutorial on Bayesian optimization of expensive cost functions,with application to active user modeling and hierarchical reinforcement learning. arXiv 2010, arXiv:1012.2599.Available online: https://arxiv.org/pdf/1012.2599.pdf (access on 30 June 2017).
31. Bishop, C.M. Pattern Recognition and Machine Learning; Springer: Berlin/Heidelberg, Germany, 2006.
22
Books
MDPI

J. Sens. Actuator Netw. 2018, 7, 2
32. Intel Lab Data. Available online: http://db.csail.mit.edu/labdata/labdata.html (accessed on30 August 2017).
33. Mostafaei, H.; Montieri, A.; Persico, V.; Pescapé, A. A sleep scheduling approach based on learning automatafor WSN partial coverage. J. Netw. Comput. Appl. 2017, 80, 67–78.
34. Zhao, Q.; Nakamoto, Y.; Yamada, S.; Yamamura, K.; Iwata, M.; Kai, M. Sensor Scheduling Algorithmsfor Extending Battery Life in a Sensor Node. IEICE Trans. Fundam. Electron. Commun. Comput. Sci. 2013,E96-A, 1236–1244.
35. Zhao, Q.; Nakamoto, Y. Algorithms for Reducing Communication Energy and Avoiding Energy Holes toExtend Lifetime of WSNs. IEICE Trans. Inf. Syst. 2014, E97-D, 2995–3006.
36. Zhao, Q.; Nakamoto, Y. Topology Management for Reducing Energy Consumption and Tolerating Failuresin Wireless Sensor Networks. Int. J. Netw. Comput. 2016, 6, 107–123.
c© 2018 by the authors. Licensee MDPI, Basel, Switzerland. This article is an open accessarticle distributed under the terms and conditions of the Creative Commons Attribution(CC BY) license (http://creativecommons.org/licenses/by/4.0/).
23
Books
MDPI

Journal of
Actuator NetworksSensor and
Article
Development of Intelligent Core Network for TactileInternet and Future Smart Systems
Abdelhamied A. Ateya 1,2, Ammar Muthanna 1,* , Irina Gudkova 3, Abdelrahman Abuarqoub 4 ,
Anastasia Vybornova 1 and Andrey Koucheryavy 1
1 Telecommunication Networks and Data Transmission, The Bonch-Bruevich State University ofTelecommunication, 193232 Sankt-Peterburg, Russia; [email protected] (A.A.A.);[email protected] (A.V.); [email protected] (A.K.)
2 Electronics and Communications Engineering, Zagazig University, Ash Sharqia Governorate 44519, Egypt3 Applied Probability and Informatics, Peoples’ Friendship University of Russia (RUDN University),
117198 Moskva, Russia; [email protected] Faculty of Information Technology, Middle East University Amman, 383 Amman 11831, Jordan;
[email protected]* Correspondence: [email protected]; Tel.: +7-952-210-4486
Received: 31 October 2017; Accepted: 11 December 2017; Published: 2 January 2018
Abstract: One of the main design aspects of the Tactile Internet system is the 1 ms end-to-end latency,which is considered as being the main challenge with the system realization. Forced by recentdevelopment and capabilities of the fifth generation (5G) cellular system, the Tactile Internet willbecome a real. One way to overcome the 1 ms latency is to employ a centralized controller in the coreof the network with a global knowledge of the system, together with the concept of network functionvirtualization (NFV). This is the idea behind the software defined networking (SDN). This paperintroduces a Tactile Internet system structure, which employs SDN in the core of the cellular networkand mobile edge computing (MEC) in multi-levels. The work is mainly concerned with the structureof the core network. The system is simulated over a reliable environment and introduces a roundtrip latency of orders of 1 ms. This can be interpreted by the reduction of intermediate nodes that areinvolved in the communication process.
Keywords: Tactile Internet; 5G; latency; NFV; SDN; MEC
1. Introduction
Tactile Internet is expected to be a novel approach in the human-to-machine (H2M)communication by moving from the content delivery to the skill-set delivery. The main applicationthat is supported by the Tactile Internet system will be the haptic communication in real time [1]. It willbe a revolution in the area of information and communication technology with enormous applicationsin many fields [2]. Powered by the 5G cellular network, Tactile Internet will provide a way for humanto transfer their tough and actuation in real time form.
Tactile Internet is one of the main use cases of the near future 5G cellular system, as announced byInternational Telecommunication Union (ITU) [3]. Through the Tactile Internet, physical habits will becommunicated remotely. The construction of the Tactile Internet system can be viewed as three mainparts as presented in Figure 1 [4]. The network part connects the master and the slave parts through ahuge infrastructure of fiber cables and network elements. Here, we consider this part to enable livetime communication between transmitter and receiver by means of employing modern technologiesthroughout the cellular network.
J. Sens. Actuator Netw. 2018, 7, 1 24 www.mdpi.com/journal/jsan
Books
MDPI

J. Sens. Actuator Netw. 2018, 7, 1
Figure 1. General view of Tactile Internet System.
Designing Tactile Internet system and realizing it meets some challenges that are presentedin [5]. The main challenge is the 1 ms end-to-end latency. The end-to-end latency differ from theuser plane latency and can be defined as the time duration starts from the transmission of a smalldata packet from the transmitter’s application layer and ends by the reception of the data by thereceiver’s application layer, including the response feedback that is dedicated by the communicationprocess [6]. Thus, the end-to-end latency depends on the number of network nodes that are involvedin the communication process. In order to reduce the round trip latency and achieve the 1 mslatency requirement for the Tactile Internet system, the number of network nodes involved inthe communication process should be reduced and bring them as near as possible to the userequipment. This is can be achieved by employing software defined networking (SDN), networkfunction virtualization (NFV), and mobile edge computing (MEC) with the 5G cellular system.
SDN, NFV, and MEC technologies provide powerful solutions for the challenges that areassociated with the design of 5G cellular system and Tactile Internet system, specially the 1 mslatency. Thus, the academia and the industry pay a great attention to the research and developmentin these areas. In today’s cellular networks, the network services are handled by means of variousnetwork functions that are connected in static manner [7]. Thus, it is not easy to add new services,this is because the cost, energy and integration difficulties of hardware required. To overcome theseproblems NFV and SDN are developed.
NFV provides fixed network functions by means of software run on a virtualized environment,which increases the flexibility of the overall system. NFV employs virtualization technologies onprogrammable hardware, such as storage devices, general purpose servers, and switches to separate thesoftware implementation of network functions from the dedicated hardware. In another word, NFV setup the network functions by means of software virtualization techniques on commodity hardware [8].Several projects are launched, for developing open source, commercial solutions, and standardizationsfor NFV. The most important projects are the Service Programming and Orchestration for VirtualizedSoftware Networks (SONATA) project and Management and Orchestration (MANO) project. SONATAis constructed with a vision of increasing the programmability and flexibility of 5G cellular system.It aims to make the service platforms easier and modular to be suitable for the requirements of the
25
Books
MDPI

J. Sens. Actuator Netw. 2018, 7, 1
different service providers. Also, it stands with the network function orchestration and provides adevelopment model for the developers [9]. MANO is an open source project that was developed byEuropean Telecommunications Standards Institute (ETSI) [10].
SDN is a new approach that provides a dynamic and cost effective network structure by thephysical separation of data forwarding plane and control plane. The control plane is the networkpart that gives the appropriate decision to handle traffic [11–13]. The data plane is the other partof the network, which forward traffic in respond to the control plane. The control signal movesfrom the control plane to the data plane by means of an open standard interface protocol, such asOpenFlow protocol and ForCES protocol [14]. SDN allows for the network operator to configure,control, and manage the network through customized software known as application programminginterfaces (APIs). SDN is mainly presented to simplify the network hardware and increase the networkflexibility [15].
Dawn of the software networks is supported by the recent development in NFV and SDNtechnologies. NFV and SDN technologies are not reliant on each other, but they complete eachother [16]. Both technologies arise the advantage of employing inexpensive programmable hardware.The early generations of SDN technology were corresponded with data centers, campus networks,and private networks. By the time that SDN find its way to the core of cellular networks. On theother hand, NFV aims to replace the Middleboxes that are used in cellular networks from hardwareappliance to software running on commodity hardware (i.e., less expensive general server hardware).
Employing SDN and NFV provides a way for performing the recent important concept of networkslicing. The network slice may be viewed as a group of network functions worked together with aspecific radio access technology (RAT) to achieve a certain use case of the network [17]. In anotherword, a network slice is a way of supporting communication service by means of a special connection.Network slicing allows network operator to set up multiple logical networks (each for a certainuse case) on the same physical infrastructure [18].
One way to improve the cellular network efficiency is to offload network operations to cloudunits that are employed at the edge of the cellular system. This is the idea behind the recent paradigmlaunched by the cellular network operators and known as MEC. MEC is the way of carrying cloudcomputing capabilities to the edge of the cellular network one hop away from the user equipment.European Telecommunications Standards Institute (ETSI) is one of the leading organizations in theresearch of MEC and the standardization of this technology. The latest progress in MEC platforms andtheir cellular uses are summed in [19]. The main benefit of employing MEC in cellular networks is thereduction of end to end system latency. Moreover, it provides a higher system bandwidth and reducesthe network congestion by providing away for offloading data.
In this paper, we introduce a network structure for the Tactile Internet system employs SDN atthe core of the network and enable NFV. The system uses MEC in multilevel hierarchical. In (Section 2,the related works to the proposed system is discussed. In Section 3, the system structure is proposed.In Section 4, the system is simulated over a reliable environment. Finally, Section 5 gives the conclusion.
2. Related Works
Moving from traditional Evolved Packet Core networks to next generation of cellular systemsrequires the involvement of a smart controller at the core of the network. The controller manages all ofthe operations inside the network. In this part, we present the main works that are concerned withthe development of a centralized controller for delay sensitive networks. We analyze each work andprovide similarities and differences between each work and our system.
In [20], the authors present a SoftCell cellular system that enables the system operator to achieveservice policies at high levels. The proposed system reduces the forwarding table’s size and aggregatestraffic in multiple dimensions at various switches in the network. The system employs an accessswitches at the base stations, which are software switches. Access switches can classify packets thathave arrived at the base station and handle the required state and bandwidth. SoftCell employs the
26
Books
MDPI

J. Sens. Actuator Netw. 2018, 7, 1
components of the traditional Evolved Packet Core cellular network with a controller at the corenetwork with certain functions. The controller installs the switch rules and implements the signalingrules that are used between hosts. The system is suggested for deployment to the core of LTE existingnetworks. The system improves the flexibility and scalability of the LTE cellular system. The mainproblem with the system is the capability of the core network controller and it still mainly depends onthe gateways (SGW, PGW) at the core network.
Recently, there are a number several approaches speak about employing SDN at the core networkof cellular system. These are the most relates works. In [21], the problems and transport challengesto realize the 5G system. The authors suggested a structure for the core network based on SDN andemploy the edge computing. In [22], a network coding is developed and employed with SDN to reduceLatency in 5G cellular system. The network coding is achieved through a software router that acts as avirtual network function. The main problem with the system is that they did not consider the MEC;however, they mainly concerned with the coding and SDN. The system is mainly introduced for 5Gand the Internet of Things [23–25].
In [26], an optimized framework for a virtual network is introduced to reduce end-to-end delayin LTE-A cellular networks. A central controller is employed in the core network and used mainly forslicing the physical resources. The authors employ Virtual Network Embedding (VNE) algorithm tomap the virtualized networks on substrate network. The system model consists of destination edgerouters and only single gateway. The edge router is responsible for the mobility management based ona distributed mobility management (DMM) scheme that is applied to the system. The system mainlyconcerned with the path optimization and network virtualization. The system achieves better latencyperformance and increases the user mobility. MEC is not involved in the structure and the system maybe seen as a modification for the LTE-A cellular system.
In [27], a 5G based SDN architecture is introduced, with the dense deployment of small cells.Employing small cell concept raises the challenge of frequent handover and the latency dedicated withthe handover process. Authors provide a system structure to overcome these challenges by using SDNcontroller at the core network. Another main function of the controller is the allocation of radio accessresources and overcoming challenges that are associated with the deployment of multiple radio accesstechnologies. The system is mainly concerned with the problem of latency of the handover process.SDN controller defines three types of programmed interfaces that make the system able to predict theuser is movement, and thus handle the handover process in less time.
Each work of the previous works employs a controller at the core network for certain functions.All of these functions provide system with a high efficiency in terms of bit rate and latency. Since themain requirement of the Tactile Internet system is the ultra-low latency, intelligent controller should bedeployed at the core of the network to achieve the desired latency.
3. System Structure
Tactile Internet system requires a very high availability and reliability, and ultra-low latency.This put high constraints on system components in terms of context, content, and mobility. TactileInternet system requires an end-to-end latency of millisecond. This contains both the transmissiondelay (including reaction transmission (feedback)) and the processing delay. The time betweenstimulation and response should be in one millisecond. In another word, the end-to-end latencyshould be less than the human reaction time [28]. In this work, we provide a frame work for the TactileInternet system, which can solve the problem of millisecond latency and achieves other requirementsfrom the Tactile Internet system.
Our Tactile Internet system may be generally viewed as a three layer system that is based onthe proposed 5G system structure, as suggested by Next Generation Mobile Networks (NGMN) [6].As illustrated in Figure 2, the three layer system is based on the three main technologies; MEC, SDN,and NFV. The whole structure is based on the 5G cellular system, which decouples the hardware andsoftware, and provides an APIs to facilitate the control and management of the system.
27
Books
MDPI

J. Sens. Actuator Netw. 2018, 7, 1
Figure 2. System structure viewed as a three layer system.
The first layer is the physical hardware resource layer, which includes the cellular networkinfrastructure (5G/Tactile user devices, fiber cables, cloud units, and networking nodes).
User devices may be a master robot or a 5G smart phone that have enough capabilities to beconfigured in the network [29]. The master robot is a haptic device that represents the human interfacesystem. Haptic device has the ability to translate the human input to a haptic input by means of codingtechniques [30]. Using haptic devices users can feel and touch objects in remote environments and alsocan control them.
Cloud units are employed at the edge of the network based on the concept of MEC. We built amulti-level cloud based Tactile Internet system in [5,31], which can be used as the cloud part in thislayer. The multi-level cloud system moves from the idea of centralized cloud to the heterogeneousdistributed cloud units. Cloud units are employed in levels, the first level includes Micro-clouds withsmall storage and processing capabilities connected to each cellular base station (eNB) [5]. The secondlevel employs more efficient cloud units with higher processing and storage capabilities, known asMini-clouds. Each Mini-cloud unit connects and controls a group of Micro-cloud units through avery high speed fiber connections. The final level of cloud units is the main cloud unit with powerfulstorage and processing capabilities centered at the core network. Main cloud unit connects, controls,and monitors all Mini-cloud units connected to the core network. Also it acts as the gateway to thehuge central cloud units that are employed faraway. Figure 3 illustrates the different levels of cloudunits [5].
28
Books
MDPI
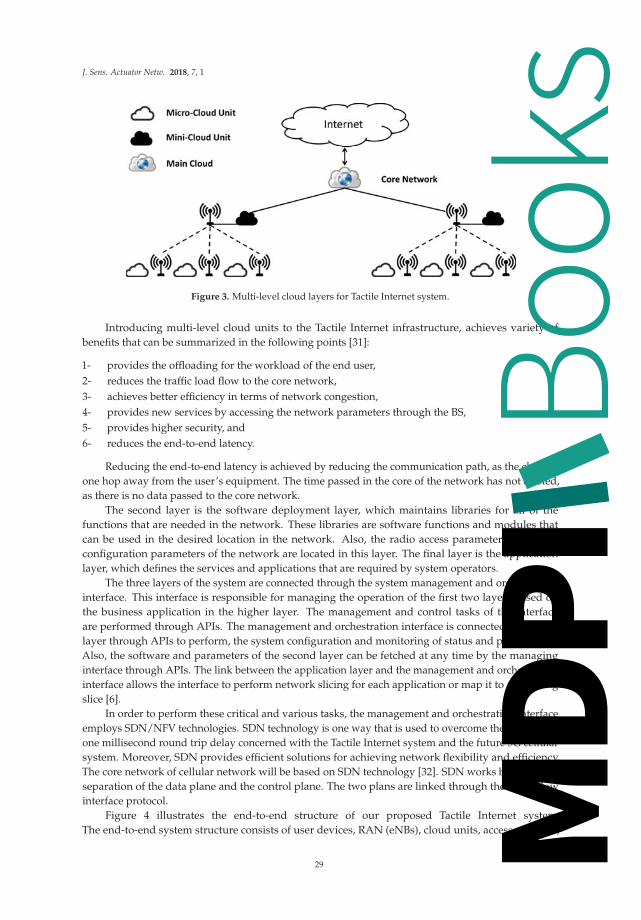
J. Sens. Actuator Netw. 2018, 7, 1
Figure 3. Multi-level cloud layers for Tactile Internet system.
Introducing multi-level cloud units to the Tactile Internet infrastructure, achieves variety ofbenefits that can be summarized in the following points [31]:
1- provides the offloading for the workload of the end user,2- reduces the traffic load flow to the core network,3- achieves better efficiency in terms of network congestion,4- provides new services by accessing the network parameters through the BS,5- provides higher security, and6- reduces the end-to-end latency.
Reducing the end-to-end latency is achieved by reducing the communication path, as the cloud isone hop away from the user’s equipment. The time passed in the core of the network has not existed,as there is no data passed to the core network.
The second layer is the software deployment layer, which maintains libraries for all of thefunctions that are needed in the network. These libraries are software functions and modules thatcan be used in the desired location in the network. Also, the radio access parameters and otherconfiguration parameters of the network are located in this layer. The final layer is the applicationlayer, which defines the services and applications that are required by system operators.
The three layers of the system are connected through the system management and orchestrationinterface. This interface is responsible for managing the operation of the first two layers based onthe business application in the higher layer. The management and control tasks of the interfaceare performed through APIs. The management and orchestration interface is connected to the firstlayer through APIs to perform, the system configuration and monitoring of status and performance.Also, the software and parameters of the second layer can be fetched at any time by the managinginterface through APIs. The link between the application layer and the management and orchestrationinterface allows the interface to perform network slicing for each application or map it to an existingslice [6].
In order to perform these critical and various tasks, the management and orchestration interfaceemploys SDN/NFV technologies. SDN technology is one way that is used to overcome the problem ofone millisecond round trip delay concerned with the Tactile Internet system and the future 5G cellularsystem. Moreover, SDN provides efficient solutions for achieving network flexibility and efficiency.The core network of cellular network will be based on SDN technology [32]. SDN works based on theseparation of the data plane and the control plane. The two plans are linked through the OpenFlowinterface protocol.
Figure 4 illustrates the end-to-end structure of our proposed Tactile Internet system.The end-to-end system structure consists of user devices, RAN (eNBs), cloud units, access switches,
29
Books
MDPI

J. Sens. Actuator Netw. 2018, 7, 1
OpenFlow switches, Middleboxes, and, finally, SDN controller. Each base station (eNB) is connected tothe network through an access switch, which powerfully performs packet classification on traffic fromuser devices. The access switches is software switches such as Open vSwitch [33].
Figure 4. End-to-end system structure.
The whole network is connected through OpenFlow switches that manage data packets andforward traffic based on their flow tables. Middleboxes are commodity hardware that represents a wayfor the network operators to add extra functionalities, such as firewall and network address translation.The major requirements of the functions and services that are introduced by these Middleboxes are theefficient use of resources and the system protection from attacks. All of these elements represent thedata plane of the network.
The last part of the system is the central controller (SDNC), which represents the control plane ofthe network. By means of programming and control logic, SDNC can execute functions and operationsin the control plane. SDNC maintains the global information of the edge and core network devicesinclude; OpenFlow switches, access switches, Middleboxes, RAN, and cloud units. SDNC managesand controls the edge and core network devices mentioned through the OpenFlow protocol. Table 1contains some of the existing controllers that can be used as an SDNC with the OpenFlow protocol.
Functionally, switches that are used in the tactile system can be viewed as a packet forwardingdevices with single or multiple flow tables [34]. Two types of switches are deployed in the OpenFlowbased network, pure switches, and hybrid switches. Pure switches support only OpenFlow and fullydepended on the SDNC. In the other side, hybrid switches, which are more commercial, have theability to support OpenFlow with the traditional operations and protocols.
OpenFlow protocol is the signaling standard used for the communication between SDNC andOpenFlow switches. In other words, the instructions from SDNC to other network devices aretransferred through the OpenFlow protocol [35]. Each OpenFlow node communicates with the SDNCvia a secured OpenFlow channel. OpenFlow switches build their forwarding tables and build thepacket processing rules based on the instructions delivered from the SDNC via the OpenFlow protocol.These instructions are deduced from the flow table received from the SDNC. The flow table can beviewed as a set of flow entries. Each of these entries holds a set of instructions to the node [36].
There are only three types of exchanged messages between SDNC and OpenFlow switches thatare legalized by the OpenFlow protocol. The first kind is the controller-to-switch messages. This type
30
Books
MDPI
J. Sens. Actuator Netw. 2018, 7, 1
refers to all messages initiated and moved from the controller to any switch, for the issues that arerelated to Handshaking, configuring the switch, checking status of the switch, and even modifyingthe switch. A summary of all available controller-to-switch messages supported by OpenFlow 1.4 arecollected in Table 2, with the fields and entities of each one [37].
The second type represents all messages transferred from the switch to the SDNC; these messagesare referred to as asynchronous messages. Table 3 summarizes all of the asynchronous messages usedbe OpenFlow 1.4; also, the function and structure of these messages are pointed [37]. The third type isthe message exchanged in both directions between SDNC and a switch. These messages are referred toas symmetric messages and have various forms and functions. One of the main symmetric messages isthe echo request/response messages that are used by the switch or the SDNC to check latency andmeasure bandwidth. Another important symmetric message is the error messages that are used toreport a connection problem. Error messages are mainly used by the switch to report a request failure.
SDNC improve system performance in many terms, such as system latency and user’s mobility.One important aspect to reduce the round trip latency is to reduce the number of intermediate nodesthat are involved in the communication process and this is introduced by employing SDNC. Moreover,SDNC can foresee the user’s mobility as it has access to all features of the user device (including;device type, location, billing information, etc.), which improves the critical radio access processes,such as handover. In other words, employing SDNC reduces the round trip latency, achieves handoverprocess easily, and also reduces the handover latency.
On way to illustrate the benefits of our system is to compare it with the latest traditional EvolvedPacket Core cellular network [38]. In the traditional Evolved Packet Core networks, all data trafficflow through the Evolved Packet Core network including the Packet data Gateway (PGW) and theServing Gateway (SGW). This represents a load on these gateways and leads to an increase in roundtrip latency. Unlike the traditional systems, our proposed system employs SDN, which removes thisbarrier and reduces the round trip latency by reducing the number of intermediate nodes that areinvolved in the communication process.
Figure 5 illustrates this comparison between two systems. While, in Figure 5b, the two eNBsbelong to the same Mini-cloud unit, but in Figure 5c, the two eNBs belong to different Mini-cloudunits. Another important aspect is that the SDN structure allows and facilitates adding or changingnetwork functions, which is not offered by the traditional systems. Moreover, network slicing can bedone through the SDNC which will be the main feature of the Tactile Internet and 5G systems.
Summing up, the advantage of the proposed structure can be summarized in the following points:
1- the system is more flexible, as routing can be established easily through SDNC,2- the system is reliable as it relay on the open flow protocol and other standardized technologies,3- the network function virtualization can be easily implemented powered by the use of SDNC,4- the requirements for achieving a certain quality of service (QoS) of the system can be supported
by SDN. As the system can define and implement new rules through SDN switches andMiddleboxes and
5- the system provides higher scalability than traditional packet core networks. This is because theSDNC takes into account the control process only and not involved in data flow.
31
Books
MDPI

J. Sens. Actuator Netw. 2018, 7, 1
Ta
ble
1.
Feat
ures
ofav
aila
ble
open
sour
ceso
ftw
are
defin
edne
twor
king
(SD
N)c
ontr
olle
rs.
Co
ntr
oll
er
Imp
lem
en
tati
on
Lan
gu
ag
eD
ev
elo
per
Year
of
Rele
ase
Rev
iew
NO
X[3
9]C
++/P
ytho
nN
icir
a20
08-
The
first
SDN
cont
rolle
r.-
cons
ider
edas
netw
ork
oper
atin
gsy
stem
than
bein
ga
cont
rolle
r.
Mae
stro
[40]
Java
Ric
eU
nive
rsit
y20
11
-A
llow
sap
plic
atio
nsto
acce
ssan
dm
odif
yth
ene
twor
kst
ate.
-co
nsid
ered
asne
twor
kop
erat
ing
syst
emth
anbe
ing
aco
ntro
ller.
-M
ulti
-thr
ead
plat
form
.-
Port
able
and
scal
able
.
POX
[41]
Pyth
onN
icir
a20
13-
beco
me
mor
eco
mm
onth
anth
eol
dN
OX
.-
Mod
ern
cont
rolle
rth
aten
able
sra
bid
deve
lopm
enta
ndpr
otot
ypin
g.
Beac
on[4
2]Ja
vaSt
anfo
rdU
nive
rsit
y20
13-
Dyn
amic
and
cros
s-pl
atfo
rm.
-us
edto
incr
ease
prod
ucti
vity
ofde
velo
pers
.-
enab
les
the
star
tand
stop
ofap
plic
atio
nsan
din
trod
ucin
gne
wer
ones
.
Floo
dlig
ht[4
3]Ja
vaBi
gSw
itch
Net
wor
ks20
13
-O
neof
the
lead
ing
SDN
cont
rolle
rs.
-H
ybri
dco
ntro
ller
that
can
supp
ortb
oth
Ope
nFlo
wan
dno
nO
penF
low
netw
orks
.-
Hig
hpe
rfor
man
cem
ulti
-thr
ead
cont
rolle
r.
Ope
nDay
light
[44]
Java
Ope
nDay
light
Foun
dati
on20
13-
effic
ient
for
any
size
netw
orks
.-
prov
ides
vari
ous
com
mer
cial
use
case
s.-
Mai
nco
ncer
nis
the
netw
ork
prog
ram
mab
ility
.
IRIS
[45]
Java
ETR
I20
14-
Built
onBe
acon
.-
Sim
pler
arch
itec
ture
.-
reco
nfigu
reso
me
feat
ures
inFl
oodl
ight
.
ON
OS
[46]
Java
Ope
nN
etw
ork
Ope
rati
ngSy
stem
proj
ect
2014
-O
NO
Sst
ands
for
Ope
nN
etw
ork
Ope
rati
ngSy
stem
.-
Mai
nco
ncer
nis
the
scal
abili
tyan
dth
eav
aila
bilit
y.-
has
vari
ous
com
mer
cial
appl
icat
ions
.
DEF
O[4
7]Ja
vaD
EFO
proj
ect
2015
-St
ands
for
Dec
lara
tive
and
Expr
essi
veFo
rwar
ding
Opt
imiz
er.
-In
crea
seth
eco
nnec
tivi
ty.
-Pr
ovid
essc
alab
ility
and
high
resp
onse
.
32
Books
MDPI

J. Sens. Actuator Netw. 2018, 7, 1
Ta
ble
2.
Con
trol
ler-
to-S
wit
chm
essa
ges
supp
orte
dby
Ope
nFlo
w.
Mess
ag
eT
yp
eM
ess
ag
eS
tru
ctu
reM
ess
ag
eP
urp
ose
Rep
ly
Han
dsha
ke-
ofp_
head
er-
(no
body
)O
FPT_
FEA
TUR
ES_R
EQU
EST
Use
dby
the
cont
rolle
rto
iden
tify
the
swit
chan
dit
sfe
atur
es.
OFP
T_F
EAT
UR
ES_R
EPLY
:
-of
p_he
ader
-pa
d-
n_bu
ffer
s-
n_ta
bles
-dat
apat
h_id
-au
xilia
ry_i
d
Swit
chco
nfigu
rati
on-
ofp_
head
er-
(no
body
)O
FPT_
GET
_CO
NFI
G_R
EQU
EST
Use
dby
the
cont
rolle
rto
sett
heco
nfigu
rati
onpa
ram
eter
ofth
esw
itch
.
OFP
T_G
ET_C
ON
FIG
_REP
LY:
-of
p_he
ader
-fla
gs-
mis
s_se
nd_l
en
Mod
ify
stat
em
essa
ges
-of
p_he
ader
-ta
ble_
id-
pad
-co
nfig
OFP
_TA
BLE_
MO
DU
sed
byth
eco
ntro
ller
tope
rfor
mth
edy
nam
icst
ate
confi
gura
tion
ofa
swit
ch.
No
mai
nre
spon
sem
essa
ge.
-of
p_he
ader
-co
okie
-co
okie
_mas
k-
tabl
e_id
-co
mm
and
-id
le_t
imeo
ut-
hard
_tim
eout
-pr
iori
ty-
buff
er_i
d-
out_
port
-ou
t_gr
oup
-fla
gs-
impo
rtan
ce-
ofp_
mat
ch
OFP
T_FL
OW
_MO
DU
sed
byth
eco
ntro
ller
tom
odif
ya
flow
tabl
e.
-of
p_he
ader
-co
mm
and
-ty
pe-
pad
-gr
oup_
id-
ofp_
buck
et
OFP
T_G
RO
UP_
MO
DU
sed
byth
eco
ntro
ller
tom
odif
ya
grou
pta
ble.
33
Books
MDPI

J. Sens. Actuator Netw. 2018, 7, 1
Ta
ble
2.
Con
t.
Mess
ag
eT
yp
eM
ess
ag
eS
tru
ctu
reM
ess
ag
eP
urp
ose
Rep
ly
-of
p_he
ader
-po
rt_n
o-
pad
-hw
_add
r-
pad2
-co
nfig
-m
ask
OFP
T_PO
RT_
MO
DU
sed
byth
eco
ntro
ller
tom
odif
yth
epr
oper
ties
ofa
port
.
-of
p_he
ader
-co
mm
and
-fla
gs-
met
er_i
d
OFP
T_M
ETER
_MO
DU
sed
byth
eco
ntro
ller
tom
odif
ya
met
eran
da
virt
ualm
eter
.
Mul
tipa
rtm
essa
ges
-of
p_he
ader
-ty
pe-
flags
-pa
d-
body
OFP
T_M
ULT
IPA
RT_
REQ
UES
TU
sed
byth
eco
ntro
ller
toen
code
larg
ere
ques
tsan
dre
plie
sm
essa
ges
that
can’
tbe
sent
inon
em
essa
ge.
OFP
T_M
ULT
IPA
RT
_REP
LY:
-of
p_he
ader
-ty
pe-
flags
-pa
d-
body
-of
p_he
ader
-(n
obo
dy)
OFP
MP_
DES
C(R
eque
st)
Use
dby
the
cont
rolle
rto
requ
esti
nfor
mat
ion
abou
tthe
swit
ch(i
.e.,
swit
chm
anuf
actu
rer,
info
rmat
ion
abou
tthe
used
soft
war
ean
dse
rial
num
ber)
.
OFP
MP_
DES
C(R
eply
):
-m
fr_d
esc
-hw
_des
c-
sw_d
esc
-se
rial
_num
-dp
_des
c
-ta
ble_
id-
pad
-ou
t_po
rt-
out_
grou
p-
pad2
-co
okie
-co
okie
_mas
k-
ofp_
mat
ch
OFP
MP_
FLO
W(R
eque
st)
Use
dby
the
cont
rolle
rto
requ
esti
nfor
mat
ion
abou
tflow
entr
ies.
OFP
MP_
FLO
W(R
eply
):
-le
ngth
-ta
ble_
id-
pad2
-du
rati
on_s
ec-
dura
tion
_nse
c-
pad
-pr
iori
ty-
ofp_
mat
ch-
idle
_tim
eout
-ha
rd_t
imeo
ut-
flags
-im
port
ance
-co
okie
-pa
cket
_cou
nt-
byte
_cou
nt
34
Books
MDPI

J. Sens. Actuator Netw. 2018, 7, 1
Ta
ble
2.
Con
t.
Mess
ag
eT
yp
eM
ess
ag
eS
tru
ctu
reM
ess
ag
eP
urp
ose
Rep
ly
-ta
ble_
id-
pad
-ou
t_po
rt-
out_
grou
p-
pad2
-co
okie
-co
okie
_mas
k-
ofp_
mat
ch
OFP
MP_
AG
GR
EGA
TE(R
eque
st)
Use
dby
the
cont
rolle
rfo
rth
ein
form
atio
nag
greg
atio
nof
mul
tipl
eflo
wen
trie
s.
OFP
MP_
AG
GR
EGA
TE
(Rep
ly):
-pa
cket
_cou
nt-
byte
_cou
nt-
flow
_cou
nt-
pad
-of
p_he
ader
-(n
obo
dy)
OFP
MP_
TABL
E(R
eque
st)
Use
dby
the
cont
rolle
rto
getm
ain
info
rmat
ion
abou
tthe
tabl
es.
OFP
MP_
TABL
E(R
eply
):
-ta
ble_
id-
pad
-ac
tive
_cou
nt-
look
up_c
ount
-m
atch
ed_c
ount
-of
p_he
ader
-(n
obo
dy)
OFP
MP_
TABL
E_D
ESC
(Req
uest
)U
sed
byth
eco
ntro
ller
toge
tthe
curr
entt
able
sco
nfigu
rati
onof
asw
itch
.
OFP
MP_
TABL
E_D
ESC
(Rep
ly):
-le
ngth
-ta
ble_
id-
pad
-co
nfig
-pr
oper
ties
-po
rt_n
o-
queu
e_id
FPM
P_Q
UEU
E_ST
ATS
(Req
uest
)U
sed
byth
eco
ntro
ller
toge
tthe
queu
ein
form
atio
nof
one
orm
ore
port
.
FPM
P_Q
UEU
E_ST
AT
S(R
eply
):
-le
ngth
-qu
eue_
id-
pad
-du
rati
on_s
ec-
tx_p
acke
ts-t
x_by
tes
-tx
_err
ors
-po
rt_n
o-
dura
tion
_nse
c
-gr
oup_
id-
pad
OFP
MP_
GR
OU
P(R
eque
st)
Use
dby
the
cont
rolle
rto
geti
nfor
mat
ion
abou
ton
eor
mor
egr
oups
.
OFP
MP_
GR
OU
P(R
eply
):
-le
ngth
-gr
oup_
id-
pad
-pa
cket
_cou
nt-
ref_
coun
t-
pad2
-by
te_c
ount
-du
rati
on_s
ec-
dura
tion
_nse
c
35
Books
MDPI

J. Sens. Actuator Netw. 2018, 7, 1
Ta
ble
2.
Con
t.
Mess
ag
eT
yp
eM
ess
ag
eS
tru
ctu
reM
ess
ag
eP
urp
ose
Rep
ly
-of
p_he
ader
-(n
obo
dy)
OFP
MP_
POR
T_D
ESC
RIP
TIO
N(R
eque
st)
Use
dby
the
cont
rolle
rto
getk
now
ledg
eof
all
port
ssu
ppor
tOpe
nFlo
w.
OFP
MP_
POR
T_D
ESC
RIP
TIO
N(R
eply
):
-po
rt_n
o-
leng
th-
pad-
hw_a
ddr
-pa
d2-
nam
e-
confi
g-
stat
e
-m
eter
_id
-pa
dO
FPM
T_M
ETER
(Req
uest
)U
sed
byth
eco
ntro
ller
tore
ques
tmet
erst
atis
tics
.
OFP
MT
_MET
ER(R
eply
):
-m
eter
_id
-pa
d-
byte
_in_
coun
t-
leng
th-
flow
_cou
nt-
dura
tion
_nse
c-
pack
et_i
n_co
unt
-du
rati
on_s
ec
Pack
et-o
utm
essa
ge
-of
p_he
ader
-bu
ffer
_id
-in
_por
t-pa
d-
acti
ons_
len
-of
p_ac
tion
_hea
der
-da
ta
OFP
T_PA
CK
ET_O
UT
Use
dby
the
cont
rolle
rw
hen
inte
nded
tose
nda
pack
etou
t.N
om
ain
answ
er.
Barr
ier
mes
sage
-of
p_he
ader
-(n
obo
dy)
OFP
T_BA
RR
IER
_REQ
UES
TU
sed
byth
eco
ntro
ller
toas
kfo
rth
eco
mpl
eted
oper
atio
ns.
OFP
T_B
AR
RIE
R_R
EPLY
Rol
ere
ques
tmes
sage
-of
p_he
ader
-ro
le-
pad
-ge
nera
tion
_id
OFP
T_R
OLE
_REQ
UES
TU
sed
byth
eco
ntro
ller
toch
ange
its
role
.
OFP
T_R
OLE
_REP
LY(i
fno
erro
rsoc
cur)
-of
p_he
ader
-ro
le-
pad
-ge
nera
tion
_id
36
Books
MDPI

J. Sens. Actuator Netw. 2018, 7, 1
Ta
ble
3.
Asy
nchr
onou
sM
essa
ges
supp
orte
dby
Ope
nFlo
w.
Mess
ag
ety
pe
Mess
ag
eS
tru
ctu
reM
ess
ag
eP
urp
ose
Pack
et-i
nm
essa
ge
--o
fp_h
eade
r-da
ta-
reas
on-
-coo
kie-
tabl
e_id
-to
tal_
len
-of
p_m
atch
-buf
fer_
id-p
ad
OFP
T_PA
CK
ET_I
NU
sed
byth
esw
itch
toin
form
cont
rolle
rw
ith
pack
etre
ceiv
ed.
Flow
rem
oved
mes
sage
-of
p_he
ader
-co
okie
-re
ason
--p
rior
ity-
tabl
e_id
-of
p_m
atch
-id
le_t
imeo
ut-
dura
tion
_sec
-ha
rd_t
imeo
ut-
pack
et_c
ount
-by
te_c
ount
-du
rati
on_n
sec
OFP
T_FL
OW
_REM
OV
EDU
sed
byth
esw
itch
tono
tify
the
cont
rolle
rw
ith
dele
ted
flow
entr
ies.
Port
stat
usm
essa
ge-
ofp_
head
er–
reas
on-
pad
-of
p_po
rtde
scO
FPT_
POR
T_ST
ATU
SU
sed
byth
esw
itch
tono
tify
the
cont
rolle
rw
ithth
epo
rts
adde
d,re
mov
edor
mod
ified
.
Con
trol
ler
role
stat
usm
essa
ge
-of
p_he
ader
-ro
le-
reas
on-
pad
-ge
nera
tion
_id
OFP
T_R
OLE
_STA
TUS
Use
dby
the
swit
chto
chan
geth
eco
ntro
ller
role
.
Tabl
est
atus
mes
sage
-of
p_he
ader
-re
ason
-pa
d-
ofp_
tabl
e_de
scta
ble
OFP
T_TA
BLE_
STA
TUS
Use
dby
the
swit
chto
info
rmco
ntro
ller
wit
hth
ech
ange
ofta
ble
stat
us.
37
Books
MDPI

J. Sens. Actuator Netw. 2018, 7, 1
Figure 5. (a) Evolved Packet Core cellular network; (b) First case of the proposed system; (c) Secondcase of the proposed system.
4. Simulation and Results
In this section, the proposed structure for the Tactile Internet system is simulated over a reliableenvironment, and the results are discussed.
4.1. Simulation Environment and Experiment Set Up
There are a number of efficient simulation environments and frameworks that are used to simulateand evaluate the performance and attributes of SDN and MEC based networks. One of the mostefficient, reliable, and powerful frameworks is the CloudSim environment and its related extensionprojects. CloudSim is a Java based simulation framework that enables simulation, experimentation,and modeling for cloud based networks [48]. CloudSimSDN is a Java based simulation frameworkthat is built on top of CloudSim [49]. This framework is developed mainly for simulation purposes ofSDN and cloud based systems.
In CloudSimSDN, the SDNC is programmable and it allows for the testing of VM managementpolicies and workload scheduling algorithms [50]. Furthermore, the centralized controller isresponsible for dynamically managing resources in data centers. Based on [49], the authors provethat CloudSimSDN simulator provides much features and facilities with better or at least the sameperformance as Mininet simulation environment. Also, it gives the ability for the modificationsand extensions.
We consider two simulation cases with the topology illustrated in Figure 5b,c. In the first case,the two hosts belongs two different base stations (eNBs), but the two eNBs are connected to the sameMini-cloud. In the second case, the two hosts are in different cells and the cells are connected todifferent Mini-cloud units. The round trip delay is considered to be the performance of our system.The simulation process is repeated multi-times, with different bandwidth for each time but with thedata size is the same in each case. All important simulation parameters used are illustrated in Table 4.
38
Books
MDPI

J. Sens. Actuator Netw. 2018, 7, 1
Table 4. Simulation parameters.
Simulation Parameter Value
OpenFlow Switch processing delay 5 μsSDN Controller processing delay 0.5 μs
Arrival rate of the Micro-cloud unit λi 15The communication latency inside the cellular cell 100 μs
Bandwidth VariableMicro-cloud RAM, Storage 1024 Mb, 1 GbMini-cloud RAM, Storage 2048 Mb, 5 Gb
4.2. Simulation Results and Analyses
Figures 6 and 7 illustrate the results for the first and the second simulation cases. From simulationresults, the round trip delay is decreased with the increase of the system bandwidth. For the secondcase, the round trip delay is higher than that of the first case, this is because the core network controlleris not involved in the communication process as the Mini-cloud unit manages and performs thecommunication process. Based on [6,51] the user bit rate for the future 5G cellular system will rangefrom 1 Gbps to 10 Gbps. For the least expected bit rate (1 Gbps), the proposed tactile system affords around trip delay of 0.95 ms for the first simulation case and 1.22 ms for the second case. Moreover,as the bit rate is raised above 1 Gbps the round trip delay gets below the previous values which makethe proposed structure get ride off the challenge of 1 ms round trip latency.
Based on the 3GPP release 13, the LTE system achieves round trip latency of 16 ms for the100 Mbps bit rate and 8 ms for 1 Gbps based on release 15 [52,53]. Thus, the proposed system canimprove the latency efficiency and provides a way for Tactile Internet realization. When comparedto the traditional Evolved Packet Core network based on the 3GPP release 15, the proposed systemachieves 88% reduction of the round trip latency for the first case and 84% for the second case, which isthe worst.
Figure 6. Simulation results for the first case.
39
Books
MDPI

J. Sens. Actuator Netw. 2018, 7, 1
Figure 7. Simulation results for the second case.
5. Conclusions
SDN, NFV, and MEC technologies are solutions to overcome the challenges associated with therealization of Tactile Internet system, especially the 1 ms round trip latency. Employing SDN at thecore network of cellular system reduces the latency and efficiently improves the system performance.This is because SDNC can efficiently manage and establish an efficient and flexible routing pathbetween any two end points. Thus, it can reduce the number of intermediate nodes that are involvedin communication process. The proposed structure for the Tactile Internet system, which employsSDN at the core of the network and multi-level cloud units, poses a round trip latency of orders of ms.Thus, this structure is helpful and effective for building the Tactile Internet system.
Acknowledgments: The publication was financially supported by the Ministry of Education and Science of theRussian Federation (the Agreement number 02.a03.21.0008). The authors are grateful to the Middle East University,Amman, Jordan for the financial support granted to cover the publication fee of this research article.
Author Contributions: Abdelhamied A. Ateya and Ammar Muthanna built the network model and perform thesimulation process. Irina Gudkova and Abdelrahman Abuarqoub analyze the existing methods and the issuesrelated to the OpenFlow protocol. Anastasia Vybornova and Andrey Koucheryavy wrote the paper and revise thewhole work.
Conflicts of Interest: The authors declare no conflict of interest.
References
1. Aijaz, A. Towards 5G-enabled tactile internet: Radio resource allocation for haptic communications.In Proceedings of the 2016 IEEE Wireless Communications and Networking Conference (WCNC),Doha, Qatar, 3–6 April 2016; pp. 1–6.
2. Simsek, M.; Aijaz, A.; Dohler, M.; Sachs, J.; Fettweis, G. 5G-enabled tactile internet. IEEE J. Sel. Areas Commun.2016, 34, 460–473. [CrossRef]
3. ITU-T Technology Watch Report—The Tactile Internet; International Telecommunication Union:Paris, France, 2014.
4. Maier, M.; Chowdhury, M.; Rimal, B.P.; van, D.P. The tactile internet: Vision, recent progress, and openchallenges. IEEE Commun. Mag. 2016, 54, 138–145. [CrossRef]
5. Ateya, A.A.; Vybornova, A.; Kirichek, R.; Koucheryavy, A. Multilevel cloud based Tactile Internet system.In Proceedings of the 19th International Conference on Advanced Communication Technology (ICACT),Bongpyeong, Korea, 19–22 February 2017; pp. 105–110.
6. Alliance, N.G.M.N. 5G White Paper; Next Generation Mobile Networks: Frankfurt, Germany, 2017.
40
Books
MDPI

J. Sens. Actuator Netw. 2018, 7, 1
7. Liu, Y.; Liu, G. User-centric wireless network for 5G. In 5G Mobile Communications; Springer InternationalPublishing: Cham, Switzerland, 2017; pp. 457–473.
8. Han, B.; Gopalakrishnan, V.; Ji, L.; Lee, S. Network function virtualization: Challenges and opportunities forinnovations. IEEE Commun. Mag. 2015, 53, 90–97. [CrossRef]
9. Karl, H.; Dräxler, S.; Peuster, M.; Galis, A.; Bredel, M.; Ramos, A.; Martrat, J.; Siddiqui, M.S.; van Rossem, S.;Tavernier, W.; et al. DevOps for network functionvirtualisation: An architectural approach. Trans. Emerg.Telecommun. Technol. 2016, 27, 1206–1215. [CrossRef]
10. Blanco, B.; Fajardo, J.O.; Giannoulakis, I.; Kafetzakis, E.; Peng, S.; Pérez-Romero, J.; Trajkovska, I.;Khodashenas, P.S.; Goratti, L.; Paolino, M.; et al. Technology pillars in the architecture of future 5G mobilenetworks: NFV, MEC and SDN. Comput. Stand. Interfaces 2017, 54, 216–228. [CrossRef]
11. Kirichek, R.; Vladyko, A.; Paramonov, A.; Koucheryavy, A. Software-defined architecture for flyingubiquitous sensor networking. In Proceedings of the 2017 19th International Conference on AdvancedCommunication Technology (ICACT), Bongpyeong, Korea, 19–22 February 2017; pp. 158–162.
12. Hammoudeh, M.; Newman, R. Information extraction from sensor networks using the Watershed transformalgorithm. Inf. Fusion 2015, 22, 39–49. [CrossRef]
13. Abuarqoub, A.; Hammoudeh, M.; Adebisi, B.; Jabbar, S.; Bounceur, A.; Al-Bashar, H. Dynamic clusteringand management of mobile wireless sensor networks. Comput. Netw. 2017, 117, 62–75. [CrossRef]
14. Athmiya, N.S.; Shobha, K.R.; Sarimela, V. Feasibility study and implementation of openflow based SDNcontroller for tactical scenario. In Proceedings of the IEEE International Conference on Recent Trendsin Electronics, Information & Communication Technology (RTEICT), Bangalore, India, 20–21 May 2016;pp. 789–794.
15. Muthanna, A.; Masek, P.; Hosek, J.; Fujdiak, R.; Hussein, O.; Paramonov, A.; Koucheryavy, A. Analyticalevaluation of D2D connectivity potential in 5G wireless systems. In Proceedings of the InternationalConference on Next Generation Wired/Wireless Networking, St. Petersburg, Russia, 26–28 September 2016;Springer International Publishing: Cham, Switzerland, 2016; pp. 395–403.
16. Shariat, M.; Gutierrez-Estevez, D.M.; Vijay, A.; Safjan, K.; Rugeland, P.; Silva, I.; Lorca, J.; Widmer, J.;Fresia, M.; Li, Y.; et al. 5G radio access above 6 GHz. Trans. Emerg. Telecommun. Technol. 2016, 27, 1160–1167.[CrossRef]
17. Jiang, M.; Condoluci, M.; Mahmoodi, T. Network slicing management & prioritization in 5G mobilesystems. In Proceedings of the 22th European Wireless Conference European Wireless (VDE), Oulu, Finland,18–20 May 2016; pp. 1–6.
18. An, X.; Zhou, C.; Trivisonno, R.; Guerzoni, R.; Kaloxylos, A.; Soldani, D.; Hecker, A. On end to end networkslicing for 5G communication systems. Trans. Emerg. Telecommun. Technol. 2017, 28. [CrossRef]
19. Satyanarayanan, M. The Emergence of Edge Computing. Computer 2017, 50, 30–39. [CrossRef]20. Jin, X.; Li, L.E.; Vanbever, L.; Rexford, J. Softcell: Scalable and flexible cellular core network architecture.
In Proceedings of the Ninth ACM Conference on Emerging Networking Experiments and Technologies,Santa Barbara, CA, USA, 9–12 December 2013; pp. 163–174.
21. Iovanna, P.; Ubaldi, F. SDN solutions for 5G transport networks. In Proceedings of the 2015 InternationalConference on Photonics in Switching (PS), Florence, Italy, 22–25 September 2015; pp. 297–299.
22. Szabo, D.; Gulyas, A.; Fitzek, F.H.; Lucani, D.E. Towards the tactile internet: Decreasing communicationlatency with network coding and software defined networking. In Proceedings of the 21th European WirelessConference European Wireless, Budapest, Hungary, 20–22 May 2015; pp. 1–6.
23. Hammoudeh, M.; Newman, R. Interpolation techniques for building a continuous map from discrete wirelesssensor network data. Wirel. Commun. Mob. Comput. 2013, 13, 809–827. [CrossRef]
24. Abuarqoub, A.; Abusaimeh, H.; Hammoudeh, M.; Uliyan, D.; Abu-Hashem, M.A.; Murad, S.; Al-Jarrah, M.;Al-Fayez, F. A survey on internet of things enabled smart campus applications. In Proceedings of theInternational Conference on Future Networks and Distributed Systems, Cambridge, UK, 19–20 July 2017.
25. Hammoudeh, M. Putting the lab on the map: A wireless sensor network system for border security andsurveillance. In Proceedings of the International Conference on Internet of things and Cloud Computing,Cambridge, UK, 22–23 March 2016.
26. Chochlidakis, G.; Friderikos, V. Low latency virtual network embedding for mobile networks. In Proceedingsof the 2016 IEEE International Conference on Communications (ICC), Kuala Lumpur, Malaysia,22–27 May 2016; pp. 1–6.
41
Books
MDPI

J. Sens. Actuator Netw. 2018, 7, 1
27. Wang, K.; Wang, Y.; Zeng, D.; Guo, S. An SDN-based architecture for next-generation wireless networks.IEEE Wirel. Commun. 2017, 24, 25–31. [CrossRef]
28. Aijaz, A.; Simsek, M.; Dohler, M.; Fettweis, G. Shaping 5G for the Tactile Inter-net. In 5G MobileCommunications; Springer International Publishing: Cham, Switzerland, 2017; pp. 677–691.
29. Chih-Lin, I.; Han, S.; Xu, Z.; Sun, Q.; Pan, Z. 5G: Rethink mobile communications for 2020+. Phil. Trans. R.Soc. A 2016, 374. [CrossRef] [PubMed]
30. Pance, A.; Webb, U.; Mayo, S.A.; Apple Inc. Haptic Feedback Device. U.S. Patent 9,710,061, 18 July 2017.31. Ateya, A.A.; Vybornova, A.; Samouylov, K.; Koucheryavy, A. System model for multi-level cloud based tactile
internet system. In Proceedings of the International Conference on Wired/Wireless Internet Communication,St. Petersburg, Russia, 21–23 June 2017; Springer: Cham, Switzerland, 2017; pp. 77–86.
32. Sahoo, K.S.; Mohanty, S.; Tiwary, M.; Mishra, B.K.; Sahoo, B. A comprehensive tutorial on software definednetwork: The driving force for the future internet technology. In Proceedings of the International Conferenceon Advances in Information Communication Technology & Computing, Bikaner, India, 12–13 August 2016;p. 114.
33. Open vSwitch. Available online: http://openvswitch.org (accessed on 20 September 2017).34. Taleb, T.; Samdanis, K.; Mada, B.; Flinck, H.; Dutta, S.; Sabella, D. On multi-access edge computing: A survey
of the emerging 5G network edge architecture & orchestration. IEEE Commun. Surv. Tutor. 2017. [CrossRef]35. Open Networking Foundation (ONF). Available online: https://www.opennetworking.org/ (accessed on
10 October 2017).36. Karakus, M.; Durresi, A. Quality of Service (QoS) in software defined networking (SDN): A survey. J. Netw.
Comput. Appl. 2017, 80, 200–218. [CrossRef]37. OpenFlow v1.4 Specification White Paper. Available online: https://www.opennetworking.org/images/
stories/downloads/sdn-resources/onf-specifications/openflow/openflow-spec-v1.4.0.pdf (accessed on12 December 2017).
38. Basta, A.; Kellerer, W.; Hoffmann, M.; Hoffmann, K.; Schmidt, E.D. A virtual SDN-enabled LTE EPCarchitecture: A case study for S-/P-gateways functions. In Proceedings of the 2013 IEEE SDN for FutureNetworks and Services (SDN4FNS), Trento, Italy, 11–13 November 2013; pp. 1–7.
39. Gude, N.; Koponen, T.; Pettit, J.; Pfaff, B.; Casado, M.; McKeown, N.; Shenker, S. NOX: Towards an operatingsystem for networks. ACM SIGCOMM Comput. Commun. Rev. 2008, 38, 105–110. [CrossRef]
40. Ng, E.; Cai, Z.; Cox, A.L. Maestro: A System for Scalable Openflow Control; TSEN Maestro-Technical ReportTR10-08; Rice University: Houston, TX, USA, 2010.
41. NOXrepo.org. Available online: https://github.com/noxrepo/ (accessed on 1 October 2017).42. Erickson, D. The beacon openflow controller. In Proceedings of the Second ACM SIGCOMM Workshop on
Hot Topics in Software Defined Networking, Hong Kong, China, 16 August 2013; pp. 13–18.43. Project Floodlight: Open Source Software for Building Software-Defined Networks. Available online:
http://www.projectfloodlight.org/floodlight/ (accessed on 25 September 2017).44. OpenDaylight. Available online: http://www.opendaylight.org/ (accessed on 25 September 2017).45. OpenIRIS Project. Available online: https://github.com/openiris/IRIS/wiki (accessed on 5 October 2017).46. Onosproject. Available online: https://onosproject.org/software/ (accessed on 7 October 2017).47. Hartert, R.; Vissicchio, S.; Schaus, P.; Bonaventure, O.; Filsfils, C.; Telkamp, T.; Francois, P. A Declarative and
Expressive Approach to Control Forwarding Paths in Carrier-Grade Networks. In Proceedings of the ACMSIGCOMM Computer Communication Review, London, UK, 17–21 August 2015; Volume 45, pp. 15–28.Available online: https://sites.uclouvain.be/defo/#publications (accessed on 7 October 2017).
48. Kumar, R.; Sahoo, G. Cloud computing simulation using CloudSim. arXiv, 2014.49. Son, J.; Dastjerdi, A.V.; Calheiros, R.N.; Ji, X.; Yoon, Y.; Buyya, R. Cloudsimsdn: Modeling and simulation of
software-defined cloud data centers. In Proceedings of the 2015 15th IEEE/ACM International Symposiumon Cluster, Cloud and Grid Computing (CCGrid), Shenzhen, China, 4–7 May 2015; pp. 475–484.
50. CloudSimSDN Project. Available online: https://github.com/jayjmin/cloudsimsdn (accessed on12 December 2017).
51. Zheng, K.; Zhao, L.; Mei, J.; Dohler, M.; Xiang, W.; Peng, Y. 10 Gb/s hetsnets with millimeter-wavecommunications: Access and networking-challenges and protocols. IEEE Commun. Mag. 2015, 53, 222–231.[CrossRef]
42
Books
MDPI

J. Sens. Actuator Netw. 2018, 7, 1
52. Arenas, J.; Dudda, T.; Falconetti, L. Ultra-Low Latency in Next Generation LTE Radio Access.In Proceedings of the SCC 2017 11th International ITG Conference on Systems, Communications andCoding, Hamburg, Germany, 6–9 February 2017; pp. 1–6.
53. Lauridsen, M.; Gimenez, L.C.; Rodriguez, I.; Sorensen, T.B.; Mogensen, P. From LTE to 5G for ConnectedMobility. IEEE Commun. Mag. 2017, 55, 156–162. [CrossRef]
© 2018 by the authors. Licensee MDPI, Basel, Switzerland. This article is an open accessarticle distributed under the terms and conditions of the Creative Commons Attribution(CC BY) license (http://creativecommons.org/licenses/by/4.0/).
43
Books
MDPI

Journal of
Actuator NetworksSensor and
Article
Using Sensors to Study Home Activities †
Jie Jiang 1,*, Riccardo Pozza 2, Kristrún Gunnarsdóttir 1 , Nigel Gilbert 1 and Klaus Moessner 2
1 Centre for Research in Social Simulation, University of Surrey, Guildford GU2 7XH, UK;[email protected] (K.G.); [email protected] (N.G.)
2 5G Innovation Centre, University of Surrey, Guildford GU2 7XH, UK; [email protected] (R.P.);[email protected] (K.M.)
* Correspondence: [email protected]; Tel.: +44-148-368-3965† This paper is an extended version of our paper published in Jiang, J.; Pozza, R.; Gunnarsdóttir, K.;
Gilbert, N.; Moessner, K. Recognising Activities at Home: Digital and Human Sensors. In Proceedings of theInternational Conference on Future Networks and Distributed Systems, Cambridge, UK, 19–20 July 2017;ACM: New York, NY, USA, 2017; ICFNDS’17, pp. 17:1–17:11.
Received: 1 November 2017; Accepted: 13 December 2017; Published: 16 December 2017
Abstract: Understanding home activities is important in social research to study aspects of home life,e.g., energy-related practices and assisted living arrangements. Common approaches to identifyingwhich activities are being carried out in the home rely on self-reporting, either retrospectively(e.g., interviews, questionnaires, and surveys) or at the time of the activity (e.g., time use diaries).The use of digital sensors may provide an alternative means of observing activities in the home.For example, temperature, humidity and light sensors can report on the physical environment whereactivities occur, while energy monitors can report information on the electrical devices that areused to assist the activities. One may then be able to infer from the sensor data which activities aretaking place. However, it is first necessary to calibrate the sensor data by matching it to activitiesidentified from self-reports. The calibration involves identifying the features in the sensor data thatcorrelate best with the self-reported activities. This in turn requires a good measure of the agreementbetween the activities detected from sensor-generated data and those recorded in self-reported data.To illustrate how this can be done, we conducted a trial in three single-occupancy households fromwhich we collected data from a suite of sensors and from time use diaries completed by the occupants.For sensor-based activity recognition, we demonstrate the application of Hidden Markov Modelswith features extracted from mean-shift clustering and change points analysis. A correlation-basedfeature selection is also applied to reduce the computational cost. A method based on Levenshteindistance for measuring the agreement between the activities detected in the sensor data and thatreported by the participants is demonstrated. We then discuss how the features derived from sensordata can be used in activity recognition and how they relate to activities recorded in time use diaries.
Keywords: sensors; time use diaries; activity recognition; time series; Internet of Things;social research
1. Introduction
Social researchers take a great interest in household practices, among other things,family dynamics and child-rearing (e.g., [1,2]), practices around meals [3], sleep [4], assisted livingarrangements and mobile health solutions (e.g., [5,6]), homeworking [7] and energy-relatedpractices [8]. Existing social research methods are both qualitative and quantitative, and often somecombination of the two are used for pragmatic and constructivist purposes [9].
Qualitative methods are used to acquire rich in-depth data. Observations and open-endedinterviews are particularly effective in capturing the meanings participants attach to various aspects oftheir everyday lives and relations (e.g., [10]). Quantitative methods such as questionnaires and surveys
J. Sens. Actuator Netw. 2017, 6, 32 44 www.mdpi.com/journal/jsan
Books
MDPI

J. Sens. Actuator Netw. 2017, 6, 32
capture qualitative information in formalised ways for computational processing, and are widelyused in large scale studies on demographics, household economics and social attitudes (e.g., [11,12]).Time-use diaries are also used to log activity sequences [13], and to seek evidence of life changes andsocial evolution [14]. Efforts to harmonise time use surveys across Europe have delivered guidelines(HETUS) [15] on activity coding for analysing the time use data, but interviews and observations arecommonly used to cross-validate what goes on, and to calibrate and amplify the meaning of the diaryevidence, including the use of activity sensors and video cameras [16].
Sensor-generated data are becoming widely available and the topic of activity recognition [17] hasthrived in recent years with applications in areas such as smart homes and assisted living. Researchershave investigated activity recognition methods using data obtained from various types of sensors,for instance, video cameras [18], wearables [19] and sensors embedded in smartphones [20]. Such richcontextual information has been used in various activity specific studies. For example, Williams et al. [4]discuss the use of accelerometers to study people’s sleep patterns. Amft and Tröster [21] study people’sdietary behaviour by using inertial sensors to recognise movements, a sensor collar for recognisingswallowing and an ear microphone for recognising chewing. Wang et al. [22] help in detecting elderlyaccidental falls by employing accelerometers and cardiotachometers.
Numerous algorithms have been proposed for general activity recognition in the literature,most of which are based on the assumption that by sensing the environment it is possible to inferwhich activities people are performing. Dynamic Bayesian Networks (e.g., [23]), Hidden MarkovModels (e.g., [24]) and Conditional Random Fields (e.g., [25]) are popular methods due to their ability torecognise latent random variables in observing sequences of sensor-generated data. Other approachesrely on Artificial Neural Networks (e.g., [26]). A more detailed discussion will be given in Section 2.
To evaluate the adequacy of inferences about activities derived from sensor data, records of whatactivities are taking place from direct observation can be used to obtain the so-called “ground truth”.In the literature, there are three main types of approaches. The first relies on video cameras torecord what participants are doing during an experiment. For example, Lin and Fu [23], use multiplecameras and floor sensors to track their participants. Although the data quality can be guaranteedin a controlled lab, this method is very intrusive and difficult to deploy in an actual home. A secondcommon way of establishing ground truth is by asking participants to carry out a predefined list oftasks, again, in a controlled environment. For example, Cook et al. [27] ask their participants to carryout scripted activities, predetermined and repeatedly performed. Both of these methods correspondwith social research methods, such as questionnaires, surveys and interviews, in generating whatSilverman calls “researcher-provoked” data [28]. The outcomes may suffer the bias introduced by theresearchers in provoking participants’ activities as opposed to observing them without interference.The third type of approach relies on human annotators to label sensor-generated data manually.For example, Wang et al. [29] conducted a survey with their participants to have a self-reportedrecord of their main activities, and compared it to the annotated data based on video recordings.This type of approach relies heavily on the annotator’s knowledge of participants’ activities andtheir understanding of participants’ everyday practices, but may also be challenged by discrepanciesbetween the research-provoked survey and video data and non-provoked sensor-generated data.
In this study, we consider two data sources. The first is “digital sensors” that generate activitydata based on activity recognition derived from sensor-generated environment data (referred to assensor data or sensor-generated data in the rest of the paper). The second is “human sensors” thatgenerate activity data from participants’ self-reported time-use diaries (referred to as time use diaryor self-reported data in the rest of the paper). To make inferences from sensor data about humanactivities, it is first necessary to calibrate the sensor data by matching the data to activities identified bythe self-reported data. The calibration involves identifying the features in the sensor data that correlatebest with the self-reported activities. This in turn requires a good measure of the agreement betweenthe activities detected from sensor-generated data and those recorded in self-reported data.
45
Books
MDPI

J. Sens. Actuator Netw. 2017, 6, 32
To illustrate how this can be done, we conducted a trial in three residential houses, collectingdata from a set of sensors and from a time use diary recorded by the occupant (human sensor) fromeach house over four consecutive days. The sensors captured temperature, humidity, range (detectingmovements in the house), noise (decibel levels), ambient light intensity (brightness) and energyconsumption. For activity recognition, we adopt an unsupervised learning approach based ona Hidden Markov Model, i.e., only sensor-generated data are used to fit the model, which allowsthe model to discover the patterns by itself rather than fitting the model with unreliable labelsfrom the time use diaries. We apply mean shift clustering [30] and change points detection [31] forextracting features. To reduce computational cost, we adopt a correlation-based approach [32] forfeature selection. To compare the data generated by the two types of sensors, we propose a method formeasuring the agreement between them based on the Levenshtein distance [33].
The contributions of this paper are three-fold. First, we present a new data collection frameworkfor recognising activities at home, i.e., a mixed-methods approach of combining computational andqualitative types of non-provoked data: sensor-generated and time use diary. Secondly, we investigatethe application of several feature extraction and feature selection methods for activity recognitionusing sensor-generated data. Thirdly, we propose an evaluation method for measuring the agreementbetween the sensor-supported activity recognition algorithms and the human constructed diary.Compared to our previous work [34], this paper has the following extensions: (1) we add an illustrationof the trial setup procedure and discuss the design of the procedure; (2) we use a larger data set ofthree households and investigate three more activity types; (3) we demonstrate the use of featureselection in activity recognition to harness the exploration of feature combinations; and (4) we furtherthe analysis of results by triangulating with evidence from household interviews.
The rest of the paper is organised as follows. In Section 2, we discuss related work. In Section 3,we give an introduction to the home settings. Thereafter, in Section 4, we describe the data collectedfor this study, including both the sensor data and the time use diary data. In Section 5, we show howfeatures are extracted and selected and introduce our activity recognition algorithm. In Section 6,we present the metric for evaluating agreement between activities recognised by the sensor-generateddata and what is reported by the participant, and give an analysis of the results based on the evidencegathered from household interviews. Finally, we conclude our work with some possible extensions inSection 7.
2. Related Work
In this section, we discuss the works that have been recently published in the area of automatedactivity recognition in home-like environments in terms of the sensors they use, the activities theydetect, and the recognition methods they adopt or propose.
Early works (e.g., [23,35]) were concerned with designing frameworks for providing servicesbased on the prediction of resident action. For example, Lin and Fu [23] leveraged K-means clusteringand domain knowledge to create context out of raw sensor data and combined this with DynamicBayesian Networks (DBNs) to learn multi-user preferences in a smart home. Their testbed allowslocation tracking and activity recognition via cameras, floor sensors, motion detectors, temperatureand light sensors in order to recommend services to multiple residents, such as turning on TV or lightsin various locations or playing music.
More recently, the CASAS smart home project [36] enabled the detection of multi-residentactivities and interactions in a testbed featuring motion, temperature, water and stove (ad-hoc) usagesensors, energy monitors, lighting controls and contact detectors for cooking pots, phone books andmedicine containers. Using the testbed, Singla et al. [37] applied Hidden Markov Models (HMMs)to perform real-time recognition of activities of daily living. Their work explores seven types ofindividual activities: filling medication dispenser, hanging up clothes, reading magazine, sweepingfloor, setting the table, watering plants, preparing dinner, and 4 types of cooperative activities: movingfurniture, playing checkers, paying bills, gathering and packing picnic food. Validated against the same
46
Books
MDPI

J. Sens. Actuator Netw. 2017, 6, 32
data set, Hsu et al. [25] employed Conditional Random Fields (CRFs) with strategies of iterative anddecomposition inference. They found that data association of non-obstructive sensor data is importantto improve the performance of activity recognition in a multi-resident environment. Chiang et al. [38]further improved the work in [25] with DBNs that extend coupled HMMs by adding vertices to modelboth individual and cooperative activities.
The single-occupancy datasets from CASAS also attracted many researchers. For example,Fatima et al. [39] adopted a Support Vector Machine (SVM) based kernel fusion approach for activityrecognition and evaluated it on the Milan2009 and Aruba datasets. Fang et al. [40] evaluatedthe application of neural network for activity recognition based on a dataset of two volunteers.Khrishnan and Cook [41] evaluated an online sliding-window based approach for activity recognitionon a dataset of three single-occupancy houses. The authors showed that combining mutual informationbased weighting of sensor events and adding past contextual information to the feature leads to betterperformance. To analyse possible changes in cognitive or physical health, Dawadi et al. [42] introducedthe notion of activity curve and proposed a permutation-based change detection in activity routinealgorithm. The authors validated their approach with a two-year smart home sensor data. In theseworks, different kinds of sensors were used such as temperature and light sensors, motion andwater/stove usage sensors. The recognised activities range from common ones such as eating andsleeping to more specific ones like taking medication.
ARAS [43] is a smart home data set collected from two houses with multiple residents. Thetwo houses were equipped with force sensitive resistors, pressure mats, contact sensors, proximitysensors, sonar distance sensors, photocells, temperature sensors, and infra-red receivers. Twenty-seventypes of activities were labelled such as watching TV, studying, using internet/telephone/toilet,preparing/having meals, etc. With the ARAS dataset, Prossegger and Bouchachia [44] illustrated theeffectiveness of an extension to the incremental decision tree algorithm ID5R, which induces decisiontrees with leaf/class nodes augmented by contextual information in the form of activity frequency.
With a mission of elderly care, the CARE project [45] has carried out research on automaticmonitoring of human activities in domestic environments. For example, Kasteren et al. [46]investigated HMMs and CRFs for activity recognition in a home setting and proposed to use Bluetoothheadsets for data annotation. Fourteen state-change sensors were placed on the doors, cupboards,refrigerator and toilet flush. Seven types of activities were annotated by the participants themselves,including sleeping, having breakfast, showering, eating dinner, drinking, toileting and leavingthe house. Two probabilistic models, HMM and CRF, were investigated for activity recognition.Kasteren et al. [24] provided a summary of probabilistic models used in activity recognition andevaluated their performance on datasets of three households with single occupant. Further work byOrdonez et al. [47] evaluated transfer learning with HMMs on a dataset of three houses with the samesetting of sensor deployment and labelled activity types, showing potential of reusing experience onnew target houses where little annotated data is available.
Besides probabilistic models, neural network models are becoming popular in recognisinghuman activities. For example, Fan et al. [26] studied three neural network structures (Gated RecurrentUnit, Long Short-Term Memory, Recurrent Neural Network) and showed that a simple structurethat remembers history as meta-layers outperformed recurrent networks. The sensors they usedinclude grid-eye infrared array, force and noise sensors as well as electrical current detectors. For theirmodel training, the participants performed scripted activities in a home testbed: eating, watching TV,reading books, sleeping and friends visiting. Singh et al. [48] showed that Long Short-Term Memoryclassifiers outperformed probabilistic models such as HMM and CRF when raw sensor data was used.Laput et al. [49] proposed a general-purpose sensing approach with a single sensor board that iscapable of detecting temperature, humidity, light intensity and colour, motion, sound, air pressure,WiFi RSSI, magnetism (magnetometer) and electromagnetic inference (EMI sensor). The sensors weredeployed in five different locations including a kitchen, an office, a workshop, a common area anda classroom. For activity recognition, a supervised approach based on SVM and a two-stage clustering
47
Books
MDPI

J. Sens. Actuator Netw. 2017, 6, 32
approach with AutoEncoder were used. The authors showed the merit of the sensor features withrespect to their contribution to the recognition of 38 types of activities.
While several other approaches exist for activity recognition and capture, they mostly employ onlywearable sensors (i.e., see [19] for a recent survey), and thus cannot be applied in multi-modal scenariosof smart-home settings with fixed, unobtrusive and ambient sensors. In addition, due to the time-seriesnature of activity recognition in the home environment, supervised algorithms not incorporating thenotion of temporal dependence might lead to poor performance in activity recognition, so such worksare not reviewed here.
Time use diaries are widely used for collecting activity data. To validate time use diaries,Kelly et al. [16] tested the feasibility of using wearable cameras. Participants were asked to weara camera and at the same time keep a record of time use over a 24-hour period. During an interviewwith each participant afterwards, the visual images were used as prompts to reconstruct the activitysequences and improve upon the activity record. No significant differences were found between thediary and camera data with respect to the aggregate totals of daily time use. However, for discreteactivities, the diaries recorded a mean of 19.2 activities per day, while the image-prompted interviewsrevealed 41.1 activities per day. This raises concerns of using the data collected from time use diariesfor training activity recognition models directly.
In this work, we use a suite of fixed sensors. For activity recognition, we build our modelbased on HMMs. In particular, we investigate the use of mean shift clustering and change pointsdetection techniques for feature extraction. A correlation-based feature selection method is applied toreduce computational cost. Our work differs from similar studies in that we adopt a mixed-methodsapproach for the problem of recognising activities at home, and we evaluate its effectiveness usinga formal framework.
3. Experiment Setting
For this work, we installed a suite of sensors in three households. The data collected by thesensors were encrypted and sent to a central server over the Internet.
3.1. Sensor Modules
We used six types of sensor modules, as summarised in Table 1.
Table 1. Sensor Modules.
Sensor Modules Measurement
Sensor Box
Temperature sensor °CHumidity sensor %Light Sensor μW
cm2
Ranging sensor cmMicrophone dB SPL
Energy monitor watts
The first five sensor modules are encapsulated in a sensor box, as shown in Figure 1a,coordinated by a Seeeduino Arch-Pro [50]. The temperature and humidity sensor HTU21D [51]is managed via an I2C interface and sampled periodically by the client application deployed on theARM core. An Avago ADPS-9960 light sensor [52] , also managed via an I2C interface, is used tosample ambient light measured in μW
cm2 . The GP2Y0A60SZ ranging sensor from Sharp [53] is an analogsensor with a wide detection range of 10 cm to 150 cm, which is sampled via a 12 bit ADC andconverted through the manufacturer’s calibration table. Finally, the MEMS Microphone breakoutboard INMP401 [54] is used to sample noise levels in the environment via an ADC and the values areconverted to decibels (dB SPL).
48
Books
MDPI

J. Sens. Actuator Netw. 2017, 6, 32
The other sensor module used in this work is a commercial electricity monitoring kit fromCurrentCost [55], as shown in Figure 1b. It features a current transformer (CT) clamp, a number ofindividual appliance monitors (IAMs) and a transmitter to measure the energy consumption in wattsof the whole house as well as the individual appliances.
(a) (b)
Figure 1. Sensor Modules: (a) Sensor Box; and (b) Electricity Monitor.
Compared to the works discussed in Section 2, the sensor modules used for this work requirelittle effort on part of the participants.
3.2. Demonstration and Installation
For each household, we first set up an interview with the participants, in which we demonstratethe workings of the sensor platform to demystify the experiment, e.g., to show what kinds of data arecollected, and what can be seen in the data. Figure 2 shows the interface of our sensor data collectionand visualisation platform. Participants can interact with the sensors, e.g., turn electrical equipmenton and off, move in front or make loud noise around a sensor box, breathe on it, etc., and see in realtime the changes of corresponding sensor readings.
range
temperature
light
humidity
sound
range
temperature
light
humidity
sound
Figure 2. Demonstration Interface.
Thereafter, we ask the participants to give a tour of their house and explain what goes on atdifferent times in different rooms, who is involved, and so on. However, they are free to omit any
49
Books
MDPI

J. Sens. Actuator Netw. 2017, 6, 32
room or area of the house. A sketch of the floor plan with markings of potential places for installingsensors is produced in the meantime.
After the interview, another appointment is made for sensor installation. During the installation,the participants guide the researchers around the house and negotiate the location for placingthe sensors.
3.3. Trial Households
Three trial households are included in the experiment presented here, each with a single occupant.Table 2 shows the house composition and the sensor deployment.
Table 2. Sensors installed in each trial home.
Household RoomsSensor Boxes
(Location Installed)Electricity Monitors
(Appliances Attached)
1
Master bedroom Next to bed
Guest bedroom Next to bed Teasmade
Kitchen Entrance;Food preparation area
Washing machine;Microwave; Kettle
Living room withdining space Entrance; Sitting area TV
Living room Sitting area
Hallway On the wall
2
Bedroom Next to bed
Kitchen Cooking area Washing machine; Kettle,Toaster, Bread maker
Living room withdining space Dining area; Sitting area TV; Ironing/Vacuum
Living room Sitting area Laptop
Study Book shelf
Hallway On the wall
3
Bedroom Next to bed
Kitchen Food preparation area;Cooking area
Washing machine; Kettle,Toaster
Dining roomcombined with study
Sitting area; Next todesktop computer Desktop computer
Living room Sitting area
First utility room Near entrance
Second utility room Near entrance
Hallway On the wall Vacuum cleaner
For all the three houses, there was at least one sensor installed in each room, except bathroomswhich do not have electrical outlets in the UK. The number of sensor boxes installed in each roomdepends on the size of the room. The locations where the sensor boxes were installed were meantto cover as much as possible of the room space but were sometimes constrained by the availabilityof power supply. A selection of more commonly used home appliances were attached to individualenergy monitors. Their energy consumption as well as the total consumption for each of the householdswere also recorded.
50
Books
MDPI

J. Sens. Actuator Netw. 2017, 6, 32
4. Data Sets
In the experiment, two types of data were collected, sensor-generated data and time use diaries.The time use diaries cover a period of four consecutive days for all three households between June andJuly 2017 from 6:00 a.m. on the first day until 5:50 a.m. on the last day. The sensor-generated data setcovers an extended period from 6:00 p.m. on the previous day of the starting date (time use diary)and to 12:00 p.m. of the last day (time use diary). The reason for such an extension is to incorporatethe relevant signals before and after the recorded time use which will be illustrated in Section 5.1.
4.1. Sensor-Generated Data
The sensor-generated data consists of readings from the six types of sensor modules as shown inTable 1.
The data from sensor boxes were collected around every three seconds. An example reading froma sensor box is shown as follows:
{“Box_ID”: 123, “Timestamp”: 2016-12-13 09:00:00, “Temperature”: 20,“Humidity”: 50, “Sound”: 45, “Range”: 100, “Light”: 583}
For range, the lowest values among samples at 1000 Hz within each period of three seconds wascollected, i.e., the distance to the nearest object that has been detected in the period of three seconds.This is to minimise the number of false negative detections which may happen when only collectingsamples at a point of time every three seconds. Noise level (sound) is derived from an on-deviceconversion of air pressure changes (sampling at around 1000 Hz) to decibels (dB). The readings fromall the other sensor modules are sampled once every three seconds.
The data from electricity monitors (IAMs) was collected around every six seconds. An examplereading from an IAM is shown as follows:
{“IAM_ID”: 123, “Timestamp”: 2016-12-13 09:00:00, “Watts”: 100}
The sensor boxes can capture various environmental changes but not all the changes are causedby human activities. For example, the weather can be an important factor influencing temperature andhumidity. By carefully modelling the changes, we may be able to distinguish those caused by humanactivities from those caused by external factors as they differ in terms of magnitude and frequency.
Table 3 shows the statistics about the total number of readings of the sensor-generated data usedin this work with respect to the three households.
Table 3. Sensor Data Set Statistics.
Household Sensor Boxes Energy Monitors Total
1 1, 052, 439 × 5 353, 487 5, 615, 6822 918, 374 × 5 356, 310 4, 948, 1803 1, 183, 008 × 5 298, 397 6, 213, 437
The multiplier 5 in the second column indicates that each reading from a sensor box consists offive data attributes corresponding to the five sensor modules as shown in Table 1.
4.2. Time Use Diary
During the four days of the experiment, the occupant from each household was asked to keepa diary of time use based on the HETUS model [15]. The participants were asked to update the diaryat 10-minute intervals except sleeping and keep track of the 10 minutes interval using their ownpreferred method, e.g. setting up a timer. The diary was paper-based and the participants were given
51
Books
MDPI

J. Sens. Actuator Netw. 2017, 6, 32
instructions on how to fill the diary using pens and shorthand. For example, an arrow can be used tomark an activity that takes longer than 10 minutes. However, given the heavy workload of filling sucha diary, it is very likely that the participants may not have strictly followed the guidelines, as will befurther illustrated in Section 6.1.
Table 4 gives a partial sample of what is recorded: the participant specifies for every 10 minuteswhat he or she has been doing primarily (and possibly secondarily) in which location/room (possiblywith the assistance of or involving devices). For each household, there is at least one activity recordedby the occupant at each of the 10 minutes slots over the course of four days, which produces in total576 data points from the diary.
Table 4. Time use diary example.
Time Primary Activity Secondary Activity Location Devices
08:00–08:10 Preparing meal Listening to radio Kitchen Kettle, Radio08:10–08:20 Eating Watching TV Living room TV
......
......
...
18:00–18:10 Preparing meal ——– Kitchen Oven18:10–18:20 Preparing meal ——– Kitchen Oven
In this study, we focus on seven types of home activities that have been recorded in the timeuse diaries: sleeping, preparing meal, making hot drink (tea or coffee), eating (breakfast, lunch or dinner),watching TV, listening to radio, and doing laundry. It has to be noted that these are not the only activitiesthe participants reported in their diaries. These seven activity types are selected because they werereported by the occupants from all the three households and occur at a relatively higher frequency orlast for a relatively longer time. Table 5 shows a summary of how many times each type of activityoccurred and their duration in each household.
Table 5. Number of occurrences and time spent for each type of activity in the data set.
ActivityHousehold 1 Household 2 Household 3
Number ofOccurrences
Percentageof Time
Number ofOccurrences
Percentageof Time
Number ofOccurrences
Percentageof Time
Sleeping 5 36.94% 5 31.08% 5 40.28%Preparing meal 8 2.08% 10 2.78% 7 3.47%Making hot drink 13 2.26% 11 1.91% 2 0.52%Eating 10 4.17% 8 3.65% 8 3.30%Watching TV 13 16.15% 2 1.39% / /Listening to radio / / 15 10.42% 6 17.88%Doing Laundry 1 0.17% 6 1.04% 2 2.43%
Household 1 does not have a radio while the occupant had the TV turned on a lot of the time.Household 3 does not have a TV while the occupant had the radio turned on a lot of the time.Notice that for each household the total percentage of time designated to the seven activity types doesnot sum up to 100% because other activities carried out by the occupants are not listed in the table.
4.3. Data Reliability
In this section, we analyse the reliability of sensor-generated data in parallel form via the Pearsoncorrelations between readings from each pair of sensors that are of the same type and placed in thesame room (see Table 2). Table 6 summaries the correlations.
52
Books
MDPI

J. Sens. Actuator Netw. 2017, 6, 32
Table 6. Pearson correlation between the readings from pairs of sensors placed in the same room.
Sensor Reading Temperature Humidity Light Range Sound
Household 1 (kitchen) 0.94 0.75 0.90 0.56 0.88Household 1 (living/dining room) 0.93 0.89 0.95 0.21 0.86Household 2 (living/dining room) 0.49 0.62 0.85 0.33 0.57Household 3 (kitchen) 0.90 0.92 0.97 0.29 0.80Household 3 (dining room/study) 0.83 0.90 0.71 0.20 0.57
It can be seen that sensor readings from the same type of sensor in the same room have a strongcorrelation except for the readings from all pairs of ranging sensors and the pair of temperature sensorsin Household 2 (living/dining room). The relatively low correlations between ranging sensors mayrelate to the fact that: (1) ranging sensors have a limited sensing capability (up to 150 cm); and (2) oneof our guidelines of installing sensors is to cover as much room space as possible, i.e., ranging sensors(sensor boxes) are placed to capture movements in different parts of the room. Therefore, it is expectedthat only one of the ranging sensors is triggered at any given time. As for the pair of temperaturesensors, the relatively low correlation may be due to their positions in the room, i.e., one of the sensorboxes is placed near the window and the other is placed away from the window.
In Section 6, we will further discuss inter-rater/observer reliability by means of the agreementbetween sensor-generated data and human recorded time use diary.
5. Recognising Activities
Sensor-generated data provides a digital means of looking into the life of a household. Such datain itself does not tell directly what is taking place but it provides rich contextual information drawnfrom the aggregate of environmental variables. Our objective in this section is to investigate whatkinds of features can be drawn from the sensor-generated data and how such features can be used foractivity recognition.
5.1. Feature Extraction
Activities give rise to changes in sensor readings. For example, when cooking, the temperature mayrise in the kitchen because of the heat emitted from the hob, humidity levels go up and range readingsmay fluctuate intensively because of the physical movements involved. These types of changes inthe sensor-generated data are essential to better understand the context of activities and to recognisetheir occurrence.
There are two types of patterns in the sensor readings observed in our experiments. The firsttype is clusters, i.e., absolute values of sensor readings appear naturally in clusters. For example,the readings of the ranging sensor are either the maximum value during periods when nothing comesin and out of range or distinctly much smaller values. The second type relates to the distributionchanges of sensor readings along the time dimension, thus taking into account both time dependencyand value changes between sensor readings.
Accordingly, we investigate the application of three methods for extracting features fromsensor-generated data. The first, mean shift [30], aims at clustering the readings of sensor data intodifferent value bands. The second method, change points detection [31], aims at finding meaningfulpoints of change in the sequences of sensor-generated data. The third method, change points gapdetection, which is based on the second method, aims at identifying the length of stable periods ofreadings in sensor-generated data. In our experiment setting, we apply these three feature extractionmethods upon the re-sampled data, which is detailed in the next section.
53
Books
MDPI

J. Sens. Actuator Netw. 2017, 6, 32
5.1.1. Re-Sampling
To align with the time use diary and synchronise the data from the different sensors (sensor boxand energy monitors), we re-sample the sensor data with bins of 10 minutes. Re-sampling is doneusing the maximum values for temperature, humidity, brightness, noise level, and the minimumvalues for range. To cover the time use diary and give buffers for feature extraction, we re-sample anduse the sensor data from 6:00 p.m. on the day before the period of the time use diary to 12:00 p.m.on the day after that. The re-sampling results 685 data points (observations) for each sensor.
5.1.2. Mean Shift
Mean shift is a non-parametric clustering method that does not require prior knowledge of thenumber of clusters. It is based on an iterative procedure that shifts each data point to its nearestlocal mode, by updating candidates for centroids to be the mean of the data points within itsneighbourhood [30].
Given a set of data points S in a n-dimensional Euclidean space X, mean shift considers thesedata points as sampled from some underlying probability density function and uses a kernel functionfor estimating the probability density function. In this work, we chose to use a flat kernel K witha bandwidth h, as defined below:
K(x) =
{1 if ‖x‖ ≤ h,
0 otherwise.
The sample mean at x ∈ X is
m(x) =∑s∈S K(s − x)s∑s∈S K(s − x)
The difference m(x)− x is called mean shift and the mean shift algorithm is the procedure ofrepeatedly moving data points to the sample means until the means converge. In each iteration, s isupdated by m(s) for all s ∈ S simultaneously. As a result, all the data points are associated witha centroid/cluster. Applying this procedure to the re-sampled raw sensor readings, each data pointin the re-sampled dataset is represented by the index of its associated cluster. The implementation isbased on python scikit-learn [56].
As an example, the lower parts of Figures 3 and 4 show the results of features extracted via themean shift clustering algorithm. The data depicted in the upper parts of the two figures are from rangeand noise-level readings in the living room (with dining space) of Household 1. The readings for rangegenerate two clusters with indices of 0 and 1. A straightforward explanation is that the cluster withindex 0 represents the times when no movements are detected in the room and the cluster with index1 represents the times when movements are detected. As for the noise level, four clusters are generatedwith indices of 0, 1, 2, and 3, in which the cluster with index 0 represents the times when the kitchen isrelatively quiet while the other three clusters represent increasingly higher levels of noise.
54
Books
MDPI

J. Sens. Actuator Netw. 2017, 6, 32
Figure 3. Mean shift clustering of range readings from a sensor box in the living room (with diningspace) of Household 1.
Figure 4. Mean shift clustering of noise-level readings from a sensor box in the living room (withdining space) of Household 1.
5.1.3. Change Points Detection
Change points detection is a method of estimating the times at which the statistical properties ofa sequence of observations change [31].
Given a sequence of data, x1:n = (x1, . . . , xn), a change is considered to occur when thereexists a time τ ∈ {1, . . . , n − 1} such that the statistical properties of {x1, . . . , xτ} differ from thatof {xτ+1, . . . , xn}, e.g., in mean or variance. In the case of multiple changes, a number of change pointsτi, i ∈ {1, . . . , m} are identified, that split the sequence of data into m + 1 segments.
The parameters of the change points distribution are estimated via maximum likelihood byminimising the following cost function:
55
Books
MDPI

J. Sens. Actuator Netw. 2017, 6, 32
m+1
∑i=1
[C(x(τi−1+1):τi)] + β f (m)
where C is a cost function for assuming a change point at τi in the time series data and β f (m) isa penalty function to avoid over fitting (i.e., too many change points).
For our sensor data, we focus on detecting the changes of mean in the sensor readings. A manualsetting is used for the penalty function so that the number of change points can be adjusted. The changepoints detection algorithm is the pruned exact linear time (PELT) [57] which is computationally efficientand provides an exact segmentation. By applying the change points detection algorithm upon there-sampled data, we obtain a sequence of 1s and 0s, where “1” represents the presence of a changepoint and “0” as absence. The implementation is based on the R package introduced in [58].
As an example, Figures 5 and 6 show the change points detected from the temperature andhumidity readings in the kitchen of Household 2. The change points are indicated by the verticalgrey lines.
Figure 5. Change points of temperature readings from a sensor box in the kitchen of Household 2.
Figure 6. Change points of humidity readings from a sensor box in the kitchen of Household 2.
5.1.4. Change Point Gaps
Change points detected in sensor signals indicate changes in the home environment, which maybe caused by human activities. While the time periods during which no change of sensor signal isdetected may on the other hand indicate the lasting of some activities. For instance, when the houseis asleep we can expect a long gap between changes that are detected in electricity consumption andbrightness in the house, i.e., from the time of going to bed to getting up, as shown in Figures 7 and 8.Therefore, the length of gaps between change points can also be a useful feature to identify occurrencesof activities. Given a sequence X = (x1, . . . , xn) where xi = 1 represents the presence of a change pointand xi = 0 represents the absence of a change point, the length of gaps between change points withrespect to xi is calculated as follows:
gap_cp(xi) =
{k − j if xi = 0,
0 otherwise.
56
Books
MDPI

J. Sens. Actuator Netw. 2017, 6, 32
where j < i < k, xj = xk = 1, ∀l ∈ {j + 1, . . . , k − 1} : xl = 0.In the experiment, we apply the above gap detection to the change points inferred from each type
of sensor reading.
Figure 7. Gaps between change points in the electricity readings from the CT clamp connected to theelectricity main of Household 3.
Figure 8. Gaps between change points in the brightness readings from the sensor box in the bedroomof Household 3.
Figure 7 shows big gaps between changes in the total energy consumption, indicated by the widthand height of the bars, detected between midnight and early morning every night. A similar andaligned pattern can be found in the brightness of the bedroom as shown in Figure 8.
In this section, we presented three kinds of features (mean-shift clustering, change points, and gapsbetween change points) that can be extracted from the sensor-generated data, which expands thenumber of data values in each observation by three times. That is, for Household 1, there are140 features extracted from the sensor readings of eight sensor boxes and six energy monitors;for Household 2, there are 123 features extracted from the sensor readings of seven sensor boxesand six energy monitors; and, for Household 3, there are 150 features extracted from the sensorreadings of nine sensor boxes and five energy monitors. After feature extraction, we truncate thefeature data points in the extended periods to match the time use diary. This reduces the number offeature data points from 685 to 576 for each type of sensor reading. The series of feature data points isat the frequency of one per 10 minutes.
57
Books
MDPI

J. Sens. Actuator Netw. 2017, 6, 32
5.2. Feature Selection
For different types of activities, some features are more relevant than the others. Given the size ofthe feature sets, it is intractable to evaluate all the possible subsets of the features. To this end, a featureselection process is necessary for finding a subset of features that can effectively describe the data whilereducing irrelevant or highly-correlated inputs [59]. In this work, we adopt the approach proposedin [32], which is based on the heuristic that takes into account the usefulness of individual features forpredicting the class labels along with their inter-correlations. A formalisation of the heuristic is givenby [60]:
MeritS =krc f√
k + k(k − 1)r f f
where MeritS represents the heuristic “merit” of a feature subset S containing k features, rc f is the meanfeature-class correlation ( f ∈ S), and r f f is the average feature-feature inter-correlation. The numeratorindicates how predicative of the class a group of features is, while the denominator indicates howmuch redundancy there is within the group.
Following the proposal in [32], the metric of symmetrical uncertainty [61] is used for calculatingfeature-feature and feature-class correlations. Symmetrical uncertainty is based on the concept ofinformation gain [62] while compensating for its bias towards attributes with more values andnormalising its values to the range from 0 to 1.
As an example, Figures 9 and 10 show the feature-feature correlations between the sensor readings(temperature and range) of the two sensor boxes installed in the kitchen of Household 1, and thefeature-class correlation between the sensor readings of electricity consumption and seven activitytypes in Household 3. The prefixes, MS_, CP_ and Gap_CP_, represent the feature extracted via themean shift clustering, the change points detection, and the gaps between the detected change points.We can see in Figure 9 that the features extracted from the temperature readings of the two sensor boxeshave much higher correlations than that of the features extracted from the range readings. That is, thetemperature readings from the two sensor boxes have high redundancy, and thus it is likely that thefeature selection algorithm will only keep one of them. In Figure 10, we can see that there is a strongcorrelation between the occurrences of laundry activity and the features based on the readings of theenergy monitor attached to the washing machine. Therefore, for recognising laundry activity, suchfeatures should be kept.
58
Books
MDPI

J. Sens. Actuator Netw. 2017, 6, 32
Figure 9. Correlations between the features of temperature and range readings from two sensor boxesinstalled in the kitchen of Household 1.
Figure 10. Correlations between the activities recorded by the occupant from Household 3 and thefeatures of electricity consumption.
In the experiment, we run the feature selection algorithm upon the data from each combinationof households and activities. The implementation is based on the python package scikit-feature [63].As a result, an “optimal” subset of features is returned per activity type per household. Since the featureselection algorithm is based on correlation rather than prediction results directly, their performance isnot guaranteed. Thus, we evaluate all the prefixes of the feature array returned by the feature selectionalgorithm in the task of activity recognition and find the best subset in terms of the agreement betweenthe recognition results and the time use diaries.
59
Books
MDPI

J. Sens. Actuator Netw. 2017, 6, 32
5.3. Recognition Method
Hidden Markov models (HMMs) have proven to be effective in modelling time series data [64].They are a good fit for recognising activities from sensor-generated data in the sense that they arecapable of recovering a series of latent states from a series of observations.
An HMM is a Markov model whose states are not directly observable but can be characterisedby a probability distribution over observable variables. In our case, the hidden states correspond tothe activities performed by the participant and the observations correspond to the sensor readings.There are two assumptions in HMMs, as illustrated in Figure 11. The first is that the hidden state yt
depends only on the previous hidden state yt−1. The second is that the observation xt depends on thehidden state yt.
· · · yt−1 yt yt+1 · · ·
xt−1 xt xt+1
Figure 11. Graphical representation of a Hidden Markov Model.
An HMM is specified using three probability distributions: (i) the initial state probabilitydistribution; (ii) the transition probability of moving from one hidden state to another; and (iii) theemission probability of a hidden state generating an observation. The parameters of these threeprobability distributions can be estimated by maximising the joint probability:
P(y, x) = P(y1)P(x1|y1)T
∏t=2
P(yt|yt−1)P(xt|yt)
For each type of activity in each household, we built HMMs using the feature sets selected by themethod presented in Section 5.2. We parameterize the HMMs with two hidden states (either an activityis occurring or not occurring) and multinomial emissions since input features are discrete values.When fitting HMMs to the data, we do not prescribe the labels for the hidden states. Thus, the activitylabels (indicting whether an activity is occurring or not) in the time use diaries are randomly assignedto the hidden states by HMM fitting algorithm. For each type of activity, we evaluate both possibleassignments of activity labels to the two hidden states of HMMs. This allows the HMMs to discoverthe patterns by itself rather than fitting models with unreliable labels from the time use diaries. In thisway, the application of HMM is unsupervised as the model is fitted only with sensor-generated data.
For each of the seven types of activity shown in Table 5, we fitted the HMMs n times with eachsubset of features returned by the feature selection algorithm explained in Section 5.2 using randomisedinitial states. The implementation is based on python hmmlearn [65]. Only the model with the highestagreement is considered as the one recognising the designated activities. Other HMMs with loweragreement may detect other non-relevant activities or not even activities. In this work, we use n = 1000which is manually tuned.
In the next section, we describe how to evaluate the agreement between HMM models and timeuse diaries, i.e., how sequences of hidden states returned by the HMMs are related to the sequences ofactivities recorded in the time use diary.
60
Books
MDPI

J. Sens. Actuator Netw. 2017, 6, 32
6. Agreement Evaluation
6.1. Evaluation Metric
In the previous section, we introduced the activity recognition framework. By fitting a HMMto the data generated by the sensors, sequences of hidden states can be extracted. In this sectionwe illustrate how to evaluate the agreement between state sequences generated by the HMMsand the activity sequences recorded in the time use diary, which provides a quantification ofinter-rater/observer reliability.
A time use diary may contain misreports in several ways. First, the start and end time of individualactivities may not be accurately recorded, i.e., either earlier or later than the actual occurrence. This iscalled time shifting. Secondly, there might be activities that occurred but were not recorded, which aremissing values. Pairwise comparison like precision and recall may exaggerate the dis-similarityintroduced by such noise. Thus, we need an agreement evaluation metric that is able to alleviatethe effect.
A suitable metric for this task is the Levenshtein distance (LD), a.k.a., edit distance [33] which hasbeen widely used for measuring the similarity between two sequences. It is defined as the minimumsum of weighted operations (insertions, deletions and substitutions) needed to transform one sequenceinto the other. Compared to the pair-wise evaluation framework upon sequence data, LD based methodcan deal with the aforementioned problems of misreports. However, it is more computation intense.
Formally, given two sequences s and q, the Levenshtein distance between these two sequencesDs,q(|s|, |q|) is defined by:
Ds,q(i, j) =
⎧⎪⎪⎪⎪⎪⎪⎪⎨⎪⎪⎪⎪⎪⎪⎪⎩
Di0 = ∑ik=1 wdel(sk) for 1 ≤ i ≤ |s|
D0j = ∑jk=1 wins(qk) for 1 ≤ j ≤ |q|
min
⎧⎪⎪⎨⎪⎪⎩Ds,q(i − 1, j) + wdel(si)
Ds,q(i, j − 1) + wins(qj)
Ds,q(i − 1, j − 1) + 1(si =qj)wsub(si, qj)
for 1 ≤ i ≤ |s|, 1 ≤ j ≤ |q|.
where 1(si =qj)is an indicator function that equals 0 when si = qj and equals 1 otherwise. The three lines
in the min bracket correspond to the three operations transforming s into q, i.e., deletion, insertion andsubstitution. wdel , wins and wsub are respectively the costs associated with the deletion, insertion andsubstitution operations.
The inputs to the function of Levenshtein distance, in our case, are two sequences of labels withrespect to a type of activity. One is generated by the HMMs and the other is the correspondingactivity labels recorded in the time use diary. The elements of both sequences are composed of twovalues: “0” indicating the absence of the activity and “1” indicating the presence of the activity. In ouragreement evaluation, we attempt to minimise the difference introduced by slight time shifting andmis-recording of activities. For these reasons, we set the costs of the three types of operations wdel , winsand wsub as follows. For substituting “1” with “0”, the cost is set to 0.7; for substituting “0” with “1”,the cost is set to 1.0. This gives less penalty to cases of false positive than to cases of false negative,i.e., the agreement is lower when the activities recorded in the time use diaries are not recognisedfrom the sensor data. The costs of inserting and deleting ‘0’ are set to 0.4. This is to reduce the penaltyintroduced by time shifting. We set the cost of inserting and deleting ‘1’ to 100 to disable these twooperations. The output is the minimum cost of the operations that are needed to transform predicatedsequences to the ones recorded in time use diaries and lower values indicate higher agreements. Theimplementation is based on the python package weighted-levenshtein [66].
The costs of deletion, insertion and substitution are used to differentiate their influence upon theperceived agreement. The absolute difference between these costs will be investigated in future work.
61
Books
MDPI

J. Sens. Actuator Netw. 2017, 6, 32
6.2. Results and Analysis
In this section we discuss the results from applying the aforementioned activity recognitionmethod to the collected data and compare them to the interview data of the corresponding households.Table 7 lists the set of features that achieves the best agreement in terms of the Levenshtein distance(LD) between the activity sequences generated by the HMMs and that recorded in the time use diary.
Table 7. Feature sets achieve best agreement with respect to the seven types of activities.
Household Activities Feature Sets LD
1
Sleeping (MS_light_living/dining-room,Gap_CP_light_bedroom) 11.9
Preparingmeal (MS_watts_total, MS_watts_microwave) 6.0
Making hotdrink (MS_watts_kitchen-appliances) 5.1
Eating (MS_watts_total) 17.0
Watching TV (MS_watts_TV) 16.6
Doinglaundry (MS_watts_washing-machine) 0.7
2
Sleeping (CP_light_kitchen(1), CP_light_bedroom,MS_temperature_living/dining-room(2)) 16.7
Preparingmeal (MS_watts_kitchen-appliances) 11.2
Making hotdrink (MS_sound_kitchen(1)) 11.6
Eating (MS_watts_kitchen-appliances,MS_range_living/dining-room(2)) 11.0
Watching TV (MS_watts_TV) 4.8
Listening toradio
(CP_range_hallway, MS_watts_kitchen-appliances,MS_range_bedroom) 37.3
Doinglaundry
(CP_watts_total, CP_watts_kitchen-appliances,CP_watts_washing-machine) 12.1
3
Sleeping (Gap_CP_range_living-room) 5.9
Preparingmeal (MS_range_kitchen(2), MS_watts_PC) 26.1
Making hotdrink
(CP_humidity_second-utility,CP_temperature_kitchen(2),
CP_humidity_bedroom)1.7
Eating (MS_range_kitchen(2),CP_temperature_dining-room/study(1)) 16.0
Listening toradio (MS_sound_living-room) 37.2
Doinglaundry
(MS_watts_washing-machine,CP_watts_washing-machine) 2.6
For the sleeping activity of Household 3, the best agreement is achieved by the feature capturingthe gaps between the changes of movements in the living room. According to the interview data,we know that the living room is the geographical centre of the house, i.e., the passage to transit betweenkitchen, dining/study area and the sleeping area. The occupant keeps busy at home and spends a lotof time in the dining/study area and the living area.
62
Books
MDPI

J. Sens. Actuator Netw. 2017, 6, 32
For the activity of making hot drink, the feature identifying humidity changes in the utility roomand bedroom of Household 3 is contained in the subset of features that achieves the best agreement.A further investigation of the time use diary shows that when making coffee in the kitchen in themornings the occupant shaves in the bathroom which is located next to the utility room and bedroom.The humidity change in this case is very likely caused by the humid bathroom.
The overlaps between the subsets of features that achieve the best agreement in recognisingactivities of preparing meal and eating show the close relation between the two types of activities.This demonstrates that sensor insensitive activities may be recognised via sensor readings from theircausal/correlated activities. In this case, the recognition of preparing meal can help recognise eating.
For the laundry activity, since we have an energy monitor attached to the washing machineof each household, it is expected that using the features capturing the energy consumption of thewashing machine would achieves the best agreement. However, for Household 2, the feature subsetthat achieves the best agreement also contains the changes of the energy consumption of the kitchenappliances as well as that of the total energy consumption. A further investigation of the time usediary shows that when doing laundry the occupant quite often cooks or makes coffee around the sametime. However, among the three households, the agreement between the HMM and the time use diaryfor laundry activity in Household 2 is the lowest, which may indicate the possibility of misreport orthat the reported laundry activities involve other elements, such as sorting, hanging out, folding, etc.
Among the seven types of activities, listening to radio has the lowest agreement (the largest valuein LD) between the detection from the sensor-generated data and the records in the time use diaries.In case of Household 2, the time use diary tells us that the occupant listens to radio in the bedroomwhile getting up, in the kitchen while preparing meals and in the dining area when having meals.Similarly, the occupant in Household 3 listens to radio in the kitchen when preparing meal and in theliving room when relaxing. In both cases, the occupant is using more than one device for listening toradio in more than one place.
For illustration, we plot the comparison of each type of activity detected from the sensor dataand that recorded in the time use diaries (Figures 12–18). In each figure, the upper part shows thestate sequences generated by an HMM using the specific set of features, and the lower part shows theactivity sequences recorded in the time use diary (TUD). The black bins represent the time slices whena particular activity is detected/recorded.
Figure 12. Recognising the activity of preparing meal in Household 1 with feature set (MS_watts_total,MS_watts_microwave).
63
Books
MDPI

J. Sens. Actuator Netw. 2017, 6, 32
Figure 13. Recognising the activity of making hot drink in Household 1 with feature set(MS_watts_kitchen-appliances).
Figure 14. Recognising the activity of eating in Household 2 with feature set(MS_watts_kitchen-appliances, MS_range_living/dining-room(2)).
Figure 15. Recognising the activity of listening to radio in Household 2 with feature set(CP_range_hallway, MS_watts_kitchen-appliances, MS_range_bedroom).
Figure 16. Recognising the activity of watching TV in Household 2 with feature set (MS_watts_TV).
64
Books
MDPI

J. Sens. Actuator Netw. 2017, 6, 32
Figure 17. Recognising the activity of doing laundry in Household 3 with feature set(MS_watts_washing-machine, CP_watts_washing-machine).
Figure 18. Recognising the activity of sleeping in Household 3 with feature set(Gap_CP_range_living-room).
The activity durations generated by the HMMs mostly overlap with those recorded in the time usediary, with some local shifts along the time line. The only exception in these seven plots is the activityof listening to radio in Household 2, which suggests that the features being used are not sufficientenough to distinguish the occurrences of such activities. In some cases, radio is used as background,which does not necessarily constitute the activity of listening to the radio.
7. Conclusions
In this paper, we presented a mixed-methods approach for recognising activities at home.In particular, we proposed a metric for evaluating the agreement between the predicted activities frommodels trained by the sensor data and the activities recorded in a time use diary. We also investigatedways of extracting and selecting features from sensor-generated data for activity recognition.
The focus of this work is not on improving the recognition performance of particular models butto present a framework for quantifying how activity recognition models trained by sensor-generateddata can be evaluated on the basis of their agreement with activities recorded in time use diaries.We demonstrate the usefulness of this framework by an experiment involving three trial households.The evaluation results can provide evidence about which types of sensors are more effective fordetecting certain types of activities in a household. This may further help researchers in understandingthe occupant’s daily activities and the contexts in which certain activities occur. The agreement betweenthe sensor-generated data and the time use diary may also help to validate the quality of the diary.
This is an on-going research, investigating the use of digital sensors for social research,using household practices as a testbed. As this is written, we are in the process of collecting data fromthree types of households: single occupant, families with children and ≥2 adults. There are severaldirections to consider for extending this work. We are adding a wearable wristband sensor to thesetting to detect the proximity of participants to each sensor box via Bluetooth RSSI (received signalstrength indicator). Such data will give us a more accurate reading of presence and co-presence ofparticular occupants in different parts of their home, while also helping us in obtaining more accuratestart and end times of certain activities. We will continue to investigate other activity recognitionmethods and feature selection techniques. In addition, we are interested in employing post and
65
Books
MDPI

J. Sens. Actuator Netw. 2017, 6, 32
assisted labelling mechanisms, for example, by asking participants to assign an agreement score tothe activity sequences generated by our activity recognition models. In this way, another layer ofagreement can be added to the evaluation.
Acknowledgments: The authors thank William Headley for the design and manufacture of the sensor box (alsoknown as desk egg). The work was carried out as part of the “HomeSense: digital sensors for social research”project funded by the Economic and Social Research Council (grant ES/N011589/1) through the National Centrefor Research Methods.
Author Contributions: All authors participated in refining the initial study. Jie Jiang and Riccardo Pozzadesigned the experiments; Jie Jiang performed the experiments and analysed the data; and Kristrún Gunnarsdóttirorchestrated the fieldwork and contributed materials. All authors discussed enhancements, results andimplications, wrote the manuscript and commented on it at all stages.
Conflicts of Interest: The authors declare no conflict of interest. The founding sponsors had no role in the designof the study; in the collection, analyses, or interpretation of data; in the writing of the manuscript, and in thedecision to publish the results.
References
1. Ruppanner, L. Contemporary Family Issues; Oxford University Press: Oxford, UK, 2015.2. Atkinson, R.; Jacobs, K. House, Home and Society; Palgrave: London, UK, 2016.3. Gattshall, M.L.; Shoup, J.A.; Marshall, J.A.; Crane, L.A.; Estabrooks, P.A. Validation of a survey instrument
to assess home environments for physical activity and healthy eating in overweight children. Int. J. Behav.Nutr. Phys. Act. 2008, 5, 1–13.
4. Williams, S.J.; Coveney, C.; Meadows, R. ‘M-apping’ sleep? Trends and transformations in the digital age.Sociol. Health Illn. 2015, 37, 1039–1054.
5. López, D.; Sánchez-Criado, T. Analysing Hands-on-Tech Care Work in Telecare Installations.Frictional Encounters with Gerontechnological Designs. In Aging and the Digital Life Course; Prendergast, D.,Garattini, C., Eds.; Berghahn: New York, NY, USA, 2015; Chapter 9.
6. Mort, M.; Roberts, C.; Callen, B. Ageing with telecare: care or coercion in austerity? Sociol. Health Illn.2013, 35, 799–812.
7. Sullivan, O.; Gershuny, J. Change in Spousal Human Capital and Housework: A Longitudinal Analysis.Eur. Sociol. Rev. 2016, 32, 864–880.
8. Pierce, J.; Schiano, D.J.; Paulos, E. Home, Habits, and Energy: Examining Domestic Interactions andEnergy Consumption. In Proceedings of the SIGCHI Conference on Human Factors in Computing SystemsCHI ’10, Atlanta, GA, USA, 10–15 April 2010; pp. 1985–1994.
9. Shannon-Baker, P. Making Paradigms Meaningful in Mixed Methods Research. J. Mixed Methods Res.2016, 10, 319–334.
10. Ganong, L.; Coleman, M. Qualitative research on family relationships. J. Soc. Person. Relatsh.2014, 31, 451–459.
11. British Social Attitudes Survey (33rd ed.). Available online: http://www.bsa.natcen.ac.uk/latest-report/british-social-attitudes-33/introduction.aspx (accessed on 30 March 2017).
12. Office for National Statistic (UK). Available online: https://www.ons.gov.uk/ (accessed on 30 March 2017).13. Chenu, A.; Lesnard, L. Time Use Surveys: A Review of their Aims, Methods, and Results. Eur. J. Sociol.
2006, 47, 335–359.14. Gershuny, J.; Harms, T.A. Housework Now Takes Much Less Time: 85 Years of US Rural Women’s Time
Use. Soc. Forces 2016, 95, 503–524.15. European Communities. Harmonised European Time Use Surveys: 2008 Guidelines; Eurostat Methodologies
and Working Papers; Population and social conditions; European Communities: Luxembourg, 2009.16. Kelly, P.; Thomas, E.; Doherty, A.; Harms, T.; Burke, O.; Gershuny, J.; Foster, C. Developing a Method to
Test the Validity of 24 Hour Time Use Diaries Using Wearable Cameras: A Feasibility Pilot. PLOS ONE2015, 10, 1–15.
17. Benmansour, A.; Bouchachia, A.; Feham, M. Multioccupant Activity Recognition in Pervasive Smart HomeEnvironments. ACM Comput. Surv. 2015, 48, 34:1–34:36.
18. Poppe, R. A survey on vision-based human action recognition. Image Vis. Comput. 2010, 28, 976–990.
66
Books
MDPI

J. Sens. Actuator Netw. 2017, 6, 32
19. Lara, O.D.; Labrador, M.A. A Survey on Human Activity Recognition using Wearable Sensors.IEEE Commun. Surv. Tutor. 2013, 15, 1192–1209.
20. Shoaib, M.; Bosch, S.; Incel, O.D.; Scholten, H.; Havinga, P.J. A Survey of Online Activity RecognitionUsing Mobile Phones. Sensors 2015, 15, 2059–2085.
21. Amft, O.; Tröster, G. Recognition of dietary activity events using on-body sensors. Artif. Intell. Med.2008, 42, 121–136.
22. Wang, J.; Zhang, Z.; Li, B.; Lee, S.; Sherratt, R.S. An enhanced fall detection system for elderly personmonitoring using consumer home networks. IEEE Trans. Consum. Electron. 2014, 60, 23–29.
23. Lin, Z.H.; Fu, L.C. Multi-user Preference Model and Service Provision in a Smart Home Environment.In Proceedings of the 2007 IEEE International Conference on Automation Science and Engineering,Scottsdale, AZ, USA, 22–25 September 2007; pp. 759–764.
24. van Kasteren, T.L.M.; Englebienne, G.; Kröse, B.J.A. Human Activity Recognition from Wireless SensorNetwork Data: Benchmark and Software. In Activity Recognition in Pervasive Intelligent Environments;Chen, L.; Nugent, C.D.; Biswas, J.; Hoey, J., Eds.; Atlantics Press: Amsterdam, The Netherland, 2011; pp. 165–186.
25. Hsu, K.C.; Chiang, Y.T.; Lin, G.Y.; Lu, C.H.; Hsu, J.Y.J.; Fu, L.C., Strategies for Inference Mechanism ofConditional Random Fields for Multiple-Resident Activity Recognition in a Smart Home. In Trends inApplied Intelligent Systems, Proceedings of the 23rd International Conference on Industrial Engineering and OtherApplications of Applied Intelligent Systems, Cordoba, Spain, 1–4 June 2010; García-Pedrajas, N., Herrera, F.,Fyfe, C., Benítez, J.M., Ali, M., Eds.; Springer: Berlin/Heidelberg, Germany, 2010; pp. 417–426.
26. Fan, X.; Zhang, H.; Leung, C.; Miao, C. Comparative study of machine learning algorithms for activityrecognition with data sequence in home-like environment. In Proceedings of the 2016 IEEE InternationalConference on Multisensor Fusion and Integration for Intelligent Systems (MFI), Baden-Baden, Germany,19–21 September 2016, pp. 168–173.
27. Cook, D.J.; Crandall, A.; Singla, G.; Thomas, B. Detection of Social Interaction in Smart Spaces. Cybern. Syst.2010, 41, 90–104.
28. Silverman, D. Interpreting Qualitative Data: Methods for Analyzing Talk, Text and Interaction, 3rd ed.;SAGE Publications: Thousand Oaks, CA, USA, 2006.
29. Wang, L.; Gu, T.; Tao, X.; Chen, H.; Lu, J. Recognizing multi-user activities using wearable sensors ina smart home. Pervasive Mob. Comput. 2011, 7, 287 – 298.
30. Cheng, Y. Mean Shift, Mode Seeking, and Clustering. IEEE Trans. Pattern Anal. Mach. Intell.1995, 17, 790–799.
31. Picard, D. Testing and estimating change-points in time series. Adv. Appl. Probab. 1985, 17, 841 – 867.32. Hall, M.A.; Smith, L.A. Feature Selection for Machine Learning: Comparing a Correlation-Based Filter
Approach to the Wrapper. In Proceedings of the Twelfth International Florida Artificial Intelligence ResearchSociety Conference, San Francisco, CA, USA, 1–5 May 1999; AAAI Press: Palo Alto, CA, USA, 1999; pp. 235–239.
33. Levenshtein, V.I. Binary codes capable of correcting deletions, insertions, and reversals.Cybern. Control Theory 1966, 10, 707–710.
34. Jiang, J.; Pozza, R.; Gunnarsdóttir, K.; Gilbert, N.; Moessner, K. Recognising Activities at Home: Digital andHuman Sensors. In Proceedings of the International Conference on Future Networks and DistributedSystems ICFNDS ’17, Cambridge, UK, 19–20 July 2017; ACM: New York, NY, USA, 2017; pp. 17:1–17:11.
35. Cook, D.J.; Youngblood, M.; Heierman, E.O.; Gopalratnam, K.; Rao, S.; Litvin, A.; Khawaja, F. MavHome:An agent-based smart home. In Proceedings of the First IEEE International Conference on PervasiveComputing and Communications, Fort Worth, TX, USA, 23–26 March 2003; pp. 521–524.
36. Cook, D.J.; Schmitter-edgecombe, M.; Crandall, A.; Sanders, C.; Thomas, B. Collecting and DisseminatingSmart Home Sensor Data in the CASAS Project. In Proceedings of the CHI Workshop on DevelopingShared Home Behavior Datasets to Advance HCI and Ubiquitous Computing Research, Boston, MA, USA,4–9 April 2009.
37. Singla, G.; Cook, D.J.; Schmitter-Edgecombe, M. Recognizing independent and joint activities amongmultiple residents in smart environments. J. Ambient Intell. Humaniz. Comput. 2010, 1, 57–63.
38. Chiang, Y.T.; Hsu, K.C.; Lu, C.H.; Fu, L.C.; Hsu, J.Y.J. Interaction models for multiple-resident activityrecognition in a smart home. In Proceedings of the 2010 IEEE/RSJ International Conference on IntelligentRobots and Systems, Taipei, Taiwan, 18–22 October 2010; pp. 3753–3758.
67
Books
MDPI

J. Sens. Actuator Netw. 2017, 6, 32
39. Fatima, I.; Fahim, M.; Lee, Y.K.; Lee, S. A Unified Framework for Activity Recognition-Based BehaviorAnalysis and Action Prediction in Smart Homes. Sensors 2013, 13, 2682–2699.
40. Fang, H.; He, L.; Si, H.; Liu, P.; Xie, X. Human activity recognition based on feature selection in smarthome using back-propagation algorithm. ISA Trans. 2014, 53, 1629–1638.
41. Krishnan, N.C.; Cook, D.J. Activity Recognition on Streaming Sensor Data. Pervasive Mob. Comput.2014, 10, 138–154.
42. Dawadi, P.N.; Cook, D.J.; Schmitter-Edgecombe, M. Modeling Patterns of Activities Using Activity Curves.Pervasive Mob. Comput. 2016, 28, 51–68.
43. Alemdar, H.; Ertan, H.; Incel, O.D.; Ersoy, C. ARAS human activity datasets in multiple homes withmultiple residents. In Proceedings of the 2013 7th International Conference on Pervasive ComputingTechnologies for Healthcare and Workshops, Venice, Italy, 5–8 May 2013; pp. 232–235.
44. Prossegger, M.; Bouchachia, A., Multi-resident Activity Recognition Using Incremental Decision Trees.In Proceedings of the Third International Conference ICAIS 2014 Adaptive and Intelligent Systems,Bournemouth, UK, 8–10 September 2014; Bouchachia, A., Ed.; Springer: Cham, Switzerland, 2014;pp. 182–191.
45. Kröse, B.; Kasteren, T.V.; Gibson, C.; Dool, T.V.D. Care: Context awareness in residences for elderly.In Proceedings of the Conference of the International Society for Gerontechnology, Pisa, Italy,21–25 June 2008.
46. van Kasteren, T.; Noulas, A.; Englebienne, G.; Kröse, B. Accurate Activity Recognition in a Home Setting.In Proceedings of the 10th International Conference on Ubiquitous Computing UbiComp ’08, Seoul, Korea,21–24 September 2008; pp. 1–9.
47. Nez, F.J.O.; Englebienne, G.; de Toledo, P.; van Kasteren, T.; Sanchis, A.; Kröse, B. In-Home ActivityRecognition: Bayesian Inference for Hidden Markov Models. IEEE Pervasive Comput. 2014, 13, 67–75.
48. Singh, D.; Merdivan, E.; Psychoula, I.; Kropf, J.; Hanke, S.; Geist, M.; Holzinger, A. Human ActivityRecognition Using Recurrent Neural Networks. In Machine Learning and Knowledge Extraction: First IFIPTC 5, WG 8.4, 8.9, 12.9, Proceedings of the International Cross-Domain Conference, CD-MAKE 2017, Reggio,Italy, 29 August–1 September 2017; Holzinger, A.; Kieseberg, P., Tjoa, A.M., Weippl, E., Eds.; Springer:Berlin, Germany, 2017; pp. 267–274.
49. Laput, G.; Zhang, Y.; Harrison, C. Synthetic Sensors: Towards General-Purpose Sensing. In Proceedings ofthe 2017 CHI Conference on Human Factors in Computing Systems, Denver, CO, USA, 6–11 May 2017;ACM: New York, NY, USA, 2017; pp. 3986–3999.
50. Seeeduino Arch-Pro. Available online: https://developer.mbed.org/platforms/Seeeduino-Arch-Pro(accessed on 30 March 2017).
51. SparkFun Humidity and Temperature Sensor Breakout—HTU21D. Available online: https://www.sparkfun.com/products/retired/12064 (accessed on 30 March 2017).
52. SparkFun RGB and Gesture Sensor—APDS-9960. Available online: https://www.sparkfun.com/products/12787 (accessed on 30 March 2017).
53. Pololu Carrier with Sharp GP2Y0A60SZLF Analog Distance Sensor. Available online: https://www.pololu.com/product/2474 (accessed on 30 March 2017).
54. SparkFun MEMS Microphone Breakout—INMP401 (ADMP401). Available online: https://www.sparkfun.com/products/9868 (accessed on 30 March 2017).
55. Current Cost—Individual Appliance Monitor (IAM). Available online: http://www.currentcost.com/product-iams.html (accessed on 30 March 2017).
56. Pedregosa, F.; Varoquaux, G.; Gramfort, A.; Michel, V.; Thirion, B.; Grisel, O.; Blondel, M.; Prettenhofer, P.;Weiss, R.; Dubourg, V.; et al. Scikit-learn: Machine learning in Python. J. Mach. Learn. Res. 2011, 12, 2825–2830.
57. Killick, R.; Fearnhead, P.; Eckley, I.A. Optimal Detection of Changepoints with a Linear Computational Cost.J. Am. Stat. Assoc. 2012, 107, 1590–1598.
58. Killick, R.; Eckley, I.A. Changepoint: An R package for changepoint analysis. J. Stat. Softw. 2014, 58, 1–19.59. Guyon, I.; Elisseeff, A. An Introduction to Variable and Feature Selection. J. Mach. Learn. Res. 2003, 3, 1157–1182.60. Ghiselli, E.E. Theory of Psychological Measurement; McGraw-Hill: New York, NY, USA, 1964.61. Press, W.H.; Flannery, B.P.; Teukolski, S.A.; Vetterling, W.T. Numerical Recipes in C; Cambridge University
Press: Cambridge, UK, 1988.62. Quinlan, J.R. Programs for Machine Learning; Morgan Kaufmann: Burlington, MA, USA, 1993.
68
Books
MDPI

J. Sens. Actuator Netw. 2017, 6, 32
63. Li, J.; Cheng, K.; Wang, S.; Morstatter, F.; Trevino, R.P.; Tang, J.; Liu, H. Feature Selection: A DataPerspective. arXiv 2016, arXiv:1601.07996.
64. Zucchini, W.; MacDonald, I.L. Hidden Markov Models for Time Series: An Introduction Using R; CRC Press:Boca Raton, FL, USA, 2009.
65. Hmmlearn. Available online: http://hmmlearn.readthedocs.io/ (accessed on 30 March 2017)66. Weighted-Levenshtein. Available online: http://weighted-levenshtein.readthedocs.io/ (accessed on
30 March 2017)
© 2017 by the authors. Licensee MDPI, Basel, Switzerland. This article is an open accessarticle distributed under the terms and conditions of the Creative Commons Attribution(CC BY) license (http://creativecommons.org/licenses/by/4.0/).
69
Books
MDPI

Journal of
Actuator NetworksSensor and
Article
Wearable-Based Human Activity Recognition Usingan IoT Approach
Diego Castro *, William Coral , Camilo Rodriguez, Jose Cabra and Julian Colorado
Department of Electronics, School of Engineering, Pontificia Universidad Javeriana,Cr. 7 No. 40-62 Bldg. Jose Gabriel Maldonado, Bogota 110111, Colombia; [email protected] (W.C.);[email protected] (C.R.); [email protected] (J.S.); [email protected] (J.C.)* Correspondence: [email protected]
Received: 30 September 2017 ; Accepted: 17 November 2017; Published: 24 November 2017
Abstract: This paper presents a novel system based on the Internet of Things (IoT) to Human ActivityRecognition (HAR) by monitoring vital signs remotely. We use machine learning algorithms todetermine the activity done within four pre-established categories (lie, sit, walk and jog). Meanwhile,it is able to give feedback during and after the activity is performed, using a remote monitoringcomponent with remote visualization and programmable alarms. This system was successfullyimplemented with a 95.83% success ratio.
Keywords: e-health; human activity recognition (HAR); Internet of Things (IoT); rule tree classifier;C4.5; Bayesian classifier
1. Introduction
The Internet of Things, IoT, is a new concept in which all sensing objects can be connected tothe internet to have remote and constant access to its measurements (data). This access allows fortaking action in a faster way, with better results and much more data involved [1,2]. The data thatcompose these kinds of systems can go from temperature [3], outdoor location [4], indoor location[5], storage stock, humidity or other industry related variables [6]. In short, any sensor that can beconnected to the Internet makes part of an IoT paradigm [7].
In such a way, classical applications of pervasive computing can be upgraded to an IoT schemefor an activity recognition application: Human Activity Recognition (HAR). These applications,in their classical approach, have been researched, evaluated and developed to the point that severalcommonly available products have HAR systems built in. This can be seen on some fitness trackers,references [8,9], which have HAR systems built into the mobile applications of their manufacturer.These applications usually register and analyze daily and sleep activity [10]. The HAR system consistsof sensing the person’s positioning and movement, performing a feature extraction and a classificationof those features to decide which activity was performed in a pre-selected list of activities [11–13].The HAR systems have several methods to perform recognition, the most common one being anartificial vision assisted system [14,15]. This kind recognition can be seen in commercial productssuch as the Microsoft KinectTM [16]. Despite the many benefits and high popularity, in both usabilityand research, of vision assisted HAR, it presents several disadvantages for subjects such as accuracy,coverage and cost. Another method that can overcome these challenges are on-body sensors systemsor wearable assisted HAR [17]. This kind of approach relies on wearable sensors present throughoutthe body, which help to perform the recognition [18]. This method can either require that the subjectwear one [19,20] or more [21] for pre-established periods of time. Some systems even require thatthe device(s) have to be permanently worn by the person [22]. These devices could be those withinanother device such as a smartphone [23,24].
J. Sens. Actuator Netw. 2017, 6, 28 70 www.mdpi.com/journal/jsan
Books
MDPI

J. Sens. Actuator Netw. 2017, 6, 28
In this paper, we present a more detailed and novel version of an HAR-IoT system that employs asingle device with occasional usage, as seen in [20] presented at the International Conference on FutureNetworks and Distributed Systems (ICFNDS) 2017. This system is intended to be used by patientswith chronic heart diseases, patients that have their health status in a non-critical condition but stillneed constant monitoring. The presented system focuses on the daily routine, activity and physicaltherapy that each patient must have as part of their recuperation process. Although an IoT approachneeds a security analysis [25,26], our approach to the IoT does not rely on a wireless sensor network(WSN) [27], the data information is not sensitive to outside listeners [28] and, as previously stated,the focus of the paper is to validate the presented approach to HAR-IoT systems.
The HAR-IoT system uses a specialized hardware for vital signs monitoring including embeddedheart, respiration and body acceleration sensors. The activity recognition was implemented usinga classifier that uses the information gathered by this hardware. Two different methods wereimplemented for the classifiers: Bayes [29] and C4.5 [30]. An (IoT) cloud based component wasintegrated [31,32] to perform different tasks, such as: remote consultation [33], feedback and therapycontrol for both duration and quality [34] or even an online classification service [35]. This componentalso grants remote access to the data and configurable alerts for the activity done, if needed. This paperpresents a novel interaction between a traditional HAR system and an IoT system with a differentapproach to the classical feature extraction in an HAR system, which resulted in a 95.83% success ratiowith a notable small training data set.
This work will be presented as follows: in Section 2, the system architecture is explained andcomplemented with the system description in Section 3. Section 4 focuses on explaining the featureextraction method and the classifier information. The experiments and results are presented inSection 5, and, finally, the conclusions are shown in Section 6.
2. System Architecture
The proposed system is composed of two main modules: a traditional HAR system that can beimplemented on any mobile and non-mobile device, and an e-health application of any recognition orsurveillance system used in a health care related subject. These modules work independently, but thenovelty of the approach lays with the increase of availability and decrease response times.
2.1. HAR Systems
An HAR system is a specific application of pattern recognition and expert systems.This recognition works in two phases: a training phase and a recognition phase. Although bothhave similar steps, the training phase has a priori information of the activities done and the recognitionphase uses the knowledge of the training phase to have accurate recognition. This means that therecognition phase is highly dependent on the training phase success.
2.1.1. Learning/Training Phase
The learning or training phase is the first phase of any recognition algorithm. This phase isin charge of establishing the relations between the data and the activities. It has three main steps(Figure 1):
1. Data collection: The data collection step conducts the data acquisition from all the sensorsavailable for the system. The sensor available will be dependent on the kind of device that therecognition is built for. This step needs an activity log of every activity performed detailing thetime, the type and duration. The training phase must consider all possible activities, needing allto be performed, preferably, in an aleatory manner without a correlation in activity, duration orany other factor that might be involved in the recognition. It is important to note that the datacollection is done without any signal processing as all processing and analysis is done during thefeature extraction step.
71
Books
MDPI

J. Sens. Actuator Netw. 2017, 6, 28
2. Feature extraction: The feature extraction step has several possibilities depending on the kindof sensors and variables types that are involved during the data collection step. There canbe structural features and statistical features. The structural features are those that try to findinterrelation or correlation between the signals. This also means that the signal can fit a previouslydefined mathematical function to the current state of the variables. The statistical feature extractionperforms a transformation on the signal using statistical information. These features could bethe mean of the signal, standard deviation, correlation, etc. The most common transformationsperformed are the Fourier and Wavelet transforms. During this step, it is common to performsignal processing to eliminate noise, reduce the range of the signal or perform other kinds ofprocessing to better extract the relevant features for each activity.
3. Learning: The learning or the final step of the training phase is the development of a recognitionmodel that is learned from the data set, the activity log and the relevant features to properlyrecognize any activity. This step is highly dependent on the training data set, which is the reasonfor the strict methodology and rigorous logging on the data collection step. There are manyrecognition models that can go from a rule tree based on signal parameters, neural networks,statistical base algorithms or fuzzy logic, each one having their advantages and disadvantages.Based on the complexity, response time and available resources, the model must be selected tobest fit the system demands.
Figure 1. Learning process of an HAR system.
2.1.2. Recognition Phase
The recognition phase is the final phase of an HAR system. It does the recognition of the activityperformed using the training phase result. The recognition phase has three main steps (Figure 2):
1. Data collection: The data collection step does the data acquisition of all the sensors available forthe recognition. The sensor available will be dependent on the kind of device that the recognitionis built for. Unlike the learning phase, there is not any prior knowledge of the activities performed,so there is no need, either choice, to have an activity log. It is important to note that the datacollection is done without any signal processing, as all processing and analysis is done during thefeature extraction step.
2. Feature extraction: The feature extraction step has several possibilities according to the kindof sensors and variable types that are involved during the data collection step. There can bestructural features and statistical features. The structural features are those that try to findinterrelation or correlation between the signals. This also means that the signal can fit a previouslydefined mathematical function to the current state of the variables. The statistical feature performstransformation on the signal using statistical information. This could be using the mean of thesignal, standard deviation, correlation, etc. The most common transformations performed are
72
Books
MDPI

J. Sens. Actuator Netw. 2017, 6, 28
the Fourier and Wavelet transforms. During this step, it is common to perform signal processingto eliminate noise, reduce the range of the signal or perform other kinds of processing to betterextract the relevant features for each activity.
3. Recognition: The recognition or the final step of the training phase is the inference of the activityperformed using the gathered data and extracted features on the previous steps using therecognition model of the training phase. This step decides which of the possible activitieswere done with a percentage of accuracy, which depends on the recognition model. This stepis the most time-consuming part of any HAR system and, according to the selected model andavailable resources, this time and accuracy change.
Figure 2. Recognition process of an HAR system.
2.2. E-Health Applications
An IoT solution gathers information from the available sensors, people and/or electronic devices.If the data source, application, user or place of implementation are related to the healthcare industry,it is called an e-health solution. These kinds of applications provide a novel approach to thehealthcare system, which bring new and better services such as constant monitoring of patientsand remote consultation services. All of these services provide a faster and reliable healthcare industrywith almost zero waiting time, changing the classical approach of the healthcare system from a reactiveservice to a preemptive industry.
In this project, the main focus is to improve the healthcare services that take care of patients forwhich their health status is not in a critical condition, but they still need constant monitoring. To betterunderstand the proposed solution, it is necessary to discuss and understand the general scheme ofa remote patient service, especially home remote patient monitoring. The general architecture of aremote patient service (Figure 3) includes a variety of sensor and/or medical devices to measurerelevant variables of the patient that include but are not limited to:
• Heart Rate.• Respiration rate.• Weight.• Oxygen saturation.• Posture.
73
Books
MDPI

J. Sens. Actuator Netw. 2017, 6, 28
Figure 3. Basic scheme in an e-health system.
According to the signal properties and signal availability, the data is transmitted via the Internetto a database. Inside the database, the data can be constantly analyzed, displayed or even take action,usually in the form of alarms, to give a better healthcare service. The constant availability of thedata implies a full time monitoring of the relevant data of the patient, which makes it easier to detectan abnormality on the patient. This also means that the medical record of the patient gets a hugeamount of data, opening the possibility of performing a more integral and objective medical diagnosis.This will reduce the cost service, improve the recuperation time and will improve the efficiency on thehealthcare system overall.
The lower cost service is associated with the fact that the patient will assume the high expensesrelated to it, accommodation and infrastructure related costs. There is also a reduction in staffing cost,as the remote monitoring implicates that the qualified personnel for the care services does not need to bepresent at the patient location, and one person can be in charge of the tracking of more than one patientat a time, with the help of the data analytics of the system. In addition, at their homes, the patient’srecuperation process can be accelerated, as a remote care service greatly minimizes the exposure of thepatient to others’ diseases, comparing this scenario to a classical hospitalization environment.
Having the patient data in real time will improve any treatment, as the adjustments of the quantity,methodology and other factors of the treatment can be adjusted in the same manner. This follows aparadigm to change from a situational response to a situation prevention and avoid high risk scenarios.This real-time management allows the procedures to be simpler and more efficient. Consequently,there will be great improvement on the quality of life of patients undergoing remote monitoringservices, with stress levels lowering because of their home accommodation rather than in a hospital.The implemented solution will be described in further sections.
3. System Description
The goal of this prototype is to implement an HAR-IoT system, which needs to be able tomeasure physiological variables, have an HAR component that works according to the sensordata, and implement a cloud system for data storage and remote display. Intelligent alarms canbe programmed according to different levels following the hospital requirements.
74
Books
MDPI

J. Sens. Actuator Netw. 2017, 6, 28
The system’s block diagram is composed of three main elements (wearable, the smartphoneapplication and the cloud ). This diagram is shown in Figure 4:
• Wearable: The selected wearable is the Bioharness (Zaphyr, Annapolis, Maryland, US).This wearable is capable of measuring several physiological variables (for more information,see Section 3.1) and connect to a smartphone via Bluetooth.
• Smartphone application: This application has three main components. The data reception thathandles the communication and storage of the raw sensor data of the wearable. The HARclassifier, which recognizes the kind of movement done at that moment using the raw sensordata, a classifier algorithm and a machine learning process. Furthermore, a local visualization isresponsible for displaying raw sensor data and the activity recognized.
• Cloud: The cloud component receives all the raw data of the wearable and the activities recognizedby the HAR classifier. All the data is stored and can be consulted online using a web browser.
Figure 4. Solution architecture.
75
Books
MDPI

J. Sens. Actuator Netw. 2017, 6, 28
3.1. Hardware Component
The selected wearable device (Figure 5) was the ZephyrTM Bioharness 3 model K113045.This is a device that measures physiological variables [36]. It can measure heart rate, heart ratevariability, and respiratory rate, it has a built-in accelerometer for posture and several activity analysis.These sensors are embedded on an elastic band that must be worn at chest height and pressuredagainst the skin. The strap design allows it to be used under regular clothes, at any given place such asthe work place, home and/or health centers.
Figure 5. ZephyrTM Bioharness reference K113045.
The Bioharness 3 has a special characteristic that allows the device to not require the use ofelectrolytic gel nor any adhesive material for its proper operation, unlike other skin-contact devices.The device has an internal storage in which all the physiological data is saved as it performsmeasurements. When the Bioharness 3 connects via Bluetooth (class 1) to another device, it sends thestorage data to the device. If the Bioharness 3 is connected while performing measurements, the datasent is the last measurement done. The strap of the Bioharness is washable and the plastic where allthe sensors are can be submerged up to 1 m under water. Table 1 contains the detailed information asprovided by the manufacturer.
Table 1. Bioharness 3 specifications.
Parameter Value
HR Range: 25–240 BPMBR Range: 4–70 BPM
Acc. Range: ±16 gBattery type: Rechargeable Lithium PolymerBattery Life: 26 h per charge
3.2. Software Component
The software components of the system have two separate environments. The first is a smartphoneapplication to gather, analyze, locally visualize and send the data to the cloud and is implemented forAndroid devices. The other one is a cloud environment. This allows for remote visualization of theraw data and activity recognition, and can have several configurable alarms.
76
Books
MDPI

J. Sens. Actuator Netw. 2017, 6, 28
3.2.1. Smartphone Application
The gathering of data, analysis and patient local interface of the project was implemented ina smartphone application compatible with Android 4.1 or higher. This application, as seen in the blockdiagram (Figure 4), has the following main functions:
• Data reception: The application has to receive Bioharness information packages using Bluetoothprotocol. Then, the system has to discriminate the packages to get all the individualsensors’ information.
• HAR classifier: With the raw sensor data, the app uses a classifier algorithm to build a recognitionmodel to estimate the current activity.
• Local visualization: All the latest sensor data can be seen in the mobile screen, in conjunction withthe latest recognized activity.
Both the sensor’s raw data and the recognized activity is sent to the cloud system using eitherHTTP or Message Queue Telemetry Transport (MQTT) protocols.
3.2.2. Cloud
For the cloud environment, a platform called Ubidots was selected, which is a Colombian enterprisethat offers cloud services for IoT solutions. This is an integrated solution that covers all necessaryservices to successfully implement small to medium solutions at a low cost. The services include:data storage (up to 500.000 data points), remote visualization (several widgets), basic data manipulation(basic algebraic operations) and programmable email and Short Message Service SMS alarms.
This platform was used to visualize the history of the activities recognized, heart rate,respiration rate, posture and the acceleration values. The alarms were configured for heart rateand respiration having minimum and maximum levels alerts. The last alarm was configured fora maximum level of the peak acceleration (behavior that indicates a fall) (Figure 6).
Figure 6. Example of the data visualization on the cloud service.
77
Books
MDPI

J. Sens. Actuator Netw. 2017, 6, 28
4. HAR System
Having the data collected, the next step is to perform the activity recognition. To do this,we performed a two-phase recognition algorithm. The first step is the feature extraction, whichuses the raw data to create a set of features that are the input of the second phase: the classificationphase.
The classification phase can be either a training step (see Section 2.1) that generates the recognitionmodel or a recognition step that uses the recognition model and the extracted features to determinethe activity performed.
4.1. Feature Extraction
The feature extraction is an algorithm that standardizes the raw data set, which reduces theamount of data to process. It performs analysis over the data set, such as structure detection,transformations or statistical functions. This allows the data to be organized in standard forms(mathematical functions) with an emphasis on how well the data explains these standard forms (fit).This process reduces the raw data to a finite and concrete set of aspects of the signal, which reducesthe complexity of the recognition model.
For each available sensor, there can be several features that can be extracted and, if not wellproposed, the classification problem can become an overdetermined system. To avoid an indeterminateproblem, there are several options to decrease the amount of features used in the classification. To selectthe features and reduction methods appropriate to the problem, it is first necessary to see which datais available. For this project, the available data is:
1. Heart Rate.2. Respiration Rate.3. Posture.4. Three-axis acceleration (X, Y,Z).5. Peak Acceleration.6. Electrocardiogram (ECG) magnitude.
In this case, most signals are time series measurements with low variability, meaning that themost appropriate feature extraction method is a structure detector without any prior processing [18].The only exception to this is the three-axis acceleration, as these kinds of signals are too fluctuatingand oscillatory to use a structure detection without pre-processing.
To decrease the unwanted behavior of the signal, two methods can be used: a principal componentanalysis (PCA) or a discrete cosine transform (DCT). Both extract the most relevant information of thesignal, and the PCA uses statistical procedures to get a set of linearly uncorrelated variables. On theother hand, DCT uses a only real domain Laplace transform to get the frequency components of thesignal. In this case and for this kind of signal, the best results are obtained using PCA over DCT [37].
The structure detection algorithm searches for the best fitting mathematical function for theselected data, a minimization of the mean square error between the data and the function (Equation (1)):
n
∑t=1
(Y(t)− Y(t))2 with Y(t) = f (Y(t)). (1)
The structural detectors, f (Y(t)), can be either lineal or nonlineal functions. These functionshave different parameters that describe the behavior of the function. Modifying these parameterallows for fitting each signal iteration to a structure with a unique set of parameters. These parametersbecome the features selected to perform the recognition. To avoid a high cost search in mathematicalstructures, a few structures were selected. This was done according to the usual behavior and range ofthe available signals. Table 2 presents the selected mathematical functions from which the algorithmwill try to fit the signals. This table also presents the different parameters that describe the functions,their restrictions, characteristics or formulas that define them.
78
Books
MDPI

J. Sens. Actuator Netw. 2017, 6, 28
Table 2. Attribute counting: value and probability.
Structure Formula Parameters
Linear: Constant f (Y(t)) = a a = 1n
n
∑t=1
Y(t)
Linear: line f (Y(t)) = a + b ∗ t a = Y − b ∗ t, b =
n
∑t=1
(t − t)(Y(t))− Y
n
∑t=1
(t − t)2
Y = 1n
n
∑t=1
Y(t), t =1n
n
∑t=1
t
Non-Linear: Exponential f (Y(t)) = a ∗ |b|t + c a, b, c ∈ �Non-Linear: Sine f (Y(t)) = a ∗ Sin(t + b) + c a ∈ �, b ∈ �, c = Y
Non-Linear: Triangle f (Y(t)) =
{a + b t ≤ ca + 2bc − bt c < t
a, b, c ∈ �
Non-Linear: Trapezoid f (Y(t)) =
⎧⎪⎨⎪⎩a + bt t ≤ ca + bc c < t ≤ d(a + bc + bd)− (bt) t > d
a, b, c, d ∈ �
The implemented algorithm that performs the feature extraction takes into account the currentdata set, the parameters of the structure with a priority on the less resource-consuming structures.The serial steps of this algorithm are:
1. Get the current data set.2. Iterate and execute the linear structural detectors.3. Calculate the mean square error for the best fitting lineal structures.4. If the error is high enough, iterate and execute the nonlineal detectors.5. Calculate the mean square error for the best fitting nonlineal structures.6. Select the structure with the lowest error.7. Pass the function parameters as the features to the classifier.
4.2. Classifier
There are several classifier algorithms that could work on an HAR system. The main kind ofclassifiers are:
• Rule trees: The rule tree, or decision tree is a hierarchy based model, in which all the features aremapped as nodes and each possible value for the feature is presented as a branch. These kindsof classifiers have a computational complexity of O(log(n)) , for n features. The most commondecision trees models are D3/4/5, CLS, ASSISTANT, CART and C4.5.
• Bayesian methods: The Bayesian methods use conditional probabilities to calculate the likelihoodof an event according to a set of features and their probabilities. The most common Bayesianmethods are the Bayesian network and the naive Bayes, the later one being a special case thatconsiders all features to be statistically independent of one another.
• Iteration based learning: The iteration based learning (IBL) are methods that learn the similaritiesand relations between features according to the training data set. These methods rely on highcomputational resources, large data sets and high storage capacities.
• Support vector machines: Support vector machines (SVM) have been widely used in HAR systems.They are based on several kernel functions that transform all the features to a higher degree spacegaining information and relations between the features and the activities.
• Artificial neural networks: The artificial neural networks, (ANN or NN), use a weighted networkto perform an analysis of the features and the activities performed. It imitates the neural synapseson biological brains to successfully recognize patters and models.
79
Books
MDPI

J. Sens. Actuator Netw. 2017, 6, 28
Following the requirements and constraints of the project, either IBL, SVN or ANN can be used,as the limited resources of the device in which the algorithm will be implemented prevent a successfulimplementation of these classifiers. Only a rule tree or Bayesian method could be implemented for thisproject. One algorithm of each kind of classifier was implemented in the mobile device to analyze theperformance and the best was implemented in the system.
4.2.1. Rule Tree Classifier
For the rule tree classifiers, the C4.5 algorithm was selected. This algorithm uses different sets ofrules according to the training data set, which divide the data set in different sections (gains) followingthe feature’s relation to the activity to be recognized (attribute).
In Figure 7, a small example of this algorithm can be seen. The decision branches are probabilitiesof the feature to be in a certain location, which are expressed as binary variables. This algorithm hasthe following process to generate the rule tree:
1. Root calculation: To select a starting point, root node selection, it uses the feature with the highestgain, as it covers the most possible cases with the first iteration.
2. New branch search: The branch selection is done for each new node. It looks at the differentfeatures that the node can interact with and evaluates the possibility to recognize an attribute.The highest probability is assigned as a branch.
3. New node selection: After the branch is assigned, the algorithm evaluates the new nodeprobability of attribute selection and selects a feature with the highest chance of attributerecognition.
4. Iteration: Iterate the steps 2 and 3 until the probability of attribute recognition is 1, which meansit is the end of a branch. With the end of the branch, a rule is produced and associated withthat attribute. If, after the iterations of all possible attributes a branch end has not been found,the starting node changes to the second highest gain.
5. Search through all attributes in the current node: Steps 2–4 are needed to be repeated until allattributes have a rule associated.
Figure 7. Example of the decision tree of a C4.5 Algorithm.
4.2.2. Bayesian Classifier
For the Bayesian classifier, a Naive Bayes algorithm was selected. This algorithm is based on theconditional probabilities of an activity being performed for each given set of features. It assumes thatall features are statistically independent from one another. The algorithm begins by counting andidentifying all the features available (attributes) and the activity to be recognized (classes). The rulesare generated by using the conditional probability of the attribute for a determined class. This is donefor all possible classes (Equation (2)):
P(C|x) = P(C)p(x|C)P(x)
. (2)
80
Books
MDPI

J. Sens. Actuator Netw. 2017, 6, 28
This means attributes times classes number of rules in a single problem. After all rules arecalculated, a conditional calculation of the rule for a given set of attributes and class is performed.It selects the higher probability rule to be assigned to the class (Figure 8).
Figure 8. Example of the probability tree of the Bayes algorithm.
4.2.3. Classifier Selection
To test each classifier performance, each classifier was implemented in the target device and waspresented with a single binary output problem. The problem consisted of a question: ¿Can I go out toplay?. To solve this, there were four features to evaluate it. Table 3 presents all attributes and the classwith the possible values.
Table 3. Classifier’s test problems.
Feature/Class Possible Values
Feature: Outlook Sunny: Overcast: RainFeature: Temperature Cool: Mild: Hot
Feature: Humidity Normal: HighFeature: Windy Strong: WeakClass: Outcome Play: No Play
The training data set consisted of 14 samples, with no statistical correlation between instances.With this, each algorithm generated its own set of rules. The resulting rule sets were five rules for aC4.5 algorithm (Figure 9) and 36 for the Naive Bayes algorithm (Figure 10).
As expected, the Naive Bayes algorithm has a much larger rule set because it combines all thefeatures, and then produces a rule with the probability obtained with the number of times found in thetraining set rule. The rule is maintained even when it does not provide useful information, unlike theC4.5 algorithm, which deletes them. The results of this test concluded that the C4.5 algorithm is thebest suited for this project. Because the proposed prototype will have 18 features, the rule set size of theNaive algorithm will be much larger than the one of the C4.5, implicating a less cost efficient algorithm.
81
Books
MDPI

J. Sens. Actuator Netw. 2017, 6, 28
Figure 9. The classifier’s test problem: C4.5 rule tree.
Figure 10. The classifier’s test problem: Naive Bayes decision tree.
5. Experiment and Results
This project presents an HAR-IoT system that uses an Food and Drug Administration (FDA)-certifiedstrap that measure several physiological variables, in conjunction with an Android application thathas a C4.5 classifier and PCA to improve the results and a cloud-based system for remote visualization
82
Books
MDPI

J. Sens. Actuator Netw. 2017, 6, 28
of the strap raw data and the classifier outcome. In this section, the experiment setup used to validatethe system will be described in addition to the results obtained after the experiment being successful.
5.1. Experiment Description
The experiment had two phases: Learning and Recognition. During the training phase, threedifferent test subjects (students with similar body types, age and weight) were performed severalphysical activities in a pre-established order (lie, sit, lie, walk, sit, jog, sit, jog and walk) while wearingthe Bioharness. Each activity needs to be performed for a time frame of four minutes without changingactivity or stopping. This time frames are divided in eight smaller frames that are called windows,which need to be at least 15 s long, as it is the minimum amount of time for the variable detection bythe Bioharness. These windows were selected to have twice the amount of time, which is a balancebetween the length of the activity and the amount of data gathered for each activity. During the wholelearning phase, the sensors acquire the data and the classifier generates the rules for the recognition.In addition, all data is available in the cloud to supervise the exercises in a remote location (if needed).
For the feature extraction, a single structure detector was selected: a straight line. This is due tothe convergence time, meaning that we obtained two features per signal, and this resulted in size of theresulting matrix being twice the number of signals, in the columns, and the number of time windows,in the rows. As this classifier works only with qualitative values, all probabilities were assigned aqualitative equivalent. Therefore, using the mean values of each feature, a qualitative value can beassigned. If the value is less than the mean, it is assigned as low and high, otherwise.
After the classifier generates the rules (recognition model), the recognition phase can start.During this phase, the prototype will extract, evaluate and detect the user activity based on therecognition model that was found during the learning phase. This phase does not have a time frameand can start or stop at any given time. Finally, for redundancy purposes, a text file with the datarecorded from each instance is created.
5.2. Learning Phase Results
The training data set was composed of 74 time windows (Figure 11). As the activities that requiremore energy could have changes with an exhaustion factor during a prolonged experiment, a recurrentrest was included to have the best and more consistent results (inclusion of sitting periods of timebetween walking and jogging activities). The learning phase ended with the following qualitativeassignments (Table 4).
Figure 11. Training data set: activity count.
83
Books
MDPI

J. Sens. Actuator Netw. 2017, 6, 28
Table 4. Qualitative assignment.
Feature # In Low Low Probability # In High High Probability
heart rate 1 62 0.837 12 0.162heart rate 2 4 0.054 70 0.945
respiratory rate 1 45 0.608 29 0.391respiratory rate 2 10 0.135 64 0.865
posture 1 17 0.230 57 0.770posture 2 1 0.013 73 0.986
acceleration peak 1 57 0.770 17 0.229acceleration peak 2 39 0.527 35 0.473amplitude ECG 1 58 0.783 16 0.216amplitude ECG 2 73 0.986 1 0.013acceleration X 1 3 0.040 71 0.959acceleration X 2 2 0.027 72 0.973acceleration Y 1 9 0.122 65 0.878acceleration Y 2 2 0.027 72 0.973acceleration Z 1 12 0.162 62 0.837acceleration Z 2 2 0.027 72 0.973
After the feature extraction phase, the algorithm proceeds generating the rule tree to that specifictraining data set (Figure 12). For this project, there were 13 rules in total having a single recognitionmodel for the different subjects that were involved during this phase (Table 5).
Figure 12. Final decision tree based on the C4.5 algorithm.
84
Books
MDPI

J. Sens. Actuator Netw. 2017, 6, 28
Table 5. Final rule set based on the C4.5 algorithm.
R# Condition Output
1 Post A=L; Y A=H Lie2 Post A=L; Y A=L Sit3 Post A=H; PAcc A=L; Z A=L Sit4 Post A=H; PAcc A=L; Z A= 1; Resp A, ECG A=L; Resp B=H; Y A=H; PAcc B=H Sit5 Pos A=H; PAcc A=L; Z A=1; Resp A=L; X A=H, ECG A=L; Resp B=H; Y A=H; PAcc B=L Sit6 Post A=H; PAcc A=L; Z A=1; Resp A=L; X A=H, ECG=L, Resp B=H, AccY A=L Walk7 Post A=H; PAcc A=L; Z A=H; Resp A=L, AccX=L; ECG A=L; Resp B=L Sit8 Post A=H; PAcc A=L; Z A=H; Resp A=L; X A=H, ECG A=H Sit9 Post A=H; PAcc A=L; Z A=H; Resp A=L; X A=L Jog
10 Post A=H; PAcc A=L; Z A=H; Resp A=H; Resp B=H Walk11 Post A=H; PAcc A=L; Z A=L; Resp A=H; Resp B=L Sit12 Post A=H; PAcc A=H; ECG B=L Jog13 Post A=H; PAcc A=H; ECG B=H Walk
During the implementation phase, one of the test subjects was randomly asked to perform a totalof 72 activity windows that were recollected. For these 72 windows, in 69 of them, the activity wassuccessfully recognized, with only three that were wrongly classified. The confusion matrix of thisimplementation is present in Table 6. Likewise, a time series displaying each activity done and itsactivity recognized can be seen in Figure 13 and the same data in Table 7.
Table 6. Offline confusion table.
Lie Sit Walk Jog Total Error C
Lie 16 0 0 0 16 0Sit 0 23 1 0 24 0.042
Walk 0 2 14 0 16 0.143Jog 0 0 0 16 16 0
Total 16 25 15 16 72Error O 0 0.08 0.066 0 0.0417
Table 7. Table of results of the implementation phase.
Min:Sec Activity Classified Score
0:00–4:00 Lie Lie True4:30–8:00 Sit Sit True
8:30–12:00 Lie Lie True12:30–13:00 Walk Sit False13:30–16:00 Walk Walk True16:30–20:00 Sit Sit True20:30–24:00 Jog Jog True
24:30 Sit Sit True25:00 Sit Walk False
25:30–28:00 Sit Sit True28:30–32:00 Jog Jog True32:30–36:00 Walk Walk True
85
Books
MDPI

J. Sens. Actuator Netw. 2017, 6, 28
Figure 13. Results of the implementation phase.
6. Conclusions
This project successfully developed and implemented a novel human activity recognition systemusing a smartphone, the Bioharness 3 and a cloud system. For feature extraction, we used structuralfunctions and, for pre-processing, a PCA algorithm was used. For the classifier, both the C4.5 andthe Naive Bayes rules were implemented on the target hardware, but the C4.5 was selected insteadof Naive Bayes due to the size of the rule set. The prototype in implementation phase got a scoreof 95.83% in the classification success. The project can be improved by adding more light-weightalgorithms, different structural functions and the usage of more features. As future work, we presentedthe following path that contributed to the improvement of the presented project:
1. The comparison between the performance using multiple different structural functions:having different structural functions can optimize the resource consumption and decreasingthe computational load of the classifier.
2. The broadening of the training data and robustness of the system: the system was implementedas a proof of concept of an HAR-IoT system, with a few users. These kinds of systems to beimplemented in a product or in a trial must be trained with a high amount of data sets, as therecognition models should be trained user-independently so the recognition works independentlyfrom the subject using it. With our system, the test subjects were students with similar bodytypes, ages and weights, which resulted in a functional system. For the later implementation,the system should have more training data. To improve the classification, another set of featuressuch as mean, variance or percentile could be used along with the features we used to have moreinformation. In addition, another recognition model could be used.
3. The implementation of the classifier on the cloud: The mayor constraint that the system presentis the limited hardware available for the classifier. If the cloud resources can be available toperform the classification, more complex and better algorithms can be integrated into the system.There could even be a classifier redundancy system in which both the local application and thecloud system perform classification.
Acknowledgments: This work was supported by the Pontificia Universidad Javeriana (PUJ) in Bogota,Colombia under the project framework Centro de Excelencia y Apropiacion en Internet de las Cosas (CEA-IoT).The authors would like acknowledge the cooperation of all partners within the CEA-IoT and also like to thankall the institutions that supported this work: the Colombian Ministry for the Information and CommunicationsTechnology (Ministerio de Tecnologias de la Informacion y las Comunicaciones—MinTIC) and the ColombianAdministrative Department of Science, Technology and Innovation (Departamento Administrativo de Ciencia,Tecnología e Innovacion—COLCIENCIAS) through the Fondo Nacional de Financiamiento para la Ciencia,la Tecnologia y la Innovacion Francisco José de Caldas (Project ID: FP44842-502-2015).
86
Books
MDPI

J. Sens. Actuator Netw. 2017, 6, 28
Author Contributions: Camilo Rodriguez implemented and tested the HAR application and classifiers,and Jose Cabra implemented the cloud and alarm system. Julian Colorado supervised the HAR implementationand testing. Diego Castro wrote, corrected and verified the publications and reports of the project. William Coralsupervised, verified, corrected and guided the writing and testing protocol.
Conflicts of Interest: The authors declare no conflict of interest. The founding sponsors had no role in the designof the study; in the collection, analyses, or interpretation of data; in the writing of the manuscript, and in thedecision to publish the results.
References
1. Gubbi, J.; Buyya, R.; Marusic, S.; Palaniswami, M. Internet of Things (IoT): A vision, architectural elements,and future directions. Future Gener. Comput. Syst. 2013, 29, 1645–1660.
2. Roncancio, G.; Espinosa, M.; Perez, M.R. Spectral Sensing Method in the Radio Cognitive Context for IoTApplications. In Proceedings of the 10th IEEE International Conference on Internet of Things (iThings 2017),Exeter, Devon, UK, 21–23 June 2017; pp. 1–6.
3. Cabra, J.; Castro, D.; Colorado, J.; Mendez, D.; Trujillo, L. An IoT approach for Wireless Sensor NetworksApplied to E-Health Environmental Monitoring. In Proceedings of the 10th IEEE International Conferenceon Internet of Things (iThings 2017), Exeter, Devon, UK, 21–23 June 2017; pp. 14–22.
4. Velasquez, N.; Medina, C.; Castro, D.; Acosta, J.C.; Mendez, D. Design and Development of an IoT SystemPrototype for Outdoor Tracking. In Proceedings of the International Conference on Future Networks andDistributed Systems—ICFNDS ’17, Cambridge, UK, 19–20 July 2017; pp. 1–6.
5. Teran, M.; Aranda, J.; Carrillo, H.; Mendez, D.; Parra, C. IoT-based System for Indoor Location usingBluetooth Low Energy. In Proceedings of the IEEE Colombian Conference on Communications andComputing (COLCOM2017), Cartagena, Colombia, 16–18 August 2017; IEEE Xplore Digital Library:Cartagena, Colombia, 2017.
6. Perera, C.; Liu, C.H.I.H.; Jayawardena, S.; Chen, M. A Survey on Internet of Things From Industrial MarketPerspective. IEEE Access 2014, 2, 1660–1679.
7. Ganz, F.; Barnaghi, P.; Carrez, F. Information Abstraction for Heterogeneous Real World Internet Data.IEEE Sens. J. 2013, 13, 3793–3805.
8. Fitbit. Heart Rate Tracker: Fitbit Charge 2TM. Available online: https://misfit.com/fitness-trackers/(accessed on 25 November 2017).
9. Misfit. Misfit: Fitness Trackers & Wearable Technology—Misfit.com. Available online: https://www.fitbit.com/home (accessed on 25 November 2017).
10. Liu, C.H. A Survey of Context-Aware Middleware Designs for Human Activity Recognition Communicationsa Survey of Context-Aware Middleware Designs for Human Activity Recognition. IEEE Commun. Mag.2014, 52, 24–31.
11. Sikder, F.; Sarkar, D. Log-sum distance measures and its application to human-activity monitoring andrecognition using data from motion sensors. IEEE Sens. J. 2017, 17, 4520–4533.
12. Wang, Z.; Wu, D.; Chen, J.; Ghoneim, A.; Hossain, M.A. Human Activity Recognition via Game-Theory-BasedFeature Selection. IEEE Sens. J. 2016, 16, 3198–3207.
13. Testoni, A.; Di Felice, M. A software architecture for generic human activity recognition from smartphonesensor data. In Proceedings of the 2017 IEEE International Workshop on Measurement and Networking(M&N), Naples, Italy, 27–29 September 2017; pp. 1–6.
14. Poppe, R. A survey on vision-based human action recognition. Image Vis. Comput. 2010, 28, 976–990.15. Mo, L.; Li, F.; Zhu, Y.; Huang, A. Human physical activity recognition based on computer vision with deep
learning model. In Proceedings of the IEEE Instrumentation and Measurement Technology Conference,Taipei, Taiwan, 23–26 May 2016.
16. Boufama, B. Trajectory-Based Human Activity Recognition from Videos. In Proceedings of the 3rdInternational Conference on Advanced Technologies for Signal and Image Processing—ATSIP’2017,Fez, Morocco, 22–24 May 2017; pp. 1–5.
17. Chetty, G.; White, M. Body sensor networks for human activity recognition. In Proceedings of the2016 3rd International Conference on Signal Processing and Integrated Networks (SPIN), Noida, India,11–12 February 2016; pp. 660–665.
87
Books
MDPI

J. Sens. Actuator Netw. 2017, 6, 28
18. Lara, O.D.; Labrador, M.A. A Survey on Human Activity Recognition using Wearable Sensors. IEEE Commun.Surv. Tutor. 2013, 15, 1192–1209.
19. Huang, H.; Member, S.; Li, X.; Member, S.; Sun, Y. A Triboelectric Motion Sensor in Wearable BodySensor Network for Human Activity Recognition. In Proceedings of the 2016 IEEE 38th AnnualInternational Conference of the Engineering in Medicine and Biology Society (EMBC), Orlando, FL, USA,16–20 August 2016; pp. 4889–4892.
20. Rodriguez, C.; Castro, D.M.; Coral, W.; Cabra, J.L.; Velasquez, N.; Colorado, J.; Mendez, D.; Trujillo, L.C.IoT system for Human Activity Recognition using BioHarness 3 and Smartphone. In Proceedings of theInternational Conference on Future Networks and Distributed Systems—ICFNDS ’17, Cambridge, UK,19–20 July 2017; pp. 1–7.
21. Yazdansepas, D.; Niazi, A.H.; Gay, J.L.; Maier, F.W.; Ramaswamy, L.; Rasheed, K.; Buman, M.P.A Multi-Featured Approach for Wearable Sensor-based Human Activity Recognition. In Proceedings of the2016 IEEE International Conference on Healthcare Informatics (ICHI), Chicago, IL, USA, 4–7 October 2016;pp. 423–431.
22. Koskimäki, H.; Siirtola, P. Adaptive model fusion for wearable sensors based human activity recognition.In Proceedings of the 2016 19th International Conference on Information Fusion (FUSION), Heidelberg,Germany, 5–8 July 2016; pp. 1709–1713.
23. Chen, Y.; Shen, C. Performance Analysis of Smartphone-Sensor Behavior for Human Activity Recognition.IEEE Access 2017, 5, 3095–3110.
24. Siirtola, P.; Röning, J. Recognizing human activities user-independently on smartphones based onaccelerometer data. Int. J. Interact. Multimedia Artif. Intell. 2012, 1, 4–12.
25. Suciu, G.; Suciu, V.; Martian, A.; Craciunescu, R.; Vulpe, A.; Marcu, I.; Halunga, S.; Fratu, O. Big data,internet of things and cloud convergence—An architecture for secure e-health applications. J. Med. Syst.2015, 39, 141.
26. Perez, A.J.; Zeadally, S.; Jabeur, N. Investigating Security for Ubiquitous Sensor Networks.Procedia Comput. Sci. 2017, 109, 737–744.
27. Tomic, I.; McCann, J.A. A Survey of Potential Security Issues in Existing Wireless Sensor Network Protocols.IEEE Internet Things J. 2017, 4662, 1.
28. Barakovic, S.; Kurtovic, E.; Bozanovic, O.; Mirojevic, A.; Ljevakovic, S.; Jokic, A.; Peranovic, M.; Husic, J.B.Security issues in wireless networks: An overview. In Proceedings of the 2016 XI International Symposiumon Telecommunications (BIHTEL), Sarajevo, Bosnia and Herzegovina, 24–26 October 2016; pp. 1–6.
29. Rodrigues, L.M.; Mestria, M. Classification methods based on bayes and neural networks for human activityrecognition. In Proceedings of the 12th International Conference on Natural Computation, Fuzzy Systemsand Knowledge Discovery (ICNC-FSKD), Changsha, China, 13–15 August 2016; pp. 1141–1146.
30. Nazábal, A.; García-Moreno, P.; Artés-Rodríguez, A.; Ghahramani, Z. Human Activity Recognition byCombining a Small Number of Classifiers. IEEE J. Biomed. Health Inform. 2016, 20, 1342–1351.
31. Postma-Nilsenová, M.; Postma, E.; Tates, K. Automatic detection of confusion in elderly users of a web-basedhealth instruction video. Telemed. J. E-Health 2015, 21, 514–519.
32. Armentia, A.; Gangoiti, U.; Priego, R.; Estévez, E.; Marcos, M. Flexibility support for homecare applicationsbased on models and multi-agent technology. Sensors 2015, 15, 31939–31964.
33. Alkmim, M.B.; Marcolino, M.S.; Figueira, R.M.; Sousa, L.; Nunes, M.S.; Cardoso, C.S.; Ribeiro, A.L.Factors Associated with the Use of a Teleconsultation System in Brazilian Primary Care. Telemed. J. E-Health2015, 21, 473–483.
34. Sankaranarayanan, J.; Murante, L.J.; Moffett, L.M. A retrospective evaluation of remote pharmacistinterventions in a telepharmacy service model using a conceptual framework. Telemed. J. E-Health 2014,20, 893–901.
35. Sun, X.; Kashima, H.; Ueda, N. Large-scale personalized human activity recognition using online multitasklearning. IEEE Trans. Knowl. Data Eng. 2013, 25, 2551–2563.
88
Books
MDPI

J. Sens. Actuator Netw. 2017, 6, 28
36. Johnstone, J.A.; Ford, P.A.; Hughes, G.; Watson, T.; Mitchell, A.C.S.; Garrett, A.T. Field Based Reliabilityand Validity of the BioharnessTM Multivariable Monitoring Device. 2012. Available online: https://www.zephyranywhere.com/system/overview (accessed on 1 September 2017).
37. He, Z.; Jin, L. Activity recognition from acceleration data based on discrete consine transformand SVM. In Proceedings of the IEEE International Conference on Systems, Man and Cybernetics,San Antonio, TX, USA, 11–14 October 2009; pp. 5041–5044.
c© 2017 by the authors. Licensee MDPI, Basel, Switzerland. This article is an open accessarticle distributed under the terms and conditions of the Creative Commons Attribution(CC BY) license (http://creativecommons.org/licenses/by/4.0/).
89
Books
MDPI

Journal of
Actuator NetworksSensor and
Article
Extended Batches Petri Nets Based System for RoadTraffic Management in WSNs †
Youness Riouali , Laila Benhlima and Slimane Bah
AMIPS, Mohammadia School of Engineers, Mohammed V University of Rabat, Rabat 10000, Morocco;[email protected] (L.B.); [email protected] (S.B.)* Correspondence: [email protected]† This paper is an extended version of our paper published in Riouali, Y.; Benhlima, L.; Bah, S. Toward a
Global WSN-Based System to manage road traffic. In Proceedings of the International Conference on FutureNetworks and Distributed Systems, Cambridge, UK, 19–20 July 2017.
Received: 1 October 2017; Accepted: 28 November 2017; Published: 4 December 2017
Abstract: One of the most critical issues in modern cities is transportation management. Issues thatare encountered in this regard, such as traffic congestion, high accidents rates and air pollution etc.,have pushed the use of Intelligent Transportation System (ITS) technologies in order to facilitate thetraffic management. Seen in this perspective, this paper brings forward a road traffic managementsystem based on wireless sensor networks; it introduces the functional and deployment architectureof the system and focuses on the analysis component that uses a new extension of batches Petrinets for modeling road traffic flow. A real world implementation of visualization and data analysiscomponents were carried out.
Keywords: road traffic modelling; petri net; architecture; wireless sensor networks (WSN); trafficcongestion; traffic management; traffic monitoring
1. Introduction
The continous development in highly integrated microelectronics technologies and Informationand Communication technology (ICT) have made the wireless sensor networks (WSNs) concept a reality.WSNs, that feature high flexibililty, good scalability and reliability, are emerging as one of the mostpromising solutions to sense, collect, process and disseminate information from various environmentalphenomena. WSN has been widely utilized in various fields including transportation [1], environmentalmonitoring [2], healthcare [3], battlefield monitoring and surveillance [4], inventory tracking [5],security monitoring [6], civil applications [7,8], and so on. It consists of tiny wireless-capablesensor devices that are battery powered, sense the surrounding environment and have wirelesscommunication, data storage, computation and signal processing capabilities. The data collected fromsensor devices is usually sent to a centralized node called sink (or base station) that can act as userinterfaces or gateway with other networks [9].
Nowadays, the concept of modern city has emerged to be complex systems that, on one handinvest in human and social capital and in deployment of advanced information and communicationtechnologies, and yet, on the other hand, demand huge quantities of resources and discharge wasteinto environment [10]; although cities cover only 2.8% of Earth’s surface area, they consume 75% of itsglobal resource and produce an equivalent proportion of waste and pollution that leads to a massivenegative impacts [11,12].
The world population has continued to grow rapidly and its concentration in cities keeps risingat an ever-faster pace. It has been projected that the total population in urban areas will jump from3.6 billion to 6.3 billion by 2050, which means approximatively 67% of the world population. This mass
J. Sens. Actuator Netw. 2017, 6, 30 90 www.mdpi.com/journal/jsan
Books
MDPI

J. Sens. Actuator Netw. 2017, 6, 30
urbanization is bringing with it an inescapable tide of issues such as environment pollution, trafficcongestion, energy consumption and inefficient transport systems.
Strictly linked to transportation, one of the most critical issues in modern cities is transportationmanagement. Issues such as traffic congestion and high accidents rate affects environment, economiesand human health [13], have pushed the use of Intelligent Transportation System (ITS) technologiesin order to facilitate the traffic management or planning to do so in the coming years especiallyin developing countries [14].
The use of WSNs in Intelligent Transportation System applications such as traffic monitoring andtraffic light control has been experiencing a rapid growth [15,16].
Traffic road modeling is a crucial element in traffic management [17,18]. It grows unceasinglyclear and has attracted considerable attention of both academic researchers and industry practitioners.There are various criteria for categorizing traffic flow models, according to the level of detail, whetherthey operate in continuous or discrete time (or even event-based), or whether they are deterministic orstochastic [19–21].
Based on the level of detail provided to describe traffic and also the mathematical formulas, Trafficflow can be analyzed macroscopically, microscopically or mesoscopically [22,23]:
Macroscopic models deal with traffic at a high aggregate level. For example, the traffic variablesare represented using aggregated characteristics as density, flow rate and velocity.
Microscopic models are based on the explicit consideration of the interactions between individualvehicles within a traffic stream.
Mesoscopic models or kinetic models: The traffic flow is described at an intermediate level ofdetail. The family of mesoscopic models describes the behavior of individuals in aggregate termsfor instance in probability distributions. Thus, traffic is modeled as groups of traffic entities that aregoverned by flow laws without taking into consideration interactions between individual vehicles.
Petri nets modelling have been approached to study traffic flow at the macroscopic level and wehave adopted them as a basis to model the road traffic flow [24].
Petri net are suitable to represent urban traffic systems because they allow representation ofstates that are distributed, deterministic, concurrent and continuous, and can model shared resources,synchronous and asynchronous communications etc. Moreover, Petri net is a useful formalism foroptimizing traffic control and management system. Batch Petri net is an extension of Petri nets; it hasbeen introduced for modelling systems with discrete evolution, continuous evolution and accumulationphenomena. Batch petri nets are proven to be efficient and accurate representation of systems withaccumulated continuous elements [25,26]. However, they aren’t able to express accurately all rulesand situations in traffic applications such as traffic that has to stop when approaching an intersectionand give way rules. We have proposed in [24] an extension of Batch Petri nets that generalize thetraffic flow modelling, enable the representation of some complex cases and address the issue ofimproving energy efficiency in road network monitoring since it involves the minimum number ofsensors to capture traffic flow and simulate its evolution over time. To exploit this modelling formanaging the traffic dynamicity, we have designed a global system based on wireless sensor networksfor achieving energy efficiency during traffic flow monitoring and providing an accurate traffic stateestimate and prediction of the overall network. In this paper, we present an overview of the systemwith its functional architecture and a description of the flow in case of a chosen scenario.
This article is an extended and revised version of our earlier conference paper [27].The main addition with regard to the conference paper consists in presenting an enhancedarchitecture of WSN-based traffic management system, and containing additional details about thedeveloped prototype.
The rest of the paper is organized as follow. In Section 2, the related works are reviewed.Our solution, WSN-based traffic management system with its functional architecture and componentsare described in Sections 3 and 4 highlights the data analysis component of the proposed WSNbased traffic management including the used model for road traffic flow evolution. Details for the
91
Books
MDPI

J. Sens. Actuator Netw. 2017, 6, 30
deployment architecture as well as prototype of the system analytics and visualization components arereported in Section 5. Section 6 concludes the paper along with description of the intended future work.
2. Related Work
In [28], a scheme that uses a multi-hop replay wireless sensor network (WSN) to monitor urbantransport vehicles has been presented and a traffic monitoring system based on WSN that is applicableto all types of city environment was designed. The nodes are distributed dynamically based on thetraffic flow forecasts and their statistical law of mobility in order to monitor the important roadsthat are easily blocked and find out the time changing law of traffic congestion, and then put focuson monitoring them. The paper proposed the use of gray model in order to forecast the traffic flow.Gray model is simple and doesn’t require a huge amount of available data like many other methods.However, one of its disadvantages is that it cannot deal with non-linear structure of data whichdecreases its efficiency and competitiveness in forecasting road traffic flow on complex networks.
A wireless sensor network based monitoring system has been proposed in [29] with dynamicmathematical model for managing road traffic in important intersections of a city. It aims at reducingcongestion by broadcasting the traffic status when it comes to a congested status. Monitoring andcalculating the congestion level on the most important intersections is not always a relieable approachsince too many cars on intersections is only one reason of traffic congestion. Other causes such asdouble parking and events that may change traffic dynamics at any place within roads are not takinginto consideration.
Nafi et al. [30] presents a Vehicular Ad-hoc Network (VANET) based predictive road trafficmanagement system (PRTMS). PRTMS is simple and uses a modified linear prediction algorithmto estimate traffic intensities at different intersections using a vehicle to infrastructure (V2I) scheme.However, the proposed system architecture, which relies mainly on information received from vehiclesand V2I communications requires a significant power resources.
In [31], A traffic congestion detection system was presented that combines vehicle-to-vehicle(V2V), vehicle to infrastructure and infrastructure-to-infrastructure (I2I) connectivity and big data.The system aims at decreasing travel time and reducing CO2 emissions by allowing drivers to identifytraffic jam and change accordingly their routes. The proposed system monitors, processes and storeslarge amounts of data into a Cassandra table which is one of the open-source distributed NoSQLdatabases. Through a series of algorithms, a big data cluster identifies vehicular congestion andinforms drivers so that they can make real time decisions and avoid it. A weakness of this work isthat the system cannot answer queries. For instance, it cannot evaluate the impact of upcoming eventssuch as road works on traffic flow state.
Iwasaki et al. [32] proposed a method for stop line detection using thermal images taken withinfrared cameras under different weather conditions. According to the first method, the windshieldof a vehicle and its surroundings are used as the target of pattern recognition. The vehicle detectionprocess involves spatio-temporal image processing by computing standard deviations of pixel values,vehicle pattern recognition by using Viola-Jones detector [33,34] that considers the windshield and itssurroundings as the target of pattern recognition, and correction procedures for misrecognized vehicles.
Since the vehicle detection accuracy decreases in low temperatures because the temperature ofthe windshield is usually similar to that of the windshield exterior, Iwasaki et al. proposed a secondmethod, to deal with this limitation, that detects vehicles based on tire thermal energy reflection areaon the road surface. The method is based on the idea that the temperature difference between the tiresand the road surface is considerably high in cold weather. By combining both methods, the overallvehicle detection accuracy was highly maintained under various environmental conditions and anautomatic traffic flow monitoring was achieved by computing the number of vehicles in the targetarea and the degree of movement of each vehicle.
Another approach proposed in [35] uses vehicles as mobile sensors for sensing the urban trafficand send the reports to a traffic-monitoring center (TMC) for traffic estimation. The so-called probe
92
Books
MDPI

J. Sens. Actuator Netw. 2017, 6, 30
vehicles (PVs), i.e., taxis and buses that are equipped with the necessary devices to transmit trafficconditions to the TMC at regular time intervals, and floating cars (FCs), such as patrol cars forsurveillance, report periodically their speed and location to traffic-monitoring center.
Since PVs cannot cover all roads in most of the time, a Matrix Completion (MC) has beenproposed to reconstruct data in empty rows in the collected probe data. In order to facilitate MC basedestimation and improve its performance, Du et al. proposed a floating car control algorithms. However,the proposed approach doesn’t take into account different sources of traffic data and correlation ofroad sections.
Based on the previous studies and literature reviews, the challenge of designing a monitoringenergy-efficiency system while ensuring the accuracy of traffic flow estimation and predictionremains open.
The system we propose aims at enabling energy-efficient management and providing accurateestimation and prediction of road traffic by:
• Modelling the traffic in order to predict its evolution in accordance with deploying of the minimumnumber of sensors.
• Estimating vehicles dispatched in a road intersection using statistical models• Taking into account events for predicting traffic status
3. WSN-Based Traffic Management System (WTMS)
In this section we present functional architecture of our management system. The system takesadvantage of WSNs technology, traffic modelling and data learning approaches for dealing withtraffic-related challenges and leading to more efficient and safer travels. Before turning to thisdiscussion we introduce an overview of the system.
3.1. Overview of the WTMS
The proposed road traffic management system aims to monitor the road network and proactivelyprovide information about traffic flow. It takes input from various sources, mainly road sensors,and internet to ingest weather and events information such as national celebrations, sportive events(soccer games etc.). Data afforded from vehicles, especially neighboring traffic flow and average speed,can be included in the system’s input in order to refine better the output and the final model, and thenmodel the road network and the traffic flow dynamics spatially as well as temporally, and yield to anoverall traffic flow of road network.
This allows the cars, buses, taxis to respond to the city’s needs on the fly.Raw data always goes through at least one filter before being delivered to models and estimation
algorithms. The output of these models is used in various applications such as adaptive trafficsignal control and dynamic route guidance and is sent to third parties for consumption or analysis.Consequently, reliable information can be shareable with the public over internet. For instance,the road users can be informed of the traffic congestion and real time traffic situations throughmobile applications.
In the following section we briefly describe the WTMS through its components.
3.2. WTMS Architecture
Our WSN-based Traffic Management System is composed of several components which are:Data Acquisition, Data Preprocessing, Data analysis, Visualization and Reports, System Settings andAdministration, Traffic data repositories and finally Applications. All these components use DataCommunication component. Figure 1 illustrates the functional architecture of the system. In the next,we describe each component.
93
Books
MDPI

J. Sens. Actuator Netw. 2017, 6, 30
Figure 1. Traffic management system (WTMS) architecture.
3.2.1. Acquisition Component
Data acquisition consists of gathering the raw data and passing it to data preprocessing component.The data can be acquired in different formats and it draws from heterogeneous sources. This componenthas to ingest all needed information that will be sent to the other components in a unified format. Dataacquisition contains two subcomponents:
Real-time raw data feeds
Real time data feeds are collected through sensors. This data includes traffic volume, averagespeed, roadway conditions. This part of system has to deal with two approaches of data acquisition:
• Pull-based approach: it allows users to selectively acquire and query the data at preferred pointin time, within a specific time interval or within a user-defined frequency acquisition.
• Push-based approach: In this approach, data acquisition is executed in regular periods. Data aredisseminated proactively through sensors, i.e., the sensors can decide when to send data to acentre node such as a sink.
Adding to roadside sensors, other sources of data can be taken into consideration such as vehicles,especially regarding the movement count estimates, and traffic.
Data unification
Data unification means the integration of data culled from raw sensor data and a variety of otherstructured of unstructred sources such as scheduled events, weather information, road works etc. andthe representation of this heterogeneous data in the same unified format.
3.2.2. Data Preprocessing
This component is responsible for the preparation of raw data for further utilisation and providingthe cleaned data; the collected data must undergo a preprocessing step where it must be checked,filtered and completed in order to avoid as much noise as possible and being usable by models. Datapreprocessing includes:
Data filtering and refining
Data in real-world contain redundant information. Data filtering and refining is the process ofcleaning data by filtering duplications, data that contradicts itself and noise and ensuring data integrity.This is essential for obtaining consistent modeling results.
94
Books
MDPI

J. Sens. Actuator Netw. 2017, 6, 30
Data imputation and validation
Due to sensors malfunction, measurements can be erroneous, missed or corrupted. Therefore,some preliminary tasks need to be performed for effeciently analyzing the data such as data imputationand data validation. In this step, imputing missing values and examining data quality and reliabilityare performed.
3.2.3. Data Analysis
Data analysis aims at turning recieved data into information that guides effective decision makingthrough estimating the current traffic state and traffic flow dynamics evolution over time and space.To this end, Data analysis has two aspects: offline machine learning for knowledge discovery andruntime compenents for applying the knowledge during the execution.
Offline machine learning includes:
Models training
This component carries out the necessary machine learning tools to train models based on new data.
Models
It consists of mathematical equations and parameters that are trained and calibrated, but areimproved using additional knowledge.
The runtime part is composed of road traffic state estimation and road traffic state prediction:
Road traffic state estimation
It is the most mandatory component of the system since it transforms multisource traffic datainto useful traffic information and provides the basis for additional application and practices. In thissubcomponent, we use the generalized nondeterministic batch Petri net formalism to model the roadtraffic for each segment in one hand. In another hand, the necessary models, when needed, aredeployed and executed.
Road traffic state prediction
Given historical information, or driving correlation and dependencies among the road network,this module is performing short and long-term predictions using models that were built offline. We aimat predicting traffic flow from few minutes to several hours ahead.
3.2.4. Visualization and Reports
The output of models can be used for further analysis. Converting models results into well-formedforms for analysis, visualization or end-user information is a real benefit from data analysis component.This can simply enhance decision making. In addition, analyzed data and reports can help traffic plannerto make well-informed decisions and interact fast to different traffic situations and evaluate or designtransportation facilities. Or on another side, it can enhance the individual traffic participants’ navigation.
Visualization applications refer to a web-based tool that provides a holistic view of the overallroad network while displaying the emergency events as well such as congestion. Reporting and Queryrefers to tools that offers traffic reports for advising travelers and traffic managers and planners andallows users to interactively query up-to-date information. Management UI is a set of user interfacesfor that enables traffic planners and managers to set up traffic and roads parameters such as roadlength, maximum velocity and traffic signal cycle lengths and to enhance their interventions throughbroadcasting notifications and alerts to travelers.
95
Books
MDPI

J. Sens. Actuator Netw. 2017, 6, 30
3.2.5. System Settings and Administration
System settings and administration component handles prepares the sensor infrastructure, it allowsconfiguration of sensor data, that are needed for applications, and intervals. It allows displaying andmodifying all configurations. This includes security policies, user roles and database administration.
3.2.6. Traffic Data Repositories
It supports the storing of raw traffic data and archiving of historical data for use as needed.The stored data concerns the data aggregated from sensors, the necessary data structure for modelling thetraffic flow, the historical data to train the machine learning or statistical models to achieve prediction, etc.
3.2.7. Communication and Data Exchange
This allows the network to communicate the traffic information and exchange data between itsvarious components.
In the next section we will focus on the data analysis component and more precisely on generalizednondeterministic batch Petri net model that we adopt for this system.
4. Road Traffic State Estimation
Road traffic flow is a very complex phenomenon. To approach its dynamic evolution we proposedthe generalized nondeterministic batch Petri net [24] since it deals with both continuous and discretestates that characterize traffic flow and allows modeling its behavior along roads for complex cases.
4.1. Background on Triangular Batches Petri Net
In this section, we introduce Petri nets concepts and the theoretical background of our extensionof batches Petri nets model.
4.1.1. Petri Nets
In his PhD Thesis, Carl Adam Petri introduced Petri nets in order to represent the global state ofa system as composed of a set of local states [36]. Petri nets are both a graphical and mathematicaltool for design, modeling and formal analysis of various discrete event systems [37]. Being a graphicaltool, it allows to easily represent the different interactions in a complex system such as concurrency,parallelism, synchronization, non-determinism, communication, alternatives and so on by means ofonly few elements types. Being a mathematical tool, it allows to fomally model these interactions andanalyze the properties of the modeled system [38].
A Petri net can be defined as a directed graph that consists of two types of nodes interpreted asplaces and transitions where an arc can only connect two nodes of different types [39]. Places are drawnas round shapes (circles or eclipses) to model different states of a system. Transitions are depicted asrectangular shapes (rectangles or bars) to represent events or activities that can cause the change ofa system state. An arc connects a place to a transition or vice versa, it models the flow of processesthrough the system and the abstract relationship between a place and a transition. The dynamicbehavior of a system is introduced by means of tokens into places where every place holds either zeroor more tokens that are graphically appear as solid dots in places. At any given time, the distributionof tokens among the places, termed Petri net marking, determines the current state of the modeledsystem. A marked Petri net consequently is used to study dynamic behavior of the modeled system.
Formally, a Petri net is quadruplet N = (P, T, Pre, Post) where:
– P and T are, respectively, disjoint non-empty finite sets of places and transitions;– Pre: P × T → N is the backward incidence matrix, Post: T × P → N is the forward
incidence matrix.
96
Books
MDPI

J. Sens. Actuator Netw. 2017, 6, 30
Over the years, several extensions of the original Petri net model have been developed, wemention in the following paragraph some of them in order to better understand the proposed modelin this paper.
4.1.2. Generalized Batch Petri Nets
Hybrid Petri nets (HPN) contain two parts: a discrete part and a continuous part since theyinclude discrete and continuous places and transitions. For instance, in traffic system, traffic lights aremodeled as discrete places and transitions and road sections can be modeled by continuous places ascan be illustrated in Figure 2.
Figure 2 shows an example of signalized street with its HPN model where PC = (p1, p2) is theset of continuous places representing the two sections of the road, PD = (p4, p5) is the set of discreteplaces that models the signal system switching between red and green. TC = (t1, t2, t3) is the set ofcontinuous transitions model the limit between two sections and TD = (t4, t5) is the set of the discretetransitions which represent the delay associated with every section for switching between green andred lights.
Figure 2. Signalized road and the HPN model.
Batches Petri nets are a modeling tool for systems with accumulation. The new with this extensionof HPN is the introduction of batch concept; a batch (βr) is a group of entities whose movementthrough a transfer zone (i.e., a portion of road), and is characterized by continuous variables, namelythe length, the density, and the head position. Thus, batch places represent the delays on continuousflow and batch transitions behave like continuous transitions are associated with a maximum flow.
4.1.3. The Triangular Batches Petri Net
In the following, some of the main definitions of triangular batches Petri nets are presented.
Definition 1. The triangular batches Petri net can be defined by the following elements:A triangular batch Petri net is 6 − tuplet N = (P, T, Pre, Post, γ, Time) whereP is a non-empty finite set of places partitioned into discrete (PD), continuous (PC) and batch places (PB):
P = PC ∪ PD ∪ PB; Continuous places are used to model variables real values; While discrete places are used inmodelling variables with integer values; Batch Places are used to model transfer zones whose elements move atthe same speed.
97
Books
MDPI

J. Sens. Actuator Netw. 2017, 6, 30
T is a non-empty finite set of transitions partitioned into discrete (TD), continuous (TC) and batchtransitions (TB).
Pre, respectively Post: (PD × T → N) ∪ ((PC ∪ PB)× T → R ≥ 0) are defining the weight of arcsdirected from places to transitions and the weight of arcs directed from transitions to places.
γ : PB → �4 ≥ 0 is the batch place function. It associates with each batch place pi ∈ PB the 4 − upletof continuous characteristics g(pi) = (Vi, dmax
i , Si, Φmax) that represents, respectively, a speed, a maximumdensity, a length and a maximum flow.
Time: it represents the firing delay in case of discrete transitions and the maximal firing flow in case ofcontinuous or batches transitions.
For analysis of Petri net, two notions are needed: Preset and Postset since they are crucial inmodelling, respectively, pre-conditions and post-conditions of a system changes.
Definition 2 (Preset and Postset). Let m =| P | and n =| T | be the number of places and transitions in aTrBPN, respectively. The preset of a place p (resp. of a transition t) is defined as ·p = {t ∈ T | Post(p, t) > 0}(resp. ·t = {p ∈ P | Pre(p, t) > 0}) and the postset is defined as ·p = {t ∈ T | Pre(p, t) > 0} (resp.·t = {p ∈ P | Post(p, t) > 0}).
Batches are moving at different speeds. For controlling this, the concept of controllable batch isintroduced.
Definition 3 (Controllable batch). Additionally to the three basic characteristics of a batch, a controllablebatch (Cβr) is characterized also by the speed. Cβr(τ) = (lr(τ), dr(τ), xr(τ), vr(τ)) ∈ �+×�+×�+×�+.An instantaneous batch flow of (Cβr)(τ) is given by: φr(τ) = vr(τ) · dr(τ).
The marking of the batch place is a series of batches ordered by their head positions.
The moving of batches and their evolution depend on the state of batch places and are governedby various functions, namely: Creation, Destruction, Merging and splitting.
Definition 4 (Dynamics of controllable batches). For every batch place, four continuous dynamicfunctions can change the values of its batches and then change its marking.
Creation: A controllable batch Cβr(τ) = (0, dr(τ), 0, vr(τ)), is created inside a batch place pi and addedto its marking if its input flow is not null i.e., With
dr(τ) =φin
i (τ)
vi(τ)
Destruction: A controllable batch is destroyed, if its length is null i.e., lr(τ) = 0 and it is not a createdbatch i.e., xr(τ) = 0, such that Cβr(τ) = 0 and removed from the marking.
Merging: A controllable batch is obtained from the fusion of two batched, if they are in contact with the samedensity and the same speed. Consider the two controllable batches: (Cβr)(τ) = (lr(τ), dr(τ), xr(τ), vr(τ))
and Cβh(τ) = (lh(τ), dh(τ), xh(τ), vh(τ)) with xr(τ) = xh(τ) + lr(τ), vr(τ) = vh(τ) and dr(τ) = dh(τ),(Cβr)(τ) becomes (Cβr)(τ) = (lr(τ) + lr(τ), dr(τ), xr(τ), vr(τ)) and Cβh(τ)is destroyed Cβh = 0.
Splitting: A controllable can be split into two batches in contact with same density and the same speed.
The aforementioned models aren’t able to express accurately some rules and situations intraffic applications such as priority roads, traffic that has to stop when approaching an intersection.For example, the traffic behavior can change significantly due to the type of intersections whetherthey are right-of-way or roundabout, the presence of road signs or not. Therefore, taking intoconsideration non deterministic time based traffic dynamics will lead to improve modelling accuracyand generalization.
98
Books
MDPI

J. Sens. Actuator Netw. 2017, 6, 30
4.2. Our Extension: Generalized Nondeterministic Batch Petri Net
The batch Petri net that will be presented in this section is based mainly on the same principlesas triangular batch Petri net such as triangular fundamental diagram, generalizes the traffic flowmodelling and tackles other cases of road networks. We extend the existing formalization to support,on one hand, dependencies between traffic flow dynamics and external conditions, and on the otherhand, events that change dynamics at any place within roads.
To illustrate this, consider the following example:
Example 1. At T-intersection, the batch coming from section S2 and aiming to turn left, it must give way tothe oncoming batch from section S1. Figure 3 illustrates this giving way case.
Figure 3. T-intersection with give way rule, as depicted in the example.
By considering the above example and other such situations, the traffic behavior or the batchis not only depending on simple delay times or flow rules but can also depend on more complexuncontrollable events that may even change completely the batch characteristics. In the triangularbatches Petri net modeling, these cases and others are not modeled precisely or are not considered;For instance, in the example mentioned above, the batch (coming from S2) doesn’t have necessary thesame behavior since the batch can be divided according to the other traffic behaviors (batch comingfrom S1); the condition that has to be filled is neither delay time nor flow rule, the traffic has to stopand wait for the way to be clear.
The proposed generalized nondeterministic batch Petri net (GNBPN) seeks to complete Petri netformalism by adding new non-deterministic time based transitions which we call untimed transitionin order to formally represent changes that depend on external conditions (i.e., vehicles move atintersections only when the road ahead is empty). This allows us to include uncontrollable eventswhich cannot be fixed in time. Moreover, we enrich the model to take into consideration relationshipsto previous observed changes at a given station and/or to neighboring roads at the same time; forinstance, at fork, splitting a traffic flow into more accurate proportions can depend on temporal andspatial information (presence of an event, roadworks, etc.). The benefit of the added statistical featureis to enhance the firing rule of batch transitions.
99
Books
MDPI

J. Sens. Actuator Netw. 2017, 6, 30
Generalized nondeterministic batch Petri net (GNBPN) is defined formally as follows [24]:(P, T, Pre, Post, C, f , Prio, E) Where:
1. P, Pre and Post are respectively the set of places, the pre-incidence and thepost-incidence matrices;
2. T is a finite set of transitions that are partitioned into the three set of timed (Tt), untimed (Tu)
and batch (TB) transitions T = Tt ∪ Tu ∪ TB;3. C is the “characteristic function”. It associates with every batch place three continuous
characteristics (Vi, dmaxi , Si, Ns) that represent respectively speed, maximum density, and length
and the total number of segments of the batch place;4. f : is an application that associates a non-negative number to every transition:
• if tj ∈ Tt, then f (tj) = dj denotes the firing delay associated with the timed transitionexpressed in time unit;
• if tj ∈ TB, then f (tj) = Φj denotes the maximal firing flow associated with the batchtransition expressed in entities/time unit and estimated by statistical models in case ofmultiple outputs;We use the symbol f to refer to firing rules of transitions which can depend on both delaytimes and flow rules.
5. Prio is the priority of a transition according to the output flow of a place, ∀tj ∈ Tu. This priority’sfeature is added to support non-deterministic time based transitions.
For better understanding of the concept of GNBPN model, we illustrate the primitives of theproposal petri net using the example of T-intersection where the batch, coming from section S2 andaiming to turn left, must give way to the oncoming batch from section S1 (Figure 3). The Sections S1
and S2 are represented respectively, by batch places p1, p2. The intersection is modelled by the batchplace p21. While the maximum inputs flow of S1 and S2 are modelled by the batch transitions t1 and t2.
The give way rule within intersection is modelled by the untimed transition t23 representing thatvehicles at section S2 have to wait until the traffic ahead clears the intersection. Maximum flows Φ13, Φ21
and Φ3 of batch transitions t13, t21 and t3 represent, respectively, the maximum output flow of SectionsS1 and S2 and the maximum input flow of section S3. The associated model is shown in Figure 4.
Figure 4. Generalized nondeterministic batch Petri net representation of traffic flow of the use case.
100
Books
MDPI

J. Sens. Actuator Netw. 2017, 6, 30
5. Implementation
This section presents a deployment architecture that uses wireless sensor network and thenit introduces an implementation of Visualization component and Traffic Modelling and Analyticscomponent of the WTSM.
5.1. Deployment Architecture of WTMS
All nodes in this network are connected directly to a base station or via a relay node if neededand share their data. On another hand base stations model the traffic flow based on the received dataand then output the current traffic flow state. Consequently, they send the estimated traffic flow to theControl manager that evaluates all the received traffic flow estimations and provides an overall trafficestimation for the network. Such that, if congestion is detected, the Control manager broadcasts analarm notification to the authorities in order to take appropriate decision. The system deploymentarchitecture is illustrated in Figure 5.
The proposed system is mainly made up of the following elements:
• Sensor nodes: are responsible for detecting traffic flow at points of interest namely the beginning ofroads, and sending the real time measurements to the sensor head;
• Relay nodes: are intermediate sensor nodes that are used in case the network is wide and amulti-hope communication is needed;
• Sensor head: The duty of the sensor head is to aggregate the physical traffic parameters that werecaptured by sensor nodes like density, velocity and to send the aggregated data to the base station.
• Base station: The major purpose of base stations is to model and simulate the received traffic flowin the corresponding region and provide its dynamic evolution over time.
• Control manager: provides more coherent traffic flow of the overall road network, while dealingwith some of the most common critical situations such as congestion.
Figure 5. Major components of the proposed architecture.
101
Books
MDPI

J. Sens. Actuator Netw. 2017, 6, 30
Following is a simple use case representing the WSN based traffic management system and howit can operate when detecting traffic flow in road network.
The scenario consists of two intersections IS1 and IS2 where two roads cross each other asdepicted in (Figure 6). At least two sensors are positioned preceding every road to detect and transmitthe data that consist mainly of velocity, density and length of the entering vehicles. These data arecollected in the base station so as to model the traffic flow and estimate its evolution within the network.
Suppose at time T0, different batches of vehicles are detected within roads R1 and R2 (Arrowsblue and red) by a set of sensors that are positioned at the beginning of these roads. Sensor S1 willtransmit information about velocity, length and density to the corresponding base station BS1, throughthe sensor head, where generalized nondeterministic batch Petri modeling will perform and outputthe traffic flow evolution at every section of roads i.e., the velocity, the length, the density and the timewhen vehicles will be there. The same process will be carried out for sensor 2 and BS2. Consequently,a control manager will model the whole network based on the output of every base station.
Figure 6. A simple scenario of the proposed traffic management.
5.2. Prototyping
A prototype has been developed in order to implement the data analysis component and moreprecisely the proposed GNBPN model and check its applicability. To this end, we have proposeda preliminary architecture consisting of the following elements: Web interface, two sensors and abase station.
The web interface is meant to allow the system administrator to save the characterestics of eachroad within the network mainly its maximum speed, maximum density and length.
The sensors are meant to detect a batch of vehicles and determine its average speed and density.The base station is meant to execute the batch evolution model GNBPN based on the inserted
parameters through the web interface and the detected values received from sensors.The suggested prototype aims mainly at implementing a simplified version of GNBPN model.
This simplified version is used to study the dynamic evolution of a vehicles batch that is moving in acertain section of the road, in order to predict whether congestion may occur at the level of the entireroad or not.
To perform the calculations necessary to determine the vehicles batch evolution within a section,the algorithm takes as inputs:
102
Books
MDPI

J. Sens. Actuator Netw. 2017, 6, 30
• The characteristics of the vehicles batch, which are:
– db: The density of vehicles batch (veh/km);– xb: The position of vehicles batch;– vb: The speed of vehicles batch (km/h).
• The characteristics of the road R:
– LR: The length of the road (km);– Dmax
R : The maximum density (veh/km);– VR: The maximum speed (km/h);– Φmax
R : The maximum flow (veh/h).
Once the algorithm is executed, it yields the output vector A which contains four values describingthe evolution of the batch, namely:
• t: The travel time needed to reach the end of the road;• db: The updated density of vehicles batch;• xb: The updated position of vehicles batch;• vb: The updated speed of vehicles batch.
Figure 7 shows the Arduino IDE with a sample of the simplified sketches loaded.
Figure 7. screen of the Arduino IDE program with a sample sketches loaded of GNBPN model.
The development of the prototype involved the use of two HC-SR04 ultrasonic sensors fordetecting the vehicles batch and sending the measurements to the base station, a MAMP Web Serverand an Intel Galileo Gen 2; the intel Galileo Gen 2 development board is used as a base station on theone hand, and as data aggregation platform on the other hand. This board plays the role of sensor headsince it performs an aggregation operation over sensor measurements such as aggregating vehiclesspeed. Also, Intel Galileo Board performs the simplified version of Batches Petri nets algorithm usingthe aggregated data and the input parameters, that were given through the web interface, to determine
103
Books
MDPI

J. Sens. Actuator Netw. 2017, 6, 30
whether a congestion will occur or no. Figure 8a shows the used Intel Galileo Gen 2 connected to twoHC-SR04 ultrasonic sensors.
(a) (b)
Figure 8. The main elements of the proposed prototype. (a) HC-SR04 ultrasonic sensors with IntelGalileo Gen 2; (b) Web Interface for inserting road parameters.
The current deployed version of the model is totally based on installation on Galileo gen 2 boards.The software installation process consists of the following steps:
– Setting up the computer for development with the Galileo Gen 2 board by installing arduinointegrated development environment (IDE) software;
– Writing and Uploading the code: Once the code is created, it has to be compiled and uploaded tothe Galileo board.
The system contains a web interface as well for inserting the required parameters for the modelsuch as maximum density, maximum speed and maximum length of a road.
Figure 8b shows the web interface screen. The data inserted is thus sent and stored into a XAMPPbased database server.
In this work, the HC-SR04 ultrasonic sensors have been chosen to detect vehicles batch andmeasure its speed and density. They operate on 5 V and provide 2 to 400 cm or 1” to 10 feet non-contactmeasurement function with high accuracy and stable readings (up to 3 mm accuracy).
The HC-SR04 ultrasonic sensors consist of a transmitter and a receiver. The transducer transmitseight 40 kHz pulses of ultrasonic pulses which travel through the air until it meets an object thatthese pulses are reflected back by the object. The waves reflected by the objects and received by thetransducer are used to compute the speed and density of vehicles’ batch by Intel Galileo Gen 2.
Intel Galileo Gen 2 Development board is powered by intel Quark System-on-Chip (SoC) ×1000and operating at speed up to 400 MHz. it runs on an embedded Linux Kernel and it ensures savingdata on the SD card and transmitting them using internet.
The advantage of using Intel Galileo Gen 2 is the ease of writing Arduino’s sketches in order to:
– Obtain the parameters that have already been stored via the web interface into a database– Interact with sensors for computing cars speed and density– Perform the simplified version of GNBPN model– Transmit the result and save it into XAMPP based database server
Figure 9 represents a workflow diagram for the developed prototype.
104
Books
MDPI

J. Sens. Actuator Netw. 2017, 6, 30
Figure 9. The flow diagram of the developed prototype.
On another hand, based on our GNBPN model and estimation methods, we have developedcolor-coded visualizer that is used for viewing different segments of road network and estimatingtraffic evolution on (i) the same segments (temporal prediction) and (ii) related segments (spatialprediction). Different features are taken into consideration such as displaying traffic situations andcomputing travel times along possible routes for origin-destination pair etc. The visualizer takes theknowledge derived from models and turns it into easy and interpretable accessible visualizations thatinclude near real-time road traffic flow, and road traffic prediction. Interaction with the system can beensured through mobile applications or web portal (users) and dashboard (managers).
Figure 10 depicts a sample of the visualizer that we have developed. For instance, Figure 10ashows the level of congestion of a section that is characterized by flux, density, length and maximumspeed. As for Figure 10b, it is an exploratory example of an event covers a circular geographical area,as well as the affluence that indicates its impact vis-à-vis the sections concerned.
(a) (b)
Figure 10. Illustration of the road network visualizer application. (a) The main characteristics of a roadsection; (b) An event occurs in a geographical area.
We have used google map APIs for developing our color-coded visualizer described in theprevious section and we have proceeded with customizing it by adding modules for CRUD operationson road segments using Java 8 and MySQL.
105
Books
MDPI

J. Sens. Actuator Netw. 2017, 6, 30
6. Conclusions
This paper presents a novel wireless sensor networks based system for road traffic managementwhile detailing the deployment and the functional architectures.
The paper exhibits an implementation of two elements of the proposed system: Visualization anddata analysis components. We are currently working on various components of the system :
• Implementation of the complete algorithm of our traffic state evolution• Estimation of intersection turning movements and its implementation• Using NoSQL database for data storage
Acknowledgments: The authors thank Joel Tankam, Bousseta Ayyoub and Ahmadou Youssef for their great helpduring the prototype development that contributed to improving the quality of our paper.
Author Contributions: This work is the result of the collective efforts of all authors. Youness Riouali conductedthe research and trials. Laila Benhlima and Slimane Bah supervised the research and added their intellectualproperty and experience into the system. All the authors contributed to revision the paper and provided detailedcomments to improve the content of the manuscript.
Conflicts of Interest: The authors declare no conflict of interest.
Abbreviations
The following abbreviations are used in this manuscript:
WSN Wireless Sensor NetworkITS Intelligent Transportation SystemICT Information and Communication technologyVANET Vehicular Ad-hoc NetworkHPN Hybrid Petri netsWTMS WSN-based Traffic Management System
References
1. Losilla, F.; Garcia-Sanchez, A.J.; Garcia-Sanchez, F.; Garcia-Haro, J.; Haas, Z.J. A Comprehensive Approachto WSN-Based ITS Applications: A Survey. Sensors 2011, 11, 10220–10265.
2. Lazarescu, M.T. Design and Field Test of a WSN Platform Prototype for Long-Term EnvironmentalMonitoring. Sensors 2015, 15, 9481–9518.
3. Darwish, A.; Hassanien, A.E. Wearable and Implantable Wireless Sensor Network Solutions for HealthcareMonitoring. Sensors 2011, 11, 5561–5595.
4. Conti, M. Secure Wireless Sensor Networks: Threats and Solutions; Advances in Information Security; Springer:New York, NY, USA, 2015.
5. Mason, A.; Al-Shamma’a, A.I.; Shaw, A. Wireless Sensor Network for Intelligent Inventory Management forPackaged Gases. In Proceedings of the 2009 Second International Conference on Developments in eSystemsEngineering, Abu Dhabi, UAE, 14–16 December 2009; pp. 413–417.
6. Zhao, F.; Guibas, L. Wireless Sensor Networks: An Information Processing Approach; Electronics & Electrical,Morgan Kaufmann: Burlington, MA, USA, 2004.
7. Liu, X.; Cao, J.; Lai, S.; Yang, C.; Wu, H.; Xu, Y.L. Energy efficient clustering for WSN-based structural healthmonitoring. In Proceedings of the 2011 IEEE INFOCOM, Shanghai, China, 10–15 April 2011; pp. 2768–2776.
8. Giammarini, M.; Isidori, D.; Concettoni, E.; Cristalli, C.; Fioravanti, M.; Pieralisi, M. Design of Wireless SensorNetwork for Real-Time Structural Health Monitoring. In Proceedings of the 2015 IEEE 18th InternationalSymposium on Design and Diagnostics of Electronic Circuits Systems, Belgrade, Serbia, 22–24 April 2015,pp. 107–110.
9. Bhattacharyya, S.; Deprettere, E.; Leupers, R.; Takala, J. Handbook of Signal Processing Systems; Springer:New York, NY, USA, 2013.
10. Forster, C.A. Australian Cities: Continuity and Change; Meridian (Melbourne, Australia), Oxford UniversityPress: Oxford, UK, 2004.
106
Books
MDPI

J. Sens. Actuator Netw. 2017, 6, 30
11. Daven, J.; Klein, R. Progress in Waste Management Research; Nova Science Publishers:Hauppauge, NY, USA, 2008.
12. Engelbrecht, J.; Booysen, M.J.; van Rooyen, G.J.; Bruwer, F.J. Survey of smartphone-based sensing in vehiclesfor intelligent transportation system applications. IET Intell. Transp. Syst. 2015, 9, 924–935.
13. Wang, Y.; Peng, Z.; Wang, K.; Song, X.; Yao, B.; Feng, T. Research on Urban Road Congestion Pricing StrategyConsidering Carbon Dioxide Emissions. Sustainability 2015, 7, 10534–10553.
14. Alrawi, F. The importance of intelligent transport systems in the preservation of the environment andreduction of harmful gases. Transp. Res. Procedia 2017, 24, 197–203. 3rd Conference on Sustainable UrbanMobility, 3rd CSUM 2016, Volos, Greece, 26–27 May 2016.
15. Wang, R.; Xiao, F. Advances in Wireless Sensor Networks: 6th China Conference, CWSN 2012, Huangshan,China, October 25–27, 2012; Revised Selected Papers; Communications in Computer and Information Science;Springer: Berlin/Heidelberg, Germany, 2013.
16. Bui, K.H.N.; Pham, X.H.; Jung, J.J.; Lee, O.J.; Hong, M.S. Context-Based Traffic Recommendation System.In Context-Aware Systems and Applications: Proceedings of the 4th International Conference, ICCASA 2015,Vung Tau, Vietnam, 26–27 November 2015; Vinh, P.C., Alagar, V., Eds.; Springer International Publishing:Cham, Switzerland, 2016; pp. 122–131.
17. Ugnenko, E.; Uzhvieva, E.; Voronova, Y. Simulation of Traffic Flows on the Road Network of Urban Area.Procedia Engineering 2016, 134, 153–156. Transbaltica 2015: Proceedings of the 9th International ScientificConference, Vilnius Gediminas Technical University, Vilnius, Lithuania, 7–8 May 2015.
18. Lv, Y.; Duan, Y.; Kang, W.; Li, Z.; Wang, F.Y. Traffic Flow Prediction With Big Data: A Deep LearningApproach. IEEE Trans. Intell. Transp. Syst. 2015, 16, 865–873.
19. Hoogendoorn, S.P.; Bovy, P.H.L. State-of-the-art of vehicular traffic flow modelling. Proc. I MECH E Part I J.Syst. Control Eng. 2001, 215, 283–303.
20. Arem, V.; Arem, B.V.; Hoogendoorn, S.P. Gas kinetic traffic flow modelling including continuous driverbehaviour models. Transp. Res. Rec. J. Transp. Res. Board 2003, 1852, 1–19.
21. Savrasovs, M. Traffic Flow Simulation on Discrete Rate Approach Base. Transp. Telecommun. J. 2012,13, 167–173.
22. Treiber, M.; Kesting, A. Traffic Flow Dynamics; Springer: Berlin/Heidelberg, Germany, 2013.23. Huang, B. GIS coupled with traffic simulation and optimization for incident response. Comput. Environ.
Urban Syst. 2007, 31, 116–132.24. Riouali, Y.; Benhlima, L.; Bah, S. Petri net extension for traffic road modelling. In Proceedings of
the 2016 IEEE/ACS 13th International Conference of Computer Systems and Applications (AICCSA),Agadir, Morocco, 29 November–2 December 2016; Volume 7, pp. 7–12.
25. Demongodin, I.; Audry, N.; Prunet, F. Batches Petri nets. In Proceedings of the IEEE Systems Man andCybernetics Conference (SMC), Le Touquet, France, 17–20 October 1993; Volume 1, pp. 607–617.
26. Demongodin, I. Generalised Batches Petri Net: Hybrid Model For High Speed Systems With Variable Delays.Discret. Event Dyn. Syst. 2001, 11, 137–162.
27. Riouali, Y.; Benhlima, L.; Bah, S. Toward a Global WSN-Based System to Manage Road Traffic. InProceedings of the International Conference on Future Networks and Distributed Systems, Cambridge, UK,19–20 July 2017; pp. 28:1–28:6.
28. Xiao, L.; Peng, X.; Wang, Z.; Xu, B.; Hong, P. Research on Traffic Monitoring Network and Its TrafficFlow Forecast and Congestion Control Model Based on Wireless Sensor Networks. In Proceedings ofthe 2009 International Conference on Measuring Technology and Mechatronics Automation, Zhangjiajie,Hunan, China, 11–12 April 2009; Volume 1, pp. 142–147.
29. Rahman, M.; Ahmed, N.U.; Mouftah, H.T. City traffic management model using Wireless Sensor Networks.In Proceedings of the 2014 IEEE 27th Canadian Conference on Electrical and Computer Engineering (CCECE),Toronto, ON, Canada, 4–7 May 2014; pp. 1–6.
30. Nafi, N.S.; Khan, R.H.; Khan, J.Y.; Gregory, M. A predictive road traffic management system based onvehicular ad-hoc network. In Proceedings of the 2014 Australasian Telecommunication Networks andApplications Conference (ATNAC), Southbank, Australia, 26–28 November 2014; pp. 135–140.
31. Cárdenas-Benítez, N.; Aquino-Santos, R.; Magaña-Espinoza, P.; Aguilar-Velazco, J.; Edwards-Block, A.;Medina Cass, A. Traffic Congestion Detection System through Connected Vehicles and Big Data. Sensors2016, 16, 599.
107
Books
MDPI

J. Sens. Actuator Netw. 2017, 6, 30
32. Iwasaki, Y.; Misumi, M.; Nakamiya, T. Robust Vehicle Detection under Various Environmental ConditionsUsing an Infrared Thermal Camera and Its Application to Road Traffic Flow Monitoring. Sensors 2013,13, 7756–7773.
33. Viola, P.; Jones, M. Rapid object detection using a boosted cascade of simple features. In Proceedings of the2001 IEEE Computer Society Conference on Computer Vision and Pattern Recognition, (CVPR), Kauai, HI,USA, 8–14 December 2001; Volume 1, pp. I–511–I–518.
34. Lienhart, R.; Maydt, J. An extended set of Haar-like features for rapid object detection. In Proceedings ofthe International Conference on Image Processing, Rochester, NY, USA, 22–25 September 2002; Volume 1,pp. I–900–I–903.
35. Du, R.; Chen, C.; Yang, B.; Lu, N.; Guan, X.; Shen, X. Effective Urban Traffic Monitoring by Vehicular SensorNetworks. IEEE Trans. Veh. Technol. 2015, 64, 273–286.
36. Singh, V.; Srivastava, H.; Venturino, E.; Resch, M.; Gupta, V. Modern Mathematical Methods and HighPerformance Computing in Science and Technology: M3HPCST, Ghaziabad, India, December 2015; Springer:Singapore, 2016.
37. Mikolajczak, B.; Singh, A. TransCPN—Software Tool for Transformation of Colored Petri Nets.In Proceedings of the 2009 Sixth International Conference on Information Technology: New Generations,Las Vegas, NV, USA, 27–29 April 2009; pp. 211–216.
38. Martínez, D.; González, A.; Blanes, F.; Aquino, R.; Simo, J.; Crespo, A. Formal Specification and DesignTechniques for Wireless Sensor and Actuator Networks. Sensors 2011, 11, 1059–1077.
39. Ehrig, H.; Juhas, G.; Padberg, J.; Rozenberg, G. Unifying Petri Nets: Advances in Petri Nets; Lecture Notes inComputer Science; Springer: Berlin/Heidelberg, Germany, 2003.
c© 2017 by the authors. Licensee MDPI, Basel, Switzerland. This article is an open accessarticle distributed under the terms and conditions of the Creative Commons Attribution(CC BY) license (http://creativecommons.org/licenses/by/4.0/).
108
Books
MDPI

Article
A Social Environmental Sensor Network Integratedwithin a Web GIS Platform
Yorghos Voutos 1,*, Phivos Mylonas 1, Evaggelos Spyrou 2 and Eleni Charou 2
1 Department of Informatics, Ionian University, 7 Tsirigoti Square, 49100 Corfu, Greece;[email protected]
2 Institute of Informatics and Telecommunications, NCSR Demokritos, Neapoleos 10,15310 Ag. Paraskevi, Greece; [email protected] (E.S.); [email protected] (E.C.)
* Correspondence: [email protected]; Tel.: +30-697-043-7960
Received: 1 October 2017 ; Accepted: 15 November 2017 ; Published: 21 November 2017
Abstract: We live in an era where typical measures towards the mitigation of environmentaldegradation follow the identification and recording of natural parameters closely associated withit. In addition, current scientific knowledge on the one hand may be applied to minimize theenvironmental impact of anthropogenic activities, whereas informatics on the other, playing a keyrole in this ecosystem, do offer new ways of implementing complex scientific processes regardingthe collection, aggregation and analysis of data concerning environmental parameters. Furthermore,another related aspect to consider is the fact that almost all relevant data recordings are influencedby their given spatial characteristics. Taking all aforementioned inputs into account, managing sucha great amount of complex and remote data requires specific digital structures; these structuresare typically deployed over the Web on an attempt to capitalize existing open software platformsand modern developments of hardware technology. In this paper we present an effort to providea technical solution based on sensing devices that are based on the well-known Arduino platform andoperate continuously for gathering and transmitting of environmental state information. Controls,user interface and extensions of the proposed project rely on the Android mobile device platform(both from the software and hardware side). Finally, a crucial novel aspect of our work is the factthat all herein gathered data carry spatial information, which is rather fundamental for the successfulcorrelation between pollutants and their place of origin. The latter is implemented by an interactiveWeb GIS platform operating oversight in situ and on a timeline basis.
Keywords: IoT; GIS; Wireless Sensor Network; environmental monitoring; participatory
1. Introduction
The methodology of identifying and recording natural parameters is straightly connected toenvironmental degradation, while modern technological achievements have created new prospectsof interaction between human and their living environment [1]. Technological solutions derive fromcomplex scientific processes, which offer integrity, scientific relevance and applied continuously couldalso serve as a stepping stone to minimize environmental impact [2]. The increased accessibility tocutting edge technologies and the variety of skill-set held by the average citizen, generate prospectsof novel methodology for protecting and preserving the environment. This study focuses on thedevelopment of a prototype platform that records the environmental state of any given place.Open-source technologies (software and hardware) are playing a pivotal role on the implementationof the platform. More specifically, the proposed platform is supported by recording devices based onthe Arduino family of boards. Code development take place at all stages of the project and have beenimplemented exclusively through open-source applications. The monitoring device is calibrated priordeployment, taking into consideration the parameters of each component (software and hardware).
J. Sens. Actuator Netw. 2017, 6, 27 109 www.mdpi.com/journal/jsan
Books
MDPI

J. Sens. Actuator Netw. 2017, 6, 27
The scarcity and degradation of renewable or non-renewable natural resources are signalingdisturbances in the planet’s geochemical cycles as well as the reduction of biological diversityand genetic stock [3]. Human activities are characterized as the main source of climate change [4].It is commonly accepted that the ecosystems of major cities have played an important role on theenvironmental crisis due to the unceasing accumulation of population within them. Moreover,cities present particular vulnerabilities to climate change and its effects [4]. The multidimensionalconcept of a human’s Quality of Life (QoL) [5] is shaped, among others, by the perceived environmentalnuisance, under subjective criteria. QoL deals with the study and documentation of the concept ofquality of everyday life, through the synergy of both subjective and objective criteria.
Enriching human activities with technological solutions may act as a springboard to minimizeenvironmental impacts on everyday life. Towards this goal, one of the most promising, yet affordablesolutions is the concept of the “Internet-of-Things” (IoT) [6]. IoT denotes the computerization andthe utilization of everyday digital objects for the further enrichment of Internet data. It presents newmeans of interaction between man, machines and computers, indicating natural and essential modusoperandi for humans and their environment. Moreover, recent advances in the fields of electronics haveallowed consumer mobile Internet-enabled devices (e.g., smart-phones, tablets, smart-watches, etc.)to be equipped or even expandable with numerous features, that allow or facilitate interdisciplinaryapplications related to human and natural activities. The embodiment of GPS receivers within theaforementioned devices, the usage of novel methods of analytics, as well as means of presentationof geographical data have keenly contributed on broadening environmental science applications inconjunction with the advanced computing.
Finally, the notion of “participatory sensing” [7] has allowed the contribution and access ofindividuals and or groups to a single core knowledge, allowing users to become active memberswithin digital communities. The rapid growth of computing power on mobile devices has realizedlarge scale environmental sensing, mainly through broad access and visualization provided by webGIS applications.
The herein presented research methodology includes both design and implementation steps.Principles of environmental monitoring [1] guide the deterministic modeling that encloses certainresearch variables of the case study [8]. In addition to the theoretical approach, software structuresare designed according to the system’s demand. Accurate environmental sensing depends on theappropriate design and function of hardware elements. Furthermore, communication infrastructureis essential for seamlessly feeding the system from end to end. Subsequently, the recording deviceis manufactured according to the type of studied physical quantities and networking restrictions.The device needs to be developed and calibrated accordingly in order to follow the system’sstandardized procedures. Further visualization and analysis is essential to this work because inorder to locate and possibly recognize sources of environmental degradation. This purpose servesa Geographic Information System (GIS) platform which is integrated to a web interface developedspecifically for this study.
The rest of this paper is organized as follows: In Section 2, we present related research workconcerning various applications of remote sensor networks. Then, in Section 3, we present the detailsregarding hardware components that have been used. Section 4 presents in detail the implementationframework of the of the proposed platform. Results that occurred upon the deployment of the platforminto real-life use cases are presented in Section 5 and the proof-of-concept is laid out in Section 6.Finally, the discussion regarding the conclusions and future prospects of the proposed framework ispresented in Section 7.
2. Related Work
Recent technology advancements have driven Wireless Sensor Network (WSN) systems to becomea feasible solution for many innovative applications [9,10]. Several systems that rely on low-powerembedded micro-controller platforms have been proposed [9,11]. Such systems make use of the digital
110
Books
MDPI

J. Sens. Actuator Netw. 2017, 6, 27
and analog I/O ports of platforms for sensor extensions alongside with custom or open source softwarecomponents. For instance, Ferdoush and Li [10] proposed a system based upon several hardwareand software elements. They focused on the development and integration processes. The overallarchitecture of their system included a base station and a number of distributed wireless sensornodes. On the hardware side, both nodes and the base station are developed in an assemblageof micro-controllers (uC), a radio transceiver and an environmental sensor measuring humidityand temperature. Specifically, base stations are implemented using a Raspberry Pi Model B [11],taking advantage of its advanced processing capabilities compared to the Arduino Uno [12], which hasbeen used to incorporate the sensors. Connectivity is established with the help of XBee Pro S2Bmodule [13] Data manipulation is performed by applications that have been installed in both sensorsand base station. A gateway application that has been installed in the micro-controllers assists theon-board functionality and acts as an intermediate for the sensor network and the MySQL database.Furthermore, the whole system is monitored by a web application which is controlled by the end userand offers data visualization capabilities. Overall, the system proposed by Ferdoush and Li is low cost,compact and could be easily managed with reduced complexity. On the other hand it has only beendeployed for indoor monitoring of temperature and relative humidity and the end user is providedwith low data visualization capabilities. Although it shares several fundamental characteristics withour proposed system, we believe that it is strongly differentiated on many aspects. Within our approach,communication is based on Bluetooth protocol and GPRS/WiFi connectivity. Moreover, our approachis structured around cloud computing services and its main aspect is the transmission of producedenvironmental information; i.e., it has been designed for outdoor use producing seven environmentalvariables. Finally, our approach strongly focuses on spatial characteristics of natural phenomena andwe integrate this on every aspect of our deployment.
Similarly, Kumar and Kumaraswamy [14] developed a WSN using open-source hardwareplatforms for small-scale ecological monitoring and knowledge collection. Both Raspberry pi anda microcontroller were used as a sensor node and base station setup. Each node has embeddedsoftware capable to handle recordings to the base station, which is supported by a user friendly webapplication. Communication is executed by ZigBee protocol (IEEE 802.15.4 standard), which compliesto three types of network topology (star, cluster-tree and mesh). Their proposal is adaptive to manyecological monitoring applications due to its compatibility with several open source hardware andsoftware platforms.
Indoor Environmental Quality (IEQ) is a concept which concerns the work of Salamone et al. [15].Therein, a WSN has been developed on the purpose of aggregating a set of different categories ofcomfort, well-being and satisfaction of users of buildings. Sensor nodes were based on an ArduinoUno and monitored air speed, radiant temperature, luminosity and CO2. Their system, namelynEmOs project, is implemented for recurrence monitoring and improvement of conditions and energyefficiency of buildings. The network’s communication is based on WiFi and sensor readings are sentto the Xively [16] cloud service. The notion of base stations is not adopted; instead, an Android Apphas been developed for the purposes of data distribution and node management. Comparison ofthe proposed sensor nodes with existing commercial tools indicated a difference of more than 5% inaccuracy. Overall, nEmOs may be characterized as a useful monitoring model for confined spaces.The main differences with the proposed system is that contains further sensing complexity whichis also applied outdoors. However both approaches aim at the estimation of environmental qualitythrough a series of low cost and open source tools.
The direction of sensing the natural outdoor environment has been adopted by [9]. Their workrefers to small distance dense deployment strategy of automated early fire detection through clusterdistributed sensor nodes operating with low energy demands. The sensors are deployed to fixedpositions in forest areas, feeding base stations (cluster-heads) with specific metrics, which, on their turn,forward the gathered information to a data sink. Network topology includes “adaptive mechanisms”related to fire detection and uses both flat and hierarchical structure. An important technical aspect of
111
Books
MDPI

J. Sens. Actuator Netw. 2017, 6, 27
the project is the correlation between energy consumption and network performance due to the remoteexposure of sensors in adverse conditions. This is achieved by sensing temperature and humidityfluctuations that point out fire threat. An integrated automated monitoring system that relies onnetwork design and implementation has been implemented. It showcases the depth of functionalcapabilities in automated sensing methodology. The data used are spatial aware and obtain specificfixed positions in the research area. From our perspective, geographical location offers correlatedinformation regarding location and time depending on the environmental aspect in question (humidityor temperature). Likewise, user related capabilities of event aware sensors offer reactive mechanisms.In the proposed system, nodes adjust their sensing parameters according to spatial transitions andwarn the end user for abnormal or dangerous fluctuations of the environmental quality.
Sensor related applications and services in automotive vehicles is a direction followed by corporateindustries [17]. A moving vehicle can be a source of sensory data that are difficulty acquired by a singlesystem or network. Produced variables benefit drivers and third parties gathering information forenvironment monitoring, passenger awareness and vehicle operation. Sensory data derive fromembedded hardware and network functions supported by vehicles ECU (Electronic Control Unit) andare supported by Global Positioning System’s (GPS) operation. The dissemination of data supportfurther implementation on urban and public sensing provide benefits to global information sharingand access with the aid of mobile phones and handled devices, opening novel application domains.Automated environmental data generation through vehicles may considerably widen the source ofsensing data while enabling further development of supporting infrastructures (e.g., networking).Built in sensing in vehicles fails to support hardware customization due to restricted production.Nevertheless, social aware passengers convey the potential expansion of environmental sensinginter-connectivity by integrating portable sensor technology into vehicle capabilities [18].
Precision agriculture is a wealthy field of application for automated monitoring as it has beenhighlighted by both Srbinova et al. [19] and Keshtgary and Delijoo [20] which have both developedWSN systems for improved quality in farming. They both followed the common WSN schema of nodesand base stations while showcasing efficient processes of gathering and distributing environmentalparameters. Both studies engaged into the structure of network topologies, attempting to optimizequality in arable areas. More specifically, Srbinova et al. used communication protocols with lowconnection rates based on energy efficient time frames. Also, Keshtgary and Delijoo concentrated onthe creation of performance metric typeset for a bivariate topological model. The initial iteration locatesnodes at edge of each field and the latter distributes them randomly. Precision agriculture throughWSN distinguishes external factors of monitoring to provide profundity on this field of study. Sensornetworks require input from complementary components to complete monitoring and operationalroutines such as an irrigation system to control water level and humidity.
Hur and Eisenstadt [21] proposed a “low power wireless monitoring system” for mosquito andpathogen related research. The system’s purpose is to transmit information regarding humidity,temperature, wind speed and direction and location data for better control of mosquito populationsand to prevent the spread related diseases. They’ve deployed a set of fixed, power autonomous andweather proof wireless climate monitoring devices based on a microcontroller that communicates toa Web based service through a low power Adaptive Network Technology (ANT) module. Moreover,the device security is enhanced through a radio-frequency identification unit (RFID) for secure controland manual user login of the module. The series of data is presented to a web browser applicationequipped with extensive graphical capabilities, and therein location related information is presentedto a Google Maps based platform. Although our project embodies similar concepts, this work isspecialized in population control and disease prevention. Additionally, sensors are geostationary anddo not feature open source software and hardware properties.
The three year design and deployment of WSN by Naumowicz et al. [22] aimed at seabirdmonitoring on Skomer Island (a UK National Reserve, located off the west coast of Pembrokeshire,Wales). The research team developed a real-world deployable sensor network to investigate the habitat
112
Books
MDPI

J. Sens. Actuator Netw. 2017, 6, 27
of Manx Shearwater (Puffinus puffinus) seabird. The project is based on battery powered sensornodes communicating bi-directionally via Micro-Mesh-Protocol. The sealed devices were based ongeneric extension boards (MSB430MS) and installed near the entrance of the bird’s habitat (burrow)monitoring air temperature and humidity, movement on the entrance (passive infrared PIR), identity ofindividual bird (were marked previously with RFID tags) and weight of individual gird (with custommade scales). Recordings were initially saved in a SD card and selectively parsed to the repositorythrough Micro-Mesh. Data and nodes were controlled by a custom built firmware with low level APIbased on ScatterWeb of Freie Universitat Berlin. Remote deployed and custom developed WSNs offerdependable recordings on specific implementations, but lack repeatability and broad applicability.
More et al. [23] proposed a “test-bed for real-world Habitat Monitoring System (HMS)” byacquiring remote physical environmental data. Their project can be implemented in any remotelocation using the Arduino Uno board, WI-FI connectivity and a Graphical User Interface (GUI).The nodes are consisted by a sensing, a power and a communication unit, which are monitoringtemperature, humidity and light, while transmitting them towards a base station. The platformsupports live data visualization on a hourly basis and the GUI manages the recorded data througha database built for this purpose. The project of More et al. is an adaptable platform focused in easydeployment at specific remote areas. Our project is concentrated in the spatial aspect of monitoring,proffers portable operation and is compatible with modern mobile devices.
Simbeye et al. [24] dealt with the development of special nodes in order to monitor environmentalparameters in aquaculture. Their method concerned the evaluation of monitoring an aquaculturesystem by deploying for the duration of six months two sensor network nodes in fish ponds. The overallframework consists three monitoring components: “smart sensor nodes”, gateway/coordinatornodes—both based on the ZigBee platform—and a PC as monitoring center. The environmentalconditions were analyzed through specific software operating on every system component andpresented real-time and total recordings in a GUI. The methodology of water monitoring allowsto avoid fish mortality and could be applied in various fields of environmental sensing.
The adherence of proper hygiene practices in public health institutions is a subject studied by Baland Abrishambaf [25] through the implementation of IoT and WSN technologies. Their prototypesystem aims at monitoring hand hygiene compliance rates through cloud-connected monitoringstations to monitor hand hygiene events in real-time and in large scale. The proposed platform isconsisted by a network of “smart hand washing” nodes, which are embedded in a wireless domainthrough Zigbee communication protocol and UHF-RFID modules. The nodes are divided into SoapDispenser and Faucet categories that both integrate embedded microprocessors, various sensors andactuators. The automatic soap dispenser, based on Arduino PRO-mini, initiates the hygiene sequenceonce it is actuated by the user and it is followed by the faucet, based on Raspberry Pi 3, whichfinalizes the hygiene activity. Networking is based on wireless local area network that establishescommunication among nodes and cloud services (Database and Clients) where lower and higherlevel programming languages have employed on the purpose to measure compliance while countinghand-hygiene occurrences and their total duration. Bal and Abrishambaf proposed a novel approachon public health related human actuated events, outwit the scope of environmental sensing andoutdoor monitoring.
The survey of Noel et al. [26] dealt with applications of WSN to Structural Health Monitoring(SHM) which is referred to the monitoring of critical infrastructures in order to expand their lifespanthrough “early damage detection”. This application requires the deployment of numerous sensorsthroughout a structure for damage localization. Applied WSN for SHM are based on the selectionof sensor and sensed parameters—mainly focused on structure’s acceleration and velocity throughpiezoelectric accelerometers. SHM requires the management of a large amount of data with densepopulation of sensor nodes. Delay in sampling rate depends on the prospect of the monitoringprocedure, e.g., long-term allows long delays. Network scalability is highlighted as an importantfactor in meeting each SHM application quality due to the required “sheer quantity of data collection
113
Books
MDPI

J. Sens. Actuator Netw. 2017, 6, 27
and transmission” and is related to the maximum network node time-synchronization step. Networkarchitecture is improved through hierarchical relationship between a base station and several sensornodes. Synchronization among the nodes and the base station is implemented by specializedalgorithms that are dependent to Time Synchronization Error (TSE) factor. Furthermore, optimalplacing of sensor nodes originate from civil engineering perspective and determines the effectivenessof structural information collection. Relatively to scalability, placement is related to network’slifespan, overall connectivity, robustness and decision regarding the implemented routing protocol.Energy efficiency determines network lifespan and affects system operation. Clustering is highlightedas a common technique to improve scalability, simplify routing, extend network lifespan and conservebandwidth. In addition to the aforementioned, an SHM is capable of carrying several features suchas Mobile Phone Sensing (MPS) that extends the system to the capabilities of smartphones (e.g., GPS,accelerometers, cameras etc). WSN consist an effective tool with SHM applications that requiresextensive research prior deployment. The common ground between environmental monitoring andSHM is found on sensor locality, network architecture and communication protocols.
System intelligence in supply chain is provided by the integration among RFID and WSN.Mirsahi et al. [27] suggested an identification and detection system with intercommunicated devicesthat fulfil several requirements of the user. Based on the analytical Petri Net toolbox the authorsproposed a system of “smart nodes” capable of environmental monitoring, location identificationand organizing products. Their system is performance oriented by impromptu providing differentfunctions related to the operation of automated guided vehicles (AGV).
Recent research work on the subject of environmental sensing and WSN indicates the popularapplicability of IoT projects in several fields of application. In contrast to most of the aforementionedworks we consider the significance of spatial and temporal elements in environmental monitoring.Non-linearity of natural phenomena is optimally monitored through the recognition of environmentalprocesses over time and space [28]. Therefore embedded location tracking arise as the distinctivefactor of our integrated system along with the potential of widespread implementation by public andprivate bodies. We propose an adaptable monitoring system based on integrated IoT, web servicesand popular development platforms that utilizes off the shelf hardware components and portabledevices. The system functionality is based on the deployment of sensor nodes in conjunction withan ever available android compatible device. Furthermore, it is adaptable in terms of power supplyand communication protocols. The monitoring procedure can be implemented by non-expert usersand mainly focuses on qualitative assessment of the perceived environment. Environmental physicalquantities are visualized and simplified onto geographical overlay on the prospect of rapid decisionmaking. In conclusion, the proposed platform could be adapted to various environmental sensingapplications and is capable for further customization.
3. Implementation
As expected, the proposed integrated system is based on the application of Information andCommunication Technologies (ICT). As a result the technical aspect of this work is divided into twodistinct parts: hardware development and networking. These allow the system to obtain, carry anddisseminate physical variables through a tree type network topology comprised by sensor nodes,base stations and a server (as message broker). Additionally, the conjunction between sensor nodesand base stations operates through merging measurements and location tracking in order to detectspatial trends in reference to environmental deterioration factors. Also, the network supports on the flyvisualization capabilities through numerical and cartographic representation. The latter is implementedby heat maps that provide an optimal apprehension of environmental quality on any given locationthrough variable clustering. In this study the heat map is considered to be an environmental assessmentsystem, visualizing the synchronization of physical quantities and spatial position.
Individual values of each variable are aggregated into a geographical matrix on which data aregraphically represented through a color scheme. Warmer color variations commonly correspond to
114
Books
MDPI

J. Sens. Actuator Netw. 2017, 6, 27
dense data concentration and therefore density is related to higher values. The proposed platformis based on distributed recording that assist the aggregation of data, hence the indication of spatialfluctuations in concentration of pollution factors. Each variable refers to its corresponding range(Noise Pollution: 30 to 80 dbA) and is categorized accordingly on the map. Beside individual metrics,integrated environmental quality can be detected through a Global variable. Global EnvironmentalQuality is an assessment methodology attempting to integrate the total of measured variables intoa heat map visualization on which non-dense data are considered as noise.
3.1. Hardware
The system developed within this study may be seen as an extension of a wireless sensor networkand consists of several hardware parts. The system aims at monitoring the immediate conditionsrelated to the perceived environment. Its hardware components consisted by a control unit and severalsensors able to record and disseminate the ambient conditions of a given area. The components needto comply with the conditions of replace-ability, availability and programmability in order to facilitateease of operation and reproduction. Electronic prototyping offer several off the shelf solutions thatfollow the aforementioned criteria.
The sensing device is developed using an Arduino developing board. More specifically, we optedfor the Arduino YUN [29] which may be easily deployed for both portable and fixed operation dueto its networking capabilities and expand-ability. Arduino platform offers low power consumptionamong popular open source development boards. Additionally, Arduino offers distinctive Digitaland Analogue pins, enabling connectivity with several sensors, actuators and modules. The YUNmodel offers extensive wired and wireless connectivity capabilities along with Arduino’s IntegratedDevelopment Environment (IDE). The latter is based on C and C++ languages, which loadscyclic programming loops directly through the device’s firmware. Physical quantities of specificenvironmental variables are produced by 5 sensor modules that have been connected on the YUN(Table 1). In addition to monitoring tasks the YUN operates as a communication node that transmitsthe measurements through WiFi (while being fixed) and Bluetooth (while being mobile). The selectedsensor modules have been selected based on low cost and their range of calibration, taking intoconsideration as many variables as possible. The schematic of the sensor node, built using an ArduinoYUN is illustrated in (Figure 1). The selected components are depicted in Table 1 and they have beenselected based on their low price and adequate accuracy for the proposed application, i.e., accuracywas sufficient for the goal of qualitative assessment of environmental parameters. We should notethat the necessary source code for the sensor node and the mobile phone has been made publiclyavailable (Mobile Sensor: https://goo.gl/oKqw5a, Fixed Sensor: https://goo.gl/9RJvRU, AndroidApp: https://goo.gl/BuPUoh.
Table 1. Expansions, Functions and Units used on the recording devices.
Expansion Type Model Function Measurement Unit
Temperature, Humidity DHT 22 Temperature, Rel. Humidity, Heat Index ◦C, % Humidity, % ◦CPhotometer TEMT 2000 Luminosity Lux (lx)Microphone MAX 4466 Noise Pollution/ Noise Intensity dBm
Gasses microparticles MQ-7 Carbon Monoxide (CO) ppmGasses microparticles MQ-4 Methane (CH4) ppm
When being fixed, the system is directly connected to WiFi, while being portable, An Androiddevice (i.e., a typical smart-phone) complements the system’s hardware in order to provide connectionto the Internet. More specifically, the smart-phone acts as a base station that receives and transmits flowof data from the sensors to the server. Furthermore it may also offer extensive control and real-timevisualization features for the purpose of complete monitoring operation.
115
Books
MDPI

J. Sens. Actuator Netw. 2017, 6, 27
Figure 1. Sensor Circuit schema.
The selection of the aforementioned hardware components attempts to tackle the commonproblem of insufficient energy resources, especially in mobile operation (Figure 2). The Arduinoplatform is known to offer several solutions for connecting to power sources, while having a relativelysmall energy footprint. In our case, the YUN is connected to a typical power bank via USB. This way,the system is able to provide portability, elongated operating times as long as effortless connectivity.
Figure 2. Sensor node in bulk form.
In normal conditions each node’s energy requirements averaging 10 mA/h. Using a portablepower supply with a nominal power of 2000 mAh it is estimated that each node can reach optimaloperation of 200 h. Unfortunately, an external battery cannot be used in full capacity thus mobileoperating life of the sensor module is estimated between 12 to 17 h.
3.2. Network Architecture
Data management and storage are the main activities of the proposed sensor network and aresupported by exploiting both preexisting hardware capabilities and also extensions of the YUN.It is worth noting that several distribution methodologies exist for both portable and fixed monitoringdevices. Portable sensors are dependable to the Android device in order to assert its networkingcapabilities (Figure 3). Consequently the YUN transmits the data via Bluetooth connection to the mobiledevice, which then is responsible to forward these readings to the server for further manipulation.On the other hand, fixed nodes set aside Android connectivity and directly forward the readings
116
Books
MDPI

J. Sens. Actuator Netw. 2017, 6, 27
through WiFi. Both module types are time synchronous through a Unix Timestamp [30] function thatis embedded on deployment. Additionally, during mobile monitoring the system validates time-stampwith satellite timing provided by GPS Atomic Clock [31]. This technique expands the recordingaccuracy of the system’s recognition of time related patterns.
Figure 3. Communication architecture.
A Client-Server schema has been developed for the purpose of the study, utilizing open sourcesoftware and Cloud Computing technologies. Supportively an MQTT [32] broker has been set up inorder to insure the continuity of operation between base station and the server. Heroku [33] is a cloudplatform-as-a-service (PaaS) on which a server has been deployed through Node.js [34] to host theoperation of the database. Both database design and implementation have been developed throughthe non-relational Database Management System MongoDB [35]. Therein, every recording is handledas a GeoJSON [36] element by the database to be used subsequently by the Android app. A fragmentof the transmitted data in GeoJSON format is depicted below:
{ "_id": {
"$oid": "58188b45914b700011f6dbf1"
},
"deviceId": "mob001",
"sensorType": "mobile",
"timestamp": {
"$date": "2016-11-01T14:32:03.000Z"
},
"geo": {
"type": "Point",
"coordinates": [
23.77108281,
37.94333254
]
},
"humidity": 38.2,
"temperature": 24.8,
"heatIndex": 24.33,
"luminocity": 56,
"methane": 4.73,
"co": 38.66,
"noise": 39
}
117
Books
MDPI

J. Sens. Actuator Netw. 2017, 6, 27
4. Application Framework
The Android platform has been designed to offer numerous hardware and software capabilitiesto assist development and functioning of heterogeneous types of applications. Upon investigation,the aforementioned capabilities have been proven to fulfill the requirements of the proposed systemand its dependencies on complex tasks that require hardware components and are related to the flowof collected data. The implemented app has been designed to exploit the Bluetooth, GPRS, WiFi andGPS capabilities of the mobile phone, which are the prerequisites in terms of the phone’s specificationsso as to enable data acquisition and collection from the YUN, location tracking and data transmission.Data may then be forwarded to services for database provisioning and cartographic representation.
To avoid message flooding, the app’s operating sequence is initiated by the pairing between thesensor and the Android device via Bluetooth and consists of several intervals of predefined duration.Each recording consisting of a set of measurements from all sensors is instantly transmitted as a stringmessage to the phone. This message is enhanced with the exact geographic location of the device anda time stamp (Figure 4). The message is then transformed to the GeoJSON format and transmitted tothe MQTT broker, which then forwards it to the server. This flow of data to the dynamic repositoryenables the interactive mapping operations that allow cartographic representation of the recordeddata. The latter is implemented in the server that stores all recordings to the MongoDB database andadditionally manages and analyzes the content through logical queries.
The two-way communication among fixed sensor nodes and the server is implemented using theMQTT protocol, which enables message interchange through topics using a publishing subscribingprocedure. Moreover, since MQTT is an extremely lightweight protocol, designed to require smallcode footprint and network bandwidth, guarantees a significantly small message size. Moreover,it is available for many heterogeneous devices and programming languages and fully compatiblewith all platforms that have been used within our system. Data sharing infrastructure is based ona network server acting as a web service. It consists of a Node.js server and an MQTT broker, bothdeployed on the Heroku cloud development platform. Ultimately, a non relational database modelhas been selected for data management and storage of the recordings. MonogDB manages data asindividual text documents (JSON) with distinct structure (field and values). In addition to the server,database is based on mLab [37] cloud storage service. Finally, the Android App is developed with Ionicframework [38] that offers simplicity whereas supporting Angular.Js front-end development standard.Ionic utilizes ngCordova [39] framework which functions on top of npm Javascript package [40].The app is equipped with functional and visualization capabilities, allowing the user to control,monitor and assess environmental quality (Figure 5).
118
Books
MDPI

J. Sens. Actuator Netw. 2017, 6, 27
Figure 4. Android App schema.
Figure 5. Data Acquisition on the Android application; Presented values within each line are: RelativeHumidity, Temperature, Heat Index, Luminosity, CH4 ppm, CO ppm, dB, longitude, latitude.
Base station’s role on this application is to collect and transmit data to a repository. In addition tothis, our project exploits the plethora of android platform capabilities. It offers the user live reading andcontrol alongside with geographical overlay of the recordings. The embedded Web Map is developedthrough the Mapbox platform that represents current and past recordings along with their spatialrepresentation (Figure 6). It provides user an extended apprehension of environmental quality in anygiven place and time the sensors are deployed.
119
Books
MDPI

J. Sens. Actuator Netw. 2017, 6, 27
Figure 6. Luminosity map, Athens.
5. Use Case Scenarios
The system has at its disposal multiversal capabilities which allows repeatability among variouscases. Assessing environmental quality is a complex multi-parameter procedure and a deploymentschema has been created for the purpose of the specific research work. At the operational level,the recording device may be used for both portable and fixed operation while on both occasions requiresInternet access for data transmission. Portable sensors depend on Android for spatial recordings andnetwork connection. While being fixed, they have predefined location and autonomous connectivity.
The latter is fastened in specific building infrastructures with the aim of providing the systemwith continuous baseline data. This operates as a filtering mechanism that minimizes the possibilityof spatial errors. On the other hand mobile measurements supply the monitoring system with riskindicators on a given route the sensor has “passed through”. Repeated traverses on the same route oron specific spatial points could possibly indicate spatial propagation of nuisance derivatives. The mainidea is situated at the operation of the sensor on systematic itineraries by frequent commuters basedon un-complicated reproduction of methodology.
Human is an indispensable factor on implementing the aforementioned complex monitoringprocedure. The evaluation of the receptive environment is based on criteria originating from qualitativemeasurements [5]. Small scale implementation and minimum resources restrict wider operation withseveral nodes dispatched into different locations. The application requires continuous operation ofat least two sensing devices (portable and fixed) in order to replete the database with spatial andnumerical records and subsequently produce optimal representation and highlight probable systemerrors or weaknesses. Therefore three realizable user oriented scenarios are determined, depending onspatial dispersion of the sensor nodes.
120
Books
MDPI

J. Sens. Actuator Netw. 2017, 6, 27
5.1. Individual
Based on the aforementioned every individual may implement the proposed monitoringmethodology on his everyday commute. Sensing could be applied by vehicle users, cyclists, walkers orhikers who follow specific itineraries thus to enrich the repository with spatial oriented data. The screenof the Android device projects an immediate visualization of environmental quality of the crossed area.
5.2. Social
Project’s low cost and ease reproduction into multiple iterations facilitate further propagationon a larger scale. Their data inputs will be gathered in clusters, improve collection and enhanceinterpretation. Beyond hobbyists and enthusiasts the proposed WSN possibly attracts citizen andcommunity groups. Widely employed Android devices urge large scale monitoring processes inresidential areas. The proposed WSN could be implemented by local community and school groups,NGOs, tour operators and in general groups with interest into environmental sensing methodology.
5.3. Smart City Infrastructure
The increase of world’s population and the shortage of natural resources incline towardsthe widespread use of information and communication technology (ICT) [41] in everyday life.Efficient changes in urban environments are powered by the trends of Smart Cities under the conditionof meeting the needs of the city and its citizens while assisting the management of infrastructure andservices [41].
Promoting involvement of state supported facilities in educational and environmental awarenessactivities. Public buildings and infrastructures operate constantly and are network connected.These edifices consist the ideal point of research interest, thus accommodate a vast number of activitiesand services. On the other hand private organizations will meliorate their image on environmentalcorporate social responsibility and assist on further environmental awareness activities.
The adoption by state owned vehicles (e.g., refuse trucks) and public transportation(e.g., bus, tram) services generate surplus value in relation to public service. Most of public vehiclesfollow the same routes on a daily basis creation a dynamic field of operation that potentially producesbaseline data.
6. Validation
The proposed WSN was carried out in a broad area of Athens, Greece employing a deployedpair of fixed and portable sensors. The area of study was mostly set at central Athens region forboth node types. Data emanated from recordings deployed on recurrent itineraries by car, bicycleor pedestrian use. Likewise a fixed node was set on different positions for varied time periods.This indicates that the comprehensive implementation of the system requires continuous operation oftwo or more devices (portable and stationary) in order to replete the Database of records (spatial andnumerical). The minimum number of deployed devices used on this research as a detection mechanismfor outlying erroneous factors. Subsequently, the expected number of recordings function positivelyfor the further development of the platform, in order to egress errors and reveal system weaknessesfor future implementation.
On strictly technical terms, there were few initial inconsistencies between modules andArduino YUN, which impaired the sensing functionality. Eventually, debugging help solve someof these issues, nevertheless the complex configuration caused erroneous recordings. MQ sensors(Gasses micro-particles) use an internal heater in order to operate in temperatures higher than 50 ◦C [42],therefore are particularly affected by extreme temperature fluctuations and often produce inaccuratereadings. Joint operation with a temperature sensor scale down potential inconsistencies. Additionally,noise pollution is a complex variable that needs specialized equipment [43]. A thirty-second strideper measure was applied so to increase accuracy of noise nuisance responsiveness by the microphone
121
Books
MDPI

J. Sens. Actuator Netw. 2017, 6, 27
module. The effectiveness of each time step was validated with controlled measurements of a calibrateddecibel meter. In addition to sensory there were few connectivity issues between YUN and the Androiddevice. This came as a result of firmware incompatibilities, which resolved by further debugging andthe use of different Android devices, with no measurable documentation on this matter.
The most considerable barrier the research came up against is incomplete data, which lead tochallenging endeavors regarding automated environmental assessment. Ultimately manual datanormalization allowed the production of a final assessment map (Figure 7), carried out by dataaggregation (Global Environmental Quality) according to heat map methodology.
Figure 7. Global Environmental Quality Assessment map, Athens.
7. Conclusions and Future Work
The proposed system offers an automated methodology of monitoring the environmental quality.The system’s potential is emphasized through the continuous network supply from several devices(nodes) simultaneously, the low resources and energy requirements and both its quantitative andqualitative assessment capabilities. Furthermore it supports various hardware extensions withthe derived variables to offer dynamic representation capabilities on a Web GIS environment.Data generalizations caused measurement inaccuracies and hardware–software compatibility issues,which are assessed specifically on every occasion. We should emphasize herein that towardsa cost-efficient and open source solution, with minimal implementation time, the way to go is a bottomup approach, such as the one we have followed, i.e., to select off-the-shelf tested solutions in orderto compose the full system. We also feel that such an approach may be easily adopted by everyone,e.g., hobbyists, enthusiasts, students, researchers etc., who may easily and at a low cost create theirown nodes and connect them to the platform, towards a fully social environmental network. Of course,we should emphasize that any single-board open platform such as the Raspberry Pi [44] or anyother platfrom that supports digital and analog sensors and the MQTT protocol may be used for theconstruction of the sensor node.
The results prospect for further continuation of the research work. Map visualization ofgeographical variables in web GIS may be further optimized. Additionally, the system allows greaterspecialization capabilities on recording and development of both hardware and software structures.The implementation scenarios are capable to broaden in many other applications. The importanceof channeling the research methodology to the public through crowd-sourcing is appearing whileembedding big data methodology. The construction of an integrated Spatial Sensor Web Networkrequires the adoption of SensorML [45] standard and Sensor Web Enablement SWE [46] action to
122
Books
MDPI

J. Sens. Actuator Netw. 2017, 6, 27
further support and enrich existing repositories. Implementing manual normalization generated theneed for further research on machine learning methodology outward of the server in favor of bigdata aggregation techniques. Finally, the proposed system could be integrated with small effort onan IoT-ready platform that supports the MQTT protocol, such as the SYNAISTHISI platform [47],which is an integrated platform that allows humans, systems, machines, and devices for the creationand management of services. Initial experiments indicated that the proposed sensors may beseamlessly integrated within the SYNAISTHISI ecosystem. Also, transformation of all processingunits into services is straightforward within SYNAISTHISI. This way, the desirable scalability shouldbe guaranteed.
Author Contributions: Yorghos Voutos conceptualized and implemented the research work. Phivos Mylonascontributed to the implementation of application development and programming. Evaggelos Spyrou designedand assisted the implementation of the monitoring devices. Eleni Charou assisted the analysis of the data.All contributors facilitated to the writing of the paper.
Conflicts of Interest: The authors declare no conflict of interest.
References
1. Lein, J.K. Environmental Sensing. In Environmental Sensing: Analytical Techniques for Earth Observation;Springer: New York, NY, USA; Dordrecht, The Netherlands; Heidelberg, Germany; London, UK, 2012;Chapter 2, pp. 23–50, ISBN 978-1-46-140142-1.
2. Gomarasca, M.A. Basics of Geomatics; Springer: New York, NY, USA, 2009; ISBN 978-1-40-209014-1.3. Reed, D.H. Impact of Climate Change on Biodiversity. In Handbook of Climate Change Mitigation and Adaptation,
2nd ed.; Chen, W.-Y., Seiner, J., Suzuki, T., Lackner, M., Eds.; Springer: New York, NY, USA, 2012; pp. 505–530.4. Intergovernmental Panel on Climate Change (IPCC). Climate Change 2014: Synthesis Report. Contribution
of Working Groups I, II and III to the Fifth Assessment Report of the Intergovernmental Panel on Climate Change;Core Writing Team, Pachauri, R.K., Meyer, L.A., Eds.; IPCC: Geneva, Switzerland, 2014; 151p.
5. Mohit, M.A. Quality of Life in Natural and Built Environment An Introductory Analysis. Procedia-Soc.Behav. Sci. 2013, 101, 33–43.
6. Atzori, L.; Iera, A.; Morabito, G. The Internet of things: A survey. Comput. Netw. 2010, 54, 2787–2805.7. Burke et al 2006 Participatory Sensing. Available online: http://remap.ucla.edu/jburke/publications/
Burke-et-al-2006_Participatory-sensing.pdf (accessed on 12 September 2017).8. Uusitalo, L.; Lehikoinen, A.; Helle, I.; Myrberg, K. An overview of methods to evaluate uncertainty of
deterministic models in decision support. Environ. Model. Softw. 2015, 63, 24–31.9. Emre Aslan, Y.; Korpeoglou, I.; Ulusoy, O. A framework for use of wireless sensor networks in forest fire
detection and monitoring. Comput. Environ. Urban Syst. 2012, 36, 614–625.10. Ferdoush, S.; Li, X. Wireless Sensor Network System Design using Raspberry Pi and Arduino for Environmental
Monitoring Applications. Procedia Comput. Sci. 2014, 34, 103–110.11. Raspberry Pi Model B+—Raspberry Pi. Available online: https://www.raspberrypi.org/products/
raspberry-pi-1-model-b/ (accessed on 20 October 2017).12. Arduino Uno Rev3. Available online: https://store.arduino.cc/arduino-uno-rev3 (accessed on
20 October 2017).13. Digi XBee/XBee-PRO ZigBee Modules (S2B)—Formerly ZB Product Detail—Digi International.
Available online: https://www.digi.com/support/productdetail?pid=4549 (accessed on 20 October 2017).14. Kumar, V.V.; Kumaraswamy, G. Wireless Sensor Network for Environmental Monitoring using Rasberri Pi.
Int. J. Adv. Technol. Innov. Res. 2016, 8, 2084–2086, ISSN 2348-2370.15. Salamone, F.; Belussi, L.; Danza, L.; Ghellere, M.; Meroni, I. Design and Development of nEMoS,
an All-in-One, Low-Cost, Web-Connected and 3D-Printed Device for Environmental Analysis. Sensors2015, 15, 13012–13027.
16. IoT Platform for Connected Devices|Xively by LogMeIn. Available online: https://www.xively.com/(accessed on 20 October 2017).
17. Abdelhamid, S.; Hassanein, H.S.; Takahara, G. Vehicle as a Mobile Sensor. Procedia Comput. Sci. 2014, 34,286–295.
123
Books
MDPI

J. Sens. Actuator Netw. 2017, 6, 27
18. Rawat, P.; Singh, K.D.; Chaouchi, H.; Bonnin, J.M. Wireless sensor networks: A survey on recentdevelopments and potential synergies. Supercomput 2014, 68, 1–48.
19. Srbinovska, M.; Gavrovski, C.; Dimcev, V.; Krkoleva, A.; Borozan, V. Environmental parameters monitoringin precision agriculture using wireless sensor networks. J. Clean. Prod. 2014, 88, 297–307.
20. Keshtgary, M.; Deljoo, A. An Efficient Wireless Sensor Network for Precision Agriculture. Can. J. Multimed.Wirel. Netw. 2012, 3, 1–5.
21. Hur, B.; Eisenstadt, W.R. Low power Wireless Climate Monitoring System with RDIF Security Access Featurefor Mosquitto and Pathogen Research. In Proceedings of the 1st Conference on Mobile and Secure Services,(MOBISECSER), Gainesville, FL, USA, 20–21 February 2015.
22. Naumowicz, T.; Freeman, R.; Kirk, H.; Dean, B.; Calsyn, M.; Liers, A.; Braendle, A.; Guilford, T.; Schiller, J.Wireless Sensor Network for habitat monitoring on Skomer Island. In Proceedings of the 35th Annual IEEEConference on Local Computer Networks, LCN 2010, Denver, CO, USA, 10–14 October 2010; pp. 882–889.
23. More, A.; Wagh, S.; Joshi, K. A test-bed for habitat monitoring system using Wi-Fi in Wireless Sensor Networks.In Proceedings of the IEEE International Conference on Computational Intelligence and Computing Research(ICCIC), Madurai, India, 10–12 December 2015; pp. 1–6.
24. Simbeye, D.S.; Zhao, J.; Yang, S. Design and deployment of wireless sensor networks for aquaculturemonitoring and control based on virtual instruments. Comput. Electron. Agric. 2014, 102, 31–42.
25. Bal, M.; Abrishambaf, R. A System for Monitoring Hand Hygiene Compliance based-on Internet-of-Things. InProceedings of the IEEE International Conference on Industrial Technology (ICIT 2017), Toronto, ON, Canada,22–25 March 2017; p. 18
26. Noel, A.; Abdaoui, A.; Badawy, A.; El-Fouly, T.; Ahmed, M.; Shehata, M. Structural Health Monitoring usingWireless Sensor Networks: A Comprehensive Survey. IEEE Commun. Surv. Tutor. 2017, 19, 1403–1423.
27. Mirshahi, S.; Uysal, S.; Akbari, A. Integration of RFID and WSN for supply chain intelligencesystem. In Proceedings of the Electronics, Computers and Artificial Intelligence (ECAI), Pitesti, Romania,27–29 June 2013; pp. 1–6.
28. Lein, J.K. Sensors and Systems. In Environmental Sensing: Analytical Techniques for Earth Observation; Springer:New York, NY, USA; Dordrecht, The Netherlands; Heidelberg, Germany; London, UK, 2012; Chapter 3,pp. 51–82, ISBN 978-1-46-140142-1.
29. ARDUINO YÚN. Available online: https://store.arduino.cc/arduino-yun (accessed on 12 September 2017).30. Epoch Converter—Unix Timestamp Converter. Available online: https://www.epochconverter.com
(accessed on 20 October 2017).31. GPS.gov: Timing Applications. Available online: https://www.gps.gov/applications/timing (accessed on
20 October 2017).32. MQTT. Available online: http://mqtt.org/ (accessed on 12 September 2017).33. Cloud Application Platform|Heroku. Available online: https://www.heroku.com/ (accessed on
12 September 2017).34. Node.js. Available online: https://nodejs.org/en/ (accessed on 12 September 2017).35. MongoDB for GIANT Ideas|MongoDB. Available online: https://www.mongodb.com (accessed on
12 September 2017).36. GeoJSON. Available online: http://geojson.org (accessed on 12 September 2017).37. MongoDB Hosting: Database-as-Service by mLab. Available online: https://mlab.com/ (accessed on
12 September 2017).38. Build Amazing Native Apps and Progressive Web Apps with Ionic Framework and Angular. Available online:
https://ionicframework.com/ (accessed on 12 September 2017).39. GitHub—Ionic Team/ng-Cordova. Available online: https://www.npmjs.com (accessed on
12 September 2017).40. npm. Available online: https://www.npmjs.com (accessed on 12 September 2017).41. Pellicer, S.; Santa, G.; Bleda, A.L.; Maestre, R.; Jara, A.J.; Skarmeta, A.G. A Global Perspective of Smart Cities:
A Survey. In Proceedings of the Seventh International Conference on Innovative Mobile and Internet Servicesin Ubiquitous Computing, Taichung, Taiwan, 3–5 July 2013.
42. Arduino Playground—MQGasSensors. Available online: http://playground.arduino.cc/Main/MQGasSensors/#heater (accessed on 20 October 2017).
124
Books
MDPI

J. Sens. Actuator Netw. 2017, 6, 27
43. Cho, D.S.; Kim, J.H.; Manvell, D. Noise mapping using measured noise and GPS data. Appl. Acoust. 2007, 68,1054–1061.
44. Raspberry Pi—Teach, Learn, and Make with Raspberry Pi. Available online: https://www.raspberrypi.org/(accessed on 20 October 2017).
45. Sensor Model Language (SensorML)|OGC. Available online: http://www.opengeospatial.org/standards/sensorml (accessed on 12 September 2017).
46. Sensor Web Enablement (SWE)|OGC. Available online: http://www.opengeospatial.org/ogc/markets-technologies/swe (accessed on 12 September 2017).
47. Pierris, G.; Kothris, D.; Spyrou, E.; Spyropoulos, C. SYNAISTHISI: An Enabling Platform for the CurrentInternet of Things Ecosystem. In Proceedings of the Panhellenic Conference on Informatics (PCI),Athens, Greece, 1–3 October 2015.
c© 2017 by the authors. Licensee MDPI, Basel, Switzerland. This article is an open accessarticle distributed under the terms and conditions of the Creative Commons Attribution(CC BY) license (http://creativecommons.org/licenses/by/4.0/).
125
Books
MDPI

Journal of
Actuator NetworksSensor and
Article
User-Generated Services Composition in SmartMulti-User Environments
Vincenzo Catania, Giuseppe La Torre, Salvatore Monteleone, Daniela Panno and Davide Patti *
Department of Electrical, Electronic, and Computer Engineering, University of Catania, V.le A. Doria, 6,95125 Catania, Italy; [email protected] (V.C.); [email protected] (G.L.T.);[email protected] (S.M.); [email protected] (D.P.)* Correspondence: [email protected]; Tel.: +39-095-738-2385
Received: 6 July 2017; Accepted: 30 August 2017; Published: 1 September 2017
Abstract: The increasing complexity shown in Smart Environments, together with the spread of socialnetworks, is increasingly moving the role of users from simple information and services consumersto actual producers. In this work, we focus on security issues raised by a particular kind of services:those generated by users. User-Generated Services (UGSs) are characterized by a set of features thatdistinguish them from conventional services. To cope with UGS security problems, we introduce threedifferent policy management models, analyzing benefits and drawbacks of each approach. Finally,we propose a cloud-based solution that enables the composition of multiple UGSs and policy models,allowing users’ devices to share features and services in Internet of Things (IoT) based scenarios.
Keywords: user generated services; smart environments; IoT
1. Introduction
The possibility for everyone to create custom content and services, in a simple and reliableway, has been introduced in recent years and is currently supported by a plethora of web basedplatforms, such as IFTTT [1], OpenMashup [2], and APIANT [3] (formerly known as We-Wired Web).These solutions carry out the composition of services with two different approaches: (i) by aggregatingdata, existing services, and user’s defined tasks; and (ii) by simply creating new views of existingcontent. The results of these compositions can be referred to as User-Generated Services (UGSs) andUser-Generated Content (UGC), respectively [4,5].
The Internet of Things (IoT) vision [6], which emerged in recent years due to a convergenceof different communication/computing technologies, is leading to the diffusion of everyday-lifeInternet-capable objects, such as smartphones, Smart TVs, and health monitoring devices. Thus,IoT represents the ideal ecosystem for composite UGSs and UGC, making users able to generatenew content and services not only from scratch, but also gathering data from objects and theenvironment [7–9]. This process, however, may give rise to several security issues due to thecomposition of the service-related Access Control Policies (ACP). For example, when an applicationdeveloper assembles existing services that have their own security policies, he must ensure that theresultant policies do not conflict with the existing ones [10].
This scenario highlights the increasing importance that User-Generated Content and Services aregoing to assume in the short term. In particular, it is important to outline that there are substantialdifferences between traditional Web Services based on the Service-Oriented Architecture (SOA)paradigm and User-Generated Services, even more when the latter are integrated in an IoT scenario [11].In fact, while the first ones are “always on” and regulated by access control policies that usually donot need to be updated frequently, the second ones may be subjected to more frequent changes due tousers’ actions and context. Let us consider, for example, social networks: when users perform commontasks such as adding/removing content (photos, videos, etc.) or updating the list of friends, the related
J. Sens. Actuator Netw. 2017, 6, 20 126 www.mdpi.com/journal/jsan
Books
MDPI

J. Sens. Actuator Netw. 2017, 6, 20
policies change accordingly. Therefore, we can affirm that, unlike what happens for classical services,policies associated with UGC or UGSs may change very frequently. In addition, the access to a UGSmay be regulated by pieces of contextual information connected to the service owner.
Let us consider the following example of context-dependent access control policy: a user belongingto the group “colleagues” can automatically access my gallery via bluetooth when all the followingrules are satisfied: (i) My battery charge level is at least 35%; (ii) I’m at my workplace; and (iii) I’mnot driving. It is easy to imagine that the user’s context may change very rapidly and in a way thatimplies the continuous change of the current active policy for a device. This is just another exampleshowing how UGSs represent a new class of services that substantially differ from traditional ones.
In this paper, which extends our prior work [12], we first analyze how the composition of serviceswhose access control depends on context-aware policies further complicates the policy enforcement onthe resulting composite service. Then, we define three models of policy management that capture thedifferent possibilities available for UGSs. Finally, we demonstrate how a cloud-based approach canbe exploited to support such policy models using commonly available open-source components andstandard web technologies. The implementation of this approach has been built on top of webinos [13]platform, to which the authors contributed.
2. Reference Scenario
As the number of devices such as smartphones, tablets, in-car-devices and so on, increases,the whole electronic industry ecosystem is switching from “multi-user per device” to “multi-device peruser” environments. Adopting the terminology and concepts we introduced in the webinos project [7],the set of devices associated with a given user can be considered as virtually contained (registered)inside the user’s Personal Zone (PZ) and might also be shared with others, that is, registered inmultiple PZs.
Figure 1 shows two PZs belonging, respectively, to the users Alice and Bob. Alice’s PZ contains asmartphone and a camcorder while Bob’s contains only a Smart TV. Despite a single device that couldbe “shared” among several PZs, it is owned by a unique user that is responsible for its policies andwhose management may also be delegated to other users/entities. An example policy for Alice’s PZcould be the following:
Alice’s relatives are allowed to see her smartphone’s gallery pictures on their Smart TV when she isconnected through Wi-Fi.
Figure 1. A simple representation of Personal Area Networks.
Each user can set policies for devices registered in his/her PZ. In the case that a device is sharedamong multiple users (i.e., PZs) and its behavior is regulated by multiple policies (e.g., one foreach user), the one written by the owner takes priority over the others. For the sake of simplicity, in the
127
Books
MDPI

J. Sens. Actuator Netw. 2017, 6, 20
following, we will use the name of the PZ owner to refer to a generic device registered in his/herPZ. For example, a request from Carol is to be intended as a request coming from one of the devicesregistered in her PZ.
Many different issues could arise when services regulated by context-aware policies are composed.These issues may be experienced for instance considering the scenario depicted in Figure 2, in whichservices Videostream and Screenshot are provided by Alice to Bob and by Bob to Carol. In general:
• Videostream allows users to receive a video stream from Alice’s camcorder/smartphone;• Screenshot allows users to take snapshots of contents reproduced on Bob’s Smart TV.
Figure 2. An example of User-Generated Services composition: the Screenshot service can make use ofthe Videostream service to provide content.
Let us consider the following:
Example 2.1. Alice’s policies for Videostream service are:
1. Alice’s parents are always allowed to use Videostream service;2. Alice’s relatives are allowed to use Videostream service only when Alice is in Catania;3. Every other subject is not allowed to use Videostream service.
Moreover, Bob’s policies for Screenshot service are:
1. Only Bob’s house guests are allowed to use Screenshot service;2. Every other subject is not allowed to use Screenshot service.
Both Alice’s and Bob’s policies specify contextual constraints: Alice is willing to offer her servicetoward her relatives only if she is in Catania (so this policy depends on Alice’s context), and Bob’spolicy instead allows only people who are inside Bob’s house (so this policy depends on subject’scontext). Let us imagine that Bob invites Carol (Alice’s aunt) to his home to watch a video and supposethat Carol takes some screenshots of this video with her smartphone using the Smart TV providedservice. When Bob’s Smart TV receives a screenshot request from Carol, it checks its policies and allowsCarol’s smartphone to access the service, according to Bob’s policy. This scenario might raise someproblems if Carol tries to take screenshots of content owned by Alice. In this case, even supposingthat Bob (his Smart TV) is aware of Alice’s policies at the time that a request from Carol is received,it is not possible to enforce the request if Alice’s context information (i.e., location) is not available.In fact, Alice may consider her location as a “private” information or it could not be accessible at thatspecific moment.
If Bob decides to allow a Carol’s request only enforcing his policy (regardless of Alice’s decision),the situations listed in Table 1 may occur:
128
Books
MDPI

J. Sens. Actuator Netw. 2017, 6, 20
Table 1. Potential situation of conflict between Alice’s policy and actual data sharing.
# Alice’s Context Alice’s Policy Conflict?
1 A is in Catania C is A’s relative NO2 A is in Catania C isn’t A’s relative YES3 A isn’t in Catania C is A’s relative YES4 A isn’t in Catania C isn’t A’s relative YES
According to Alice’s and Bob’s policies, case 1 is the only that does not cause any conflict betweenAlice’s and Bob’s authorization decisions. On the contrary, the conditions considered in cases 2, 3, and4 lead to conflicting situations that Bob does not take into account Alice’s policies and related contextinformation at the enforcement time.
This is just one example of the issues that may arise when multiple UGSs are composed. In therest of the paper, we will analyze these issues and propose different solutions to cope with them.
3. Security Policy Issues in UGS Composition
The behavior of IoT Services (either traditional or user-generated) is regulated by security accesscontrol policies that restrict the access to services to external subjects, represented by applications orother services. In the UGSs scenario, when a user assembles existing services, he/she has to guaranteethat the policy of the composite service is coherent with policies of all the other involved services(the component services). For example, suppose that Bob wants to create a new service making use ofanother one provided by Alice. When Carol requires access to this new service, Bob cannot decidewhether to allow or deny Carol’s request only evaluating his policy: he also should know Alice’sdecision toward Carol’s request.
In order to avoid ambiguity, it is necessary to define the notation we adopted to describe ourcase studies.
Let D be the set of service providers di, for example, in the considered scenario, the devices of anIoT ecosystem. Let Si be the set services si,j, where si,j is the j-th service provided by di. Furthermore,let Pi be the set of policies pi,k, where pi,k denotes the set of policies for all the services provided by thedevice di. Finally, let Ci,j be the set of the component services used to produce the composite service si,j.
For example, Figure 3 shows a graph representation for a user-generated servicecomposition where:
• Each node is a service provider, e.g., a device owned by a user providing/consuming services;• Each edge from dx to dy indicates a service provided by dx that is requested by dy.
Note that s2,1 is a composite service having s1,1 as component service, that is, C2,1 = {s1,1}.In particular, three main aspects must be considered in the UGSs composition with regard to the accesscontrol policy. These aspects are:
• Dynamicity: service related policies may change frequently;• Context Awareness: policies may depend on contextual information (e.g., user’s context);• Degree of Privacy: users could want to set restrictions on the disclosure degree of their policies
towards other subjects (users/services).
These features that characterize UGSs composition may cause new issues to arise as comparedwith the traditional service composition.
129
Books
MDPI

J. Sens. Actuator Netw. 2017, 6, 20
Figure 3. Graph formal representation of User-Generated Services (UGSs) composition.
3.1. Dynamicity
In fast changing environments, to promptly react to policies’ changes, a security policyinfrastructure with the following features is required:
• It should be able to update/synchronize composite services’ policies when component services’policies change. For example, referring again to Figure 3, if the policies related to service s1,1
change, it is necessary to synchronize the policies of all composite services that have s1,1 as acomponent service (in this case only s2,1);
• It should define efficient strategies to ensure that any change in component services’ policies doesnot lead to conflicting authorization decisions taken by the security policy of the composite service.
In this perspective, already discussed techniques based on static composition of policiessuch [10,14] may not be suitable for highly dynamic environments.
3.2. Context Awareness
The use of policies referring to contextual information further complicates the authorizationdecision process to grant access to composite services. In the policy example related to Figure 2, Bobcan take a conflict-free decision against a Carol’s request only if he knows Alice’s context. However itis not available to Bob since only Alice knows her context and it may be changed at the time ofCarol’s request. Contextual policies, therefore, add additional difficulties in user-generated servicecomposition. In particular, the policy manager of the composite service provider needs to know remotecontextual information from which the component services’ policies depend on. We call this “contextsynchronization problem”.
3.3. Degree of Privacy
UGSs composition can lead to policy disclosure. To avoid this, the service provider that assemblesa composite service, referred in the following as intermediate provider, has to ensure that its policy iscompliant with all the component services’ policies. This is possible only if he knows all the policiesthat represent the behavior of each component service toward all the possible subjects. In many cases,especially in the UGS scenario, this could be a serious privacy problem since policies contain sensitiveinformation that the owner of the component service might want to disclose partially (partial privacy)or not at all (full privacy) to other users. If all the component services adopted full privacy on theirpolicies, the intermediate service provider would be unable to ensure any compliant authorizationdecision against a composite service’s access request. Similar problems might arise also in the case ofpartial privacy. In addition, contextual user information could be in turn under partial or fully privacyrestrictions, as it often refers to sensitive user’s data.
4. Proposed Policy Models
By definition, UGSs are intended as composed services provided by different users. This impliesthat one of the main issues to address is to ensure the desired privacy criteria to each user involvedin the composition process. Ensuring privacy does not only mean specifying a policy to decide whocan see content (or use a service), but it also means to protect that policy. For example, in the caseof UGC (e.g., in Facebook), the policy “I do not want John to see one of my photos”, apart from
130
Books
MDPI

J. Sens. Actuator Netw. 2017, 6, 20
preventing John to see that content, should imply that John will not be able to to know that he is notallowed to see one of my photos. This problem is even more significant in the case of context-awarepolicies, where the result of the enforcing may depend on sensitive information whose privacy must beprotected. In the following, we introduce three approaches that, taking into account different degreesof privacy, can be used to cope with issues related to dynamicity and context-awareness. Dependingon how the policy content is distributed and managed across the devices, we can distinguish the threedifferent models described in the following subsections. These three policy enforcement techniqueswere primarily designed to preserve privacy (both policy content and user context). They alsoconsider some approaches to cope with the dynamicity of the user context which directly impacts onthe enforcement.
4.1. Distributed Policy Enforcement
Distributed Policy Enforcement (DPE) is the solution we propose in the case of full privacy degreefor the component services’ policies. The DPE approach is based on a distributed algorithm for policyenforcement that involves all the providers (partners) that take part in the service composition process.In this way, each partner is characterized by a “non disclosure” policy strategy that prevents thecomposite service provider from knowing partner’s policies. Using DPE, an authorization decision todeny access to a service is taken only if the individual decisions of all partners have been collectedand at least one of them is of the type Deny. The Policy Composition Algorithm (PCA) is thereforeof type Deny-Override. When a provider receives an access request to its composite service, it firstlyevaluates the request locally and if necessary forwards this request to all the providers involved in theservice composition.
We can see in detail how this method works considering Figure 3. Let us suppose d2 is Bob’sSmart TV, which is composing a service s1,1 offered by Alice camcorder d1 to provide the Screenshotservice s2,1. When Carol requires through her smartphone d3 access to s2,1, the Policy EnforcementPoint (PEP) of Bob’s PZ firstly enforces local policy to decree whether Carol is allowed, and if not, itstraight out rejects the request. On the contrary, if Bob’s policy allows Carol, Bob’s PEP forwards theincoming request to Alice’s PEP (on behalf of Carol). At this stage, Alice’s policy manager enforcesthe local policy and evaluates whether Carol can indirectly access s1,1. Finally, Alice’s PEP sends thedecision to Bob’s PEP, which issues (or not) the service s2,1.
As direct consequence, this method is agnostic to dynamic policy changes of component services.Any change, in fact, is taken into account thanks to the distributed nature of the policy enforcement:each partner takes part in the final decision on the basis of its policy decision. This technique alsoworks well in context based policy systems: the authorization decision of each service’s partner willtake into account also any other useful contextual information. From a practical point of view, there isa main drawback: this approach may lead to a composite service that could never work due to conflictsamong component service’s policies. In addition, from a performance point of view, an overheadis introduced by every enforcement. For example, when the intermediate service node forwards anaccess request to the partners, it has to transfer to them all the requestor’s identity information plus theinformation about the required resources. On the other hand, there are no performance degradationissues due to policy or context synchronization.
4.2. Local Policy Enforcement
When providers’ policies do not contain sensitive information, they could be stored and evaluatedby intermediate providers. Local Policy Enforcement (LPE), unlike DPE, requires policy evaluationonly for those service providers that supply a composite service. This means, for instance, that theintermediate provider d2, in addition to its set of policies P2, could store the set P1 of the componentservice s1,1 and evaluate it whenever a request is received (such as from d3).
In general, an intermediate provider who stores all component’s sets of policies could composethem and then, for each access request, evaluate the composite policy. As already mentioned,
131
Books
MDPI

J. Sens. Actuator Netw. 2017, 6, 20
deriving from several component policies a composite policy in which there are neither conflictsnor redundancies is quite complex. For this reason, in a UGS scenario, where policies are dynamic andmay change frequently, we can affirm that evaluating each single policy is preferable to extracting acomposite policy. In this kind of evaluation, an authorization decision that denies service access to asubject is taken if at least one of the component policy returns a “deny” response. The PCA algorithmis therefore of type Deny-Override.
As shown in Section 2 (policy example of Figure 2), given that Bob knows that when Alice isin Catania she is willing to provide Videostream service to Carol, he cannot know at the enforcementtime where Alice is and thus he cannot allow or deny Carol. Therefore, to evaluate the policy of acomponent service, an intermediate provider must know the remote context. Two different approachesenable policy enforcement by intermediate providers when context-dependent policies can be adopted.The first approach assumes that Bob stores Alice’s policy set that contains n context-dependent policies.However, only a subset of these policies is currently active: those related to the current Alice’s context.Thus, Alice sends Bob only information about her context and Bob uses this information to understandwhich of the policies contained in the policy set are active (applicable). This exchange could happenaccording to two strategies: (a) Alice tells Bob her context information whenever her context changes;(b) Bob asks Alice her context information whenever he receives a request (e.g., from Carol). If Alice’scontext changes frequently, it could be better to adopt approach (b). On the contrary, if Alice’s contextrarely changes, the proposed variant (a) may be preferable. The second approach considers that Bobknows only the current active subset of Alice’s policies. In this case, Alice sends to Bob those policiesenabled by her context.
Since LPE expects that composite service providers keep component services policies, it isnecessary to update these every time they change. As shown in Figure 4, if n users (providers)require the s1,1 service in their composition process, Alice’s policy manager has to synchronize thepolicy in all the involved providers each time the policy for s1,1 is changed.
Synchronization could be a burdensome task as a provider (e.g., Alice) should maintaininformation about all the “follower” providers, and it is even more problematic if the providerthat supplies the service is a resource-constrained device.
Figure 4. Service provisioning to multiple devices.
In those cases when not only the policy but also the context relative to a service provider maychange, knowing these policies might be not enough to be able to evaluate them. As aforementioned,in both of the two approaches, Alice needs to realize when her context changes so that she canadvise Bob about sending him her actual policy/context information. Therefore, there is the needto automatically spot every context change. For this purpose, we propose an extension of XACML(eXtensible Access Control Markup Language) architecture (Figure 5) that introduces the ContextListener component. The choice of using XACML as a basis for this work is mainly due to the flexibilityand fine grained levels of customizability given by this standard. In detail, the Context Listener
132
Books
MDPI

J. Sens. Actuator Netw. 2017, 6, 20
reads the policy obtained through the PAP (Policy Administration Point) module and stores bothcontext-dependent parameters and relative boundaries. For example, if a policy rule was
“Permit if battery level is greater than 35%”,
the Context Listener will store “battery_level” as a parameter and “greater than 35%” as related boundary.Using this information, the Context Listener can reorganize a user’s policy on the basis of his/hercontext. In particular, the current values of context-dependent parameters affect the policy selection.For example, the pseudo code reported below may represent the logic followed by the Context Listenerto choose the current policy:
if (context_params1 < boundary1)current_policy = P1
if (context_params2 > boundary2)current_policy = P2
Thus, the Context Listener periodically polls the PIP (Policy Information Point) module to obtain actualvalues for the contextual parameters (such as current battery level) and checks whether these valuesremain within the boundaries defined by the policy. When at least one of the parameters, included inthe rule, exceeds its boundary, the Context Listener communicates to interested intermediate providersthe current user’s context or policy.
In summary, LPE can be adopted if there are no privacy concerns, but the synchronization processrequires an overhead that, as we will show in Section 5, may be not acceptable in the case of deviceswith reduced performance as, for example, mobile phones.
Figure 5. XACML (eXtensible Access Control Markup Language) extension with Context Listener.
4.3. Policy’s Context Obfuscation
Local Policy Enforcement requires distribution of policies or parts of them. The process toexchange this kind of data requires some mechanisms to assure content authenticity and avoidtampering. Privacy is the other main aspect to cope with in situations such as this one, where personalinformation (i.e., contextual data) are exchanged. In fact, the policies themselves are privacy sensitiveinformation because they can contain users’ preferences (i.e., rules that are applied to specific subjects)and may depend on context parameters (e.g., users’ location details). Policy Information Points areallowed to elicit, from remote providers (i.e., users’ devices), personal contextual data in order to allowpolicy enforcement. This means that, knowing user’s policy and the relative decision toward a request,it could be possible to retrieve information about user’s context. This obviously leads to privacy issues.
In literature, the problem of policy’s content protection is faced in different works as, for example,in [15] where the authors propose techniques based on encryption. Our proposal relies on obfuscationmethods in order to mask sensitive information sending the policy structure in plain text.
133
Books
MDPI

J. Sens. Actuator Netw. 2017, 6, 20
Suppose that Alice chooses the following policy for the Videostream service:
1 <policy-set id="Alice’s policyset">2 <policy algorithm="permit-overrides">3 <target>4 <subject param="cert" match="Carol.cert"/>5 <resource param="service" match="videostream"/>6 </target>7 <rule id="5ABE" effect="permit">8 <condition>9 <context param="location" match="home"/>10 </condition>11 </rule>12 <rule effect="deny"/>13 </policy>14 <policy>15 <target>16 <subject id="F3MK"/>17 </target>18 <rule effect="deny"/>19 </policy>20 </policy-set>
Since this policy depends on Alice’s context (specifically on Alice’s location), giving it in plain-textto Bob could give rise to privacy issues: Bob, in fact, knowing the policy, could realize that Alice isat home at the instant when Carol is allowed to get Videostream service. This information does notconcern Bob: he only should know that Carol will be able to get Videostream service (indirectly throughScreenshot service) when a certain Alice’s context will be active, but he should not know which one it is.The policy stored by Bob’s devices would be the following:
1 <policy-set id="Obfuscated Alice’s policyset">2 <policy algorithm="permit-overrides">3 <target>4 <subject param="cert" match="Carol.cert"/>5 <resource param="service" match="videostream"/>6 </target>7 <rule id="5ABE" effect="permit" obfuscated>8 <condition>9 <context param="E67QF1" match="AR7MG6"/>10 </condition>11 </rule>12 <rule effect="deny"/>13 </policy>14 <policy algorithm="deny-overrides">15 <target>16 <subject id="F3MK" obfuscated/>17 </target>18 <rule effect="deny"/>19 </policy>20 </policy-set>
In this way, using LPE, Alice will transfer to Bob the pair < E67QF1, AR7MG6 > representingher context, instead of the sensitive information < location, home >.
134
Books
MDPI

J. Sens. Actuator Netw. 2017, 6, 20
4.4. Partial Disclosure Policy Enforcement
Describing DPE and LPE, we pointed out some benefits and drawbacks of both solutions.DPE solves problems related to dynamic policy/context changes and privacy issues related to policydisclosure, but it could be very difficult to generate a new service without any knowledge aboutpolicies related to component services. This, in fact, may lead to having composite services that do notwork properly. For instance, if Bob decides to provide s2,1 only after 5:00 p.m. without knowing thatAlice is willing to provide s1,1 only before 3:00 p.m., his service will never work. On the other hand,with LPE approach, intermediate providers know component policies: this could involve privacyproblems (as discussed in previous sections), but it represents the best way, for an intermediateprovider, to supply a working service. For these reasons, we want to introduce a new approachthat can be considered as somewhere in between DPE and LPE: we call it Partial Disclosure PolicyEnforcement (PDPE).
According to the idea behind PDPE, when an intermediate provider wants to supply a compositeservice to a set of known subjects, he can obtain from the component service provider not the wholepolicy but only the information regarding these subjects. PDPE thus consists of two phases:
1. the initialization phase, in which an intermediate provider (Bob) can “negotiate” the policydisclosure with the component provider (Alice) requiring only the policy’s information toward apre-determined set of subjects;
2. the incremental update phase, in which the intermediate provider requires additional informationevery time a new subject (which is not included in the original set of the considered subjects)requires access to the service.
The first phase can be optional as an intermediate provider could not negotiate the policydisclosure for a first set of subjects building this initial set when a subject requires the service thefirst time.
For example, suppose Bob does not know Alice’s policy for s1,1. When Carol requires s2,1 Bobinforms Alice who sends back to Bob the piece of her policy regarding Carol. From that momentonwards, Bob stores this partial policy, enforcing it every time Carol requires s2,1 service. Whenever anew subject (e.g., David) requires s2,1, Bob repeats the procedure, and so on. Since even partial policiesmay depend on user’s contextual information, PDPE employs the same approaches shown in Figure 5to overcome problems related to policy/context changes. In addition, it might apply the obfuscationtechnique already discussed previously.
4.5. Considerations
The proposed approaches mainly differ in the amount of policy’s information revealed bycomponent service providers to intermediate providers. However, all of the discussed approachescan be combined to meet different users’ security requirements. Consider the scenario in which Bobwants to provide a service that shows a Google Map decorated with his and his friends’ preferredrestaurants. This scenario is represented in Figure 6. Alice and David provide two services that giveinformation about their preferred restaurants. We can note that all the considered approaches areemployed: Google, using PDPE, gives Alice only a piece of its policy (only the parts related to thosesubjects that Bob wants to consider), Alice, indeed, does not bother about privacy issues and gives Bobher whole policy (LPE). Finally, David does not want Bob to know his policy, so he adopts DPE.
135
Books
MDPI

J. Sens. Actuator Netw. 2017, 6, 20
Figure 6. An example of hybrid service composition scenario in which sz,1 composes all the otherprovided services, i.e., Cz,1 = {Maps, sx,1, sy,1}.
5. A Cloud Approach
5.1. Mobile Constraints
As aforementioned, the broad diffusion of IoT devices, combined with the presence of platformsable to simplify interactions among them, represent the starting point for the spread of User-GeneratedServices. In some cases, these services could strictly depend on devices’ features and local context.If we consider, for example, the scenario depicted in Section 2 we can find out that the service created byAlice is provided thanks to the presence and the features of her smart device. This scenario is just oneexample that points out that the next step is represented by those services that are not only generatedbut also provided by users through their devices (User Provided Services or UPSs). Limitations maybe due to the utilization of kind of devices that are not supposed to work as providers. This is thecase of smartphones and handsets in general. In fact, it is possible to recognize problems of at leastthree categories, which are performance, scalability and presence. For what concerns performance, itis clear that providing a service that is resource consuming (e.g., in terms of CPU time, memory andbandwidth) may reduce the usability of devices’ main functionalities. Scalability issues are related tothe number of users that can concurrently access our self-provided service.
The last point regards presence: some devices could be not reachable in any moment due to atemporary lack of connectivity (for example, a car or a smartphone inside a tunnel or in a place withoutcoverage) or just because they are running out of battery. As is known, devices might provide servicesor contents and can regulate access to them via context-based policies. In the first case, the devicepresence is obviously needed to guarantee the service availability, and, in the second case, it is neededto gather the context information without which the policy to access or handle the remote contentcannot be enforced. It is also important to notice that the problems described in previous sections stillremain. In fact, it is difficult to properly handle policy disclosure and cope with the synchronizationprocess of context and policy, especially in the case of many actors.
5.2. Architecture
In order to cope with the issues described in previous sections, we propose another structurethat differs from the one depicted in Figure 3, introducing a new component, namely service mediator.The structure of this architecture is shown in Figure 7.
136
Books
MDPI

J. Sens. Actuator Netw. 2017, 6, 20
Figure 7. Cloud-based architecture for UGSs composition management.
This architecture still allows using the already described policy models and their combinations:however, it is important to point out that, in this case, the policy is enforced by components in thecloud and not by intermediate providers.
The role of the service mediator, which is intended to be a cloud component, is manifold; in fact,it is possible to recognize at least the following functionalities: (a) synchronizing user’s preferences,context information and policies; (b) resolving problems related to “device presence”; (c) reducingthe disclosure of sensitive data, context information and policies; (d) providing unified servicediscovery; (e) integrating logic to switch among different policy and context exchange approaches;and (f) enhancing scalability and performance.
One of the main advantages of a cloud approach regards synchronization (a). In fact, compared tothe peer-to-peer model presented in the first part of this paper, a cloud based architecture simplifies theprocess of exchanging and keeping up to date the information needed. This might be done, for example,through a publish/subscribe notification system. Furthermore, such a publish/subscribe mechanismcould be useful to resolve presence related issues (b), enabling users and devices to leave online recordsof taken decisions, context information and other data, also when they are disconnected. This problem,as mentioned before, is very relevant in the case of constrained devices. If we consider, for example,the scenario presented in Section 2 adding the clause that Alice allows Bob to record her videostreamand reuse it with the aforementioned restrictions, the knowledge of Alice’s location becomes veryimportant. For obvious reasons, it is not possible to know Alice’s location at any moment (e.g., all herdevices ran out of battery), but, with the cloud approach here presented, it is possible to communicateand preserve context information, e.g., the last location available, for a more accurate evaluation.
The cloud approach also limits disclosure of personal data (c). In fact, the service mediatorcomponent could be the only point where sensitive information is stored. In addition, it enforcesremote access requests on behalf of the remote service provider with the advantage of limiting exchangeof policies, contextual information and sensitive data.
Devices can expose services registering them in the cloud. There the service mediator can: makethem discoverable (d), manage their status and, as already mentioned, regulate remote access to themthrough policies. The service mediator could also contain some logic in order to switch between thedifferent policy management models described. This smart switching system can allow users to changethe desired degree of privacy at run time.
The gain in terms of scalability and performance (f) is due to the fact that the service provider willnot be directly contacted by clients because exposed services will be accessed by the service mediator.It will be able to multiplex a service or serialize access to it in the case he cannot directly provide thatservice. Considering again the Videostream service, it is easy to imagine that a solution like the oneproposed—with a server that acquires the videostream (service provider) and multiplexes it to otherconsumers—can reduce the provider’s workload.
137
Books
MDPI

J. Sens. Actuator Netw. 2017, 6, 20
As a demonstrator prototype of the proposed approach, a policy management component hasbeen implemented through the webinos foundation platform in order to expose devices’ features toother devices registered in the virtual area called Personal Zone (PZ). The PZ has the main role ofproviding, in a simple manner, access to local and remote services, thus creating also an abstractionfrom underlying communication technologies. In particular, the approach proposed in webinos’ makesuse of the architecture depicted in Figure 8. In this architecture, the component called Personal ZoneHub (PZH) implements the behavior of the service mediator.
Figure 8. Webinos general architecture.
The PZH is the element in which the devices belonging to a PZ are registered. It enables thecommunication between devices of the same or a different PZ, allows the discovery of other PZHsand manages the synchronization process (e.g., of user’s preferences, policy and context data). A PZHalso controls security aspects. In fact, it is the certificate authority that issues certificates for eachPZP registered in a PZ. These certificates allow mutually authentication and also encryption of themessages exchanged among devices in the zone.
The other main component of webinos architecture is the PZP that runs on each webinos enableddevice and manages the communication between the device and the main hub (PZH). The PZP alsostores the information that should be synchronized with the hub in the case it is not reachable in orderto start the synchronization process when the PZH again becomes available. The PZP is responsible forthe local discovery of features/services, accessible through a set of APIs (Application ProgrammingInterfaces) that expose some capabilities of the underlying Operating System.
From this description, it is possible to notice that the structure proposed by webinos well suitsthe cloud approach where the service mediator is an extension of the PZH able to manage not onlysecurity and synchronization aspects but also service multiplexing. Choosing webinos as a basis forour work made it possible to move the focus on privacy/security issues, removing the necessity ofimplementing a new system from scratch to synchronize policies, context information and user’spreferences. Furthermore, webinos provides full specifications for over 30 APIs to manage, for example,authentication, discovery of devices and services, context, contacts, filesystem, media content andstreams, sensors and actuators, simplifying the creation of multi-user/multi-device/multi-domainapplications in several Operating Systems, such as Android, Windows, MacOs, GNU/Linux, ChromeOS and Firefox OS [16].
The webinos platform provides privacy protection and access control features to meet the privacyand security requirements of web applications and users. This means protecting against malware andother users who may attempt to access more data than they should or simply avoid the unnecessary
138
Books
MDPI

J. Sens. Actuator Netw. 2017, 6, 20
disclosure of personal data. To satisfy these requirements, webinos relies on the strong identification ofweb applications, users and devices, combined with a least-privilege access control, based on XACML.It is an OASIS standard that describes: (i) an XML (eXtensible Markup Language) representation forboth a policy language and an access control decision request/response language, and (ii) a data-flowmodel for policy enforcement and relative involved actors. In webinos, the XACML architecture hasbeen adapted using PrimeLife extensions [17], allowing for making access control decisions based onboth the request context and user preferences.
The root element defined by XACML is a PolicySet that is made up by both a set of policies(containing at least one policy) and Policy Combination Algorithms (PCA) that take the authorizationdecision from each policy as input and apply some standard logic to come up with a final decision.Each XACML policy is in turn made up of a Target and a set of Rules.
A Target is basically a set of simplified conditions for the Subject, Resource and Action that mustbe met for a PolicySet, Policy or Rule to apply to a given request. Each Rule represents the core logicfor a policy, and it is made up of a Condition (which is a boolean function and may contain nestedsub-conditions) and an Effect (a value of Permit or Deny that is associated with successful evaluationof the Rule).
The Data-flow model introduced by XACML is shown in Figure 9. In short, a Policy EnforcementPoint (PEP) is responsible for intercepting a native request for a resource and to forward this to theContext Handler (CH). The CH will form an XML request based on the requester’s attributes, theresource in question, the action, and other information pertaining to the request. The CH will thensend this request to a Policy Decision Point (PDP), which will look at the request and some policythat applies to the request, and come up with an answer about whether access should be granted.That answer (in XML format) is returned to the Context Handler, which translates this response to thenative response format of the PEP. Finally, the PEP, based on the response, allows or denies access tothe requester. A more detailed description about XACML is provided by [18] while a description ofwebinos is presented in [19].
The object model depicted in Figure 9 shows the main components of the webinos policyframework. Both the PZP and PZH enforce policies using standard XACML components,supplemented by:
• The Decision Wrapper creates the initial policy enforcement query based on incoming requests;• The Access Manager makes the final decision by combining pieces of information from XACML
access control and Data Handling Decision Function (DHDF);• The DHDF Engine provides privacy and data handling functionalities;• The Request Context manages all contextual information; it stores all the data and credentials
released by a user in a given session;• The PDP Cache (PDPC) stores PDP decisions that could be shared among personal devices.
139
Books
MDPI

J. Sens. Actuator Netw. 2017, 6, 20
PIP
Context Handler PAP PDPC
PZP
PDP
Data Reader
Request Context
Credential System
Obligations
PEP
DHDF Engine
Access Manager
Decision Wrapper PZP / PZH
Access Requestor
RemoteAccess
Requestor
Overlay Network
PZ’s copy ofPAP / PDPC / PIP
Figure 9. XACML-based Data-flow model of webinos.
5.3. Considerations on Design Choices
This work brings together two innovative aspects related to the world of next-generation services.The first is to imagine an extension of the concept of User Generated Content to services, therebydefining User Generated Services as services that are both directly generated and provided by users,for example through their devices (e.g., smartphone, TV, and car). The possibility of composingservices to create new ones is certainly one of the key aspects of the SOA paradigm. In the case ofUGSs, the composition of multiple services provided by different users introduces a number of privacyissues that have been the main focus of this work. In particular, the management of access control andprivacy of a service is managed through policies that, in the case of composite services, are in turncomposed, with the risk of creating inconsistencies or conflicts that may invalidate user preferences.The methods presented in previous sections are thought to mitigate the impact that fast changinguser-centered environments, characterized by the presence of UGSs and the manipulation of sensitivedata, may suffer from not as fast or approximate policies’ updates. In facts, when existing services areput together, it is necessary to guarantee that the policy of the resulting composite service is coherentwith policies of all the component services to avoid conflicting authorization decisions taken by thesecurity policy of the composite service.
The second innovative aspect concerns the possibility to have service access governed bypolicies that depend on the user’s context. It is important to consider that changes in user-centeredenvironments are usually reflected in a physical (e.g., position and speed) and a logical (e.g., preferencesand contacts in social networks) context, each of which contributes to increasing the dynamics to takeinto account while composing services. This introduces a further complexity in policy enforcement,as it is necessary to know the context of all the users involved in the composition of a service inorder to decide whether or not to grant access to that service. In addition, due to the fact that thecontext of a user is characterized by a strong variability, applying caching strategies is not easy sincepolicy constraints may change along with the context itself. For these reasons, we have consideredimplementing strategies for composing UGS that consider variations in the context of the usersinvolved in the composition.
Then, it was important to consider the spread of constrained devices that are part of everydaylife. To expose UGSs within these devices, it was necessary to take into account different factors, andin particular, the fact that resources needed to expose/exploit UGSs, as far as possible, should not
140
Books
MDPI

J. Sens. Actuator Netw. 2017, 6, 20
compromise the normal functioning of the device. The cloud-based solution, proposed in this section,has been designed to overcome these limitations regarding performance, scalability, and presence(the latter, in terms of power consumption and network coverage) and to exploit the other policymodels introduced in this work. Finally, although the proposed methods introduce an overhead dueto the transfer of policy or context information, they provide greater security and privacy protection inscenarios likely to become common over the next few years.
6. Related Work
The scientific interest in UGSs and UGC is growing in these last years. In [5], the authorspresented a comprehensive survey of the state-of-the-art UGSs and defined UGSs by comparison withthe concept of UGC, describing advantages and limitations of each approach. Ref. [4] introduces someguidelines to support users in the services’ creation and management. In [20], the requirements to letthe vision of the “super prosumer” become true are investigated. In particular, they review the currenttechnologies that enable an easy creation and discovery of mobile services and list the identifiedrequirements for UGSs. The interest in this topic is further motivated by the result of diverse studiesthat evaluate, for example, the impact of UGSs and especially UGC on society [21,22], tourism [8],and advertising [23]. With regard to aspects explicitly focused on service composition, some workswere proposed to prevent conflicting behaviors when policies are composed. In [14], authors proposea security policy composition mechanism which semi-automatically derives the policy consistencyrules. In addition, Ref. [10] presents an approach that merges existing policies and restrictions into anew policy to remove redundancy and inconsistencies. It is important to point out how the process ofpolicy composition might be very expensive from a computational perspective; as a consequence, thesesolutions can only be applied if we assume static policies (i.e., not changing over the time), so thatthe composition process can be performed only once off-line, when the composite service is made up.Another approach, proposed in [24], adopts a filtering phase and a differential evolutionary basedalgorithm to compose services taking into account service providers’ mobility.
The composition and deployment of UGSs has also been investigated from the IoT perspective.In [11], the authors proposed an infrastructure to enable developers and designers to dynamicallyquery, select, and use running instances of real-world services. More specifically, Ref. [25] analyzed thenotion of ubiquitous services of IoT in connection with their usage in the context of social networks.Other works focused on particular domains of IoT services, such as [26], introducing an interconnectionframework for mobile Health (mHealth), or [27,28] where the composition service is enabled by meansof a semantic ontology. Some important contributions in this field have been directed through thedefinition of policy models suitable for context-aware scenarios, as in [28–30]. Access control systemsshould be able to support and understand existing and new context information types in order toaddress access control requirements. To make this possible, the authors of [31] presented an extensibleaccess control solution based on XACML (eXtensible Access Control Markup Language) makingit able to understand new attributes’ data types and the functions that are used in the policy toevaluate the users’ requests. Another interesting work is [32], which proposed an access control policymodel based on context and the role that can be appropriate for web services. The model takes intoaccount contextual information to define and perform access control policies. It works with contextualinformation from users, environments and resources to execute dynamic role assignment and constrainthe authorization decision. Another approach to address conflicts in context-aware policies is presentedin [33], where authors propose a framework in which the policy is chosen at run time based on contextinformation. Recently, the authors of [34] presented a generic framework, OntCAAC (Ontology-basedContext-Aware Access Control), modelling dynamic contexts and corresponding access control policiesexploiting semantic technologies.
In conclusion, several works have addressed typical problems related to UGSs such as dynamicpolicy change and context-aware policies; however, to the best of our knowledge, none of these workshas yet taken into account the kind of issues assuming the perspective of UGSs composition as the
141
Books
MDPI

J. Sens. Actuator Netw. 2017, 6, 20
main challenge. The main contribution of this work is to introduce different models that are explicitlyfocused on a composite service scenario and present a concrete architecture that could address most ofthe critical issues described here.
7. Conclusions
The composition of User-Generated Services in an IoT environment introduces several securityrelated challenges. In this work, three different approaches have been analyzed showing the availabletrade-off in policy management. Finally, a cloud based architecture that is flexible enough to embracethe different policy enforcement models has been introduced, together with a prototype based onthe webinos foundation platform. Future work will focus on the support of those constrained devices,such as very simple sensors, that can be identified but cannot hold policies to regulate access to theirfeatures and data.
Acknowledgments: The research described in this paper was initially funded by the EU FP7 webinos project(FP7-ICT-2009-05 Objective 1.2). The extension of this work has been partially supported by the Italian Ministryof Education, University and Research on the “PAC” call funding the “SERVIFY (SERVIce FirstlY)” project, Ref.PON03PE_00132_1, CUP B72F14000300005.
Author Contributions: All authors contributed extensively to the work presented in this paper.Giuseppe La Torre, Salvatore Monteleone and Davide Patti wrote the code and performed experiments;Vincenzo Catania and Daniela Panno refined the initial study. All authors discussed enhancements, resultsand implications, wrote the manuscript and commented on it at all stages.
Conflicts of Interest: The authors declare no conflict of interest. The founding sponsors had no role in the designof the study; in the collection, analyses, or interpretation of data; in the writing of the manuscript, and in thedecision to publish the results.
References
1. IFTTT. IF This Then That. 2011. Available online: http://www.ifttt.com (accessed on 5 July 2017).2. OMA. Open Mashup Alliance. 2009. Available online: https://en.wikipedia.org/wiki/Open_Mashup_
Alliance (accessed on 5 July 2017).3. APIANT. The Cloud Integration and Automation Platform | APIANT. 2016. Available online: https://apiant.
com (accessed on 5 July 2017).4. Jensen, C.S.; Vicente, C.R.; Wind, R. User-Generated Content: The Case for Mobile Services. Computer 2008,
41, 116–118.5. Zhao, Z.; Laga, N.; Crespi, N. A survey of user generated service. In Proceedings of the 2009 IC-NIDC IEEE
International Conference on Network Infrastructure and Digital Content, Beijing, China, 6–8 November 2009;pp. 241–246.
6. Xia, F.; Yang, L.T.; Wang, L.; Vinel, A. Internet of Things. Int. J. Commun. Syst. 2012, 25, 1101–1102.7. Fuhrhop, C.; Lyle, J.; Faily, S. The webinos Project. In Proceedings of the 21st International Conference
Companion on World Wide Web, WWW ’12 Companion, New York, NY, USA, 16–20 April 2012; pp. 259–262.8. Marine-Roig, E.; Clavé, S.A. Tourism analytics with massive user-generated content: A case study of
Barcelona. J. Destin. Mark. Manag. 2015, 4, 162–172.9. Ventura, D.; Monteleone, S.; La Torre, G.; La Delfa, G.C.; Catania, V. Smart EDIFICE—Smart EveryDay
interoperating future devICEs. In Proceedings of the 2015 International Conference on CollaborationTechnologies and Systems (CTS), Atlanta, GA, USA, 1–5 June 2015; pp. 19–26.
10. Speiser, S. Policy of Composition = Composition of Policies. In Proceedings of the 2011 IEEE InternationalSymposium on Proceedings of the Policies for Distributed Systems and Networks (POLICY), Pisa, Italy,6–8 June 2011; pp. 121–124.
11. Guinard, D.; Trifa, V.; Karnouskos, S.; Spiess, P.; Savio, D. Interacting with the SOA-Based Internet of Things:Discovery, Query, Selection, and On-Demand Provisioning of Web Services. IEEE Trans. Serv. Comput. 2010,3, 223–235.
142
Books
MDPI

J. Sens. Actuator Netw. 2017, 6, 20
12. Catania, V.; La Torre, G.; Monteleone, S.; Panno, D.; Patti, D. User-Generated services: Policy Managementand access control in a cross-domain environment. In Proceedings of the 2015 International WirelessCommunications and Mobile Computing Conference (IWCMC), Dubrovnik, Croatia, 24–28 August 2015;pp. 668–673.
13. Catania, V.; La Torre, G.; Monteleone, S.; Patti, D.; Vercelli, S.; Ricciato, F. A novel approach to Web of Things:M2M and enhanced javascript technologies. In Proceedings of the 2012 IEEE International Conference onGreen Computing and Communications (GreenCom), Besancon, France, 20–23 November 2012; pp. 726–730.
14. Satoh, F.; Tokuda, T. Security Policy Composition for Composite Web Services. IEEE Trans. Serv. Comput.2011, 4, 314–327.
15. Dong, C.; Russello, G.; Dulay, N. Shared and Searchable Encrypted Data for Untrusted Servers. In Data andApplications Security XXII; Lecture Notes in Computer Science; Atluri, V., Ed.; Springer: Berlin/Heidelberg,Germany, 2008; Volume 5094, pp. 127–143.
16. Webinos. Webinos Developer Portal. Available online: https://developer.webinos.org (accessed on5 July 2017).
17. Ardagna, C.A.; De Capitani di Vimercati, S.; Paraboschi, S.; Pedrini, E.; Samarati, P. An XACML-basedprivacy-centered access control system. In Proceedings of the first ACM Workshop on Information SecurityGovernance, Chicago, IL, USA, 13 November 2009; pp. 49–58.
18. Moses, T. Extensible Access Control Markup Language 2.0 Specification Set. Available online:http://www.oasis-open.org (accessed on 5 July 2017).
19. Lyle, J.; Monteleone, S.; Faily, S.; Patti, D.; Ricciato, F. Cross-platform access control for mobile webapplications. In Proceedings of the 2012 IEEE International Symposium on Policies for Distributed Systemsand Networks (POLICY), Chapel Hill, NC, USA, 16–18 July 2012; pp. 37–44.
20. Tacken, J.; Flake, S.; Golatowski, F.; Prüter, S.; Rust, C.; Chapko, A.; Emrich, A. Towards a Platform forUser-Generated Mobile Services. In Proceedings of the 2010 IEEE 24th International Conference on AdvancedInformation Networking and Applications Workshops (WAINA), Perth, Australia, 20–23 April 2010;pp. 532–538.
21. Shelton, T.; Poorthuis, A.; Zook, M. Social media and the city: Rethinking urban socio-spatial inequalityusing user-generated geographic information. Landsc. Urban Plan. 2015, 142, 198–211.
22. Venerandi, A.; Quattrone, G.; Capra, L.; Quercia, D.; Saez-Trumper, D. Measuring Urban Deprivation fromUser Generated Content. In Proceedings of the 18th ACM Conference on Computer Supported CooperativeWork & Social Computing (CSCW), Vancouver, BC, Canada, 14–18 March 2015; pp. 254–264.
23. Stavrianea, A.; Kavoura, A. Social media’s and online user-generated content’s role in services advertising.AIP Conf. Proc. 2015, 1644, 318–324.
24. Deng, S.; Huang, L.; Wu, H.; Wu, Z. Constraints-Driven Service Composition in Mobile Cloud Computing.In Proceedings of the 2016 IEEE International Conference on Web Services (ICWS), San Francisco, CA, USA,27 June–2 July 2016; pp. 228–235.
25. Ortiz, A.; Hussein, D.; Park, S.; Han, S.; Crespi, N. The Cluster Between Internet of Things and SocialNetworks: Review and Research Challenges. IEEE Int. Things J. 2014, 1, 206–215.
26. Jara, A.J.; Zamora-Izquierdo, M.A.; Skarmeta, A.F. Interconnection Framework for mHealth and RemoteMonitoring Based on the Internet of Things. IEEE J. Sel. Areas Commun. 2013, 31, 47–65.
27. Lee, S.; Chong, I. User-centric intelligence provisioning in web-of-objects based IoT service. In Proceedingsof the 2013 International Conference on ICT Convergence (ICTC), Jeju, Korea, 14–16 October 2013; pp. 44–49.
28. Toninelli, A.; Montanari, R.; Kagal, L.; Lassila, O. A Semantic Context-aware Access Control Framework forSecure Collaborations in Pervasive Computing Environments. In Proceedings of the 5th International Conferenceon The Semantic Web; Springer-Verlag: Berlin, Germany, 2006; pp. 473–486.
29. Yahyaoui, H.; Almulla, M. Context-based specification of Web service policies using WSPL. In Proceedingsof the 2010 Fifth International Conference on Digital Information Management (ICDIM), Thunder Bay, ON,Canada, 5–8 July 2010; pp. 496–501.
30. Kapsalis, V.; Hadellis, L.; Karelis, D.; Koubias, S. A Dynamic Context-aware Access Control Architecture fore-Services. Comput. Secur. 2006, 25, 507–521.
31. Cheaito, M.; Laborde, R.; Barrere, F.; Benzekri, A. An extensible XACML authorization decision enginefor context aware applications. In Proceedings of the 2009 Joint Conferences on the Pervasive Computing(JCPC), Tamsui, Taipei, Taiwan, 3–5 December 2009; pp. 377–382.
143
Books
MDPI

J. Sens. Actuator Netw. 2017, 6, 20
32. Li, H.; Yang, Y.; He, Z.; Hu, G. Context-aware Access Control Policy Research for Web Service. In Proceedingsof the 2011 First International Conference on Instrumentation, Measurement, Computer, Communicationand Control (IMCCC), Beijing, China, 21–23 October 2011; pp. 529–532.
33. Mohan, A.; Blough, D.M. An attribute-based authorization policy framework with dynamicconflict resolution. In Proceedings of the 9th Symposium on Identity and Trust on the Internet,Gaithersburg, MD, USA, 13–15 April 2010; ACM: New York, NY, USA, 2010; pp. 37–50.
34. Kayes, A.; Han, J.; Colman, A. An ontology-based approach to context-aware access control forsoftware services. In International Conference on Web Information Systems Engineering; Springer:Berlin/Heidelberg, Germany, 2013; pp. 410–420.
c© 2017 by the authors. Licensee MDPI, Basel, Switzerland. This article is an open accessarticle distributed under the terms and conditions of the Creative Commons Attribution(CC BY) license (http://creativecommons.org/licenses/by/4.0/).
144
Books
MDPI

Review
Big Sensed Data Meets Deep Learning for SmarterHealth Care in Smart Cities
Alex Adim Obinikpo † and Burak Kantarci *,†
School of Electrical Engineering and Computer Science, University Ottawa, Ottawa, ON K1N 6N5, Canada;[email protected]* Correspondence: [email protected]; Tel.: +1-613-562-5800 (ext. 6955)† These authors contributed equally to this work.
Received: 20 October 2017; Accepted: 17 November 2017; Published: 20 November 2017
Abstract: With the advent of the Internet of Things (IoT) concept and its integration with the smartcity sensing, smart connected health systems have appeared as integral components of the smart cityservices. Hard sensing-based data acquisition through wearables or invasive probes, coupled withsoft sensing-based acquisition such as crowd-sensing results in hidden patterns in the aggregatedsensor data. Recent research aims to address this challenge through many hidden perceptron layers inthe conventional artificial neural networks, namely by deep learning. In this article, we review deeplearning techniques that can be applied to sensed data to improve prediction and decision making insmart health services. Furthermore, we present a comparison and taxonomy of these methodologiesbased on types of sensors and sensed data. We further provide thorough discussions on the openissues and research challenges in each category.
Keywords: wearable sensors; biosensors; smart health; deep learning; machine learning; analytics
1. Introduction
Smart cities are built on the foundation of information and communication technologies withthe sole purpose of connecting citizens and technology for the overall improvement of the quality oflives. While quality of life includes ease of mobility and access to quality healthcare, amongst others,effective management and sustainability of resources, economic development and growth complementthe fundamental requirements of smart cities. These goals are achieved by proper management andprocessing of the data acquired from dedicated or non-dedicated sensor networks. In most cases,the information gathered is refined continuously to produce other information for efficiency andeffectiveness within the smart city.
In the Internet of Things (IoT) era, the interplay between mobile networks, wirelesscommunications and artificial intelligence is transforming the way that humans live and survivevia various forms of improvements in technological advancements, more specifically improvedcomputing power, high performance processing and huge memory capacities. With the advent ofcyber-physical systems, which comprise the seamless integration of physical systems with computingand communication resources, a paradigm shift from the conventional city concept towards a smartcity design has been coined as the term smart city. Basically, a smart city is envisioned to be ICTdriven and capable of offering various services such as smart driving, smart homes, smart living, smartgovernance and smart health, just to mention a few [1]. ICT-driven management and control, as wellas the overwhelming use of sensors in smart devices for the good and well-being of citizens yieldsthe desired level of intelligence to these services. Besides continuously informing the citizens, beingliveable and ensuring the well-being of the citizens are reported among the requirements of smartcities [2]. Therefore, the smart city concept needs transformation of health services through sensor andIoT-enablement of medical devices, communications and decision support. This ensures availability,
J. Sens. Actuator Netw. 2017, 6, 26 145 www.mdpi.com/journal/jsan
Books
MDPI

J. Sens. Actuator Netw. 2017, 6, 26
ubiquity and personal customization of services, as well as ease of access to these services. As statedin [3], the criteria for smartness of an environment are various. As a corollary to this statement, theauthors investigate a smart city in the following dimensions: (1) the technology angle (i.e., digital,intelligent, virtual, ubiquitous and information city), (2) the people angle (creative city, humane city,learning city and knowledge city) and (3) the community angle (smart community).
Furthermore, in the same vein, Anthopoulus (see [4]) divides the smart city into the following eightcomponents: (1) smart infrastructures where facilities utilize sensors and chips; (2) smart transportationwhere vehicular networks along with the communication infrastructure are deployed for monitoringpurposes; (3) smart environments where ICTs are used in the monitoring of the environment to acquireuseful information regarding environmental sustainability; (4) smart services where ICTs are used forthe the provision of community health, tourism, education and safety; (5) smart governance, whichaims at proper delivery of government services; (6) smart people that use ICTs to access and increasehumans’ creativity; (7) smart living where technology is used for the improvement of the quality oflife; and (8) smart economy, where businesses and organizations develop and grow through the useof technology. Given these components, a smart health system within a smart city appears to be oneof the leading gateways to a more productive and liveable structure that ensures the well-being ofthe community.
Assurance of quality healthcare is a social sustainability concept in a smart city. Socialsustainability denotes the liveability and wellbeing of communities in an urban setting [5]. The largepopulation in cities is actually a basis for improved healthcare services because one negligence orimproper health service might lead to an outbreak of diseases and infections, which might becomeepidemic, thereby costing much more in curtailing them; however, for these health services to besomewhat beneficial, the methods and channels of delivery need to be top-notch. There have beenvarious research studies into the adequate method required for effective delivery of healthcare. One ofthese methods is smart health. Smart health basically is the provision of health services using thesensing capabilities and infrastructures of smart cities. In recent years, smart health has gained widerecognition due to the increase of technological devices and the ability to process the data gatheredfrom these devices with minimum error.
As recent research states, proper management and development of smart health is the key tosuccess of the smart city ecosystem [6]. Smart health involves the use of sensors in smart devices andspecifically manufactured/prototyped wearable sensors/bio-patches for proper monitoring of thehealth status of individuals living within a smart city, as shown in Figure 1. This example depicts ascenario for air quality monitoring to ensure healthier communities. Smart city infrastructure buildsupon networked sensors that can be either dedicated or non-dedicated. As an integral component ofthe smart city, smart health systems utilize devices with embedded sensors (as non-dedicated sensingcomponents) for environmental and ambient data collection such as temperature, air quality index(AQI) and humidity. Besides, wearables and carry-on sensors (as the dedicated sensing components)are also utilized to acquire medical data from individuals. Both dedicated and non-dedicated sensorydata are transmitted to the data centres as the inputs of processing and further decision makingprocesses. To achieve this goal, the already existing smart city framework coupled with IoT networkingneeds to be leveraged.
146
Books
MDPI

J. Sens. Actuator Netw. 2017, 6, 26
Figure 1. Smart health embedded within a smart city. An example scenario is illustrated to detect theair quality indicator to ensure healthier communities (figure produced by Creately Online Diagram,Cinergix Pvt. Ltd., Mentone, Australia).
In other words, a smart city needs to provide the required framework for smart health to growrapidly and achieve its aim. Ensuring the quality of big sensed data acquisition is one key aspectof smart health challenges, and the ability to leverage these data is an important aspect of smarthealth development, as well as building a sustainable smart city structure [7–9]. Applications of smarthealth within smart cities are various. For example, Zulfiqar et al. [10] proposed an intelligent systemfor detecting and monitoring patients that might have voice complication issues. This is necessarysince a number of services within the smart cities are voice enabled. As such, any disorder with thevoice might translate into everyday service problems within the smart city. The same problem hasbeen studied by the researchers in [11], where voice data and ECG signals were used as the inputsto the voice pathology detection system. Furthermore, with the aim of ensuring air quality within asmart city, the researchers in [12] developed a cloud-based monitoring system for air quality to ensureenvironmental health monitoring. The motivation for environmental health is ensuring the wellness ofcommunities in a smart city for sustainability. The body area network within a smart city can be usedfor ECG monitoring with the aim of warning an individual of any heart-related problem, especiallycardiac arrest [13], and also helps in determining the nature of human kinematic actions with the aimof ensuring improved quality of healthcare whenever needed [14]. Data management of patients is alsoone of the applications of smart health in smart cities that is of paramount importance. As discussedin [15], proper management of patient records both at the data entry and application levels ensures thatpatients get the required treatment when due, and this also helps in the development of personalized
147
Books
MDPI

J. Sens. Actuator Netw. 2017, 6, 26
medicine applications [16]. Furthermore, the scope of smart health in smart cities is not limited to thephysiologic phenomena in human bodies; it also extends to the environment and physical buildingblocks of the smart infrastructure. Indeed, the consequences of mismanaged environment and/orphysical structures are potentially unhealthy users and communities, which is not a sustainable case fora smart city. To address this problem, the researchers in [17] created a system to monitor the structuralhealth within a city using wireless sensor networks (WSN). It is worth mentioning that structuralhealth monitoring also leads to inferential decision making services.
With these in mind, calls for new techniques that will ensure proper health service deliveryhave emerged. As an evolving concept, machine intelligence has attracted the healthcare sector byintroducing effective decision support mechanisms applied to sensory data acquired through variousmedia such as wearables or body area networks [18]. Machine learning techniques have undergonesubstantial improvements during the evolution of artificial intelligence and its integration with sensorand actuator networks. Despite many incremental improvements, deep learning has arisen as the mostpowerful tool thanks to its high level abstraction of complex big data, particularly big multimediadata [19].
Deep learning (DL) derives from conventional artificial neural networks (ANNs) with manyhidden perceptron layers that can help in identifying hidden patterns [20]. Although having manyhidden perceptron layers in a deep neural network is promising, when the concept of deep learningwas initially coined, it was limited mostly by computational power of the available computing systems.However, with the advent of the improved computational capability of computing systems, as well asthe rise of cloudified distributed models, deep learning has become a strong tool for analysing sensorydata (particularly multimedia sensory data) and assisting in long-term decisions. The basic idea ofdeep learning is trying to replicate what the human brain does in most cases. Thus, in a sensor andactuator network setting, the deep learning network receives sensory input and iteratively passes it tosubsequent layers until a desirable output is met. With the iterative process, the weights of the networklinks are adapted so as to match the input with the desirable output during the training process.With the widespread use of heterogeneous sensors such as wearables, medical imaging sensors,invasive sensors or embedded sensors in smart devices to acquire medical data, the emergence andapplicability of deep learning is quite visible in modern day healthcare, from diagnosis to prognosis tohealth management.
While shallow learning algorithms enforce shallow methods on sensor data for featurerepresentation, deep learning seeks to extract hierarchical representations [21,22] from large-scale data.Thus, the idea is using deep architectural models with multiple layers of non-linear transformations [23].For instance, the authors in [24] use a shallow network with a covariance representation on the 3Dsensor data in order to recognize human action from skeletal data. On the other hand, in the studyin [25], the AlexNet model and the histogram of oriented gradients features are used to obtain deepfeatures from the data acquired through 3D depth sensors.
In this article, we provide a thorough review of the deep learning approaches that can be appliedto sensor data in smart health applications in smart cities. The motivation behind this study is thatdeep learning techniques are among the key enablers of the digital health technology within a smartcity framework. This is due to the performance and accuracy issues experienced by conventionalmachine learning techniques under high dimensional data. Thus, it is worth noting that deep learningis not a total replacement of machine learning, but an effective tool to cope with dimensionalityissues in several applications such as smart health [26]. To this end, this article aims to highlight theemergence of deep learning techniques in smart health within a smart city ecosystem and at the sametime to give future directions by discussing the challenges and open issues that are still pertinent.In accordance with these, we provide a taxonomy of sensor data acquisition and processing techniquesin smart health applications. Our taxonomy and review of deep learning approaches pave the way forproviding insights for deep learning algorithms in particular smart health applications.
148
Books
MDPI

J. Sens. Actuator Netw. 2017, 6, 26
This work is organized as follows. In Section 2, we briefly discuss the transition from conventionalmachine learning methodologies to the deep learning methods. Section 3 gives a brief overviewof the use of deep learning techniques on sensor network applications and major deep learningtechniques that are applied on sensory data, while Section 4 provides insights for the smart healthapplications where deep learning can be used to process and interpret sensed data. Section 5 presentsoutstanding challenges and opportunities for the researchers to address in big sensed health data bydeep learning. Finally, Section 6 concludes the article by summarizing the reviewed methodologiesand future directions.
2. Analysis of Sensory Data in E-Health
2.1. Conventional Machine Learning on Sensed Health Data
With the advent of the WSN concept, machine learning has been identified as a viable solution toreduce the capital and operational expenditures on the design of the network, as well as to improvethe lifetime of the network [27]. Presently, the majority of the machine learning techniques use acombination of feature extraction and modality-specific algorithms that are used to identify/recognizehandwriting and/or speech [28]. This normally requires a dataset that is big in volume and powerfulcomputing resources to support tremendous amount of background tasks. Furthermore, despitetedious efforts, there are always bound to be certain issues, and these perform poorly in the presenceof inconsistencies and diversity in the dataset. One of the major advantages of machine learning inmost cases is feature learning where a machine is trained on some datasets and the output providesvaluable representation of the initial feature.
Applications of machine learning algorithms on sensory data are various such astelemedicine [18,29,30], air quality monitoring [31], indoor localization [32] and smarttransportation [33]. However, conventional machine learning still has certain limitations such asinability to optimize non-differentiable discontinuous loss functions or not being able to obtain resultsfollowing a feasible training duration at all times. These and many other issues encountered by machinelearning techniques paved the way for deep learning as a more robust learning tool.
2.2. Deep Learning on Sensed Health Data
In [34], deep learning is defined as a collection of algorithmic procedures that ‘mimic the brain’.More specifically, deep learning involves learning of layers via algorithmic steps. These layers enablethe definition of hierarchical knowledge that derives from simpler knowledge [35]. There have beenseveral attempts to build and design computers that are equipped with the ability to think. Untilrecently, this effort has been translated into rule-based learning, which is a ‘top down’ approachthat involves creating rules for all possible circumstances [36]. However, this approach suffers fromscalability since the number of rules is limited while its rule base is finite.
These issues can be remedied by adopting learning from experience instead of rule-based learningvia a bottom-up approach. Labelled data form the experience. Labelled data are used as training inputto the system where the training procedure is built upon past experiences. The learning from experienceapproach is well suited for applications such as spam filtering. On the other hand, the majority of thedata collected by multimedia sensors (e.g., pictures, video feeds, sounds, etc.) are not properly labelled[37].
Real-world problems that involve processing of multimedia sensor data such as speech or facerecognition are challenging to represent digitally due to the possibly infinite the problem domain. Thus,describing the problem adequately suffers especially in the presence of multi-dimensional features,which in turn leads to an increase in the volume of the space in such a way that the available databecome sparse, and training on sparse data would not lead to meaningful results. Nevertheless,such ‘infinite choice’ problems are common in the processing of sensory data that are mostly acquiredfrom multimedia sensors [38]. These issues pave the way for deep learning as deep learning algorithms
149
Books
MDPI

J. Sens. Actuator Netw. 2017, 6, 26
have to work with hard and/or intuitive problems, which are defined with no or very few rules on highdimensional features. The absence of a rule set enforces the system to learn to cope with unforeseencircumstances [34].
Another characteristic of deep learning is the discovery of intricate structure in large datasets.To achieve this, deep learning utilizes a back propagation algorithm to adjust the internal parametersin each layer based on the representation of the parameters in the previous layer [34]. As such, it canbe stated that representation learning is possible on partially labelled or unlabelled sensory data.
Acharya et al. [39] used deep learning techniques (specifically CNN) in the diagnosis and detectionof coronary artery disease from the signals acquired from the electrocardiogram (ECG) and achievedan accuracy of 94.95%. The authors in [38] proposed the use of deep neural networks (DNN) forthe active and automatic classification of ECG signals. Furthermore, in order to detect epilepticconditions early enough, deep learning with edge computing for the localization of epileptogenicityusing electroencephalography (EEG) data has been proposed in [40]. Emotional well-being is a keystate in the life of humans. With this in mind, the authors in [41] classified positive and negativeemotions using deep belief networks (DBN) and data from EEG. The aim is to accurately capturethe moment an emotional swing occurs. Their work yielded an 87.62% classification accuracy. Theauthors in [42] designed a BGMonitor for detecting blood glucose concentration and used a multi-taskdeep learning approach to analyse and process the data, and to make further inferences. The researchyielded an accuracy of 82.14% when compared to the conventional methods.
3. Deep Learning Methods and Big Sensed Data
3.1. Deep Learning on Sensor Network Applications
Sensors are key enablers of the objects (things) of the emerging IoT networks [43]. The aggregationof sensors forms a network whose purpose amongst others is to generate and aggregate data forinferential purposes. The data generated from sensors need to be fine-tuned prior to undergoing anyanalytics procedure. This has led to various methods to formulate proper and adequate processingof sensed data from sensor and actuator networks. These methods are dependent on the type andapplications of the sensed data. Deep learning (one of such methods) can be applied on sensor andactuator network applications to process data generated from sensors effectively and efficiently [44].The output of a deep learning network can be used for decision making. Costilla-Reyes et al. used aconvolutional neural network to learn spatio-temporal features that were derived from tomographysensors, and this yielded an effective and efficient way of performance classification of gait patternsusing a limited number of experimental samples [45]. Transportation is another important servicein a smart city architecture. The ability to acquire quality (i.e., high value) data from users is key todeveloping a smart transportation architecture. As an example study, the authors in [46] developed amechanism using a deep neural network to learn the transportation modes of mobile users. In the samestudy, the integration of a deep learning-driven decision making system with a smart transportationarchitecture has been shown to result in 95% classification accuracy. Besides these, deep learning helpedin the power usage pattern analysis of vehicles using the sensors embedded in smart phones [47].The goal of the study in [47] is the timely prediction of the power consumption behaviour of vehiclesusing smart phones. The use of sensors in healthcare has been leading to significant achievements, anddeep learning is being used to leverage the use of sensors and actuators for proper healthcare delivery.For instance, in assessing the level of Parkinson’s disease, Eskofier et al. [48] used convolutionalneural networks (CNN) for the classification and detection of the key features in Parkinson’s diseasebased on data generated from wearable sensors. The results of the research proved that deep learningtechniques work well with sensors when compared to other methods. Moreover, deep learningtechniques, particularly CNNs, were used in estimating energy consumption while using wearablesensors for health condition monitoring [49]. Furthermore, by using sensory data generated from aninfrared distance sensor, a deep learning classifier was developed for fall detection especially amongst
150
Books
MDPI

J. Sens. Actuator Netw. 2017, 6, 26
the elderly population [50]. Besides these, with respect to security, combining biometric sensors andCNNs has resulted in a more robust approach for spoofing and security breach detection in digitalsystems [51]. Yin et al. [52] used a deep convolution network for proper visual object recognition asanother application area of deep learning in the analysis of big sensed data, whereas for early detectionof deforestation, Barreto et al. [53] proposed using a multilayer perceptron technique. In both studies,the input data are acquired via means of remote sensing.
3.2. Major Deep Learning Methods in Medical Sensory Data
In this subsection, we discuss the major deep learning methods that are used in e-healthapplications on medical sensory data. The following are the major deep learning methods in e-health,and a table of all notation used is given as Table 1.
Table 1. Basic notations used in the article. Notations are grouped into three categories: stand-alonesymbols, vectors between units of different layers and symbols for functions.
Notations Definition
x Samplesy Outputsv Visible vectorh Hidden vectorq State vector
W Matrix of weight vectorsM Total number of units for the hidden layer
wij Weights vector between hidden unit hj and visible unit viSj Binary state of a vectorsq
i Binary state assigned to unit i by state vector qZ Partition factordj Biased weights for the j-th hidden unitsci Biased weights for the i-th visible unitszi Total i-th inputsvi Visible unit i
w2kj Weight vector from the k-th unit in the hidden Layer 2 to the j-th output unit
w1ji Weight vector from the j-th unit in the hidden Layer 1 to the i-th output unit
W1ji Matrix of weights from the j-th unit in the hidden Layer 1 to the i-th output unit
E(q) Energy of a state vector qσ activation function
Pr(q) Probability of a state vector qE(v, h) Energy function with respect to visible and hidden units
pd f (v, h) Probability distribution with respect to visible and hidden units
3.2.1. Deep Feedforward Networks
Deep feed-forward networks can be counted among the first generation deep learning models andare based on multilayer perceptrons [34,54]. Basically, a feed-forward network aims at approximatinga function f *. A mapping y = f (x; Θ) is defined by a feed-forward network to learn the value of the Θparameters by approximating with respect to the best function. Information flow in these networks isusually from the variables x being evaluated with respect to the outputs y.
During training, the aim is to ensure matching of f (x) to f *(x), where each example of x isaccompanied by a label y ≈ f *(x). In most cases, the learning algorithm decides how to use theselayers in order to get the best approximation of f *. Since these layers do not obtain the desired outputfrom the training data, they are referred to as hidden layers such as Layer 2 in the illustration inFigure 2 below.
151
Books
MDPI

J. Sens. Actuator Netw. 2017, 6, 26
Figure 2. A basic deep feed-forward network.
A typical model for the deep forward network is described as follows. Given K outputs y1, ..., ykfor a given input x and the hidden layer, which consists of M units, then the output is formulated asshown in Equation (1) where σ is the activation function, W(1)
ji denotes the matrix of weights from unit
j of hidden Layer 1 to the output unit i. In the equation, w(1)ji and w(2)
ki stand for the weight vector fromunit j of hidden Layer 1 to output unit i, and the weight vector from unit k of hidden Layer 2 to outputunit i, respectively.
yk(x, w) = σ(M
∑j=1
w(2)kj h(
M
∑j=1
w(1)ji xi + W(1)
ji ) + w(2)ki ) (1)
3.2.2. Autoencoder
An autoencoder is a neural network that is trained to copy its input to its output [22,55]. In mostcases, an autoencoder is implemented as a three-layer neural network (see Figure 3) by directlyconnecting output units back to input units. In the figure, every output i is linked back to input i.The hidden layer h in the autoencoder represents the input by a code. Thus, a minimalist descriptionof the network can be made by two main components as follows: (1) an encoder function h = f (x);(2) a decoder function that is used to reconstruct the input, r = g(h). Previously, autoencoders wereused for dimensionality reduction or feature learning, but currently, the main purpose of autoencoderuse is generative modelling because of the connection between autoencoders and latent variables.
Figure 3. Autoencoder network.
152
Books
MDPI

J. Sens. Actuator Netw. 2017, 6, 26
Below are the various types of autoencoders.
• Undercomplete autoencoders [54] are suitable for the situation where the dimension of the code isless than the dimension of the input. This phenomenon usually leads to the inclusion of importantfeatures during training and learning.
• Regularized autoencoders [56] enable training any architecture of autoencoder successfully bychoosing the code dimension and the capacity of the encoder/decoder based on the complexity ofthe distribution to be modelled.
• Sparse autoencoders [54] have a training criterion with a sparsity penalty, which usually occurs inthe code layer with the purpose of copying the input to the output. Sparse autoencoders are usedto learn features for another task such as classification.
• Denoising autoencoders [22] change the reconstruction error term of the cost function instead ofadding a penalty to the cost function. Thus, a denoising autoencoder minimizes L(x, g( f (x))),where x is a copy of x that has been distorted by noise.
• Contractive autoencoders [57] introduce an explicit regularizer on h = f (x) making the derivativesof f as small as possible. The contractive autoencoders are trained to resist any perturbation ofthe input; as such, they map a neighbourhood of input points to a smaller neighbourhood ofoutput points.
3.2.3. Convolutional Neural Networks
Convolutional neural networks (CNNs) replace matrix multiplication with convolutions in at leastone of their layers [54,58,59]. CNNs have multiple layers of fields with small sets of neurons wherean input image is partially processed [60]. When the outputs of these sets of neurons are tiled, theirinput regions overlap, leading to a new representation of the original image with higher resolution.This sequence is repeated in each sublayer. It is also worth mentioning that the dimensions of a CNNare mostly dependent on the size of the data.
The CNN architecture consists of three distinct layers: (1) the convolutional layer, (2) poolinglayer and (3) fully-connected layer. Although it is not a requirement for the CNNs, as illustrated inFigure 4, fully-connected layers can follow a number of convolutional and subsampling layers.
Figure 4. CNN architecture.
• Convolutional layer: The convolutional layer takes an m×m× r image as the input, where m and rdenote the height/width of the image and the number of channels, respectively. The convolutionallayer contains k filters (or kernels) of size n × n × q, where n < m and q can be less than or equalto the number of channels r (i.e., q ≤ r). Here, q may vary for each kernel, and the feature map inthis case has a size of m − n + 1.
• Pooling layers: These are listed as a key aspect of CNNs. The pooling layers are in generalapplied following the convolutional layers. A pooling layer in a CNN subsamples its input.Applying a max operation to the output of each filter is the most common way of pooling.Pooling over the complete matrix is not necessary. With respect to classification, pooling gives anoutput matrix with a fixed size thereby reducing the dimensionality of the output while keepingimportant information.
153
Books
MDPI

J. Sens. Actuator Netw. 2017, 6, 26
• Fully-connected layers: The layers here are all connected, i.e., both units of preceding andsubsequent layers are connected
3.2.4. Deep Belief Network
The deep belief network (DBN) is a directed acyclic graph that builds on stochastic variables.It is a type of neural network composed of latent variables connected between multiple layers [36,61].Despite the connections between layers, there are no connections between units within each layer.It can learn to reconstruct its inputs, then is trained to perform classification. In fact, the learningprinciple of DBNs is “one layer at a time via a greedy learning algorithm”.
The properties of DBN are:
• Learning generative weights is through a layer-by-layer process with the purpose of determiningthe dependability of the variables in layer � on the variables in layer �′ where � denotes the indexof any upper layer.
• Upon observing data in the bottom layer, inferring the values of the latent variables can be donein a single attempt.
It is worth noting that a DBN with one hidden layer implies a restricted Boltzmann machine(RBM). To train a DBN, first an RBM is trained using constructive divergence or stochastic maximumlikelihood. The second RBM is then trained to model the defined distribution by sampling the hiddenunits in the first RBM. This process can be iterated as many times as possible to add further layers tothe DBN.
3.2.5. Boltzmann Machine
As a special type of neural network, the Boltzmann machine (BM) consists of nodes that areconnected symmetrically as shown in Figure 5, where neurons help a BM make on/off decisions [62].In order to identify features that exhibit complex data regularities, a BM utilizes learning algorithmsthat are well-suited for search and learning problems.
Figure 5. Boltzmann network.
To visualize the operation of a BM better, suppose unit i is able to continuously change its state.First, the node calculates the total input zi, which is formulated as the sum of bi (bias) and all theweights on the connections from other units as formulated in Equation (2). In the equation, wij denotes
154
Books
MDPI

J. Sens. Actuator Netw. 2017, 6, 26
the weights on connections between i and j, and sj is defined as in Equation (3). The probability forunit i is formulated as shown in Equation (4).
zi = bi + ∑j
sjwij (2)
sj = {1, i f j is on0, i f j is o f f . (3)
Pr(si = 1) =1
1 + e−zi(4)
If all neurons are updated sequentially, the network is expected to reach a BM distribution withstate vector probability q and energy E(q) as shown in Equations (5) and (6), respectively
Pr(q) =e−E(q)
∑u e−E(u)(5)
E(q) = −∑i
sqi bi − ∑
i<jsq
i sqj wij (6)
With a view toward discarding the local optima, the weights on the connections could be chosenin such a way that each energy of the individual vectors represents the cost of these vectors. Learningin BM takes place in two different manners; either with hidden units or without hidden units.
There are various types of BM, and some of them are listed below:Conditional Boltzmann machines model the data vectors and their distribution in such a way that
any extension, no matter how simple it is, leads to conditional distributions.Mean field Boltzmann machines compute the state of a unit based on the present state of other
units in the network by using the real values of mean fields.Higher-order Boltzmann machines have structures and learning patterns that can accept complex
energy functions.Restricted Boltzmann machines (RBMs): Two types of layers (i.e., visible vs. hidden) are included
in the RBMs with no two similar connections [21,55].In order to obtain unbiased elements from the set 〈sisj〉data, the hidden units h need to be
conditionally independent of the visible unit v. However, heavy computation is required to getunbiased samples from 〈sisj〉data [63].
Mathematically, the energy function of an RBM is given as formulated in Equation (7) and hasa probability distribution as shown in Equation (8). In the equations, dj and ci stand for the biasedweights for the hidden and visible units, respectively, whereas Z in the probability distribution functiondenotes the partition factor.
E(v, h) = −∑i
civi − ∑j
djhj − ∑i
∑j
viwi,jhj (7)
pd f (v, h) =1Z
e−E(v,h) (8)
Upon learning one hidden layer, the outcome can be treated as the input data required for traininganother RBM. This in turn leads to cascaded learning of multiple hidden layers, thus making the entirenetwork be viewed as one model with improvements done on the lower bound [64].
4. Sensory Data Acquisition and Processing Using Deep Learning in Smart Health
Accurate data acquisition and processing is key to effective healthcare delivery. However,ensuring the accuracy of the acquired data has been one of the typical challenges in smart healthcare
155
Books
MDPI

J. Sens. Actuator Netw. 2017, 6, 26
systems. This is due to the nature of data needed for quality assurance of healthcare delivery and themethods used for data acquisition. This phenomenon in the acquisition of sensory data in healthcareapplications has led to the development of innovative techniques for data acquisition with the aimof complementing the “already in use”, but upgraded methods. Due to these improvements indata acquisition methods, processing and interpreting sensory data have experienced an upwardimprovement, as well. These improvements have recently translated into improved quality ofhealthcare delivery. In this section, we briefly discuss the methods of sensory health data acquisitionand processing as they relate to deep learning. Furthermore, we discuss how the generated sensorydata types are processed using deep learning techniques. Figure 6a presents a brief taxonomy ofdata acquisition and processing. Data acquisition is performed mainly via wearables and probes asdedicated sensors and via built-in sensors of mobile devices as non-dedicated sensors.
(a) (b)
Figure 6. Data acquisition methods and processing techniques. (a) Taxonomy of sensory dataacquisition and processing techniques; (b) types of wearables/carry-ons.
4.1. Sensory Data Acquisition and Processing via Wearables and Carry-Ons
Wearables and carry-ons have appeared as crucial components of personalized medicine aimingat performance and quality improvement in healthcare delivery. All wearables are equipped withbuilt-in sensors that are used in data acquisition, and these smart devices with built-in sensors arein various forms as shown in the Figure 6b. The sensors in smart watches acquire data for the heartrate, movement, blood oxygen level and skin temperature. The virtual reality (VR) goggle capturesvideo/image data, whereas the emotive headset senses mostly the brain signals. The wrist band andbracelets sense heart rate, body mass index (BMI), movement data (i.e., accelerometer and gyroscope)and temperature. Mobile devices provide non-dedicated sensing by acquiring sensory data regardinglocation, movement and BMI. While they all have similar functions, sensing functions mainly dependon the situations or needs for which they are required. The sensors embedded in these devices arethe main resources for data acquisition and generation. The data output can be in the form of signals,images or videos; all with various importance and usefulness.
Processing of data generated from wearables and carry-ons is done based on the data types.Deep learning techniques used in this regards are also dependent on the data types and intendedapplications. This section aims to discuss the various deep learning methods used to process variousdata types generated from wearables and carry-ons.
• Image processing: Deep learning techniques play a major role in image processing for healthadvancements. Prominent amongst these methods are CNN, DBN, autoencoders and RBM.The authors in [65] use CNNs to help create a new network architecture with the aim of
156
Books
MDPI

J. Sens. Actuator Netw. 2017, 6, 26
multi-channel data acquisition and also for supervised feature learning. Extracting featuresfrom brain images (e.g., magnetic resonance imaging (MRI), functional Magnetic resonanceimaging (fMRI)) can help in early diagnosis and prognosis of severe diseases such as glioma.Moreover, the authors in [66] use DBN for the classification of mammography images in a bid todetect calcifications that may be the indicators of breast cancer. With high accuracy achieved inthe detection, proper diagnosis of breast cancer becomes possible in radiology. Kuang and Hein [67] modified and used DBN for the classification of attention deficit hyperactivity disorder(ADHD) using images from fMRI data. In a similar fashion, Li et al. [68] used the RBM fortraining and processing the dataset generated from MRI and positron emission tomography (PET)scans with aim of accurately diagnosing Alzheimer’s disease. Using deep CNN and clinicalimages, Esteva et al. [69] were able to detect and classify melanoma, which is a type of skincancer. According to their research, this method outperforms the already available skin cancerclassification techniques. In the same context, Peyman and Hamid [70] showed that CNN performsbetter in the preprocessing of clinical and dermoscopy images in the lesion segmentation part ofthe skin. The study argues that CNN requires less preprocessing procedure when compared toother known methods.
• Signal processing: Signal processing is an area of applied computing that has been evolvingsince its inception. Signal processing is an utmost important tool in diverse fields including theprocessing of medical sensory data. As new methods are being improved for accurate signalprocessing on sensory data, deep learning, as a robust method, appears as a potential techniqueused in signal processing. For instance, Ha and Choi use improved versions of CNN to processthe signals derived from embedded sensors in mobile devices for proper recognition of humanactivities [71]. Human activity recognition is an important aspect of ubiquitous computing andone of the examples of its application is the diagnosis and provision of support and care forthose with limited movement ability and capabilities. The authors in [72] propose applying aCNN-based methodology on sensed data for the prediction of sleep quality. In the correspondingstudy, the CNN model is used with the objective of classifying the factors that contribute toefficient and poor sleeping habits with wearable sensors [72]. Furthermore, deep CNN and deepfeed-forward networks on the data acquired via wearable sensors are used for the classificationand processing of human activity recognition by the researchers in this field [73].
• Video processing: Deep learning techniques are also used for processing of videos generatedfrom wearable devices and carry-ons. Prominent amongst these applications is the humanactivity recognition via CNNs to process video data generated by wearables and/or multimediasensors [74–76].
4.2. Data Acquisition via Probes
Data acquisition using probes was an early stage data gathering technique. Their developmenthas been made possible using technological enhancements attached to these probing tools. With theseenhancements, acquiring sensory readings of medical data has become possible. Probes can be inthe form of needles, drills and sometimes knocks, with feedbacks generated via the technologicalenhancements attached to the probing tools. Probes have seen a revolution since modern science andtraditional medicine are being harmonized, with both playing vital roles in healthcare delivery.
Data generated via probes are usually in the form of signals. Processing probe data requirescertain deep learning techniques that are augmented in most cases for this purpose. As an example,Cheron et al. [77] used the invasive electrode injection method to acquire signals needed to formulatethe kinematic relation between electromyography (EMG) and the trajectory of the arm duringmovements. To this end, the authors used a dynamic recurrent neural network to process thesesignals and showed the correlation between EMG and arm trajectory.
157
Books
MDPI

J. Sens. Actuator Netw. 2017, 6, 26
4.3. Data Acquisition via Crowd-Sensing
Mobile crowd-sensing is a non-dedicated sensing concept where data are acquired using built-insensors of smart devices. As the capabilities of smart devices such as smartphones and tablets havetremendously improved during the last decade, any smartphone today is equipped with tens of built-insensors. Thus, ubiquity, improved sensing, computing and communication capabilities in mobile smartdevices have enabled these devices to be used as data acquisition tools in critical applications includingsmart health and emergency preparedness [78,79]. This type of data acquisition involves users movingtowards a particular location and being implicitly recruited to capture required data by the built-insensors in their smart devices [80]. Crowdsensing envisions a robust data collection approach whereusers have the leverage and the ability to choose and report more data for experimental purposes inreal time [81]. Consequently, this type of data acquisition increases the amount of data required for anypurpose especially for the applications under smart health and smart cities [82]. Moreover, it is worthnoting that crowd-sensed data are big especially in volume and velocity; hence, application-specific andeffective processing methods are required to analyse crowd-sensed datasets. Application-specific dataanalytics techniques are required for the following reason in mobile crowd-sensing: Besides volumeand velocity, the variety and heterogeneity of sensors in mobile crowd-sensing are also phenomenal,which results in producing a gigantic amount of data, which might be partially labelled in some cases.
As an example smart health application where mobile crowd-sensed data are used, Pan et al. [83]have introduced AirTick, which utilizes crowd-sensed image data to obtain air quality information.To this end, AirTick applies Boltzmann machines as the deep learning method on the crowd-sensedimage to process the data for eventual results. Furthermore, the authors in [84] have introduceda proposal for cleaner and healthier neighbourhoods and have developed a mobile crowd-sensingapplication called SpotGarbage, which allows users to capture images of garbage in their locality andsend them to the data hub where the data are analysed. In the SpotGarbage application, CNNs areused as the deep learning method to analyse the crowd-sensed images.
Based on the review of different data acquisition techniques and the corresponding deep learningmethodologies applied to sensed data under those acquisition techniques, a brief review is presentedin Table 2. The table provides a summary of data acquisition techniques, their corresponding datatypes and some examples of the deep learning techniques used.
Table 2. Summary of data acquisition methods, data types and examples of deep learning techniqueused. Three types of data acquisition categories are defined, which acquire images, one-dimensionalsignals and videos. CNN, DBN, restricted Boltzmann machine (RBM) and BM are the deep learningmethods that are used to analyse big sensed data.
Data Acquisition Technique Data Type Deep Learning Technique
WearablesImage CNN [65,69,70], DBN [66,67], RBM [68],Signal CNN [71–73]Video CNN [74–76]
Probes Signal RNN [77]
Crowd-sensing Image BM [83], CNN [84]
5. Deep Learning Challenges in Big Sensed Data: Opportunities in Smart Health Applications
Deep learning can assist in the processing of sensory data by classification, as well as predictionvia learning. Training a dataset by a deep learning algorithm involves prediction, detection of errorsand improving prediction quality with time. Based on the review of the state of the art in the previoussections, it can be stated that integration of sensed data in smart health applications with deep learningyields promising outcomes. On the other hand, there are several challenges and open issues that needto be addressed prior to realization of such integration. As those challenges arise from the nature ofdeep learning, sensor deployment and sensory data acquisition, addressing those challenges paves the
158
Books
MDPI

J. Sens. Actuator Netw. 2017, 6, 26
way towards robust smart health applications. As a corollary, in this section, we introduce challengesand open issues in the integration of deep learning with smart health sensory data; and pursuantto these, we present opportunities to cope with these challenges in various applications with theintegration of deep learning and the sensory data provided.
5.1. Challenges and Open Issues
Deep learning techniques have attracted researchers from many fields recently for sustainable andefficient smart health delivery in smart environments. However, it is worth noting that the applicationof deep learning techniques on sensory data still experiences challenges. Indeed, in most smart healthapplications, CNNs have been introduced as revolutionized methodologies to cope with the challengesthat deep learning networks suffer. Thanks to the improvements in CNNs, to date, CNN has beenidentified as the most useful tool in most cases when smart health is involved.
To be able to fully exploit deep learning techniques on medical sensory data, certain challengesneed to be addressed by the researchers in this field. The challenges faced by deep learning techniquesin smart health are mostly related to the acquisition, quality and dimensionality of data. This is dueto the fact that inferences or decisions are made based on the output/outcome of processed data.As seen in the previous section, data acquisition takes place on heterogeneous settings, i.e., variousdevices with their own sampling frequency, operating system and data formats. The heterogeneityphenomenon generally results in a data plane with huge dimensions. The higher the dimension gets,the more difficult the training of the data, which ultimately leads to a longer time frame for resultgeneration. Moreover, determining the depth of the network architecture in order to get a favourableresult is another challenge since the depth of the network impacts the training time, which is anoutstanding challenge to be addressed by the researchers in this field.
Value and trustworthiness of the data comprise another challenge that impacts the success ofdeep learning algorithms in a smart health setting. As any deep learning technique is supposed to beapplied to big sensed health data, novel data acquisition techniques that ensure the highest level oftrustworthiness for the acquired data are emergent.
Uncertainty in the acquired sensor data remains a grand challenge. A significant amount of theacquired data is partially labelled or unlabelled. Therefore, novel mechanisms to quantify and copewith the uncertainty phenomenon in the sensed data are emergent to improve the accuracy, as well asthe efficiency of deep learning techniques in smart health applications.
Furthermore, data acquisition via non-dedicated sensors is also possible in smart cities sensing [85].In the presence of non-dedicated sensors for data acquisition in smart health, it is a big challenge toknow how much data should be acquired prior to processing. Since dedicated and non-dedicatedsensors are mostly coupled in smart health applications, determining the amount of data requiredfrom different wearables becomes a grand challenge, as well. Recent research proposes the useof compressing sensing methods in participatory or opportunistic sensing via mobile devices [86];hence, data explosion in non-dedicated acquisition can be prevented. However, in the presence ofnon-dedicated sensing system, dynamic determination of the number of wearables/sensors that canensure the desired amount of data is another open issue to be addressed prior to analysing the bigsensed data via deep learning networks.
In addition to all this, ensuring trustworthiness of the acquired sensory data prior to deep learninganalysis remains an open issue, while auction and game theoretic solutions have been proposed toincrease user involvement in the trustworthiness assurance stage of the data that are acquired vianon-dedicated sensors [87,88]. In the presence of a collaboration between dedicated and non-dedicatedsensors in the data acquisition, coping with the reliability of the non-dedicated end still requiresefficient solutions. It is worth noting that deep learning can also be used for behaviour analysis ofnon-dedicated sensors in such an environment with the aim of eliminating unreliable sensing sourcesin the data acquisition.
159
Books
MDPI

J. Sens. Actuator Netw. 2017, 6, 26
Last but not least, recent research points out the emergence of IoT-driven data acquisitionsystems [78,89].
5.2. Opportunities in Smart Health Applications for Deep Learning
In this section, we discuss some of the applications of deep learning. To this end, we categorizethese applications into three main groups for easy reference. Table 3 shows a summary of theseapplications together with the deep learning methods used under the three categories, namelymedical imaging, bioinformatics and predictive analysis. The table is a useful reference to selectthe appropriate deep learning technique(s) while aiming to address the challenges and open issues inthe previous subsection.
Table 3. Smart health applications with their respective deep learning techniques on medical sensorydata. Applications are grouped into three categories: Medical imaging, bioinformatics and predictiveanalysis. Each application addresses multiple problems on sensed data through various deeplearning techniques. DNN, deep neural network.
Application Problem Deep Learning Techniques References
Medical Imaging
Neural Cells Classification CNN [65]3D brain reconstruction Deep CNN [90]Brain Tissue Classification DBN [67,68]Tumour Detection DNN [65,66]Alzheimer’s Diagnosis DNN [91]
BioinformaticsCancer Diagnosis Deep Autoencoder [92]Gene Classification DBN [93]Protein Slicing DBN [94,95]
Predictive Analysis Disease prediction and analysisAutoencoder [96]
RNN [97]CNN [97,98]
• Medical imaging: Deep learning techniques have actually helped the improvement of healthcarethrough accurate disease detection and recognition. An example is the detection of melanoma.To do this, deep learning algorithms learn important features related to melanoma from a groupof medical images and run their learning-based prediction algorithm to detect the presence orlikelihood of the disease.
Furthermore, using images from MRI, fMRI and other sources, deep learning has been able tohelp 3D brain construction using autoencoders and deep CNN [90], neural cell classification usingCNN [65], brain tissue classifications using DBN [67,68], tumour detection using DNN [65,66]and Alzheimer’s diagnosis using DNN [91].
• Bioinformatics: The applications of deep learning in bioinformatics have seen a resurgence inthe diagnosis and treatment of most terminal diseases. Examples of these could be seen incancer diagnosis where deep autoencoders are used using gene expression as the input data [92];gene selection/classification and gene variants using micro-array data sequencing with theaid of deep belief networks [93]. Moreover, deep belief networks play a key role in proteinslicing/sequencing [94,95].
• Predictive analysis: Disease predictions have gained momentum with the advent of learning-basedsystems. Therefore, with the capability of deep learning to predict the occurrence ofdiseases accurately, predictive analysis of the future likelihood of diseases has experiencedsignificant progress. Particular techniques that are used for predictive analysis of diseases areautoencoders [96], recurrent neural networks [97] and CNNs [97,98]. On the other hand, it is worthmentioning that in order to improve the accuracy of prediction, sensory data monitoring medicalphenomena have to be coupled with sensory data monitoring human behaviour. Coupling of data
160
Books
MDPI

J. Sens. Actuator Netw. 2017, 6, 26
acquired from medical and behavioural sensors helps in conducting effective analysis of humanbehaviour in order to find patterns that could help in disease predictions and preventions.
6. Conclusions
With the growing need and widespread use of sensor and actuator networks in smart cities, there isa growing demand for top-notch methods for the acquisition and processing of big sensed data. Amongsmart city services, smart healthcare applications are becoming a part of daily life to prolong the lifetimeof members of society and improve quality of life. With the heterogeneous and various types of datathat are being generated on a daily basis, the existence of sensor and actuator networks (i.e., wearables,carry-ons and other medical sensors) calls for effective acquisition of sensed data, as well as accurateand efficient processing to deduce conclusions, predictions and recommendations for the healthinessstate of individuals. Deep learning is an effective tool that is used in the processing of big sensed dataespecially under these settings. Although deep learning has evolved from the traditional artificialneural networks concept, it has become an evolving field with the advent of improved computationalpower, as well as the convergence of wired/wireless communication systems. In this article, wehave briefly discussed the growing concept of smart health within the smart city framework byhighlighting its major benefits for the social sustainability of the smart city infrastructure. We haveprovided a comprehensive survey of the use of deep learning techniques to analyse sensory datain e-health and presented the major deep learning techniques, namely deep feed-forward networks,autoencoders, convolutional neural networks, deep belief networks, Boltzmann machine and restrictedBoltzmann machine. Furthermore, we have introduced various data acquisition mechanisms, namelywearables, probes and crowd-sensing. Following these, we have also linked the surveyed deep learningtechniques to existing use cases in the analysis of medical sensory data. In order to provide a thoroughunderstanding of these linkages, we have categorized the sensory data acquisition techniques basedon the available technology for data generation. In the last part of this review article, we have studiedthe smart health applications that involve sensors and actuators and visited specific use cases in thoseapplications along with the existing deep learning solutions to effectively analyse sensory data. Tofacilitate a thorough understanding of these applications and their requirements, we have classifiedthese applications under the following three categories: medical imaging, bioinformatics and predictiveanalysis. In the last part of this review article, we have studied smart health applications that involvesensors and actuators and visited specific problems in those applications along with the existing deeplearning solutions to effectively address those problems. Furthermore, we have provided a thoroughdiscussion of the open issues and challenges in big sensed data in smart health, mainly focusing on thedata acquisition and processing aspects from the standpoint of deep learning techniques.
Acknowledgments: This material is based upon work supported by the Natural Sciences and EngineeringResearch Council of Canada (NSERC) under Grant RGPIN/2017-04032.
Author Contributions: Alex Adim Obinikpo and Burak Kantarci conceived and pursued the literature surveyon deep learning techniques on big sensed data for smart health applications, reviewed the state of the art,challenges and opportunities, and made conclusions. They both wrote the paper. Alex Adim Obinikpo createdthe illustrative images.
Conflicts of Interest: The authors declare no conflict of interest.
References
1. Guelzim, T.; Obaidat, M.; Sadoun, B. Chapter 1—Introduction and overview of key enabling technologies forsmart cities and homes. In Smart Cities and Homes; Obaidat, M.S., Nicopolitidis, P., Eds.; Morgan Kaufmann:Boston, MA, USA, 2016; pp. 1–16.
2. Liu, D.; Huang, R.; Wosinski, M. Development of Smart Cities: Educational Perspective. In Smart Learning inSmart Cities; Springer: Singapore, 2017; pp. 3–14.
161
Books
MDPI

J. Sens. Actuator Netw. 2017, 6, 26
3. Nam, T.; Pardo, T.A. Conceptualizing smart city with dimensions of technology, people, andinstitutions. In Proceedings of the 12th Annual International Digital Government Research Conference:Digital Government Innovation in Challenging Times, College Park, MD, USA, 12–15 June 2011; ACM:New York, NY, USA, 2011; pp. 282–291.
4. Anthopoulos, L.G. The Rise of the Smart City. In Understanding Smart Cities: A Tool for Smart Government oran Industrial Trick? Springer: Cham, Switzerland, 2017; pp. 5–45.
5. Munzel, A.; Meyer-Waarden, L.; Galan, J.P. The social side of sustainability: Well-being as a driver and anoutcome of social relationships and interactions on social networking sites. Technol. Forecast. Soc. Change2017, in press.
6. Fan, M.; Sun, J.; Zhou, B.; Chen, M. The smart health initiative in China: The case of Wuhan, Hubei province.J. Med. Syst. 2016, 40, 62.
7. Ndiaye, M.; Hancke, G.P.; Abu-Mahfouz, A.M. Software Defined Networking for Improved Wireless SensorNetwork Management: A Survey. Sensors 2017, 17, 1031.
8. Pramanik, M.I.; Lau, R.Y.; Demirkan, H.; Azad, M.A.K. Smart health: Big data enabled health paradigmwithin smart cities. Expert Syst. Appl. 2017, 87, 370–383.
9. Nef, T.; Urwyler, P.; Büchler, M.; Tarnanas, I.; Stucki, R.; Cazzoli, D.; Müri, R.; Mosimann, U. Evaluation ofthree state-of-the-art classifiers for recognition of activities of daily living from smart home ambient data.Sensors 2015, 15, 11725–11740.
10. Ali, Z.; Muhammad, G.; Alhamid, M.F. An Automatic Health Monitoring System for Patients Suffering fromVoice Complications in Smart Cities. IEEE Access 2017, 5, 3900–3908.
11. Hossain, M.S.; Muhammad, G.; Alamri, A. Smart healthcare monitoring: A voice pathology detectionparadigm for smart cities. Multimedia Syst. 2017, doi:10.1007/s00530-017-0561-x.
12. Mehta, Y.; Pai, M.M.; Mallissery, S.; Singh, S. Cloud enabled air quality detection, analysis andprediction—A smart city application for smart health. In Proceedings of the 2016 3rd MEC InternationalConference on Big Data and Smart City (ICBDSC), Muscat, Oman, 15–16 March 2016; pp. 1–7.
13. Sahoo, P.K.; Thakkar, H.K.; Lee, M.Y. A Cardiac Early Warning System with Multi Channel SCG and ECGMonitoring for Mobile Health. Sensors 2017, 17, 711.
14. Kim, T.; Park, J.; Heo, S.; Sung, K.; Park, J. Characterizing dynamic walking patterns and detecting falls withwearable sensors using Gaussian process methods. Sensors 2017, 17, 1172.
15. Yeh, Y.T.; Hsu, M.H.; Chen, C.Y.; Lo, Y.S.; Liu, C.T. Detection of potential drug-drug interactions foroutpatients across hospitals. Int. J. Environ. Res. Public Health 2014, 11, 1369–1383.
16. Venkatesh, J.; Aksanli, B.; Chan, C.S.; Akyurek, A.S.; Rosing, T.S. Modular and PersonalizedSmart Health Application Design in a Smart City Environment. IEEE Internet Things J. 2017, PP, 1,doi:10.1109/JIOT.2017.2712558.
17. Rajaram, M.L.; Kougianos, E.; Mohanty, S.P.; Sundaravadivel, P. A wireless sensor network simulationframework for structural health monitoring in smart cities. In Proceedings of the 2016 IEEE 6th InternationalConference on Consumer Electronics-Berlin (ICCE-Berlin), Berlin, Germany, 5–7 September 2016; pp. 78–82.
18. Hijazi, S.; Page, A.; Kantarci, B.; Soyata, T. Machine Learning in Cardiac Health Monitoring and DecisionSupport. IEEE Comput. 2016, 49, 38–48.
19. Ota, K.; Dao, M.S.; Mezaris, V.; Natale, F.G.B.D. Deep Learning for Mobile Multimedia: A Survey. ACM Trans.Multimedia Comput. Commun. Appl. 2017, 13, 34.
20. Yu, D.; Deng, L. Deep Learning and Its Applications to Signal and Information Processing [ExploratoryDSP]. IEEE Signal Process. Mag. 2011, 28, 145–154.
21. Larochelle, H.; Bengio, Y. Classification using discriminative restricted Boltzmann machines. In Proceedingsof the 25th International Conference on Machine Learning, Helsinki, Finland, 5–9 July 2008; pp. 536–543.
22. Vincent, P.; Larochelle, H.; Lajoie, I.; Bengio, Y.; Manzagol, P.A. Stacked denoising autoencoders: Learninguseful representations in a deep network with a local denoising criterion. J. Mach. Learn. Res. 2010,11, 3371–3408.
23. Wang, L.; Sng, D. Deep Learning Algorithms with Applications to Video Analytics for A Smart City:A Survey. arXiv 2015, arXiv:1512.03131.
24. Cavazza, J.; Morerio, P.; Murino, V. When Kernel Methods Meet Feature Learning: Log-Covariance Networkfor Action Recognition From Skeletal Data. In Proceedings of the 2017 IEEE Conference on Computer Visionand Pattern Recognition Workshops (CVPRW), Honolulu, HI, USA, 21–26 July 2017; pp. 1251–1258.
162
Books
MDPI

J. Sens. Actuator Netw. 2017, 6, 26
25. Keceli, A.S.; Kaya, A.; Can, A.B. Action recognition with skeletal volume and deep learning. In Proceedingsof the 2017 25th Signal Processing and Communications Applications Conference (SIU), Antalya, Turkey,15–18 May 2017; pp. 1–4.
26. LeCun, Y.; Bengio, Y.; Hinton, G. Deep learning. Nature 2015, 521, 436–444.27. Alsheikh, M.A.; Lin, S.; Niyato, D.; Tan, H.P. Machine Learning in Wireless Sensor Networks: Algorithms,
Strategies, and Applications. IEEE Commun. Surv. Tutor. 2014, 16, 1996–2018.28. Mohri, M.; Rostamizadeh, A.; Talwalkar, A. Foundations of Machine Learning; MIT Press:
Cambridge, MA, USA, 2012.29. Clifton, L.; Clifton, D.A.; Pimentel, M.A.F.; Watkinson, P.J.; Tarassenko, L. Predictive Monitoring of Mobile
Patients by Combining Clinical Observations with Data from Wearable Sensors. IEEE J. Biomed. HealthInform. 2014, 18, 722–730.
30. Tsiouris, K.M.; Gatsios, D.; Rigas, G.; Miljkovic, D.; Seljak, B.K.; Bohanec, M.; Arredondo, M.T.; Antonini, A.;Konitsiotis, S.; Koutsouris, D.D.; et al. PD_Manager: An mHealth platform for Parkinson’s disease patientmanagement. Healthcare Technol. Lett. 2017, 4, 102–108.
31. Hu, K.; Rahman, A.; Bhrugubanda, H.; Sivaraman, V. HazeEst: Machine Learning Based Metropolitan AirPollution Estimation from Fixed and Mobile Sensors. IEEE Sens. J. 2017, 17, 3517–3525.
32. Tariq, O.B.; Lazarescu, M.T.; Iqbal, J.; Lavagno, L. Performance of Machine Learning Classifiers for IndoorPerson Localization with Capacitive Sensors. IEEE Access 2017, 5, 12913–12926.
33. Jahangiri, A.; Rakha, H.A. Applying Machine Learning Techniques to Transportation Mode RecognitionUsing Mobile Phone Sensor Data. IEEE Trans. Intell. Transp. Syst. 2015, 16, 2406–2417.
34. Schmidhuber, J. Deep Learning in Neural Networks: An Overview. Neural Netw. 2014, 61, 85–117.35. Deng, L.; Yu, D. Deep learning: Methods and applications. Found. Trends Signal Process. 2014, 7, 197–387.36. Hinton, G.E.; Osindero, S.; Teh, Y.W. A fast learning algorithm for deep belief nets. Neural Comput. 2006,
18, 1527–1554.37. Do, T.M.T.; Gatica-Perez, D. The places of our lives: Visiting patterns and automatic labeling from
longitudinal smartphone data. IEEE Trans. Mob. Comput. 2014, 13, 638–648.38. Al Rahhal, M.M.; Bazi, Y.; AlHichri, H.; Alajlan, N.; Melgani, F.; Yager, R.R. Deep learning approach for
active classification of electrocardiogram signals. Inform. Sci. 2016, 345, 340–354.39. Acharya, U.R.; Fujita, H.; Lih, O.S.; Adam, M.; Tan, J.H.; Chua, C.K. Automated Detection of Coronary Artery
Disease Using Different Durations of ECG Segments with Convolutional Neural Network. Knowl.-Based Syst.2017, 132, 62–71.
40. Hosseini, M.P.; Tran, T.X.; Pompili, D.; Elisevich, K.; Soltanian-Zadeh, H. Deep Learning with EdgeComputing for Localization of Epileptogenicity Using Multimodal rs-fMRI and EEG Big Data. In Proceedingsof the 2017 IEEE International Conference on Autonomic Computing (ICAC), Columbus, OH, USA, 17–21July 2017; pp. 83–92.
41. Zheng, W.L.; Zhu, J.Y.; Peng, Y.; Lu, B.L. EEG-based emotion classification using deep belief networks.In Proceedings of the 2014 IEEE International Conference on Multimedia and Expo (ICME), Chengdu, China,14–18 July 2014; pp. 1–6.
42. Gu, W. Non-intrusive blood glucose monitor by multi-task deep learning: PhD forum abstract.In Proceedings of the 16th ACM/IEEE International Conference on Information Processing in SensorNetworks, Pittsburgh, PA, USA, 18–20 April 2017; ACM: New York, NY, USA, 2017; pp. 249–250.
43. Anagnostopoulos, T.; Zaslavsky, A.; Kolomvatsos, K.; Medvedev, A.; Amirian, P.; Morley, J.;Hadjieftymiades, S. Challenges and Opportunities of Waste Management in IoT-Enabled Smart Cities:A Survey. IEEE Trans. Sustain. Comput. 2017, 2, 275–289.
44. Taleb, S.; Al Sallab, A.; Hajj, H.; Dawy, Z.; Khanna, R.; Keshavamurthy, A. Deep learning with ensembleclassification method for sensor sampling decisions. In Proceedings of the 2016 International WirelessCommunications and Mobile Computing Conference (IWCMC), Paphos, Cyprus, 5–9 September 2016;pp. 114–119.
45. Costilla-Reyes, O.; Scully, P.; Ozanyan, K.B. Deep Neural Networks for Learning Spatio-Temporal Featuresfrom Tomography Sensors. IEEE Trans. Ind. Electron. 2018, 65, 645–653, doi:10.1109/TIE.2017.2716907.
46. Fang, S.H.; Fei, Y.X.; Xu, Z.; Tsao, Y. Learning Transportation Modes From Smartphone Sensors Based onDeep Neural Network. IEEE Sens. J. 2017, 17, 6111–6118.
163
Books
MDPI

J. Sens. Actuator Netw. 2017, 6, 26
47. Xu, X.; Yin, S.; Ouyang, P. Fast and low-power behavior analysis on vehicles using smartphones.In Proceedings of the 2017 6th International Symposium on Next Generation Electronics (ISNE),Keelung, Taiwan, 23–25 May 2017; pp. 1–4.
48. Eskofier, B.M.; Lee, S.I.; Daneault, J.F.; Golabchi, F.N.; Ferreira-Carvalho, G.; Vergara-Diaz, G.; Sapienza, S.;Costante, G.; Klucken, J.; Kautz, T.; et al. Recent machine learning advancements in sensor-based mobilityanalysis: Deep learning for Parkinson’s disease assessment. In Proceedings of the 2016 IEEE 38th AnnualInternational Conference of the Engineering in Medicine and Biology Society (EMBC), Orlando, FL, USA,16–20 August 2016; pp. 655–658.
49. Zhu, J.; Pande, A.; Mohapatra, P.; Han, J.J. Using deep learning for energy expenditure estimation withwearable sensors. In Proceedings of the 2015 17th International Conference on E-health Networking,Application & Services (HealthCom), Boston, MA, USA, 14–17 October 2015; pp. 501–506.
50. Jankowski, S.; Szymanski, Z.; Dziomin, U.; Mazurek, P.; Wagner, J. Deep learning classifier for fall detectionbased on IR distance sensor data. In Proceedings of the 2015 IEEE 8th International Conference onIntelligent Data Acquisition and Advanced Computing Systems: Technology and Applications (IDAACS),Warsaw, Poland, 24–26 September 2015; Volume 2, pp. 723–727.
51. Menotti, D.; Chiachia, G.; Pinto, A.; Schwartz, W.R.; Pedrini, H.; Falcao, A.X.; Rocha, A. Deep representationsfor iris, face, and fingerprint spoofing detection. IEEE Trans. Inform. Forensics Secur. 2015, 10, 864–879.
52. Yin, Y.; Liu, Z.; Zimmermann, R. Geographic information use in weakly-supervised deep learning forlandmark recognition. In Proceedings of the 2017 IEEE International Conference on Multimedia and Expo(ICME), Hong Kong, China, 10–14 July 2017; pp. 1015–1020.
53. Barreto, T.L.; Rosa, R.A.; Wimmer, C.; Moreira, J.R.; Bins, L.S.; Cappabianco, F.A.M.; Almeida, J. Classificationof Detected Changes from Multitemporal High-Res Xband SAR Images: Intensity and Texture DescriptorsFrom SuperPixels. IEEE J. Sel. Top. Appl. Earth Obs. Remote Sens. 2016, 9, 5436–5448.
54. Goodfellow, I.; Bengio, Y.; Courville, A. Deep Learning; MIT Press: Cambridge, MA, USA, 2016.55. Hinton, G.E.; Salakhutdinov, R.R. Reducing the dimensionality of data with neural networks. Science 2006,
313, 504–507.56. Alain, G.; Bengio, Y.; Rifai, S. Regularized auto-encoders estimate local statistics. Proc. CoRR 2012, 1–17.57. Rifai, S.; Bengio, Y.; Dauphin, Y.; Vincent, P. A generative process for sampling contractive auto-encoders.
arXiv 2012, arXiv:1206.6434.58. Abdulnabi, A.H.; Wang, G.; Lu, J.; Jia, K. Multi-Task CNN Model for Attribute Prediction.
IEEE Trans. Multimedia 2015, 17, 1949–1959.59. Deng, L.; Abdelhamid, O.; Yu, D. A deep convolutional neural network using heterogeneous pooling
for trading acoustic invariance with phonetic confusion. In Proceedings of the 2013 IEEE InternationalConference on Acoustics, Speech and Signal Processing, Vancouver, BC, Canada, 26–31 May 2013;pp. 6669–6673.
60. Aghdam, H.H.; Heravi, E.J. Guide to Convolutional Neural Networks: A Practical Application to Traffic-SignDetection and Classification; Springer: Cham, Switzerland, 2017.
61. Huang, G.; Lee, H.; Learnedmiller, E. Learning hierarchical representations for face verification withconvolutional deep belief networks. In Proceedings of the 2012 IEEE Conference on Computer Vision andPattern Recognition, Providence, RI, USA, 16–21 June 2012; pp. 2518–2525.
62. Ackley, D.H.; Hinton, G.E.; Sejnowski, T.J. A learning algorithm for boltzmann machines. Cognit. Sci. 1985,9, 147–169.
63. Salakhutdinov, R.; Mnih, A.; Hinton, G. Restricted Boltzmann machines for collaborative filtering.In Proceedings of the 24th international conference on Machine learning, Corvalis, OR, USA, 20–24 June2007; pp. 791–798.
64. Ribeiro, B.; Gonçalves, I.; Santos, S.; Kovacec, A. Deep Learning Networks for Off-Line HandwrittenSignature Recognition. In Proceedings of the 2011 CIARP 16th Iberoamerican Congress on PatternRecognition, Pucón, Chile, 15–18 November 2011; pp. 523–532.
65. Nie, D.; Zhang, H.; Adeli, E.; Liu, L.; Shen, D. 3D Deep Learning for Multi-Modal Imaging-Guided Survival TimePrediction of Brain Tumor Patients; Springer: Cham, Switzerland, 2016.
66. Rose, D.C.; Arel, I.; Karnowski, T.P.; Paquit, V.C. Applying deep-layered clustering to mammography imageanalytics. In Proceedings of the 2010 Biomedical Sciences and Engineering Conference, Oak Ridge, TN, USA,25–26 May 2010; pp. 1–4.
164
Books
MDPI

J. Sens. Actuator Netw. 2017, 6, 26
67. Kuang, D.; He, L. Classification on ADHD with Deep Learning. In Proceedings of the 2014 InternationalConference on Cloud Computing and Big Data, Wuhan, China, 12–14 November 2014; pp. 27–32.
68. Li, F.; Tran, L.; Thung, K.H.; Ji, S.; Shen, D.; Li, J. A Robust Deep Model for Improved Classification ofAD/MCI Patients. IEEE J. Biomed. Health Inform. 2015, 19, 1610–1616.
69. Esteva, A.; Kuprel, B.; Novoa, R.A.; Ko, J.; Swetter, S.M.; Blau, H.M.; Thrun, S. Dermatologist-levelclassification of skin cancer with deep neural networks. Nature 2017, 542, 115–118.
70. Sabouri, P.; GholamHosseini, H. Lesion border detection using deep learning. In Proceedings of the 2016IEEE Congress on Evolutionary Computation (CEC), Vancouver, BC, Canada, 24–29 July 2016; pp. 1416–1421.
71. Ha, S.; Choi, S. Convolutional neural networks for human activity recognition using multiple accelerometerand gyroscope sensors. In Proceedings of the 2016 International Joint Conference on Neural Networks(IJCNN), Vancouver, BC, Canada, 24–29 July 2016; pp. 381–388.
72. Sathyanarayana, A.; Joty, S.; Fernandez-Luque, L.; Ofli, F.; Srivastava, J.; Elmagarmid, A.; Arora, T.; Taheri, S.Sleep quality prediction from wearable data using deep learning. JMIR mHealth uHealth 2016, 4, e125.
73. Hammerla, N.Y.; Halloran, S.; Ploetz, T. Deep, convolutional, and recurrent models for human activityrecognition using wearables. arXiv 2016, arXiv:1604.08880.
74. Baccouche, M.; Mamalet, F.; Wolf, C.; Garcia, C.; Baskurt, A. Sequential deep learning for human actionrecognition. In International Workshop on Human Behavior Understanding; Springer: Berlin/Heidelberg,Germany, 2011; pp. 29–39.
75. Ji, S.; Xu, W.; Yang, M.; Yu, K. 3D convolutional neural networks for human action recognition. IEEE Trans.Pattern Anal. Mach. Intell. 2013, 35, 221–231.
76. Karpathy, A.; Toderici, G.; Shetty, S.; Leung, T.; Sukthankar, R.; Fei-Fei, L. Large-scale video classificationwith convolutional neural networks. In Proceedings of the 2014 IEEE Conference on Computer Vision andPattern Recognition, Columbus, OH, USA, 23–28 June 2014; pp. 1725–1732.
77. Cheron, G.; Draye, J.P.; Bourgeios, M.; Libert, G. A dynamic neural network identification ofelectromyography and arm trajectory relationship during complex movements. IEEE Trans. Biomed. Eng.1996, 43, 552–558.
78. Page, A.; Hijazi, S.; Askan, D.; Kantarci, B.; Soyata, T. Research Directions in Cloud-Based Decision SupportSystems for Health Monitoring Using Internet-of-Things Driven Data Acquisition. Int. J. Serv. Comput. 2016,4, 18–34.
79. Guo, B.; Han, Q.; Chen, H.; Shangguan, L.; Zhou, Z.; Yu, Z. The Emergence of Visual Crowdsensing:Challenges and Opportunities. IEEE Commun. Surv. Tutor. 2017, PP, 1, doi:10.1109/COMST.2017.2726686.
80. Ma, H.; Zhao, D.; Yuan, P. Opportunities in mobile crowd sensing. IEEE Commun. Mag. 2014, 52, 29–35.81. Haddawy, P.; Frommberger, L.; Kauppinen, T.; De Felice, G.; Charkratpahu, P.; Saengpao, S.;
Kanchanakitsakul, P. Situation awareness in crowdsensing for disease surveillance in crisis situations.In Proceedings of the Seventh International Conference on Information and Communication Technologiesand Development, Singapore, 15–18 May 2015; p. 38.
82. Cardone, G.; Foschini, L.; Bellavista, P.; Corradi, A.; Borcea, C.; Talasila, M.; Curtmola, R. Fosteringparticipaction in smart cities: a geo-social crowdsensing platform. IEEE Commun. Mag. 2013, 51, 112–119.
83. Pan, Z.; Yu, H.; Miao, C.; Leung, C. Crowdsensing Air Quality with Camera-Enabled Mobile Devices.In Proceedings of the Twenty-Ninth IAAI Conference, San Francisco, CA, USA, 6–9 February 2017;pp. 4728–4733.
84. Mittal, G.; Yagnik, K.B.; Garg, M.; Krishnan, N.C. SpotGarbage: Smartphone app to detect garbage usingdeep learning. In Proceedings of the 2016 ACM International Joint Conference on Pervasive and UbiquitousComputing, Heidelberg, Germany, 12–16 September 2016; pp. 940–945.
85. Habibzadeh, H.; Qin, Z.; Soyata, T.; Kantarci, B. Large Scale Distributed Dedicated- and Non-DedicatedSmart City Sensing Systems. IEEE Sens. J. 2017, 17, 7649–7658, doi:10.1109/JSEN.2017.2725638.
86. Xu, L.; Hao, X.; Lane, N.D.; Liu, X.; Moscibroda, T. More with Less: Lowering User Burden inMobile Crowdsourcing through Compressive Sensing. In Proceedings of the 2015 ACM InternationalJoint Conference on Pervasive and Ubiquitous Computing, Osaka, Japan, 7–11 September 2015; ACM:New York, NY, USA, 2015; pp. 659–670.
87. Pouryazdan, M.; Kantarci, B. The Smart Citizen Factor in Trustworthy Smart City Crowdsensing. IT Prof.2016, 18, 26–33.
165
Books
MDPI

J. Sens. Actuator Netw. 2017, 6, 26
88. Pouryazdan, M.; Kantarci, B.; Soyata, T.; Song, H. Anchor-Assisted and Vote-Based TrustworthinessAssurance in Smart City Crowdsensing. IEEE Access 2016, 4, 529–541.
89. Farahani, B.; Firouzi, F.; Chang, V.; Badaroglu, M.; Constant, N.; Mankodiya, K. Towards fog-driven IoTeHealth: Promises and challenges of IoT in medicine and healthcare. Future Gener. Comput. Syst. 2018,78, 659–676.
90. Kleesiek, J.; Urban, G.; Hubert, A.; Schwarz, D.; Maier-Hein, K.; Bendszus, M.; Biller, A. Deep MRI brainextraction: A 3D convolutional neural network for skull stripping. Neuroimage 2016, 129, 460–469.
91. Fritscher, K.; Raudaschl, P.; Zaffino, P.; Spadea, M.F.; Sharp, G.C.; Schubert, R. Deep Neural Networks for FastSegmentation of 3D Medical Images. In Medical Image Computing and Computer-Assisted Intervention—MICCAI;Springer: Cham, Switzerland, 2016.
92. Fakoor, R.; Ladhak, F.; Nazi, A.; Huber, M. Using deep learning to enhance cancer diagnosis and classification.In Proceedings of the 30th International Conference on Machine Learning, Atlanta, GA, USA, 16–21 June 2013.
93. Khademi, M.; Nedialkov, N.S. Probabilistic Graphical Models and Deep Belief Networks for Prognosis ofBreast Cancer. In Proceedings of the 2015 IEEE 14th International Conference on Machine Learning andApplications, Miami, FL, USA, 9–11 December 2016; pp. 727–732.
94. Angermueller, C.; Lee, H.J.; Reik, W.; Stegle, O. DeepCpG: Accurate prediction of single-cell DNAmethylation states using deep learning. Genome Biol. 2017, 18, 67.
95. Tian, K.; Shao, M.; Wang, Y.; Guan, J.; Zhou, S. Boosting Compound-Protein Interaction Prediction by DeepLearning. Methods 2016, 110, 64–72.
96. Che, Z.; Purushotham, S.; Khemani, R.; Liu, Y. Distilling Knowledge from Deep Networks with Applicationsto Healthcare Domain. Ann. Chirurgie 2015, 40, 529–532.
97. Lipton, Z.C.; Kale, D.C.; Elkan, C.; Wetzell, R. Learning to Diagnose with LSTM Recurrent NeuralNetworks. In Proceedings of the International Conference on Learning Representations (ICLR 2016),San Juan, Puerto Rico, 2–4 May 2016.
98. Liang, Z.; Zhang, G.; Huang, J.X.; Hu, Q.V. Deep learning for healthcare decision making with EMRs.In Proceedings of the IEEE International Conference on Bioinformatics and Biomedicine, Belfast, UK,2–5 November 2014; pp. 556–559.
c© 2017 by the authors. Licensee MDPI, Basel, Switzerland. This article is an open accessarticle distributed under the terms and conditions of the Creative Commons Attribution(CC BY) license (http://creativecommons.org/licenses/by/4.0/).
166
Books
MDPI

Journal of
Actuator NetworksSensor and
Article
Enhanced IoT-Based End-To-End Emergency andDisaster Relief System
Dhafer Ben Arbia 1,2,*, Muhammad Mahtab Alam 3, Abdullah Kadri 1, Elyes Ben Hamida 1 and
Rabah Attia 2
1 Qatar Mobility Innovations Center (QMIC), Qatar University, Doha P.O. Box. 210531, Qatar;[email protected] (D.B.A); [email protected] (A.K.); [email protected] (E.B.H.)
2 SERCOM Lab, Polytechnic School of Tunisia, University of Carthage, P.O. Box 743, La Marsa 2078, Tunisia;[email protected]
3 Thomas Johann Seebeck Department of Electronics, School of Information Technology,Tallinn University of Technology, P.O. Box 10120 Tallinn, Estonia; [email protected]
* Correspondence: [email protected]; Tel.: +974-5010-8593
Received: 30 June 2017; Accepted: 9 August 2017; Published: 21 August 2017
Abstract: In this paper, we present a new enhancement for an emergency and disaster reliefsystem called Critical and Rescue Operations using Wearable Wireless sensors networks (CROW2).We address the reliability challenges in setting up a wireless autonomous communication systemin order to offload data from the disaster area (rescuers, trapped victims, civilians, media, etc.)back to a command center. The proposed system connects deployed rescuers to extended networksand the Internet. CROW2 is an end-to-end system that runs the recently-proposed OptimizedRouting Approach for Critical and Emergency Networks (ORACE-Net) routing protocol. The systemintegrates heterogeneous wireless devices (Raspberry Pi, smart phones, sensors) and variouscommunicating technologies (WiFi IEEE 802.11n, Bluetooth IEEE 802.15.1) to enable end-to-endnetwork connectivity, which is monitored by a cloud Internet-of-Things platform. First, wepresent the CROW2 generic system architecture, which is adaptable to various technologiesintegration at different levels (i.e., on-body, body-to-body, off-body). Second, we implementthe ORACE-Net protocol on heterogeneous devices including Android-based smart phones andLinux-based Raspberry Pi devices. These devices act as on-body coordinators to collect informationfrom on-body sensors. The collected data is then pushed to the command center thanks tomulti-hop device-to-device communication. Third, the overall CROW2 system performance isevaluated according to relevant metrics including end-to-end link quality estimation, throughput andend-to-end delay. As a proof-of-concept, we validate the system architecture through deploymentand extracted experimental results. Finally, we highlight motion detection and links’ unavailabilityprevention based on the recorded data where the main factors (i.e., interference and noise) that affectthe performance are analyzed.
Keywords: tactical multi-hop routing protocol; Internet-of-Things; optimized routing approach forcritical and emergency networks; disaster relief system; body-to-body communication
1. Introduction
According to the United Nations Office of Disaster Risk Reduction (UNISDR), the financial impactdue to natural and man-made disasters is paramount. It is reported that by 2030, the global average ofannual losses due to disasters is forecasted to increase and reach 415 billion USD [1]. These losses surelydecrease when a preventive communication strategy is ready to be triggered in a disaster incident.
J. Sens. Actuator Netw. 2017, 6, 19 167 www.mdpi.com/journal/jsan
Books
MDPI

J. Sens. Actuator Netw. 2017, 6, 19
Indeed, two recent crises showed how important communication alternatives could be during thedisaster relief operations. (1) In March 2011, a 9.0 magnitude earthquake caused a tsunami of 30 feetin Japan, the fourth-largest earthquake on record (since 1900), and six nuclear reactors in FukushimaDaiichi plant were affected (two pools of reactors exploded). Japan’s Fire and Disaster ManagementAgency confirmed that 22,000 people are dead or missing. During the Fukushima disaster, emergencyteams and the army were using classic High Frequency (HF) military radio communication withoutdata transmission. Local taxi drivers were coordinating rescue operations using their on-board radiocommunication devices traditionally used for reservations. (2) In January 2010, Haiti earthquake, of a7.0 magnitude, was another example of the use of Very High Frequency (VHF) radio communicationand satellite phones. During the 24 h after the disaster, disaster task forces did not have a clear visionof the whole situation. Such catastrophes’ relief operations are impossible to conduct without analternative data communication system immediately deployable and operational.
To that end, we have recently proposed a new routing protocol called Optimized RoutingApproach for Critical and Emergency Networks (ORACE-Net) [2]. ORACE-Net is a multi-hop routingprotocol, which rates every end-to-end link with regards to its quality (i.e., end-to-end link qualityestimation). This metric varies according to the nodes’ mobility, which is the most relevant criteria forreliable emergency systems.
Our previous work [3] was constrained by the following factors: First, there were no real on-bodysensors. We generated data for a fictitious network on the mobile nodes as the application layerpayload. Second, the initial experimental results indicate that the average disconnections increasesignificantly when the end-to-end route has more than two hops. Third, as the achieved results werecollected in an indoor scenario, several wireless devices were causing interference on the deployednetwork and consequently reducing the global network performance. Fourth, with reference to oneof the most studied problem in network design, the Capacitated Network Design Problem (CNDP)detailed in [4] on the basis of the results in [5], we re-studied the number of deployed nodes withregards to the network traffic uncertainty. Indeed, eight nodes caused an overhead on the routing layerand made the routing process too slow and, consequently, the round trip time was high. Thus, wereduced the number of deployed tactical nodes to four. It is important to note here that this givennumber of tactical devices must be carefully selected according to the area dimensions. Bertsekasin [6] provides a complete study of the discrete network optimization problems, and Marotta et al.in [7] propose a heuristic that can be used to warm-start the solution process of the solver, acceleratingthe convergence towards the optimum. The latter proposed solution approach would be perfect forselecting the optimal number of tactical nodes considering traffic uncertainty in discrete networkoptimization problems. For small and medium-sized networks (up to 25 nodes), an analytical studygiven in [8] consists of a reference to converge to an optimized network design independently ofthe traffic uncertainty. Finally, according to the collected results, we were unable to evaluate thethroughput accuracy due to the significant number of disconnections and high round trip time delay.
Some of the benefits of this paper are addressing the above limitations and improving theproposed routing approach behavior, in particular the average throughput, the round trip time delay(RTTDelay) and the end-to-end link quality estimation (E2ELQE). This work provides the followingmain contributions:
• The Critical and Rescue Operations using Wearable Wireless sensors networks (CROW2) systemis one of the rare proof-of-concept implementations of emergency ad hoc autonomous systems.Unlike the detailed works in Section 2, as an application layer payload, we use real-time humanvital signs (motion data, heartbeat, magnetometer, etc.) collected from the on-body sensorsand pushed to the IoT platform. The evaluation of the proposed system is realized on a realindoor test-bed under realistic conditions. Indeed, we experimentally investigate the mobiledevices’ behavior with regards to key performance metrics, such as throughput, end-to-end delay,end-to-end link quality estimation during sensing and disseminating data onto the IoT platform.
168
Books
MDPI

J. Sens. Actuator Netw. 2017, 6, 19
• The implemented scenario is a reference experiment for researchers and professionals toevaluate concretely the trade-off between the
{E2ELQE, throughput
}and
{RTTDelay, jitter
}in
the disaster relief context [9]. Additionally, this work emphasizes the difference between UDPand TCP transport mode performances in disaster relief applications and may be considered as areference for upcoming application implementations with regards to the bandwidth limitations.Moreover, the realized experiment advises also on the optimal hop count to guarantee therequired throughput for the critical applications (medical support, military, firefighters, press andmedia, etc.).
• The proposed system is back-ended by an IoT platform. Indeed, at the IoT platform level, weprove the system’s capability for mobility pattern recognition and prediction. Then, we discussthe overall interference affecting the mobile devices behavior for the considered indoor scenario.The proposed system shows also a global connectivity status of all of the deployed devices duringthe disaster relief operations.
The remainder of this paper is organized as follows: In Section 2, we present research worksproposed recently related to the emergency relief operation systems. In Section 3, we introduce theCROW2 system generic architecture. In Section 4, we focus on the implementation technologies inaccordance with the on-body and body-to-body communications. In the last section, we describe theexperimentation scenario, and we discuss the obtained results. Finally, we conclude by summarizingthe paper’s contributions, and we present some promising directions for future research.
2. Related Works
When conducting disaster relief operations, two relevant challenges arise: (i) setting up animmediate emergency wireless network to inter-connect on-the-field rescuers with trapped survivors;and (ii) relaying the emergency network to the Internet and extended networks.
Chen et al. in [10] classify the applications into three main classes: (i) remote health andfitness monitoring, (ii) military and training and (iii) intelligent biosensors for vehicle area networks.Moreover, the authors in [10] discuss a list of research projects and implementations, in particularthe Advanced Health and Disaster Aid Network (AID-N) [11], which targets disaster and publicsafety applications. AID-N uses a wired connection for BAN communication and mesh and ZigBeefor the Body-to-Body Network (BBN). Off-body communication in AID-N is fulfilled through WiFi,cellular networks and the Internet. AID-N aims to sense pulse, blood pressure, temperature andECG. Negra et al. in [12] focus more on the following major medical applications: (i) telemedicine andremote patient monitoring, (ii) rehabilitation and therapy, (iii) biofeedback and (iv) ambient assistedliving. The latter work discusses also the QoS requirements for the medical context.
Recently, research trends have aimed at relying on large-scale LTE/4G-enabled networks tointer-connect deployed devices during disaster relief operations. For instance, the authors in [13]introduced the Device-to-Device (D2D) communication scheme to allow user equipment (UE) tocommunicate within the reachable neighborhood. The proposed scheme sets up an ad hoc wirelessnetwork, which relies on the base stations evolved NodeBs (eNBs) at the network startup. Therefore,the solution still depends on the 4G network infrastructure. Definitely, the unavailability of the 4Gbackbone causes the unavailability of the proposed D2D wireless network.
We cite among, other works, approaches that studied and implemented alert messaging systems,such as the Reliable Routing Technique (RRT) [14] and TeamPhone [15]. Both approaches consistof setting up a smartphone messaging system, which is able to send alert notifications by bridgingcellular networks or over ad hoc and opportunistic networks. These proposed systems seem to solvethe connectivity issues on-the-field between rescuers and trapped survivors. However, devices inthe disaster area may only communicate within one hop. Devices select one next hop only, and noneighborhood discovery is done. Thus, RRT and TeamPhone are not topology-aware and do notconsider external network extension with the Internet or other networks.
169
Books
MDPI

J. Sens. Actuator Netw. 2017, 6, 19
The authors in [16] propose a localization-based and network congestion adaptive approachcalled “DistressNet”. DistressNet is claimed to be efficient in congestion avoidance during disasterrelief operations; however, this approach is not appropriate for indoor rescue operations due to itslocalization mechanism, which renders multi-hop algorithms inefficient. The authors in [17] adoptedthe WiFi Direct standard for the “Emergency Direct Mobile App”, which is intended to divide the setof smart phones into groups communicating in peer-to-peer mode assured by WiFi Direct. One ofthe devices is selected as the Group Owner (GO) and acts as the access point for its group and as agateway elsewhere. The rest of the devices act as Group Relays (GR). The network topology formationin this strategy causes an important delay. Additionally, with regards to the high mobility imposed bythe emergency context, the network topology update (i.e., GO negotiation and election, GR selection)increases data transmissions latency.
The earliest proposed schemes aim to enhance the on-body devices’ transmission reliability andto improve the energy efficiency. Chen et al. in [18] proposed a novel Cross-Layer Design Optimization(CLDO) scheme. Indeed, the design of CLDO relies on the three lower layers (i.e., PHY, MAC andnetwork layer). Power consumption is firstly optimized by selecting optimal power relays. Then, theremaining energy in leaf nodes is utilized to increase the lifetime and the reliability. An optimal packetsize is given for energy efficiency. Chen et al. claim that an inevitably slight overhead accompaniesCLDO processing for different factors. First, during network initialization, complex procedures are run.Second, the algorithm uses a certain number of iterations, which influences the overall performance.Third, CLDO lacks the capacity to manage dynamic location situations.
Another approach presented by Tsouri et al. in [19] relies on Dijkstra’s algorithm augmented withnovel link cost function designed to balance energy consumption across the network. This lattertechnique avoids relaying through nodes, which spent more accumulated energy than others.Indeed, routing decisions are made based on the energy optimization. The authors claim that theproposed approach increases the network lifetime by 40% with a slight increase of the energy consumedper bit. However, this work does not fulfill the operational application requirements, which rely on theBBN network for connectivity and routing.
D’Andreagiovanni et al. in [4] introduced a new approach able to handle the uncertaintythat affects traffic demands in the Multi-Period Capacitated Network Design Problem (MP-CNDP).Additionally, a hybrid primal heuristic based on the combination of a randomized fixing algorithmwas proposed by the authors based on ant colony optimization and exact large neighborhoodsearch. This previous strategy has been improved by D’Andreagiovanni et al. in [20]. The authorsadopt a best performance solution based on the min-max approach algorithm, which relies on acombination of a probabilistic fixing procedure, guided by linear relaxations, and an exact largevariable neighborhood search, which has been proposed in [4]. D’Andreagiovanni et al. extendedtheir preliminary work [20] by the new Integer Linear Programming (ILP) heuristic to solve the designproblem. Furthermore, new techniques detailed in [21] fix the variables expressing routing decisionsand employ an initial deterministic fixing phase of the variables modeling the activation of relaynodes. Experiments conducted in this work show that the proposed approach outperforms the existingoptimization solvers’ strategies.
Miranda et al. in [22] implemented and evaluated a complete Common Recognition andIdentification Platform (CRIP) for the healthcare IoT. CRIP enables a basic configuration andcommunication standardization of healthcare ‘things’. Security and privacy and health devices’integration are also covered within this approach. Miranda et al. deployed CRIP according to differentcommunication standards, such as NFC, biometrics (fingerprints) and Bluetooth.
The above proposed approaches are limited for various reasons according to two main classes(O: Operational; T: Technical): (O1) the implemented network is not open to be connected to extendednetworks (i.e., Internet or military communication platforms); (O2) no command center is consideredon-the-field for operations conduct, and therefore, nodes only share their status between each other;(O3) limited services (i.e., alert messages, notifications, etc., only); (T1) nodes in the network have no
170
Books
MDPI

J. Sens. Actuator Netw. 2017, 6, 19
visibility on the neighborhood and the network topology; (T2) routes (which do not exist for somenon-multihop approaches) are neither updated according to the quality of the links’ variations basedon the mobility, nor according to energy efficiency and commanding proximity. To summarize thevarious protocols and systems, a benchmark comparison is given in Table 1.
Table 1. Recent implemented disaster management systems benchmark. RRT, Reliable Routing Technique.
Protocols and SystemsWirelessStandard
Multi-HopTopology
AwarenessInfrastructureDependency
NetworkExtensibility
Sensing DevicesIntegration
RRT [14] N/A No No No No N/ADistressNet [16] ad hoc WiFi Yes Yes No No N/ADisaster 4 G [13] LTE/4G Yes Yes Yes Yes N/A
Emergency Direct [17] WiFi Direct No Yes No No N/ATeamPhone [15] ad hoc WiFi/SMS No No Yes No N/A
CROW2 (this work) ad hoc WiFi Yes Yes No Yes Yes
3. The CROW2 System
The Critical Rescue Operation using Wearable Wireless sensor networks (CROW2) is a standalonesystem that enables a wireless ad hoc network in order to connect human beings (rescuers, trappedsurvivors, civilians, media and press, etc.) to each other, from one side, and to the Internet (or anyextended network), from the other side, during disaster relief operations. The overall objectives andchallenges to be addressed were initially described in [23].
3.1. History of the CROW2 System
The CROW2 system is realized under the CROW2 project. Among the contributions of the project,notably, we proposed realistic channel models and simulation environment for Body Area Networks(BAN) and Body-to-Body Networks (BBN or B2B) [24]. We evaluated the IEEE 802.15.6 WBANstandard under the realistic channel, radio and mobility models; in particular, the proposed MACprotocols were compared for application-specific design; additionally, new dynamic MAC protocolswere proposed in [25,26]. Furthermore, at the MAC layer, the IEEE 802.15.6 standard’s proposedcoexistence schemes for co-channel were evaluated in order to investigate the impact of interferencefrom co-located BANs [24].
For that, we studied and compared the effectiveness of distributed and cluster-based architecturesfor Body-to-Body communications (BBNs or B2B). Then, various routing protocols among differentclasses including proactive, reactive, geographic-based and gradient-based were simulated andevaluated in [2]. Finally, we proposed a new optimized routing protocol specifically designed forthe emergency and disaster relief communication networks. The routing protocol was implementedand evaluated on the WSNet [27] simulator within a realistic disaster mobility pattern. Finally, weimplement the entire system on real mobile devices (smart phones and Raspberry Pi devices) forperformance assessment within this paper.
3.2. CROW2 System Architecture
The CROW2 system is a set of wireless distributed devices equipped with wireless sensorsintended to collect real-time data (i.e., vital signs, stress level, locations, ambient intelligence [28], etc.)from Wireless Body Area Network (WBAN) nodes towards a cloud IoT platform. Figure 1 depicts thegeneral architecture of the next generation WBAN. A node in the proposed system could be either:(i) tactical (deployed by rescuers while moving inside the disaster area) or (ii) mobile (carried on-bodyby rescuers or trapped survivors). Tactical nodes establish a wireless tactical backbone, which extendsthe network coverage. Mobile nodes, being in proximity of the tactical backbone, could route packetsthrough it as depicted in Figure 2b. We call these tactical devices ORACE-Net Tactical Devices (OTDs).Mobile devices carried on-body rely on both the OTDs and the other mobile devices to route data.Data collected from deployed nodes (i.e., tactical and mobile) are routed through the network towards
171
Books
MDPI

J. Sens. Actuator Netw. 2017, 6, 19
the Command Center node (CC node). The CC node is a tactical command center deployed as agateway allowing the emergency network to be linked to wide infrastructure networks (e.g., Internet,military platforms, other emergency networks, etc.). The CC node is also the node through whichthe operations’ commanders send their instructions to the rescuers and the rescuers send back theirfeedback to the CC node. It is important to note here that multiple CC nodes could be deployed andactivated in the case of single CC failure.
Figure 1. General architecture of the wireless body-area-network system. BAN: Body-Area-Network, BBN:Body-to-Body communication, Off-Body communication: all non-BAN and non-BBN communications.
(a)
Figure 2. Cont.
172
Books
MDPI

J. Sens. Actuator Netw. 2017, 6, 19
(b)
Figure 2. (a) CROW2 system layer-based architecture. BT: Bluetooth, ZB: ZigBee, WF: WiFi, WB:WBAN. For the CROW2 system, we considered Bluetooth between sensors and the coordinator andWiFi IEEE802.11n between WBANs and the Command Center node (CC node). (b) Multi-hop aspect inCROW2; Data are routed from/through mobile/tactical nodes towards the Internet. MQTT, MessageQueuing Telemetry Transport.
3.3. CROW2 System Enhancement
As depicted in the layer-based architecture in Figure 2a, CROW2 consists of two Wireless BodyArea Networks (WBANs), or more, connected to a cloud IoT platform through the CC node. EachWBAN node is composed of: (i) a WBAN coordinator, which is a wireless device with advanced energyand communication features, (ii) on-body sensors, which may feature different communicationstechnologies (i.e., Bluetooth IEEE802.15.1, WiFi IEEE802.11a/b/g/n, ZigBee IEEE802.5.4 and WBANIEEE802.15.6). Sensors are connected among one of the previous technologies to the WBAN coordinator.The BBN routing is assured by the ORACE-Net routing protocol according to the architecture depictedin Figure 1. As the payload at the application layer, we deployed an Message Queuing TelemetryTransport [29] client (on tactical and mobile devices) to push data to the IoT platform.
The CROW2 system is improved through this work. Compared to our previous work [3], we haveinstalled on-body sensors provided by Shimmer [30]. Therefore, the current system payload consistsof real sensed vital sign data from the human body towards the IoT platform. To improve connectivityand mitigate interference, we reduced the tactical devices (OTDs) to four. Additionally, we reducedthe number of active indoor wireless access points, since we assume that during the disaster, they willbe damaged.
4. CROW2 System Implementation
In this section, we explain how the CROW2 system is implemented. We present first theon-body communication; then, we present the body-to-body communication implementation. Finally,we describe the off-body components’ implementation, in particular the Labeeb-IoT platform.
173
Books
MDPI

J. Sens. Actuator Netw. 2017, 6, 19
4.1. On-Body Communication
WBAN covers the communication between the coordinator (which is the main on-body deviceresponsible for communication with other BANs and off-body devices) and the rest of the on-bodyor under skin sensors. For the CROW2 system, on-body communication is established betweensensors (i.e., Shimmer [31]) and the Android mobile application (i.e., Labeeb-IoT Shimmer SensingAndroid App).
Shimmer sensors [31] are sensing devices capable of measuring physical quantities(e.g., acceleration, gyroscope X, Y, Z and angle, triple axis magnetic field, pressure, etc.) and sharingthem via Bluetooth. Shimmer provides a Service Development Kit (SDK) that affords the possibilityto read real-time data from the sensor by an Android or IOS mobile application. We place theShimmer sensor on-body as shown in Figure 3. Once connected via Bluetooth, our mobile application(Labeeb-IoT Shimmer Sensing Android App) starts reading data from the sensor and sharing themwith the IoT platform.
Figure 3. Real-time data collected by the ORACE-Net Mobile Device (OMD), routed through theORACE-Net network and then displayed on the Labeeb-IoT platform.
The Labeeb-IoT Shimmer Sensing Android App is responsible for collecting data from sensorsand transmitting them onto the Labeeb-IoT platform using the Message Queuing Telemetry Transport(MQTT) protocol [29]. Figure 4a depicts a screenshot from the live activity of the mobile app with thedifferent real-time sensed parameters before being pushed to the Labeeb-IoT platform.
174
Books
MDPI

J. Sens. Actuator Netw. 2017, 6, 19
(a) (b) (c)
Figure 4. (a) A screen-shot from the Labeeb-IoT Shimmer sensing mobile app, which collects data fromShimmer [31] sensors and pushes them to the Internet of Things platform (Labeeb-IoT). (b) Testbed:a photo of the ORACE-Net mobile devices displaying the real-time events (received "Hello" andAdvertisement ("ADV") packets) and the current route. (c) The Labeeb-IoT [32] interface shows thevariation of the sensed data from the Shimmer sensor connected to the mobile node.
4.2. Body-To-Body Communication
Body-to-body communications consist of the communications between coordinators (i.e., mobiledevices) carried by the rescuers, survivors and also the communications between coordinators andtactical devices, as shown in Figure 2b. The ORACE-Net routing protocol assures routing betweenCROW2 devices. With regards to the operational requirements of a disaster relief mission, we assumethat the first rescue teams reaching the incident area deploy wireless tactical devices (i.e., OTDs) toenable a wireless ad hoc tactical network on site. We describe these in the two following subsections.The implementation of the ORACE-Net routing protocol is describe for: (i) ORACE-Net TacticalDevices (OTDs) (ii) and ORACE-Net Android Mobile Device (OMD). Both devices are depicted inFigure 5.
4.2.1. Android Mobile Devices
These devices are designed based on the ORACE-Net Android application, which is a mobile appcoded in Java and deployed on Android v4.2.2 CyanogenMod 10.0 distribution. This mobile app isdedicated to route data through the emergency network based on the ORACE-Net routing protocol.The ORACE-Net Android application is implemented at the user level as depicted in Figure 6a.It exploits the features of the Linux operating system at the kernel layer through the Dalvik VirtualMachine. Figure 6b depicts the ORACE-Net mobile application components, which are: (1) eventslistener, (2) broadcast receivers, (3) services, (4) content providers and (5) display activities. Therelevant component in the architecture is the events listener, which triggers the rest of the tasks. Anevents listener is used to catch events (e.g., unicasted, multicasted or broadcasted packets, clickedbutton, typed text, etc.). In the ORACE-Net Android application, the events listener is implemented asa socket with a multi-cast IP address/Port: 224.0.0.1/10000. A similar socket is implemented with theC-language on Linux for the tactical deployed devices. Received packets through the events listener
175
Books
MDPI

J. Sens. Actuator Netw. 2017, 6, 19
are handled by the broadcast receivers component to be hulled. Particularly, the content providerallows the application to share the application output with other servers or platforms. Figure 4b is ascreenshot of the ORACE-Net mobile app showing the received/transmitted Hello and Advertisement(ADV)packets, the next-hop and the hop count to the CC node.
Figure 5. Experimentation scenario and data flow from deployed nodes to the Labeeb-IoT platform.The Command Center (CC node) is placed at the Back Gate (BG); ORACE-Net Mobile Devices (OMD)are mobile devices carried by the rescuers to which Shimmer sensors are connected via Bluetooth. Thetactical ORACE-Net network is established through ORACE-Net Linux Tactical Devices (OTD). Allcollected data go through the CC node to the Labeeb-IoT platform. A real-time dynamic topologywebsite instantly displays the network topology.
Figure 6. (a) ORACE-Net system-oriented stack over Linux and Android. (b) ORACE-Net Androidapplication architecture.
176
Books
MDPI

J. Sens. Actuator Netw. 2017, 6, 19
4.2.2. ORACE-Net Tactical Devices
These tactical devices are implemented based on Linux applications. Indeed, we implementedthe ORACE-Net protocol on Raspbian v8.0, a free operating system based on Debian optimized forthe Raspberry Pi hardware. Linux libraries are used to operate various protocol events (i.e., socketconnections, packets encapsulation, multicasting and broadcasting). We use shell scripts to display thestatus and statistics and to manage the processes of the protocol. The logging system in the tacticaldevices is based on the operating system logging service Syslog. Finally, data are pushed to theLabeeb-IoT platform via the MQTT protocol client installed on every OTD.
4.3. Off-Body Communication
Communication between the CC node and the Labeeb-IoT platform covers the off-bodycommunication of the CROW2 system, as depicted in Figures 1 and 5.
The Internet of Things (IoT) is an emerging technology developed for smart living solutions.IoT solutions are online platforms capable of receiving sensed real-time data from diverse types ofdevices (including sensors, actuators, coordinators, gateways, etc.) that could be deployed in a vastgeographic area. Such platforms are able to collect, store, publish and analyze data according to manyparameters. With respect to the MQTT standard [29], the Labeeb-IoT platform uses a publish/subscribearchitecture in contrast with the HTTP request/response paradigm architecture. Publish/subscribe isevent-driven and enables messages to be pushed by clients using the MQTT protocol. The MQTT clientcommunicates with the broker using predefined methods (e.g., connect, disconnect, subscribe, publish).Labeeb-IoT offers various APIs and RESTful and/or JavaScript Object Notation (JSON) web services.
In our experiments, ORACE-Net devices (mobile and tactical) push continuously and instantlythe following data to the Labeeb-IoT platform: (1) device identifier (DeviceId), (2) device location(Location), (3) device neighbors’ list (Neighbors), (4) next-hop to the CC node (NHCC), (5) E2ELQE and(6) Hopcount to the CC node. Data are stored in the platform database and then could be extracted anddisplayed on Labeeb-IoT as shown in Figure 4c.
5. Experimentation
5.1. Deployment Scenario and Experimental Setup
In our experiments, we consider a disaster scenario in our office, Qatar Mobility InnovationsCenter (QMIC), in Qatar Science and Technology Park (QSTP). Our test-bed consists of four RaspberryPi devices (Raspberry Pi Foundation, Cambridge, UK) and two rooted Samsung Galaxy S3-I9300 smartphones (Samsung Electronics Co. Ltd., Suwon, South Korea) with the ORACE-Net routing protocolimplemented. The office map is shown in Figure 5. The scenario is as follows: rescue teams accessthe office from the Back Gate (BG). First, they deploy the CC node in a trusted and safe location (nearthe entrance gate) where they are connected to the Internet through an Ethernet or WiFi access point(these links could be provided with military microwave or satellite connections). Upon their entranceinside the office, rescuers start deploying tactical devices (OTD) as base stations in order to havethe maximum wireless network coverage in the operations area. Two to five OTDs are deployed (asshown in Figure 5). Mobile nodes (smart phones) carried by the rescuers are connected (to the CCnode) through the tactical network. Shimmer sensors are connected to ORACE-Net mobile devices viaBluetooth. Since the experimentation area is limited, we reduced the Raspberry Pi’s and smart phone’sWiFi antenna transmission power to 0 dBm. Experimentation parameters and configuration settingsare detailed in Table 2.
177
Books
MDPI

J. Sens. Actuator Netw. 2017, 6, 19
Table 2. Experimentation parameters and configuration settings.
General Settings
Parameter Setting
ORACE-Net Tactical Devices4 (Raspberry Pi 2)OS: Raspbian v8.0
Mobile nodes2 (Samsung Galaxy S3-I9300, rooted)OS: Android 4.2.2 CyanogenMod 10.0
Wireless mode Ad hoc
ESSID CROW2
Wireless standard IEEE 802.11n/2.412 GHz (Channel 1)
Transmission power 0 dBm
Experiment area 30 m × 150 m
CC-node connectionEthernet to InternetAd hoc WiFi to ORACE-Net network
Experimentation duration 30 min/iteration
Power batteries- Smart phone: 2100 mAh Li-Ion (3.7 v)- Raspberry-Pi: 10,000-mAh Li-ion (12 v)- CC-node: 12 V power supply
ORACE-Net Protocol Settings
Application layerMQTT client used for pushingdata to the Labeeb-IoT platform
MQTT msgsize/intervals 30 Kb/1 s
Hello/ADV packet size 20/25 bytes
Hello/ADV intervals 3 s
Multicast address/port 224.0.0.0/10000
Shimmer Sensing Settings [30]
Wireless standard Bluetooth IEEE 802.15.1
Sensed dataPressure, Temperature, Gyroscope(x, y, zaxis-angle), acceleration (x, y, z),magnetometer (x, y, z), battery level
Device/Body 1 (with multiple sensors)
Buffer [31] 1024 bytes
Message interval 1 s
5.2. Results and Discussion
In this subsection, we present the results of the experiment aimed to evaluate the CROW2 systemperformance based on the ORACE-Net routing protocol on a real test-bed. To do so, we consider thefollowing metrics: throughput and jitter, End-to-End delay (E2Edelay) and End-to-End Link QualityEstimation (E2ELQE). Throughput is the maximum amount of data processed for sending from thesource node (i.e., ORACE-Net mobile device) to the destination node (i.e., Labeeb-IoT platform). “Jitter”is the amount of variation in latency/response time (typically in milliseconds). Reliable connectionsconsistently report back the same latency over and over again. Much variation (or ‘jitter’) is anindication of connection issues. Jitter is a relevant indicator of the network performance becauseit defines what kind of applications the network is able to support. The E2ELQE is calculated bythe ORACE-Net protocol to estimate end-to-end links. The E2Edelay is the round trip time delayrecorded from the source node to the destination node. This latter metric informs also about nodes’
178
Books
MDPI

J. Sens. Actuator Netw. 2017, 6, 19
disconnections. In addition to the above performance metrics, we discuss the collected data from theIoT platform to detect motions and prevent unavailability. Finally, we discuss the overall approximateinterference and noise affecting the indoor signal using an academic version of the AirMagnet software.
5.2.1. Throughput and Jitter
The average throughput and jitter recorded on the mobile device over the time during theexperiment plotted by UDP/TCP packets is depicted in Figure 7. These results are collected using localLinux logging tools, runnable also on Android (i.e., iptraf and trafshow). It can be seen that the UDPthroughput is higher than the TCP throughput. Indeed, the TCP protocol uses connected mode, andit is highly optimized to make reliable use of the link. Therefore, this decreases the throughput andincreases the jitter compared to UDP because of the handshake mechanism for the pre-/post-connectionprocess. However, UDP is used for real-time data (e.g., voice and video over IP) and recommended forhigh-latency links.
Figure 7. Average TCP and UDP throughput (Mbit/s) and jitter (ms) per hop count.
Now, with regards to the hop counts, UDP and TCP throughput averages within one hop are38.8 and 32.71 Mb/s, respectively. Throughput decreases when the hop count increases to reach 18.47and 9.87 Mb/s for UDP and TCP, respectively, within three hops. According to the authors of [33],a minimum data rate of 10 Mb/s is required for audio, medical imaging and video and hundreds ofkbps for other WBAN applications. It is perceived that CROW2 achieved a real throughput higherthan the data rate requirements. It is also important to note that the throughput is expected to decreasesignificantly starting from four hops based on the behavior shown in Figure 7. The average throughputreduction is accompanied by jitter increase. Recorded jitter values increase also following the samepattern as the throughput. It is important to note here that the maximum accepted jitter for the videostreaming application must be less than 40 ms according to [34] and under 30 ms according to Ciscofor interactive video (video-conferencing) [35]. Indeed, jitter reaches 9.227 ms with TCP mode withinthree hops, which stays under the limits of the use of video-streaming. According to the results ofthroughput and jitter, we conclude that the recommended hop count that guarantees throughputfor audio/video streaming and files (i.e., photos, reports, etc.) might be less than or equal to threehops, according to the standard definition video (3 Mb/s). The CROW2 system assures an acceptablethroughput and jitter for routes less than or equal to three hops with regards to the required thresholdscited above.
5.2.2. End-To-End Delay and Link Quality Estimation
Figure 8 depicts the average round trip time delay (E2Edelay) recorded from the OMD to theLabeeb-IoT platform versus E2ELQE. It can be seen that the E2ELQE decreases with the rise of E2Edelay.
179
Books
MDPI

J. Sens. Actuator Netw. 2017, 6, 19
Indeed, E2Edelay exceeds 1 s when E2ELQE reaches less than 0.7 between 1030 and 1070 s. The samebehavior appears between 1155 and 1175 s. E2ELQE and E2Edelay are proportional. An E2ELQE equal tozero means that the link is disconnected; the same link shows an infinite E2Edelay. Figure 8 shows alsothe effectiveness of the metric used in the ORACE-Net routing protocol (i.e., E2ELQE). The route updatemechanism based on the optimal E2ELQE then is validated by our experiment. Indeed, ORACE-Netprevents the link quality degradation, then looks for a better route with optimized link quality, delayand disconnection avoidance.
Figure 8. ORACE-Net on-body mobile device behavior: round trip time delay and linkquality estimation.
5.2.3. Motion Detection and Link Unavailability Prevention
On-body sensors carried by the rescuers push data regularly to the IoT platform. Based on thetype of recorded data, we can extract several human behaviors. For instance, gyroscope data recordedand depicted by the Labeeb-IoT platform in Figure 9 inform about human mobility. Sensors placedon the hand detect and send gyroscope variations tending to zero when the human has stopped andis not moving. Small variations may be distinguished in the first part of the figure when the humanis walking and higher variations of the gyroscope when he/she is running. Figure 10 depicts thegyroscope angle variations over more than 2000 s. The gyroscope angle informs about the movementdirection. Furthermore, some vital sign information may help the command center to switch rescueteams and send support there; we cite for example magnetometer and heart beat variations reflectingthe stress level. All collected data on the IoT platform side could provide also the connectivity statusfor every deployed node, as can be seen in Figure 10. Disconnected nodes inform about the unavailableintermediate links or network over-saturation.
180
Books
MDPI

J. Sens. Actuator Netw. 2017, 6, 19
Figure 9. Gyroscope records over 5 min during the experiment. The X-axis is real time.
Figure 10. Gyroscope angle variation over 2200 s of the experiment.
5.2.4. Interference Score and Noise
As given by Table 2, the CROW2 ad hoc network is configured on WiFi Channel 1. Figure 11ashows a sample of the interference score recorded indoors along 25 s. Interference varies from 0–53 dBm(as the maximum peak recorded). We assumed during our previous work [3] that the overall networkachievements were affected by the indoor interference caused by WiFi access points, microwaves, etc.Thus, we have recorded the interference score and noise to verify whether these facts affect the overallbehavior of the emergency network or not. The recorded interference is important compared to theReceived Signal Strength Indicator (RSSI), so the signal is notably affected by the interference. However,the overall interference score is likely to decrease because the wireless infrastructure devices and accesspoints are mostly out-of-order post-disaster. Figure 11b shows a sample of real-time variation forsignal and noise strength as a percentage for Channel 1 during 50 s. The noise floor is given by thered curved waves, and the Signal-to-Noise Ratio (SNR) is depicted in yellow color. The figure showsthat the signal strength varies between 3 and 50%. To conclude, interference clearly affects the RSSIand, then, the overall performance of the system. Interference is an important factor that must beconsidered in indoor emergency operations.
181
Books
MDPI

J. Sens. Actuator Netw. 2017, 6, 19
Figure 11. (a) Interference score (in dBm) recorded over 25 s on the channel at 2.412 GHz (AirMagnetWiFi Analyzer Limited Edition). (b) Screen-shot of signal and noise (as a percentage) recorded over50 s (AirMagnet WiFi Analyzer Limited Edition).
6. Conclusions
In this article, we presented the CROW2 system, an IoT end-to-end emergency and disaster reliefsystem. CROW2 is implemented based on the ORACE-Net routing protocol, especially designed forthe disaster context. To evaluate the performance of the proposed system, we deployed the routingprotocol and the payload applications on two different platforms (Raspberry Pi and Android smartphone). We equipped a rescuer with on-body sensors connected to a smart phone via Bluetooth. Theentire system uses an IoT platform as a back-end to push, record, publish and analyze sensed data.The performance of the system is investigated according to the following relevant metrics: averagethroughput and jitter, average end-to-end delay and average link quality estimation. We emphasizedalso motion detection and links’ unavailability prevention based on the collected data. Finally, wesampled the indoor interference score and noise to estimate its impact on the system behavior. It canbe concluded that the CROW2 system outperformed the given requirements for wireless body-to-bodycommunications in terms of throughput and jitter. However, being effected by the indoor environment,the behaviors of E2ELQE and E2Edelay are moderately fair. This article validates a few research works,especially simulation-based ones, with a real implementation and experiment. Further, it highlightsalso the limitation of other theoretical proposals, specifically those adopting low power consumptionwireless standards for body-to-body communications. This work could be considered as a referenceto researchers for real wireless body-to-body implementation using a dedicated routing protocolfor the disaster relief context. It is also a reference for routing and technology standards’ adoptionfor similar use cases. As future works, an outdoor experiment could be conducted to provide acomplete overview of the system behavior in different situations. Furthermore, a study supported byimplementation could be provided to advise on the optimal number of tactical devices for both indoorand outdoor scenarios. An autonomous disaster mode in wireless devices may be proposed based onthe ORACE-Net routing approach.
Acknowledgments: This publication was made possible thanks to NPRPGrant #[6-1508-2-616] from the QatarNational Research Fund (a member of the Qatar Foundation). Funding of this paper was through the first author.
Author Contributions: This paper was prepared through the collective efforts of all authors. In particular,Dhafer Ben Arbia prepared the manuscript based on the suggestions and guidance of Muhammad Mahtab Alam,Abdullah Kadri and Elyes Ben Hamida. Dhafer Ben Arbia made substantial contributions towards the overallwriting, organization and presentation of the paper. He also conducted the experiment, based on which theresults were discussed. In particular, he contributed to the Introduction, Related Works and the CROW2 systemimplementation. He detailed also the experiment scenario and discussed the achieved results. MuhammadMahtab Alam introduced the scope of the paper within the Abstract, then helped to present the CROW2 systemand the WBAN technologies. Elyes Ben Hamida advised on the conducted experiment and coded the C sourceson the tactical devices. Muhammad Mahtab Alam, Abdullah Kadri and Rabah Attia did a critical revision of thepaper and provided detailed feedback to improve the manuscript content.
Conflicts of Interest: The authors declare no conflict of interest.
182
Books
MDPI

J. Sens. Actuator Netw. 2017, 6, 19
Abbreviations
The following abbreviations are used in this manuscript:
WBAN Wireless Body Area NetworksCROW2 Critical and Rescue Operations for Wearable-WSNsE2ELQE End-to-End Link Quality EstimationE2Edelay End-to-End DelayRTT Round Trip TimeORACE-Net Optimized Routing Approach for Critical and Emergency NetworksLabeeb-IoT an IoT Platform (www.labeeb-iot.com)
References
1. UNISDR. Unisdr—Annual Report; Technical Report; United Nations Office of Disaster Risk Reduction:Geneva, Switzerland, 2015.
2. Ben Arbia, D.; Alam, M.M.; Attia, R.; Ben Hamida, E. ORACE-Net: A novel multi-hop body-to-body routingprotocol for public safety networks. Peer-to-Peer Netw. Appl. 2016, 10, 726–749.
3. Ben Arbia, D.; Alam, M.M.; Kadri, A.; Attia, R.; Ben Hamida, E. Implementation and Benchmarkingof a Novel Routing Protocol for Tactical Mobile Ad-Hoc Networks. In Proceedings of the 12th IEEEWiMob Conference on Wireless and Mobile Computing, Networking and Communications (WiMob),New York, NY, USA, 17–19 October 2016.
4. D’Andreagiovanni, F.; Krolikowski, J.; Pulaj, J. A fast hybrid primal heuristic for multiband robust capacitatednetwork design with multiple time periods. Appl. Soft Comput. 2015, 26, 497–507.
5. Büsing, C.; D’Andreagiovanni, F. New results about multi-band uncertainty in robust optimization.In Proceedings of the International Symposium on Experimental Algorithms, Bordeaux, France,7–9 June 2012; Springer: Berlin, Germany, 2012; pp. 63–74.
6. Bertsekas, D.P. Network Optimization: Continuous and Discrete Models; Athena Scientific Belmont:Belmont, MA, USA, 1998.
7. Marotta, A.; D’Andreagiovanni, F.; Kassler, A.; Zola, E. On the energy cost of robustness for green virtualnetwork function placement in 5G virtualized infrastructures. Comput. Netw. 2017, in press.
8. Bauschert, T.; Busing, C.; D’Andreagiovanni, F.; Koster, A.C.; Kutschka, M.; Steglich, U. Network planningunder demand uncertainty with robust optimization. IEEE Commun. Mag. 2014, 52, 178–185.
9. Union, I.T. Overview of Disaster Relief Systems, Network Resilience and Recovery; Technical Report;International Telecommunication Union: Geneva, Switzerland, 2014.
10. Chen, M.; Gonzalez, S.; Vasilakos, A.; Cao, H.; Leung, V.C.M. Body Area Networks: A Survey.Mob. Netw. Appl. 2011, 16, 171–193.
11. Gao, T.; Massey, T.; Selavo, L.; Crawford, D.; Chen, B.R.; Lorincz, K.; Shnayder, V.; Hauenstein, L.; Dabiri, F.;Jeng, J.; et al. The advanced health and disaster aid network: A light-weight wireless medical system fortriage. IEEE Trans. Biomed. Circuits Syst. 2007, 1, 203–216.
12. Negra, R.; Jemili, I.; Belghith, A. Wireless Body Area Networks: Applications and Technologies.Procedia Comput. Sci. 2016, 83, 1274–1281, doi:10.1016/j.procs.2016.04.266.
13. Gomez, K.; Goratti, L.; Rasheed, T.; Reynaud, L. Enabling disaster-resilient 4G mobile communicationnetworks. IEEE Commun. Mag. 2014, 52, 66–73.
14. Varun, G.; Menon, J.P.P.; Priya, J. Ensuring Reliable Communication in Disaster Recovery Operations withReliable Routing Technique. Mob. Inf. Syst. 2016, 2016, doi:10.1155/2016/9141329.
15. Lu, Z.; Cao, G.; Porta, T.L. Networking Smartphones for Disaster Recovery. IEEE Trans. Mob. Comput.2016, PP, doi:10.1109/TMC.2017.2695452.
16. George, S.M.; Zhou, W.; Chenji, H.; Won, M.; Lee, Y.O.; Pazarloglou, A.; Stoleru, R.; Barooah, P.DistressNet: A wireless ad hoc and sensor network architecture for situation management in disasterresponse. IEEE Commun. Mag. 2010, 48, 128–136.
183
Books
MDPI

J. Sens. Actuator Netw. 2017, 6, 19
17. Felice, M.D.; Bedogni, L.; Bononi, L. The Emergency Direct Mobile App: Safety Message Dissemination overa Multi-Group Network of Smartphones Using Wi-Fi Direct. In Proceedings of the MobiWac ’16, 14th ACMInternational Symposium on Mobility Management and Wireless Access, Malta, 13–17 November 2016;ACM: New York, NY, USA, 2016; pp. 99–106.
18. Chen, X.; Xu, Y.; Liu, A. Cross Layer Design for Optimizing Transmission Reliability, Energy Efficiency, andLifetime in Body Sensor Networks. Sensors 2017, 17, 900.
19. Tsouri, G.R.; Prieto, A.; Argade, N. On increasing network lifetime in body area networks using globalrouting with energy consumption balancing. Sensors 2012, 12, 13088–13108.
20. D’Andreagiovanni, F.; Nardin, A. Towards the fast and robust optimal design of Wireless Body AreaNetworks. Appl. Soft Comput. 2015, 37, 971–982.
21. D’Andreagiovanni, F.; Nardin, A.; Natalizio, E. A Fast ILP-Based Heuristic for the Robust Design of BodyWireless Sensor Networks. In European Conference on the Applications of Evolutionary Computation, Proceedingsof the EvoApplications 2017, 20th European Conference Applications of Evolutionary Computation, Amsterdam,The Netherlands, 19–21 April 2017; Squillero, G., Sim, K., Eds.; Lecture Notes in Computer Science; Part I;Springer: Berlin, Germany, 2017; Volume 10199, pp. 234–250.
22. Miranda, J.; Cabral, J.; Wagner, S.R.; Fischer Pedersen, C.; Ravelo, B.; Memon, M.; Mathiesen, M. An OpenPlatform for Seamless Sensor Support in Healthcare for the Internet of Things. Sensors 2016, 16, 2089.
23. Ben Hamida, E.; Alam, M.; Maman, M.; Denis, B.; D’Errico, R. Wearable Body-to-Body networks for criticaland rescue operations—The CROW2 project. In Proceedings of the 2014 IEEE 25th Annual InternationalSymposium on Personal, Indoor, and Mobile Radio Communication (PIMRC), Washington, DC, USA,2–5 September 2014; pp. 2145–2149.
24. Alam, M.M.; Ben Hamida, E. Performance Evaluation of IEEE 802.15.6-based WBANs under Co-ChannelInterference. Int. J. Sens. Netw. 2016, doi: 10.1504/IJSNET.2016.10001274.
25. Alam, M.M.; Ben Hamida, E.; Ben Arbia, D. Joint Throughput and Channel Aware (TCA) DynamicScheduling Algorithm for Emerging Wearable Applications. In Proceedings of the 2016 IEEE WirelessCommunications and Networking Conference (WCNC), Doha, Qatar, 3–6 April 2016.
26. Maman, M.; Mani, F.; Denis, B.; D’Errico, R. Evaluation of Multiple Coexisting Body Area NetworksBased on Realistic On-Body and Body-to-Body Channel Models. In Proceedings of the 10th InternationalSymposium on Medical Information and Communication Technology (ISMICT’16), Worcester, MA, USA,20–23 March 2016.
27. WSNET 3.0 Simulator. Available online: http://wsnet.gforge.inria.fr/ (accessed on 30 November 2015).28. Martínez-Pérez, F.E.; González-Fraga, J.Á.; Cuevas-Tello, J.C.; Rodríguez, M.D. Activity inference for ambient
intelligence through handling artifacts in a healthcare environment. Sensors 2012, 12, 1072–1099.29. Information Technology Message Queuing Telemetry Transport (MQTT) v3.1.1; ISO/IEC 20922; ISO/IEC: Geneva,
Switzerland, 2016.30. Shimmer Sensing. Available online: http://www.shimmersensing.com/products/ecg-development-kit
(accessed on 15 January 2017).31. Burns, A.; Greene, B.R.; McGrath, M.J.; O’Shea, T.J.; Kuris, B.; Ayer, S.M.; Stroiescu, F.; Cionca, V. SHIMMER:
A Wireless Sensor Platform for Noninvasive Biomedical Research. IEEE Sens. J. 2010, 10, 1527–1534.32. Qatar Mobility Innovations Center. Labeeb IoT Platform and Solutions; QMIC: Doha, Qatar, 2016.33. Chakraborty, C.; Gupta, B.; Ghosh, S.K. A review on telemedicine-based WBAN framework for patient
monitoring. Telemed. e-Health 2013, 19, 619–626.34. Al-Madani, B.; Al-Roubaiey, A.; Baig, Z.A. Real-Time QoS-Aware Video Streaming: A Comparative and
Experimental Study. Adv. Multimed. 2014, 2014, doi:10.1155/2014/164940.35. Quality of Service Design Overview. Available online: http://www.ciscopress.com/articles/article.asp?p=
357102&seqNum=2 (accessed on 20 February 2017).
c© 2017 by the authors. Licensee MDPI, Basel, Switzerland. This article is an open accessarticle distributed under the terms and conditions of the Creative Commons Attribution(CC BY) license (http://creativecommons.org/licenses/by/4.0/).
184
Books
MDPI

MDPI AG
St. Alban‐Anlage 66
4052 Basel, Switzerland
Tel. +41 61 683 77 34
Fax +41 61 302 89 18
http://www.mdpi.com
Journal of Sensor and Actuator Networks Editorial Office
E‐mail: [email protected]
http://www.mdpi.com/journal/jsan
Books
MDPI

Books
MDPI

MDPI St. Alban-Anlage 66 4052 Basel Switzerland
Tel: +41 61 683 77 34 Fax: +41 61 302 89 18
www.mdpi.com ISBN 978-3-03842-874-9
Books
MDPI