seo/ux/dev overlap in 2020
TRANSCRIPT


SEO/UX/Dev overlap in 2020 Pre-May 2020

This is a Mobile Ranking Signal.
It is used on queries for Mobile devices.
Desktop CWV were announced at Google i/o 2021 but specifics are not yet available.
SEO/UX/Dev overlap as a Ranking Signal

Why Core Web Vitals?Real humans want a good web experiences
Sour
ce: T
he S
cien
ce B
ehin
d W
eb V
itals
, Chr
omiu
m B
log
May
202
0

less likely to abandon page loads24% This impacts ALL USERS

WarningCareer AdviceCollaboration required
Search Engines
Dev
UX
Product
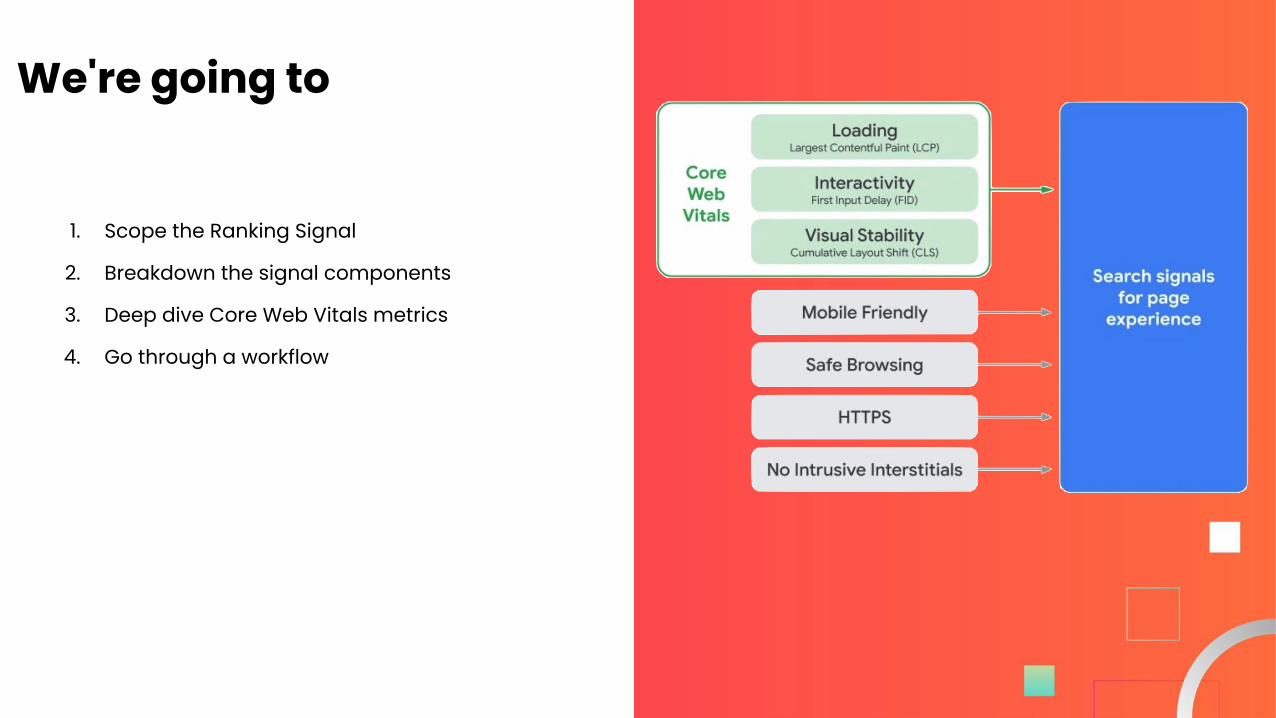
1. Scope the Ranking Signal
2. Breakdown the signal components
3. Deep dive Core Web Vitals metrics
4. Go through a workflow
We're going to

What is thePage Experience Update?

● Affects ranking evaluation at the page level
● Affects SERPs for mobile devices
● Means AMP is not longer required for Top Stories carousels.
● Does require a passing CWV assessment to appear in Top Stories.
● Will continue to evolve.
The Page Experience Ranking Signal:

"Good" pages must:
● Have Good status in the Mobile Core Web Vitals report.
● Have no mobile usability issues according to the Mobile Usability report.
● Be hosted on a domain site has no security issues.
● Be served over HTTPS.

Why group these components into a ranking signal?
● They’re all handled by Chromium.
● Web vitals were announced by Chromium and swiftly adopted
across Google
● Google uses complex interconnected systems to build search,
● Chromium *is* Google’s Web Rendering Service
Source: The Science Behind Web Vitals, C
hromium
Blog May 2020

Breakdown: Page Experience Signal Components

Mobile-Friendly SEO friend since 2016
▪ Check your pages with the Mobile-Friendly Test
▪ Monitor your site with GSC’s Mobile Usability Report.
▪ Reference the guides available for specific platforms like Wordpress, Drupal, and Joomla.
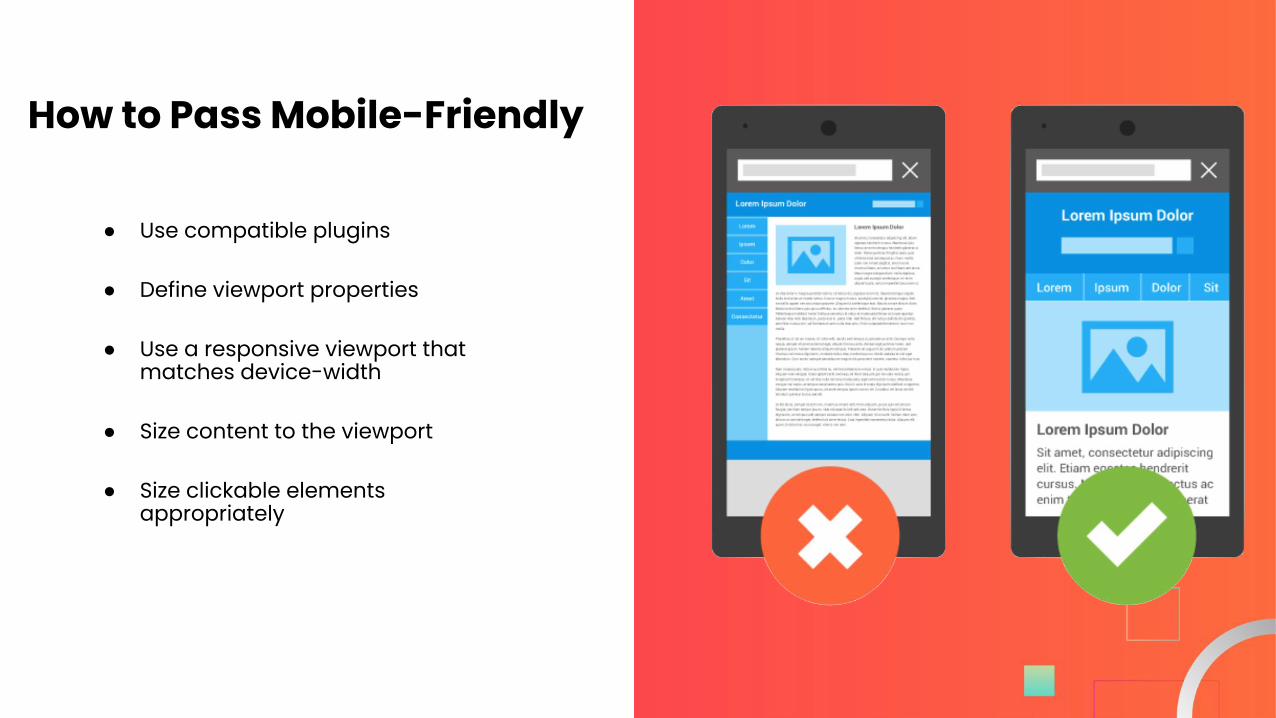
How to Pass Mobile-Friendly
● Use compatible plugins
● Define viewport properties
● Use a responsive viewport that matches device-width
● Size content to the viewport
● Size clickable elements appropriately

Mockups of penalized interstitials
Intrusive Interstitials Penalizing the annoying since January 2017
Impacts ranking not indexing
Defined by:
● Covering most or all of the content on a page
● Difficult if not impossible to close (timers, unresponsive or hidden close buttons)
● Popping up without prompting

Responsible Interstitials Required interactions
● Accept cookies
● Age verification
● Dismissable banners (like app installs)
● Login prompts for unindexable content
● Page-to-page interstitials
Source: Helping users easily access content on mobile, Webmaster Blog August 2016
Mockups of interstitials that would not be penalized

Penalized Interstitials● Geo-location/language
● Responsive scroll boxes
● “Welcome mats”
Grey Hat Interstitials● Triggered by an exit intent
● Sticky sidebars
● Related posts
● Share buttons
● Live chat boxes
● Coupon pop-ups

How to Pass Intrusive Interstitials
● Use banners as an alternative
● Create the interstitial in a way that search engines can still see the normal content (without changing URLs)
● Render the page content without waiting for user interaction (tapping a close or agree button)

Safe-Browsing Guarding users since 2016
Alerts available from Search Console:
● Malware
● Deceptive pages
● Harmful downloads
● Uncommon downloads
● Deceptive Sites
● Unwanted Software

▪ Understand security vulnerabilities
▪ Keep backups of your site
▪ Have a rollback plan
▪ Use strong passwords unique for every login
▪ Be judicious with administrator privileges
▪ Keep your servers up to date
▪ Learn how console messages can lead to Data Leaks
▪ Vet each and every plugin before installing
▪ Remove any unused plugin
How to Pass Safe Browsing

HTTPS-SecurityThe fact we went without this until 2016 is terrifying
No excuses. We all need:
▪ Encryption: encrypting the exchanged data to keep it secure from eavesdroppers. That means that while the user is browsing a website, nobody can "listen" to their conversations, track their activities across multiple pages, or steal their information.
▪ Data integrity: data cannot be modified or corrupted during transfer, intentionally or otherwise, without being detected.
▪ Authentication: proves that your users communicate with the intended website. It protects against man-in-the-middle attacks and builds user trust, which translates into other business benefits.

How to Pass HTTPS-Security
▪ Use robust security certificates
▪ Use server-side 301 redirects
▪ Don’t block HTTPS pages by robots.txt or noindex tags
▪ Use only HTTPS content on HTTPS pages
▪ Use the URL Inspection tool to test whether Googlebot can access your pages
▪ Support HSTS (force those internal http links to secure!)
▪ Make sure the content on your HTTP site and your HTTPS is the same

Deep Dive: Core Web Vitals

● Already 70% of your Lighthouse v8 performance score
● Components and their respective weights will evolve (read as: change at any time for any reason)
Pie chart of Lighthouse Performance Score factors
Core Web Vitals Unified measurement
Source: Lighthouse Performance Scoring

Loading Interactivity Visual Stability
👆
⏳
Images via: The SEO's Guide to Google's Core Web Vitals

Loading Interactivity Visual Stability
Is it loading?
Can I interact?
Is it visually stable?

Largest Contentful Paint (LCP)What it represents A user’s perception of loading experience.
What it measures The point in the page load timeline when the page’s largest image or text block is visible within the viewport.
How it’s measured Lighthouse extracts LCP data from Chrome’s
tracing tool.
Which elements <img>, <imagine> inside <svg>, <video>,
backgrounds loaded via url(), Block level
elements
Source: Largest Contentful Paint (LCP)

LCP typically varies by page template
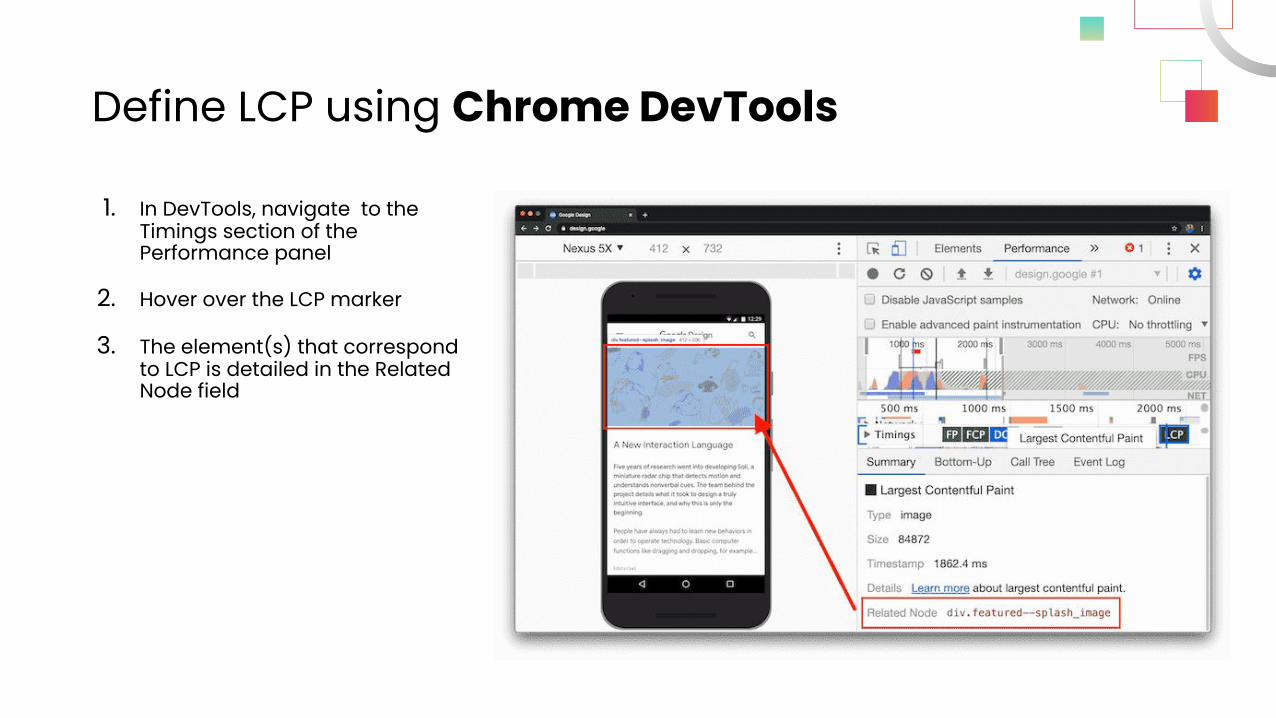
Define LCP using Chrome DevTools
1. In DevTools, navigate to the Timings section of the Performance panel
2. Hover over the LCP marker
3. The element(s) that correspond to LCP is detailed in the Related Node field

LCP Goal: 75% of page loads achieve LCP in < 2.5 s
LCP time(in milliseconds) Color-coding
0–2,500 Green (fast)
2,500-4,000 Orange (moderate)
Over 4,000 Red (slow)

In other words, if at least 75 percent of page views to a site meet the "good" threshold, the site is classified as having "good" performance for that metric. Conversely, if at least 25 percent of page views meet the "poor" threshold, the site is classified as having "poor" performance.
– Bryan McQuade, web.dev
Source: Defining the Core Web Vitals metrics thresholds

1. Slow server response times
2. Render-blocking JavaScript and CSS
3. Resource load times
4. Client-side rendering
4 root causes of LCP Issues

How to fix Poor LCP
• Optimize your server
• Route users to a nearby CDN
• Cache assets
• Serve HTML pages cache-first
• Establish third-party connections early
Slow Server Response

How to fix Poor LCP
▪ Minify CSS
▪ Defer non-critical CSS
▪ Inline critical CSS
▪ Minify and compress JavaScript files
▪ Defer unused JavaScript
▪ Minimize unused polyfills
Render blocking Javascript and CSS

How to fix Poor LCP
▪ Optimize and compress images
▪ Preload important resources
▪ Compress text files
▪ Deliver different assets based on network connection (adaptive serving)
▪ Cache assets using a service worker
Slow resource load time
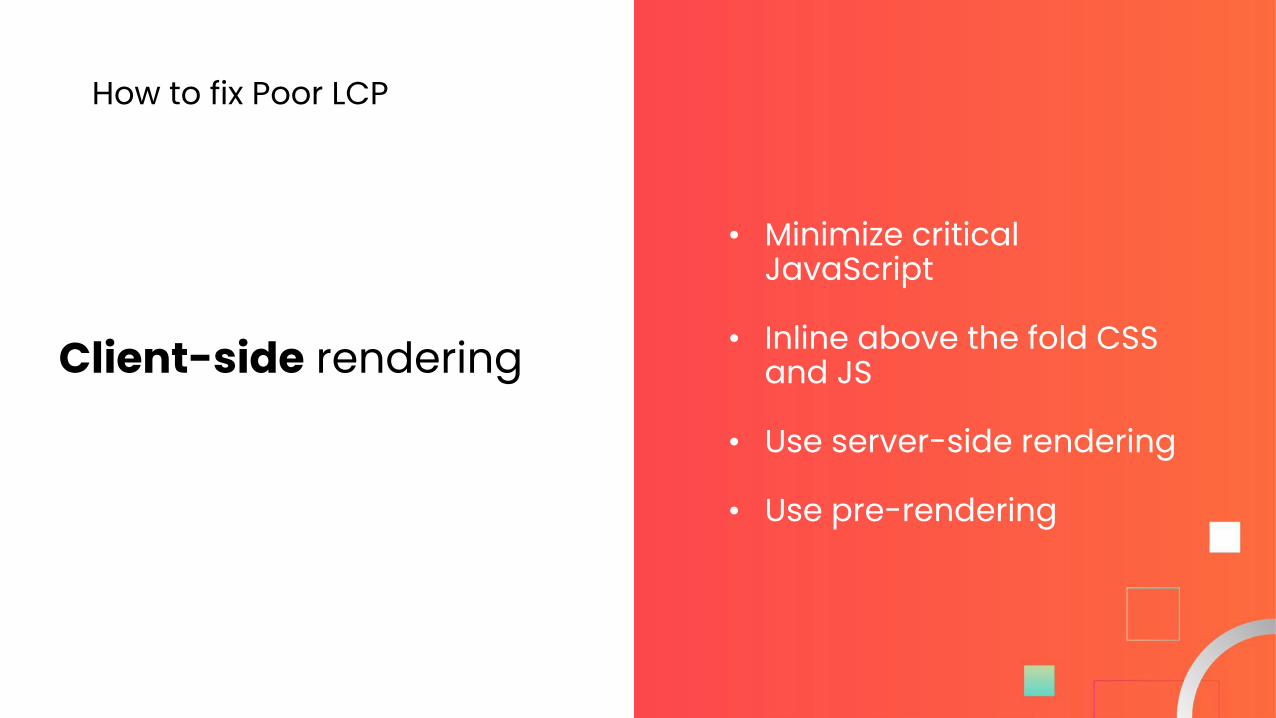
How to fix Poor LCP
• Minimize critical JavaScript
• Inline above the fold CSS and JS
• Use server-side rendering
• Use pre-rendering
Client-side rendering

First Input Delay (FID)
What it represents Responsiveness to user input
What it measures The point in the page load timeline when the page’s largest image or text block is visible within the viewport.
How it’s measured Sometimes. FID is only available as field
data.
Which elements JavaScript. FID is always caused by
JavaScript.👆

FID Timing

Use Total Blocking Time (TBT) for lab tests
▪ TBT Measures: Responsiveness to user input
▪ TBT Measurement: Total time in which the main thread is occupied by tasks taking more than 50ms to complete.

FID Goal: < 100 msTBT Goal: < 300 ms
FID (ms) TBT (ms) Color-coding0-100 0–300 Green (fast)
101-299 301-599Orange
(moderate)>= 300 Over 600 Red (slow)
▪ TBT Measures: Responsiveness to user input
▪ TBT Measurement: Total time in which the main thread is occupied by tasks taking more than 50ms to complete.

<script>
const heavy = true;
While (heavy) {
console.log("FID fail")
}
</script>
Root causes of FID Issues

An example of Custom Extractions to find where FID-problematic JS ia called
Use Technical Crawlers to solve for legacy code hide & seek

Cumulative Layout Shift (CLS)
What it represents Human frustration
What it measures Visual instability of page elements above the fold.
How it’s measured A calculation based on the number of
frames in which element(s) visually moves
and the total distance in pixels the
element(s) moved.
Which elements Any that appear above the fold during
loading
Gif generated via @defaced layout shift generator

CLS Layout Score = impact fraction * distance fraction
*

CLS Goal: 75% of page loads achieve CLS < 0.10
CLS calculated score Color-coding
0–0.10 Green (fast)
0.11-0.24 Orange (moderate)
>= 0.25 Red (slow)
▪ CLS measurements are calculated for changes within the first 5 seconds

Root causes of CLS Issues
▪ Images without dimensions
▪ Ads, embeds, and iframes without dimensions
▪ Dynamically injected content
▪ Web Fonts causing FOIT/FOUT
▪ Actions waiting for a network response before updating DOM

▪ Always include width and height size attributes on images and video elements.
▪ Reserve space for ad slots (and don't collapse it)
▪ Avoid inserting new content above existing content
▪ Take care when placing non-sticky ads near the top of the viewport
▪ Reduce the number of fonts
▪ Preload fonts
How to fix Poor CLS
Reserve Space

Let's learn hands on by going through an actionable workflow

1. Find out how real users experience the site
MVP: CrUX Dashboard
How is our site doing for real users"?
1. Go to go.co/chromeuxdashboard
2. Create a datasource by entering in your origin
3. Click 'generate report'!
Caveat: This is for all pageviews including disallowed, noindexed, and authenticated
Crux data in Google Search Console's Core Web Vitals Report

Score x Ranking Factor data in Search Console

2. Get URL-Specific Field Data We can Google Search Console do the leg work
● Focus on Mobile data, as Google is moving to a Mobile-First Index and CWV is set to affect mobile SERPs.
● Desktop CWVs were announced at i/o 2021, but these are coming at a later date and will likely be more forgiving.
Crux data in Google Search Console's Core Web Vitals Report

Crux Data is Field Data
Strengths
• Is part Page Performance ranking signal• Captures true real-world user experience
• Enables correlation to business key performance indicators
Weaknesses
• Restricted set of metrics• Limited debugging capabilities

Field Data is good for:
• Debugging performance issues
• End-to-end and deep visibility into the UX
• Reproducible testing and debugging environment
To identify what's causing the issue, we need Lab Data
Lab Data is good for:
• Helpful for debugging performance issues
• End-to-end and deep visibility into the UX
• Reproducible testing and debugging environment

3. Use PageSpeed Insights to marry field data with lab diagnostics
Dev
Field and Lab performance data via Pagespeed Insights API
Ask for information on specific URLs using Pagespeed Insights
PSI is the only data source where URL-level performance data is available.
Unfortunately, the GUI only lets us do one page at a time.

Field data not available in PageSpeed Insights
Why Doesn’t My Page Have Field Data?

PageSpeed Insights API key
To generate a PSI API key:
1. Go to the PSI API starter guide2. Click 'Get Key'3. Select an existing project or create
a new one for your PSI tests4. Copy the key and save it in a safe
place
We can move faster by using the API

● From the command line using CURLFor a single URL run:
● Via Google Sheets (Thanks, Rick Viscomi!)
● With a local python or JS application
● Via your favorite technical SEO crawler!
PSI script in DeepCrawl's Custom JavaScript feature
Ways to use run PSI API
curl https://www.googleapis.com/pagespeedonline/v5/runPagespeed?url={{URL}}&key={{YOUR_KEY}}&category={{performance}}

This is how we prove the ROI for development resources!
You cannot retroactively pull Crux CWV data.
New data sets are available the 2nd Tuesday of every Month
Tracking CWV score changes using segments and timelines
3. Setup ongoing performance tracking
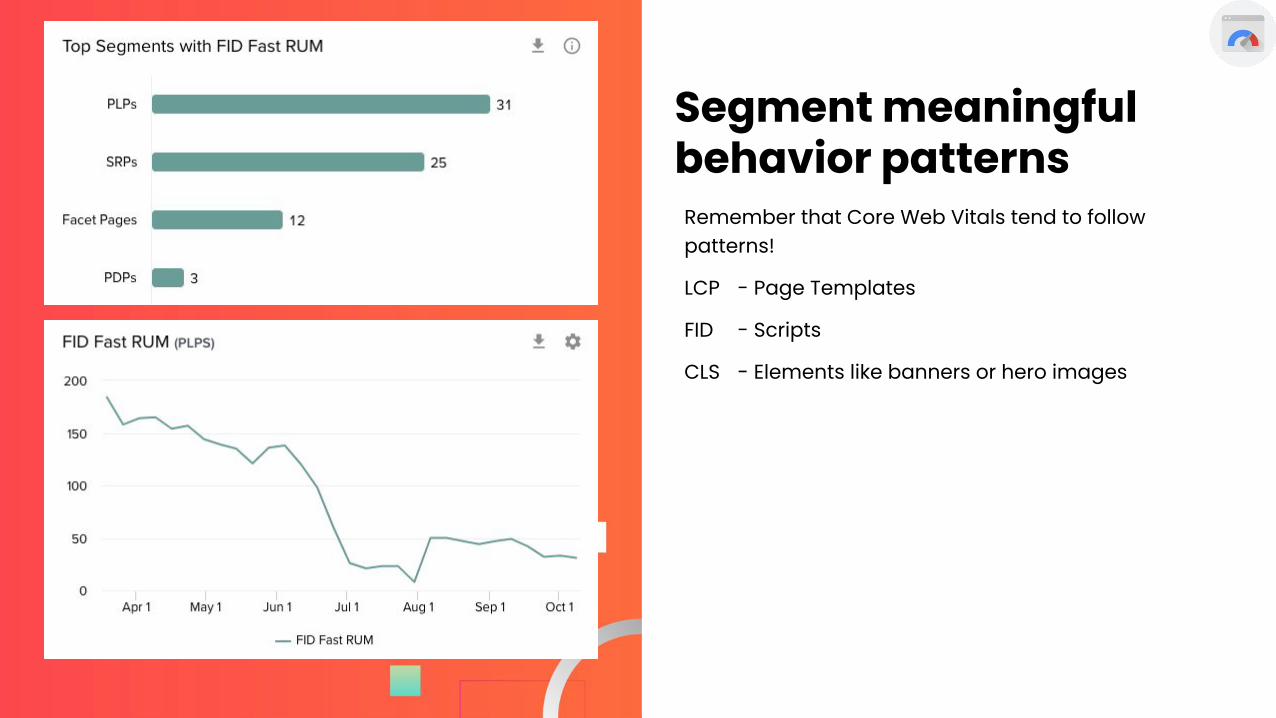
Remember that Core Web Vitals tend to follow patterns!
LCP - Page Templates
FID - Scripts
CLS - Elements like banners or hero images
Segment meaningful behavior patterns

4. Create a ticket. Do the development work
User StoryAs a < type of user/site/etc >, I want < action > so that < goal >.
Acceptance CriteriaDefine when the goal has been achieved. What does “done” mean?
Testing URLs/StrategyRemember our grouping export? Use them.
Provide a set of steps for QA engineers to follow.
Think about which tool is used, what metric/marker to look for, and the behavior indicating a pass or fail.

5. QA Changes in Staging Environments Using Lighthouse

WarningCareer AdviceCollaboration required
Search Engines
Dev
UX
Product

| ̄ ̄ ̄ ̄ ̄ ̄ ̄ ̄ ̄ ̄ ̄| WE ARE IN THIS TOGETHER. |___________| (\__/) || (•ㅅ•) || / づ{\__/}( • . •)/ >🥁
{\__/}( • - •)/ >🥁
{\__/}(• - • )🥁 < \