september 2006 staff opinion survey report
TRANSCRIPT

R e p o r t o f
Staff Opinion Survey September 2006
Project Team
Associate Professor Tony Machin
Dr Jeff Patrick
Dr Majella Albion
Dr Hong Eng Goh Mrs Sue Terry
Mrs Tricialla Roache
Psychology Technical Services Mr Ross Bool
Mrs Susan Gibson
Mr Kenneth Askin
Mrs Kym Day
Community and Organisational Research Unit
U n i v e r s i t y o f S o u t h e r n Q u e e n s l a n d

Staff Opinion Survey September 2006 1
Community and Organisational Research Unit U n i v e r s i t y o f S o u t h e r n Q u e e n s l a n d
TABLE OF CONTENTS
EXECUTIVE SUMMARY................................................................................................................. 2
KEY FINDINGS................................................................................................................................ 2 Positive Indicators:.................................................................................................................. 2 Key Challenges....................................................................................................................... 3 Predictors of Quality of Work Life, Individual Morale and Distress......................................... 4
CONCLUSIONS............................................................................................................................... 6 RECOMMENDATIONS ...................................................................................................................... 6
INTRODUCTION ........................................................................................................................... 10
PURPOSE OF THE SURVEY ........................................................................................................... 10 SURVEY PROCESS....................................................................................................................... 11
SURVEY RESULTS ...................................................................................................................... 13
INTERPRETIVE GUIDELINES ..................................................................................................... 13
SECTION A: QPASS MEASURES: INDIVIDUAL OUTCOMES AND ORGANISATIONAL CLIMATE.............. 14 Measures of Individual Outcomes: ....................................................................................... 14 Measures of Organisational Climate..................................................................................... 15
SECTION B: MEASURES DESIGNED SPECIFICALLY FOR QUEENSLAND HEALTH, INCLUDING TRUST IN LEADERSHIP, ORGANISATIONAL MANAGEMENT PRACTICES AND ITEM-RESPONSE FREQUENCIES..... 17
Results from Measures based on Average Percentage Scores........................................... 17 Results from Items relating to the Code of Conduct............................................................. 24
SECTION C: FREQUENCY OF MAIN THEMES FROM COMMENTS ....................................................... 39 SECTION D: GENERAL INFORMATION ............................................................................................ 42
Demographic Details of Respondents .................................................................................. 42
APPENDIX A................................................................................................................................. 46
DESCRIPTION OF THE SURVEY QUESTIONNAIRE ............................................................................ 46 Individual Outcome ............................................................................................................... 46 Organisational Climate.......................................................................................................... 46 Trust in Leadership and Organisation Management Practices Measures............................ 47 Biographical Data.................................................................................................................. 49
APPENDIX B................................................................................................................................. 50
Reliabilities of Measures ....................................................................................................... 50

Staff Opinion Survey September 2006 2
Community and Organisational Research Unit U n i v e r s i t y o f S o u t h e r n Q u e e n s l a n d
Executive summary In August-September 2006, staff from eleven (11) Queensland Health Service Districts,
Corporate Services, Office of the Director-General, and Reform and Development
Division participated in the Better Workplaces Staff Opinion Survey.
The survey consisted of a number of questions requesting biographical data, measures
of Individual Outcomes and Organisational Climate from the Queensland Public Agency
Staff Survey (QPASS), Trust in Leadership of Management, and several additional
measures. Two sets of comparative data were used for QPASS measures: (1) previous
Queensland Health surveys, (Queensland Health Comparative) and (2) Public Sector
Organisations which includes Queensland Health (QH and PS Comparative). For all
other measures, the results from May 2006 survey were used, where available. All
comparative data for QPASS measures have been aggregated from surveys conducted
since 1999. While these data provided a useful indicator for the QPASS measures, it is
aggregated from data spread across eight years and therefore may not be based on a
representative sample of Queensland Health employees.
Respondents were also provided with the opportunity to write additional comments. Key
themes in these comments included issues relating to training and professional
development, staffing, communication, recruitment process, workspace and buildings,
workload, equipment, planning/policy making, fairness/equity, management competency,
and bullying/harassment. The frequencies of positive comments and suggestions of
each of the identified themes are tabulated and presented in Section C.
Key findings
Positive Indicators: • The overall response rate was 37%, varying between 27% and 81% for the
participating health service districts and corporate work areas. The overall rate is
both sufficient to draw reliable conclusions, and is an improvement from the 31%
obtained in May 2006.
• Queensland Health results for September 2006 for all three measures of Individual
Outcome (Quality of Work Life, Individual Morale, Individual Distress) and eight of
the Organisational Climate measures (Supervisor Support, Role Clarity, Peer

Staff Opinion Survey September 2006 3
Community and Organisational Research Unit U n i v e r s i t y o f S o u t h e r n Q u e e n s l a n d
Support, Appraisal and Recognition, Professional Growth, Goal Congruence,
Workplace Distress, Excessive Work Demands) are comparable to overall public
sector employees (Health and other public sectors).
• Individual Distress at 32.6% is lower than one would expect relative to other QPASS
measures, in particular Workplace Distress, which is a strong predictor of Individual
Distress
• The levels of Role Clarity and Peer Support at 63% are in the upper band.
• Although the level of Excessive Work Demands1 (58.5%) is high relative to other
QPASS measures, it is comparable to the level recorded by personnel of health and
other public sectors surveyed in the last eight years.
• Trust in Leadership of Immediate Supervisor at 61.1% is higher relative to Trust in
the Leadership of Senior Management and District Executive.
• Trust in Senior Management is higher within the occupational streams of
Professional (56.2%) and Medical Officers (56.1%).
• The level of confidence in the process to resolve harmful behaviours (Resolution of
Harmful Behaviours) at 66.3% is encouraging.
• Respondents’ ratings of Clinical Communication (61.7%) and Multidisciplinary
Team’s Support for Patient Care (64.6%) are in the upper band.
• 94.2% of the respondents who had performance reviews reported that they were
conducted fairly and without bias.
Key Challenges • Whilst the level of Workplace Distress2 (56.7%) is comparative to QH and QPS data,
it stands in contrast to the lower Individual Distress score (32.6%), indicating that
Individual Distress3 may increase in the coming year if the relatively higher
Workplace Distress does not decline.
• The level of Trust in Leadership of Senior Managers within Profession/ Occupation
(48.3%) is low. The occupational stream of Technical/Trades is lowest at 37.9%
followed by Nursing and Operational at 45.3% and 45.2% respectively.
1 Excessive Work Demands: Respondents are overloaded with constant pressure to keep working, leaving no time to relax 2 Workplace Distress: Respondents feel frustrated, stressed, tense, anxious and depressed about their work 3 Individual Distress: Feeling tense, afraid, unhappy, anxious, negative, uneasy and depressed at work.

Staff Opinion Survey September 2006 4
Community and Organisational Research Unit U n i v e r s i t y o f S o u t h e r n Q u e e n s l a n d
• The level of Trust of District Executives (44.3%) is lower than one would expect,
even during significant organisational challenges.
• 34.6% of respondents report experiencing some level of Harmful Behaviour in their
work area within the past six months. The public (31%) and co-workers within
profession/occupation/work group (30%) were identified as the main sources.
• 23% of respondents indicated they did not report harmful behaviours. Respondents
indicated their main reasons for not reporting were that no action would be taken
(33.9%). A further 27.7% indicated that they did not trust manager/supervisor to
respond appropriately and 25.7% of respondents indicated fear of reprisal or
victimisation if they reported.
• About half the respondents (52%) who reported harmful behaviours perceived that
action was not taken.
• 53.5% of respondents indicated that they have not had formal performance reviews
within the last 12 months.
• Respondents indicated that relationships between managers and employees (48%)
and recognition for doing good work (44%) most needed to improve in their
workplace.
Predictors of Quality of Work Life, Individual Morale and Distress Results from analysis conducted found the following specifically for the September 2006 sample:
• The predictors of Quality of Work Life are
Workplace Morale – the extent staff show enthusiasm, pride in
their work, team spirit, and energy
Professional Growth – the extent to which there is interest,
encouragement, opportunity for training, career development and
professional growth
Role Clarity – the extent to which expectations, work objectives,
responsibilities, and authority are clearly defined
Trust in Leadership of Immediate Supervisor – the extent to which
staff trust the leadership of immediate supervisor through
supervisors’ openness and integrity in communication, honesty,
support, and fairness

Staff Opinion Survey September 2006 5
Community and Organisational Research Unit U n i v e r s i t y o f S o u t h e r n Q u e e n s l a n d
Goal Congruence – the extent to which personal goals are in
agreement with workplace goals which are clearly stated and
easily understood
Quality of Work Life is higher when Workplace Distress and Excessive Work Demands
are lower.
• The predictors of Individual Morale are
Workplace Morale
Role Clarity
Professional Growth
Trust in Leadership of Immediate Supervisor
Appreciation and Recognition – the extent to which quality and
regular recognition and feedback on work performance are
provided
Individual Morale is higher when Workplace Distress and Excessive Work Demands are
lower
• The predictors of Individual Distress are
Workplace Distress
Excessive Work Demands
Individual Distress is lower when Role Clarity, Peer Support, and Trust in Leadership of
Immediate Supervisor are higher.
• The predictors of Workplace Distress are
Excessive Work Demands
Workplace Morale
Supervisor Support
Goal Congruence
Appraisal and Recognition
Participative Decision Making
Peer Support
Staff Opinion Survey September 2006 6
Community and Organisational Research Unit U n i v e r s i t y o f S o u t h e r n Q u e e n s l a n d
Conclusions
Most of the conclusions of this survey are similar to the May 2006 survey, which is not unexpected considering the nature of organisational culture and timeframes required for cultural change.
Queensland Health has committed to monitoring employee attitudes on a regular basis,
and this survey marks an important step along that road. The results of the “Better
Workplaces” Staff Opinion Survey September 2006 are encouraging. In most respects
the results are better than the May 2006 sample and Queensland Health Comparative
data for QPASS measures. These results may reflect the different districts and divisions
participating in this survey period, or may indicate an organisational trend. In addition,
the gaps between Queensland Health scores and overall Queensland public sector
QPASS scores were narrower in this survey period. Though many challenges remain,
continued management and employee engagement will further contribute to
organisational improvement. All levels of management and staff who participated in this
survey should be acknowledged for their contribution in a process that is both logistically
difficult and confronting. In so doing, they have shown a genuine willingness and
commitment to the improvement of organisational culture.
Recommendations
As issues remain similar to the May 2006 survey, many of the following
recommendations are similar to those presented in the May 2006 report.
1. Convey these findings to staff, and let them know the management has both
heard them and accepted the results. Do not distort the findings in any way, but
portray a balanced picture of both the key successes and challenges. This will
help increase trust in leadership.
2. Consult with staff on the implications of the findings and welcome their
suggestions to address challenges. In particular, identify the work areas where
immediate attention is required. Consultation could be in the way of focus groups,
ongoing committees or working groups. This step establishes the process for
staff to be involved and participate in decisions that affect their work functions.
3. Recognise that staff are motivated by regular feedback, formal and informal, of
their work and skills. Appraisal and recognition are not limited to just formal
performance reviews and long service awards.

Staff Opinion Survey September 2006 7
Community and Organisational Research Unit U n i v e r s i t y o f S o u t h e r n Q u e e n s l a n d
4. The management of harmful behaviour in the workplace is a complex issue for
most organisations. Reporting of harmful behaviours is limited by the perception
that no action will be taken. Hence, there should be a special focus on providing
feedback to assure staff that appropriate actions have occurred, even if details
that would breach confidentiality cannot be provided. Prevention and
management of harmful behaviours should initially focus on those work areas or
occupational groups highlighted in the report as experiencing such behaviour.
5. Trust in leadership is partly a function of perception, and partly a function of
performance. While a range of initiatives is being implemented (eg Leadership
Program), staff perception remains an issue. In the absence of regular face-to-
face contact and communication with management, staff will understandably
make their own assumptions about situations and uninformed conclusions of
decisions made by management. Regular contact between managers and all
workers is strongly encouraged. Whist this may be an additional challenge to
management, the benefits of improved trust and relationships will be significant.
6. The higher than desirable level of workplace distress is a product of several
factors, in particular excessive work demands. Workplace distress and the
perception of excessive work demands may be moderated by a positive work
environment where workplace morale is high and management is trusted.
Managers and supervisors at every level should be encouraged to make their
work areas cohesive, supportive and positive places to work through
management practices including regular open communication and recognition of
staff.
7. Management at every level should take every opportunity to listen to staff
concerns. While no immediate operational solution may be available to problems
raised, staff often respond more positively to change and situations if they know
they are genuinely heard. This survey is only one aspect of what should be a
culture of listening.
8. Aggregate scores on any indicator will tend to produce a middling score when the
sample size is large, eg district-wide scores. This may not reflect both positive
and challenging results for individual work units. Further interrogation of the ‘Total
Ideas’ database is recommended for individual work units as available. Each unit
manager should be encouraged to evaluate how their unit responded (where

Staff Opinion Survey September 2006 8
Community and Organisational Research Unit U n i v e r s i t y o f S o u t h e r n Q u e e n s l a n d
available), recognise and support their unit’s strengths, offer praise where praise
is due, and work with staff to make positive changes where that is warranted.
9. Districts will benefit from further analysis of results with respect to other
organisational measures including absenteeism, retention, grievances,
WorkCover data and exit interviews to provide clearer evidence of causative
factors and further direction for improvement strategies.
10. Queensland Health should review the processes of each survey, and look for
ways to improve the response rate for the next survey. The improvement of 6% in
this survey over May 2006 is encouraging and commendable. The more
management engages these findings, involves staff in improvements and
communicates outcomes of initiatives to staff, the more staff will engage in
subsequent surveys. Future expectations should take into account substantial
logistical barriers, but further improvement in response rate is encouraged.

Staff Opinion Survey September 2006 9
Community and Organisational Research Unit U n i v e r s i t y o f S o u t h e r n Q u e e n s l a n d
IntroductionIntroduction

Staff Opinion Survey September 2006 10
Community and Organisational Research Unit U n i v e r s i t y o f S o u t h e r n Q u e e n s l a n d
Introduction This report contains results of a survey conducted by a consultancy team from the
Community and Organisational Research (core) Unit at the University of Southern
Queensland (USQ) in September 2006 with Charleville HSD, Charters Towers HSD,
Gold Coast HSD, Innisfail HSD, Moranbah HSD, North Burnett HSD, Redcliffe-
Caboolture HSD, Royal Children’s Hospital HSD, South Burnett HSD, Sunshine Coast
HSD, Torres Strait and Northern Area Peninsula HSD, Corporate Services, Reform and
Development Division and the Office of the Director-General. The survey was based on
the measures of Individual Outcomes and Organisational Climate from the Queensland
Public Agency Staff Survey (QPASS), Trust in Leadership of Management, and
additional measures that were formulated by the Queensland Health Workplace Culture
team in consultation with researchers from core, and found to have acceptable
consistencies in the May 2006 survey, and further modified for this survey.
Combined results are reported for the districts, Corporate Services, Office of the
Director-General and Reform and Development Division. Additional analyses and
comparisons can be made using the interactive database, Total Ideas, which is provided
to the Workplace Culture Team as a supplement to this report. Separate reports and
databases are also provided for each of the districts, Corporate Services, Office of the
Director-General and Reform and Development Division.
Purpose of the Survey Information from the survey will be used to identify what is good about working life and
where changes need to be made to improve working conditions and practices in the
organisation as a whole. Data obtained from (1) 14 460 Queensland Health employees,
(2) 34 095 Queensland Health and other Public Sectors employees surveyed between
1999 and 2006, and (3) 4 513 respondents from May 2006 survey will be used as a
comparison to indicate areas of consistent strength as well as areas that need to be
addressed.

Staff Opinion Survey September 2006 11
Community and Organisational Research Unit U n i v e r s i t y o f S o u t h e r n Q u e e n s l a n d
Survey Process Staff in Corporate Services, Office of the Director-General and Reform and Development
Division had the opportunity to complete surveys on-line at the University of Southern
Queensland (USQ) website. The surveys were mailed or distributed by hand to all staff
in participating districts, and those with access to Groupwise were also offered the
opportunity to complete the survey on-line. The researchers at core had no access to
staff address details as the survey forms were mailed directly by Queensland Health’s
distribution contractor. In order to ensure the confidentiality of the process, staff could
complete surveys on-line or they could mail them, reply-paid, directly to USQ. At no time
were completed forms seen by Queensland Health personnel. Surveys were collected
over a three week period, at the end of which time, 4550 were returned, of which 4518
were valid and useable surveys for analysis.
The survey consisted of a number of questions requesting biographical data and items
relating to staff feelings about work, organisational climate, work area management
practices, resolution of harmful behaviours, workplace health and safety, trust in
leadership of immediate supervisor and district /divisional executive and the five
principles of the Code of Conduct. Items relating to aspects of team work, clinical work,
support for performance management, trust in leadership of senior manager within
profession and clinical / functional area were also obtained from relevant subgroups
within the sample. Respondents were also given the opportunity to suggest ways to
make things better at their workplace and to add other comments.
Details of the survey questionnaire including definitions and reliabilities of measures are
included in Appendices A and B.
Staff Opinion Survey September 2006 12
Community and Organisational Research Unit U n i v e r s i t y o f S o u t h e r n Q u e e n s l a n d
Survey ResultsSurvey Results

Staff Opinion Survey September 2006 13
Community and Organisational Research Unit U n i v e r s i t y o f S o u t h e r n Q u e e n s l a n d
Survey Results
Interpretive guidelines At the commencement of surveys, respondents will normally give their lowest ratings
and ratings gradually improve over a number of years. Hence, results from early surveys
generally represent a “low water mark” against which future results can be compared.
• Response rates of 30%+ are generally considered representative. A growing
response rate from one survey period to the next indicates growing trust (this will not
be available until staff who have been surveyed are surveyed a second time).
• Changes of at least 3% are considered statistically significant, though 3% is still a
relatively small change. One should also look for consistent change over a number of
years where this is available.
• ‘Discrepancies’ are differences of at least 3% from comparative data.
• The nature of aggregate results means that the lowest scores that an organisation
can expect to see are about 20%, and the highest are about 80%. When interpreting
results it is often better to consider the range in which they fall. We recommend:
o 60%-80% Upper Band
o 40%-60% Middle Band
o 20%-40% Lower Band
• Unless the organisation is engaged in a major change process, positive outcomes
(e.g. Quality of Work Life) should ideally be in the upper band, and negative
outcomes (e.g. Individual Distress) should be in the lower band. During a major
change process, organisations typically register scores in the middle band. Mid-
range scores often improve after major change is complete, and without any
particular intervention. Positive outcomes in the upper band during a major change
indicate acceptable change management, while scores in the lower band indicate
poor change management.
• Qualitative comments have been examined for thematic patterns (repeated
comment). Isolated comments, especially those that do not reflect the quantitative
findings should be seen as individual opinion rather than an indication of systemic
issues.

Staff Opinion Survey September 2006 14
Community and Organisational Research Unit U n i v e r s i t y o f S o u t h e r n Q u e e n s l a n d
Section A: QPASS Measures: Individual Outcomes and Organisational Climate
Measures of Individual Outcomes:
Three main measures of Individual Outcomes are obtained in the survey.
• Scores from Quality of Work Life provide a global evaluation of
respondents’ experience of their life in the workplace
• Scores from Individual Morale indicate the extent to which respondents
experience positive emotions at work
• Scores from Individual Distress indicate the level of negative emotions
experienced
Average scores obtained by respondents from Corporate Services, Office of the
Director-General, Reform and Development Division and the participating eleven
districts in this survey are compared with results of Queensland Health Comparative
data (N = 14 460), and the combined data from personnel of health and other public
sectors (N = 34 095).
In the graphs, Queensland Health Comparative scores will be denoted as QH
Comparative and combined Queensland Health and Public Sector Comparative scores
will be denoted as QH&PS Comparative. In all comparisons, a difference of at least 3%
is utilised as the “rule of thumb” to determine significant difference.
Figure 1 reveals that Quality of Work Life and Individual Morale are in the middle band
(40%-60%) and Individual Distress is in the lower band (20%-40%). Individual Morale of
the Sept 2006 sample is more favourable than QH Comparative data.
High scores are desirable for Quality of Work Life and Individual Morale, while Low scores are desirable for Individual Distress

Staff Opinion Survey September 2006 15
Community and Organisational Research Unit U n i v e r s i t y o f S o u t h e r n Q u e e n s l a n d
0.0
10.0
20.0
30.0
40.0
50.0
60.0
70.0
80.0
QH Sept 2006 49.9 57.3 32.6QH Comparative 47.6 53.1 35.3QH&PS Comparative 49.8 54.7 34.3
Quality of Work Life Individual Morale Individual Distress
Low scores are desirableHigh scores are desirable
Figure 1. Average scores of Individual Outcomes Measures
Measures of Organisational Climate
0.0
10.0
20.0
30.0
40.0
50.0
60.0
70.0
80.0
QH Sept 2006 52.4 56.3 47.5 63.4 63.3 50.1 52.2 57.0 56.7 58.5QH Comparative 49.7 53.8 45.5 60.7 60.9 46.8 48.7 54.2 58.9 61.4QH&PS Comparative 55.7 58.2 51 61.5 64.2 50.7 52.5 56.4 54.1 57.3
Wkplace Morale
Sup Support
Part Decision Making
Role Clarity
Peer Support
App & Recog
Prof Growth
Goal Congru
Wkplace Distress
Excess Wk Dds
Low scores are desirable
High scores are desirable
Figure 2. Average scores of Organisational Climate Measures

Staff Opinion Survey September 2006 16
Community and Organisational Research Unit U n i v e r s i t y o f S o u t h e r n Q u e e n s l a n d
Average scores of Role Clarity and Peer Support are in the upper band (60%-80%),
whilst the other 8 measures are in the middle band.
Figure 2 reveals that the Sept 2006 respondents are reporting
• less favourable scores than QH&PS Comparative data on Workplace Morale and
Participative Decision Making
• more favourable scores than QH Comparative data on Appraisal & Recognition
and Professional Growth

Staff Opinion Survey September 2006 17
Community and Organisational Research Unit U n i v e r s i t y o f S o u t h e r n Q u e e n s l a n d
Section B: Measures designed specifically for Queensland Health, including Trust in Leadership, Organisational Management Practices and Item-Response Frequencies Some items measured in the Better Workplaces Staff Opinion Survey applied to all
respondents, whilst some measures were designed to target specific work groups. The
following information outlines which measures applied to which groups of respondents.
Results from Measures based on Average Percentage Scores
Results of September 2006 survey are compared to results of May 2006 survey.
Measures that apply to all respondents (N = 4 518) are:
• Workplace Health and Safety
• Work Area Management Practices
• Trust in Leadership – Immediate Supervisor
• Resolution of Harmful Behaviours
• Trust in Leadership – District Executive
• 5 Principles of the Code of Conduct
Respect for People
Integrity
Respect for Law and the System of Government
Diligence
Economy and Efficiency
Some measures target specific groups. Table 1 presents the subgroups and the related
measures.

Staff Opinion Survey September 2006 18
Community and Organisational Research Unit U n i v e r s i t y o f S o u t h e r n Q u e e n s l a n d
Table 1. Subgroups and Measures
Subgroup N Measures Respondents who are accountable to a Senior Manager within their Profession/Occupation Group
3 486 Trust in Leadership-Senior Manager within Profession/Occupation Group
Respondents who are accountable to a Senior Manager within their Clinical area
3 225 Trust in Leadership-Clinical Area Senior Management
Respondents who Manage Others 1 902 Support for Performance Management Presence of Team Characteristics
Respondents who work in a team 4 304Trust Amongst Team Members Clinical Communication Clinical Management Practices Respondents who work in a clinical
environment 3 005Support of Multidisciplinary Team for Patient Care
0
10
20
30
40
50
60
70
80
QH Sept 2006 61.1 48.3 50.2 44.3QH May 2006 58.6 43.7 44.0 40.7
Trust in Immediate Supervisor
Trust in Profession/ Occupation Senior
Manager
Trust in Clinical/ Functional Area Senior Manager
Trust in District Executive
Figure 3. Average scores of Trust in Leadership
Figure 3 shows Trust in Leadership of Immediate Supervisor to be in the upper band.
Trust in Leadership of Senior Management and District Executive are in the middle
band, and they are more favourable than the results from May 2006 sample.
Staff Opinion Survey September 2006 19
Community and Organisational Research Unit U n i v e r s i t y o f S o u t h e r n Q u e e n s l a n d
0
10
20
30
40
50
60
70
80
Sept 2006-Occupation Stream 51.4 56.2 37.9 56.1 46.9 45.3 45.2 54.2May 2006-Occupation Stream 47.9 52.3 34.9 41.4 49.2 40.0 42.2 49.1QH Sept 2006 48.3 48.3 48.3 48.3 48.3 48.3 48.3 48.3
Admin Prof Tech/ Trade Medical Dental Nursing Operation Other
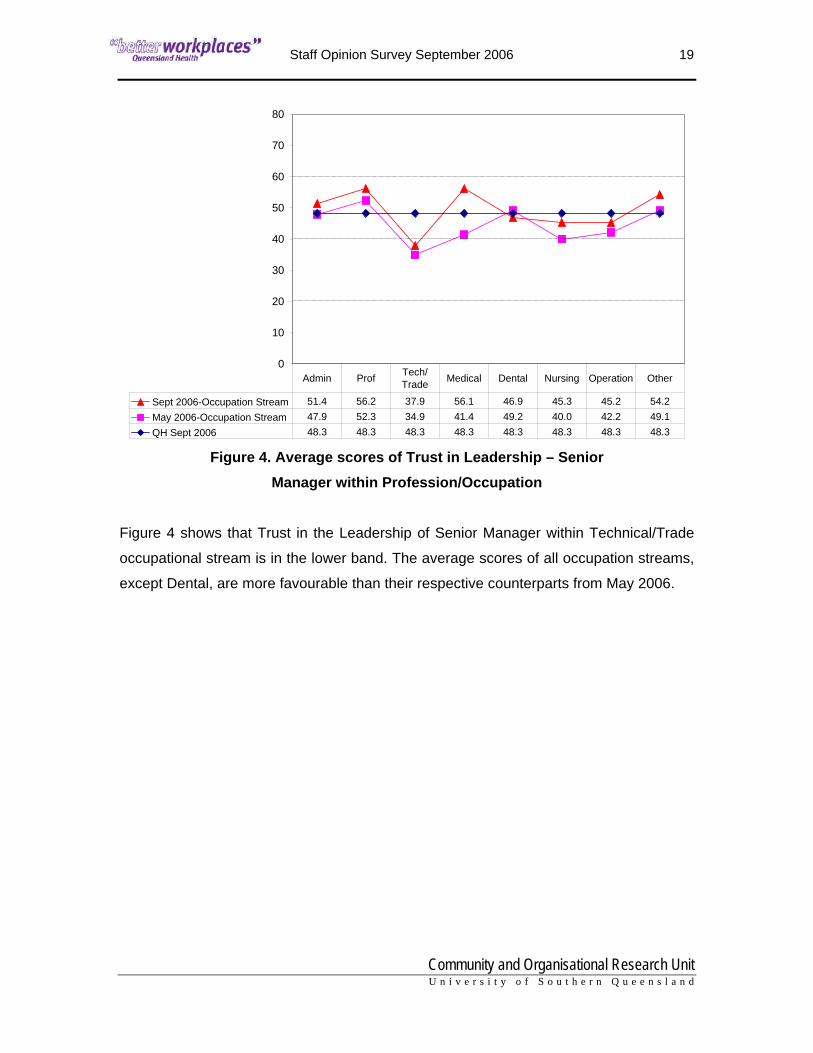
Figure 4. Average scores of Trust in Leadership – Senior Manager within Profession/Occupation
Figure 4 shows that Trust in the Leadership of Senior Manager within Technical/Trade
occupational stream is in the lower band. The average scores of all occupation streams,
except Dental, are more favourable than their respective counterparts from May 2006.

Staff Opinion Survey September 2006 20
Community and Organisational Research Unit U n i v e r s i t y o f S o u t h e r n Q u e e n s l a n d
0
10
20
30
40
50
60
70
80
QH Sept 2006 68.5 52.4 66.3 60.6QH May 2006 67.4 53.9 61.3 59.8
Workplace Health & Safety
Work Area Management
Practices
Resolution of Harmful Behaviour
Support for Performance Management
Figure 5. Average scores of Organisational Management Practices
Figure 5 shows Resolution of Harmful Behaviours is in the upper band and is more
favourable than the average score of May 2006.
0
10
20
30
40
50
60
70
80
Sept 2006-Occupation Stream 64.9 59.6 55.8 60.8 60.2 61.0 66.5 47.5May 2006-Occupation Stream 61.2 60.3 55.0 60.8 59.6 58.8 66.2QH Sept 2006 60.6 60.6 60.6 60.6 60.6 60.6 60.6 60.6
Admin Prof Medical Dental Nursing Operation Other Tech/ Trade
Figure 6. Average scores of Support for Performance Management
(by occupational stream)

Staff Opinion Survey September 2006 21
Community and Organisational Research Unit U n i v e r s i t y o f S o u t h e r n Q u e e n s l a n d
Figure 6 shows that the average scores of Administration, Professional, Dental, Nursing,
Operational, and Other respondents who manage others are in the upper band,
however, Medical and Technical/Trade respondents are reporting scores in the middle
band.
Administration respondents who manage others are reporting more favourably than their
counterparts from May 2006 survey. Administration and “Other” respondents scored
higher than the overall average of the subgroup from September 2006 sample, whilst
Medical and Technical/Trade respondents scored lower.
There were fewer than 10 respondents from Indigenous Health Workers for May and
September, hence their scores are not included. In May 2006, there were fewer than 10
respondents from Technical/Trade, hence no average score is displayed in Figure 6 for
comparison.
Staff Opinion Survey September 2006 22
Community and Organisational Research Unit U n i v e r s i t y o f S o u t h e r n Q u e e n s l a n d
0
10
20
30
40
50
60
70
80
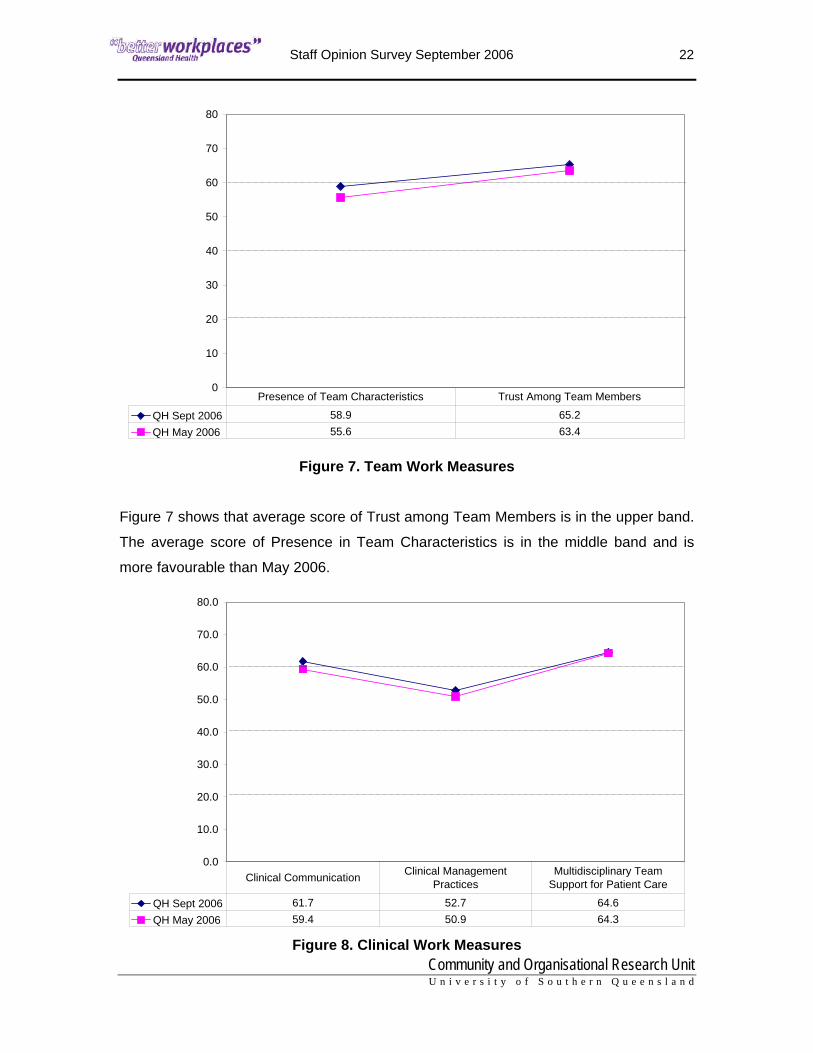
QH Sept 2006 58.9 65.2QH May 2006 55.6 63.4
Presence of Team Characteristics Trust Among Team Members
Figure 7. Team Work Measures
Figure 7 shows that average score of Trust among Team Members is in the upper band.
The average score of Presence in Team Characteristics is in the middle band and is
more favourable than May 2006.
0.0
10.0
20.0
30.0
40.0
50.0
60.0
70.0
80.0
QH Sept 2006 61.7 52.7 64.6QH May 2006 59.4 50.9 64.3
Clinical Communication Clinical Management Practices
Multidisciplinary Team Support for Patient Care
Figure 8. Clinical Work Measures

Staff Opinion Survey September 2006 23
Community and Organisational Research Unit U n i v e r s i t y o f S o u t h e r n Q u e e n s l a n d
Figure 8 shows that the average scores of Clinical Communication and Multidisciplinary
Team Support for Patient Care are in the upper band whilst Management Practices
(procedures and systems) is in the middle band. All measures of Clinical Work are
similar to May 2006 sample.
The items that best describe the 5 principles of the Code of Conduct were chosen from
the survey.
In making comparisons to the May 2006 results, it is to be noted that the average scores
of May 2006 were from a subgroup of respondents, namely those who work in a team as
well as in a clinical area.
Average scores for the overall September 2006 sample are presented in Figure 9.
0.0
10.0
20.0
30.0
40.0
50.0
60.0
70.0
80.0
Sept 2006 57.4 53.3 65.2 65.5 59.3May 2006 59.9 49.8 61.4 59.6 57.4
Respect for People Integrity
Respect for Law and System of Government
Diligence Economy & Efficiency
Figure 9. Code of Conduct Principles

Staff Opinion Survey September 2006 24
Community and Organisational Research Unit U n i v e r s i t y o f S o u t h e r n Q u e e n s l a n d
Results from Items relating to the Code of Conduct (reported as percentage of respondents or number of respondents)
The frequency distributions of three items from the section on Management Practices
and one item from Clinical Work are reported in Figures 10 to 12 and Table 2
respectively. Please note that May 2006 respondents did not provide data for these
measures therefore there is no comparative data available.
strongly agree
agreeneither agree nor disagree
disagreestrongly disagree
40
30
20
10
0
Perc
ent
10.31%
20.66%18.24%
35.27%
15.53%
Figure 10. Staff feel pressured to work unpaid over time
Figure 10 shows that approximately 31% of the respondents agree that staff feel
pressured to work unpaid over time.

Staff Opinion Survey September 2006 25
Community and Organisational Research Unit U n i v e r s i t y o f S o u t h e r n Q u e e n s l a n d
strongly agree
agreeneither agree nor disagree
disagreestrongly disagree
50
40
30
20
10
0
Perc
ent
2.62%9.87%
23.37%
45.58%
18.56%
Figure 11.Staff use Departmental resources for private use more than they should
Figure 11 shows that approximately 12% of the respondents agree that staff use
departmental resources for private use more than they should.

Staff Opinion Survey September 2006 26
Community and Organisational Research Unit U n i v e r s i t y o f S o u t h e r n Q u e e n s l a n d
strongly agree
agreeneither agree nor disagree
disagreestrongly disagree
60
50
40
30
20
10
0
Perc
ent
12.17%
53.54%
17.71%12.15%
4.44%
Figure 12. Staff behave according to the Code of Conduct
Figure 12 shows that approximately 66% of the respondents agree that staff behave
according to the Code of Conduct.
Table 2. Percentage of respondents to “If I were a patient in the facility that I work in, I would be happy with the standard of care provided”
Disagree (%) Neither (%) Agree (%) No Response (%) September 2006 12.6 11.5 41.3 34.6

Staff Opinion Survey September 2006 27
Community and Organisational Research Unit U n i v e r s i t y o f S o u t h e r n Q u e e n s l a n d
Harmful Behaviours
The responses to a series of items in the survey that relate to the experience of harmful
behaviours, action taken on reported harmful behaviours, source of harmful behaviours,
and reasons for not reporting harmful behaviours are presented in the following sections.
NoYes
60
40
20
0
Perc
ent
65.45%
34.55%
Figure 13. In the past 6 months, I have experienced harmful behaviours
in my work area Figure 13 shows that approximately 35% of total valid responses reported experiencing
harmful behaviours in their work area.

Staff Opinion Survey September 2006 28
Community and Organisational Research Unit U n i v e r s i t y o f S o u t h e r n Q u e e n s l a n d
Not ApplicableNoYes
50
40
30
20
10
0
Perc
ent
45.4%48.0%
6.6%
Figure 14. In the past 6 months, I have experienced this behaviour when my
performance was being managed.
Figure 14 shows that approximately 7% of total valid responses reported experiencing
the harmful behaviours when performance was being managed.

Staff Opinion Survey September 2006 29
Community and Organisational Research Unit U n i v e r s i t y o f S o u t h e r n Q u e e n s l a n d
NoYes
100
80
60
40
20
0
Perc
ent
80.23%
19.77%
Figure 15. In the past 6 months, I have experienced harmful behaviour when trying
to manage my staff
Figure 15 shows that approximately 20% of total valid responses reported experiencing
harmful behaviours when trying to manage staff.
Table 3 shows the number of respondents across occupation streams who agree to the
item that asked “In the past 6 months I have experienced harmful behaviour in my work
area” and the number of respondents across occupation streams who agree to the
follow-up item that asked “In the past 6 months I have experienced this behaviour when
my performance was being managed”.

Staff Opinion Survey September 2006 30
Community and Organisational Research Unit U n i v e r s i t y o f S o u t h e r n Q u e e n s l a n d
Table 3. Number of respondents across occupation streams who agree to “In the past 6 months I have experienced harmful behaviour in my work area” and “In the past 6 months I have experienced this behaviour when my performance was being managed”.
Total
number of respondents
Number of respondents who
experienced harmful
behaviours
Number of respondents who
experienced the harmful behaviour when performance
was being managed Administration 975 268 54
Professional 510 149 27
Technical/Trade 29 9 2
Medical 227 60 14
Dental 92 30 6
Nursing 1856 783 126
Indigenous
Health Worker
10 3 1
Operational 473 164 44
Other 124 18 2
Staff Opinion Survey September 2006 31
Community and Organisational Research Unit U n i v e r s i t y o f S o u t h e r n Q u e e n s l a n d
0
200
400
600
800
1000
1200
1400
QH Sept 2006 1160 528 599 732 1294
Harmful Behaviour Reported
Action Taken No Action Taken Did Not Report Not Applicable
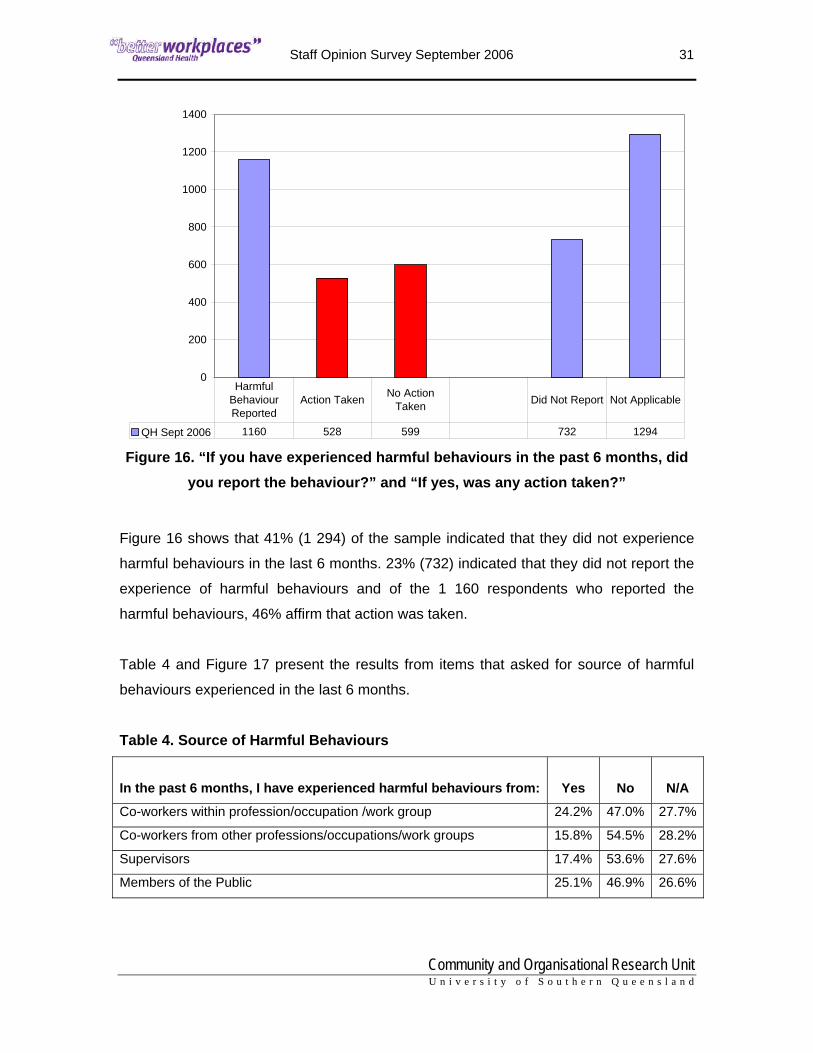
Figure 16. “If you have experienced harmful behaviours in the past 6 months, did you report the behaviour?” and “If yes, was any action taken?”
Figure 16 shows that 41% (1 294) of the sample indicated that they did not experience
harmful behaviours in the last 6 months. 23% (732) indicated that they did not report the
experience of harmful behaviours and of the 1 160 respondents who reported the
harmful behaviours, 46% affirm that action was taken.
Table 4 and Figure 17 present the results from items that asked for source of harmful
behaviours experienced in the last 6 months.
Table 4. Source of Harmful Behaviours In the past 6 months, I have experienced harmful behaviours from: Yes No N/A
Co-workers within profession/occupation /work group 24.2% 47.0% 27.7%
Co-workers from other professions/occupations/work groups 15.8% 54.5% 28.2%
Supervisors 17.4% 53.6% 27.6%
Members of the Public 25.1% 46.9% 26.6%

Staff Opinion Survey September 2006 32
Community and Organisational Research Unit U n i v e r s i t y o f S o u t h e r n Q u e e n s l a n d
0.0%
5.0%
10.0%
15.0%
20.0%
25.0%
30.0%
QH Sept 2006 24.2% 15.8% 17.4% 25.1%
Co-workers within profession/occupation /work
group (n=1094)
Co-workers from other professions/occupations/
work groups (n=713)Supervisors (n=787) Public (n=1133)
Figure 17. Percentage of respondents who indicate source of harmful behaviours

Staff Opinion Survey September 2006 33
Community and Organisational Research Unit U n i v e r s i t y o f S o u t h e r n Q u e e n s l a n d
Table 5 and Figure 18 present the results from items that asked for the main reasons for
not reporting harmful behaviours.
Table 5. Main reasons for not reporting Harmful Behaviours Main reasons for not reporting harmful behaviours: Yes No N/A
Reprisal/Victimisation 17.2% 12.5% 59.8%
No action would be taken 22.7% 7.7% 59.1%
Do not trust mgr/sup to respond appropriately 18.5% 11.4% 59.4%
Unaware of the correct process 3.5% 24.5% 60.7%
Plan to leave 4.8% 22.9% 60.8%
0.0%
5.0%
10.0%
15.0%
20.0%
25.0%
QH Sept 2006 17.2% 22.7% 18.5% 3.5% 4.8%
Reprisal/ Victimisation (n=778)
No action would be taken (n=1026)
Do not trust mgr/sup to respond
appropriately (n=838)
Unaware of the correct process
(n=156)Plan to leave (n=219)
Figure 18. Percentage of respondents who indicated main reasons for not reporting harmful behaviours

Staff Opinion Survey September 2006 34
Community and Organisational Research Unit U n i v e r s i t y o f S o u t h e r n Q u e e n s l a n d
Performance Review
Figures 19 to 21 present the responses to items pertaining to performance review.
NoYes
60
50
40
30
20
10
0
Perc
ent
45.8%
54.2%
Figure 19. “I have had a formal performance review in the last 12 months”
Staff Opinion Survey September 2006 35
Community and Organisational Research Unit U n i v e r s i t y o f S o u t h e r n Q u e e n s l a n d
0
200
400
600
800
1000
1200
1400
1600
1800
2000
2200
Sept 2006 2070 1944 87
Had Performance Review Conducted fairly Not conducted fairly
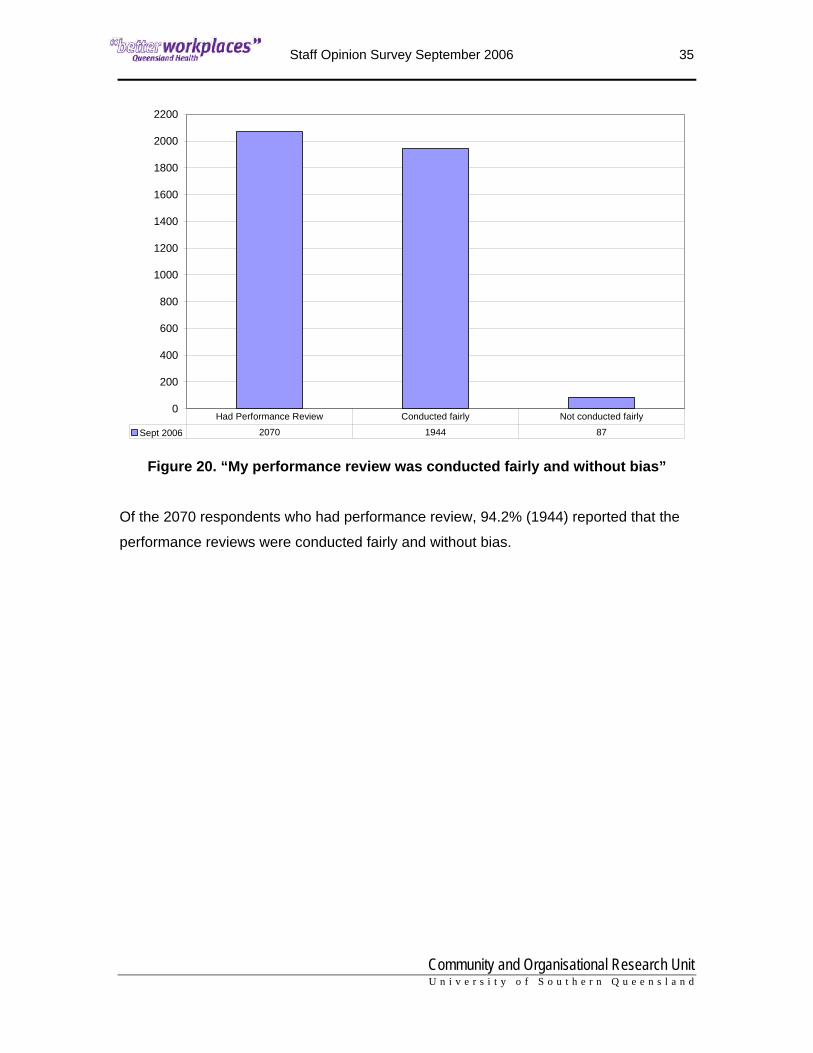
Figure 20. “My performance review was conducted fairly and without bias”
Of the 2070 respondents who had performance review, 94.2% (1944) reported that the
performance reviews were conducted fairly and without bias.

Staff Opinion Survey September 2006 36
Community and Organisational Research Unit U n i v e r s i t y o f S o u t h e r n Q u e e n s l a n d
NoYes
60
40
20
0
Perc
ent
35.2%
64.8%
Figure 21. “I have conducted performance reviews with all my direct staff in the last 12 months”

Staff Opinion Survey September 2006 37
Community and Organisational Research Unit U n i v e r s i t y o f S o u t h e r n Q u e e n s l a n d
Indicators of Quality in Workplace
The indicators provided are based on the key recognised dimensions of quality
workplaces in the Office of the Public Service Commissioner Quality Public Service
Workplaces framework for Queensland Government departments, endorsed by Cabinet
in November 2005. Respondents were asked to indicate up to five most important
things that need to improve in their workplace. Figure 22 presents the percentages of
respondents in descending order.
0.0 10.0 20.0 30.0 40.0 50.0 60.0
Workplace health & safety & employee health & well-being
Patient/client/customer focused behaviour
Clarity of values and expectations
Freedom from harassment and dsicrimination
Employee involvement and participation
Interest and satisfaction of work
Work efficiency and effectiveness
Relationships among co-workers
Opportunities for work-life balance
Fair treatment of staff
Availability of right materials and equipment
Chances to learn and advance
Openness of communication
Leadership and supervisory practices
Recognition for doing good work
Relationships between managers and employees
Figure 22. Most important Indicators that need to improve in the workplace

Staff Opinion Survey September 2006 38
Community and Organisational Research Unit U n i v e r s i t y o f S o u t h e r n Q u e e n s l a n d
Respondents were also asked to indicate up to five best things about their workplace
from the same list of indicators. Figure 23 presents the percentages of respondents in
descending order.
0.0 10.0 20.0 30.0 40.0 50.0 60.0 70.0
Leadership and supervisory practices
Recognition for doing good work
Clarity of values and expectations
Work efficiency and effectiveness
Employee involvement and participation
Workplace health & safety & employee health & well-being
Fair treatment of staff
Opportunities for work-life balance
Relationships between managers and employees
Openness of communication
Freedom from harassment and dsicrimination
Patient/client/customer focused behaviour
Availability of right materials and equipment
Chances to learn and advance
Interest and satisfaction of work
Relationships among co-workers
Figure 23. Best Indicators of Quality in the Workplace

Staff Opinion Survey September 2006 39
Community and Organisational Research Unit U n i v e r s i t y o f S o u t h e r n Q u e e n s l a n d
Section C: Frequency of Main Themes from Comments
Free text comments were written in response to the following question: “What are your
other realistic suggestions for making things better at your workplace?” Comments from
Corporate Services, Office of the Director-General, and Reform and Development
Division and the eleven health service districts were collated. The main themes were
identified and the associated counts of suggestions and positive comments of each
theme are presented in Table 6.

Staff Opinion Survey September 2006 40
Community and Organisational Research Unit U n i v e r s i t y o f S o u t h e r n Q u e e n s l a n d
Table 6. Frequency of Positive Comments from Respondents.
Main Themes Positive
workplace system functioning 26 workspace/buildings 19 team work 14 communication 13 training/professional development 11 management competency 10 support from management 6 respect 5 support for co-workers 5 morale 5 equipment 4 feedback 3 more staff 3 shifts/rostering 3 survey 3 planning/policy making 2 participative decision making 2 trust 2 recruitment process 2 appropriately trained staff 1 bullying/harassment 1 workload 1 work/life balance 1 fairness/equality 1 shared workload 1 leadership 1 accommodation 1 transparency 1 management listening 1 staff valued 1 staff accountability 1 sick leave 1 honesty 1

Staff Opinion Survey September 2006 41
Community and Organisational Research Unit U n i v e r s i t y o f S o u t h e r n Q u e e n s l a n d
Table 7. Frequency of Suggestions from Respondents’ Comments.
Main Themes Suggestions Main Themes Suggestions
training/professional development 541 parking 57 more staff 493 need staff meetings 55 communication 331 management accountability 52 recruitment process 331 paid overtime/TOIL 52 workspace/buildings 245 part-time/job sharing 52 workload 241 more beds 50 equipment 233 recognition of skills 49 planning/policy making 231 trust 45 fairness/equality 213 survey 45 management competency 198 backfilling 42 bullying/harassment 193 confidentiality 42 management out of touch 154 Code of Conduct 40 resources/budgets 142 work/life balance 40 recognition of work 128 workplace/QH culture 38 shifts/rostering 123 rewards/incentives 37 management listening 123 favouritism 30 workplace system functioning 121 accommodation 30 pay levels 112 harassment by patients 26 morale 108 shared workload 26 respect 104 rural/remote 26 retention 103 workspace hygiene 25 computers/internet access 94 honesty 25 feedback 94 sick leave 24 participative decision making 86 childcare facilities 23 leadership 84 support for management 23 team work 82 management training 23 support from management 80 encouragement 23 work duty clarification 79 security for night shift 22 promotion 79 staff canteen 20 work appraisals/PAD 78 access to leave/holidays 19 staff accountability 75 nepotism 18 paper work 74 staff gym/health facilities 18
staff valued 73 coordination among work units 18
stress 70 social events 10
appropriately trained staff 69 need English-speaking doctors 10
support for co-workers 67 delete Eventide category 5 top heavy organisation 65 more work hours 5 need permanent contracts 63 teambuilding 5 transparency 59 racism 3 rostered skill mix 59 workplace environment 1

Staff Opinion Survey September 2006 42
Community and Organisational Research Unit U n i v e r s i t y o f S o u t h e r n Q u e e n s l a n d
Section D: General Information
Demographic Details of Respondents
4 550 paper and web version surveys were returned. Of these, 4 518 were valid and
useable.
Demographic details of the sample (N = 4 518) are provided in the table and graphs to
follow.
Table 7. Details of sample
Gender Count Percent Female 3500 77.5 Male 824 18.2 Didn't indicate 194 4.3
Subgroups Count Percent Team 4304 95.3 Clinical 3005 66.5 Leadership of Senior Manager with Profession 3486 77.2 Leadership of Clinical/Functional Area Senior Management 3225 71.4 Manage Others 1902 42.1
0 200 400 600 800 1000 1200 1400 1600
Didn't indicate
Over 60 years
51-60 years
41-50 years
31-40 years
21-30 years
Under 21 years
Figure 24. Age of Respondents

Staff Opinion Survey September 2006 43
Community and Organisational Research Unit U n i v e r s i t y o f S o u t h e r n Q u e e n s l a n d
0 200 400 600 800 1000
Didn't indicate
> 20 years
16-20 years
11-15 years
6-10 years
3-5 years
1-2 years
< 1 year
Current RoleCurrent Location
Figure 25. Length of Time Working at Current Work Location and Current Role
0 500 1000 1500 2000 2500 3000
Didn't indicate
Casual/Flexible
Temporary PT
Temporary FT
Permanent PT
Permanent FT
Figure 26. Current Employment Status of Respondents

Staff Opinion Survey September 2006 44
Community and Organisational Research Unit U n i v e r s i t y o f S o u t h e r n Q u e e n s l a n d
0 200 400 600 800 1000 1200 1400 1600 1800 2000
Didn't indicate
Other
Technical/Trade
Operational
Nursing
Dental
Indigenous Health Workers
Medical
Professional
Administration
Figure 27. Occupation Stream Groups
0 200 400 600 800 1000 1200
Didn't indicate
Degree-Postgrad
Degree-Undergrad
Professional Dip
Technical Cert/Dip
Completed High School
Left school early
Figure 28. Highest Educational Level Achieved

Staff Opinion Survey September 2006 45
Community and Organisational Research Unit U n i v e r s i t y o f S o u t h e r n Q u e e n s l a n d
AppendixAppendix

Staff Opinion Survey September 2006 46
Community and Organisational Research Unit U n i v e r s i t y o f S o u t h e r n Q u e e n s l a n d
Appendix A
Description of the Survey Questionnaire
The first section contained two measures from QPASS. These included Individual
Outcome and Organisational Climate.
Individual Outcome
Workplace conditions can have a direct individual effect on staff, and will either enhance
positive (enthusiastic, proud, cheerful) or increase negative (tense, unhappy, and even
depressed) feelings.
Variables in this measure include:
• Quality of Work Life (6 items) – Conditions of life at work are excellent, giving
everything important that might be wanted.
• Individual Morale (7 items) – Feeling positive, proud, cheerful, and energised at
work.
• Individual Distress (7 items) – Feeling tense, afraid, unhappy, anxious, negative,
uneasy and depressed at work.
Organisational Climate Variables in this measure are either positive or negative. Some situations enhance
feelings of enthusiasm, team spirit, empowerment, and job satisfaction due to positive
management styles, clear roles, professional development opportunities, and interaction.
However, some situations are negative in that they cause distress in the workplace.
Variables in this measure include:
• Workplace Morale (5 items) – Respondents show enthusiasm, pride in their
work, team spirit, and energy.
• Supervisor Support (5 items) – Managers are approachable, dependable,
supportive, and they know the problems faced by staff, and communicate well
with them.
Staff Opinion Survey September 2006 47
Community and Organisational Research Unit U n i v e r s i t y o f S o u t h e r n Q u e e n s l a n d
• Participative Decision-Making (4 items) – Staff are asked to participate in
decisions, and are given opportunities to express their views.
• Role Clarity (4 items) – Expectations, work objectives, responsibilities, and
authority are clearly defined.
• Peer Support (7 items) – Acceptance and support from others, with
involvement, sharing, good communication and help when needed.
• Appraisal and Recognition (6 items) – Quality and regular recognition and
feedback on work performance.
• Professional Growth (5 items) – Interest, encouragement, opportunity for
training, career development and professional growth.
• Goal Congruence (5 items) – Personal goals are in agreement with workplace
goals which are clearly stated and easily understood.
• Workplace Distress (5 items) – Staff feel frustrated, stressed, tense, anxious
and depressed about their work.
• Excessive Work Demands (4 items) – Staff are overloaded with constant
pressure to keep working, leaving no time to relax.
Trust in Leadership and Organisation Management Practices Measures
Five of the 14 new measures apply to all respondents. They are:
• Workplace Health and Safety (5 items) – Indicates the extent to which staff agree
that procedures are committed by management to ensure staff are free from risk of
injury, illness and individual harm caused by workplace activity.
• Work Area Management Practices (9 items) – Indicates the extent to which staff
agree that policies and practices with regards to work, performance, recruitment and
selection, and training are fair and adequate.
• Trust in Leadership - Immediate Supervisor (12 items) – Indicates the extent to
which staff trust the leadership of immediate supervisor through behaviours that
describe openness and integrity in communication and interaction, support and
fairness.
• Trust in Leadership - District Executive (6 items) – Indicates the extent to which
staff trust the leadership of district executive through behaviours that describe
openness and integrity in communication and interaction, support and fairness.

Staff Opinion Survey September 2006 48
Community and Organisational Research Unit U n i v e r s i t y o f S o u t h e r n Q u e e n s l a n d
• Resolution of Harmful Behaviours (4 items) – Indicates the extent to which staff
agree that there are options for the resolution of harmful behaviours.
Nine measures apply to subgroups of respondents.
For a subgroup of respondents who work in a team, the following two measures apply:
• Presence of Characteristics of a Team (4 items) – Indicates the extent to which
staff agree that the team has clear objectives and guidelines to work from, shared
understanding of and committed to those objectives, and review its effectiveness and
how it could be improved.
• Trust amongst Team Members (6 items) – Indicates the extent to which staff agree
that there is trust amongst team members through behaviours that describe honesty,
openness in communication, integrity in interaction, and support.
For a subgroup of respondents who report to a senior manager within their own
profession or occupation, the following measure applies:
• Trust in Leadership - Senior Manager within Profession/Occupation (6 items) –
Indicates the extent to which staff trust the leadership of senior manager in their
profession or occupation through behaviours that describe openness and integrity in
communication and interaction, support and fairness. For a subgroup of respondents who spend most of their time working in a clinical/
functional area, the following measure applies:
• Trust in Leadership - Clinical/Functional Area Senior Management (6 items) –
Indicates the extent to which respondents trust the leadership of senior management
of their clinical or functional area through behaviours that describe openness and
integrity in communication and interaction, support and fairness.
For a subgroup of respondents who manage others, the following measure applies:
• Support for Performance Management (4 items) – Indicates the extent staff agree
that they have the appropriate skills and the support to manage staff performance.
Staff Opinion Survey September 2006 49
Community and Organisational Research Unit U n i v e r s i t y o f S o u t h e r n Q u e e n s l a n d
For a subgroup of respondents who work in a clinical environment, the following
measures apply:
• Clinical Communication (5 items) – Indicates the extent staff agree that there is
bidirectional information, both verbal and documentation, for them to do their job.
• Clinical Management Practices (8 items) – Indicates the extent to which staff agree
that there are adequate procedures and systems to support clinical work.
• Multidisciplinary Team Support for Patient Care (4 items) – Indicates the extent
to which staff agree that multidisciplinary teams support patient care.
Biographical Data
The following information was collected from the last section of the survey:
• Gender
• Age
• Length of time in current position and at current location
• Current employment status
• Current classification
• Work location
• Highest level of education
• Supervisory responsibilities
Staff Opinion Survey September 2006 50
Community and Organisational Research Unit U n i v e r s i t y o f S o u t h e r n Q u e e n s l a n d
Appendix B
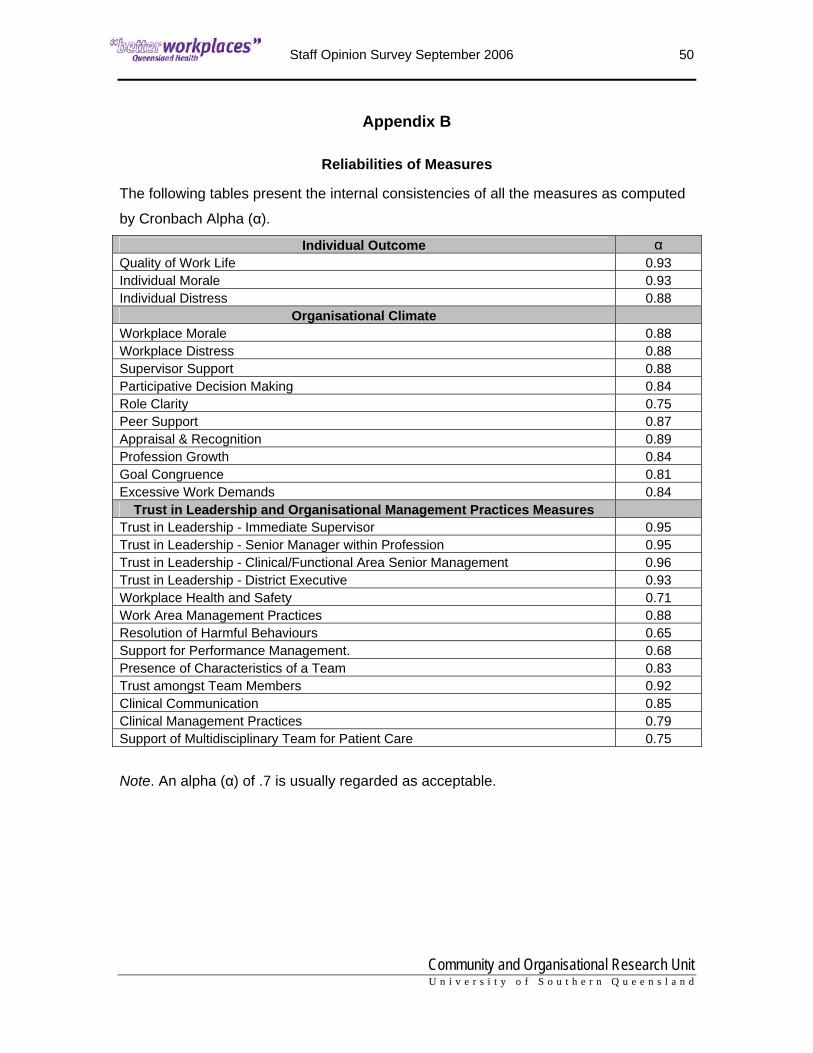
Reliabilities of Measures
The following tables present the internal consistencies of all the measures as computed
by Cronbach Alpha (α).
Individual Outcome α Quality of Work Life 0.93 Individual Morale 0.93 Individual Distress 0.88
Organisational Climate Workplace Morale 0.88 Workplace Distress 0.88 Supervisor Support 0.88 Participative Decision Making 0.84 Role Clarity 0.75 Peer Support 0.87 Appraisal & Recognition 0.89 Profession Growth 0.84 Goal Congruence 0.81 Excessive Work Demands 0.84
Trust in Leadership and Organisational Management Practices Measures Trust in Leadership - Immediate Supervisor 0.95 Trust in Leadership - Senior Manager within Profession 0.95 Trust in Leadership - Clinical/Functional Area Senior Management 0.96 Trust in Leadership - District Executive 0.93 Workplace Health and Safety 0.71 Work Area Management Practices 0.88 Resolution of Harmful Behaviours 0.65 Support for Performance Management. 0.68 Presence of Characteristics of a Team 0.83 Trust amongst Team Members 0.92 Clinical Communication 0.85 Clinical Management Practices 0.79 Support of Multidisciplinary Team for Patient Care 0.75
Note. An alpha (α) of .7 is usually regarded as acceptable.

Staff Opinion Survey September 2006 51
Community and Organisational Research Unit U n i v e r s i t y o f S o u t h e r n Q u e e n s l a n d
Principle 1 Respect for People α = .89
Mn3 Staff are treated fairly when mistakes are made Sup4 My supervisor and I trust each other Sup7 My supervisor treats people with care and respect
Sup8 My supervisor asks for my opinion before making decisions that affect my work
Sup10rev My supervisor shows favouritism towards some staff Sup11 My supervisor manages conflicts fairly and promptly
Principle 2 Integrity α = .79 Mn1 Recruitment and selection practices are transparent and fair Mn2 Problems are managed in a timely and appropriate manner Mn4 Work is allocated fairly Mn12 My formal review was conducted fairly and without bias Sup11 My supervisor manages conflict fairly and promptly
Principle 3 Respect for Law and the System of Government α = .61 WHS3rev My work is physically unsafe for me
WHS5 I am always released for mandatory Workplace Health and Safety training
Mn7 There are clear guidelines and policies for how we work Mn9 Staff behave according to the Code of Conduct
HB3 I trust the process for managing harmful behaviours that breach the Code of Conduct
Principle 4 Diligence α = .71
WHS1 There is genuine commitment by management to staff safety in my work area
WHS2 Staff are encouraged to always report hazards, incidents and 'near misses' WHS4 I have confidential access to counselling service (EAS) when required Mn6 I receive the training that I need to do my work Sup2 My supervisor supports me to improve my skills and performance
Principle 5 Economy and Efficiency α = .59 Mn5 I am provided with the right equipment to complete my work
Mn9 There are structures and routine which encourage staff, collectively, to evaluate and improve their work practices
Mn10rev Staff feel pressured to work unpaid overtime Mn11rev Staff regularly use departmental resources for personal use
Sup12 My supervisor encourages me to raise new ideas and find improved ways of doing my job
Note. An alpha (α) of .7 is usually regarded as acceptable. Interpretation of measures
with alphas of less than .7 has to be done with caution.