september 2011 - school of electrical engineering systems - dublin
TRANSCRIPT

Sustainable EngineeringDesign
The SDAR*JournalSeptember 2011
The journal of Applied Research in Innovative Engineering of the Built Environment
Issue 1
SustainableDesign &
Applied Research
in Engineering of the Built Environment
New SDAR Journal Cover:Layout 1 09/09/2011 16:05 Page 2

Airtricity is in the
business of saving my
companymoney
Switch your business to Airtricity,Ireland’s greenest electricity supplier.More than 500,000 customers have already made the better switch to Airtricity and saved.No matter how big or small your business is, if you want to save money and reduce yourcarbon footprint switch to Airtricity today.
It’s not just energy made better, it’s businesses made better too.
Now there are even more reasons to switch to Airtricity:Voted the Most Trusted and Reputable Energy Supplier (2011 RepTrak)2011 Green Energy Award Winner, third year in a rowIreland’s largest independent energy supplierIreland’s largest renewable energy generator
Call us today on 1850 40 40 80 for a personalised business quote fromyour local Airtricity Sales Representative and see how our savings mean business.
W I N N E R
TheGreen Energy Award
Visit www.airtricity.com
LoCall 1850 40 40 80
1
Contents Introduction
On behalf of the Chartered Institution of Building Services Engineers(CIBSE) in Ireland, I would like to welcome you to the first edition of thisexciting new publication on sustainable design and applied research.
This journal is the result of a continuing and productive collaboration betweenCIBSE Ireland, DIT and our members, and will provide an important repositoryof documented evidence in engineering design and research. We hope that itwill prove to be a useful source of information and discussion to researchers,designers and all involved in the built environment.
It is important to emphasise that the building services industry needs toprogress from ideologically-based sustainable or green initiatives towardsproven and evidence-based technical solutions that deliver, in a cost-effectiveway, on a whole life-cycle basis. We feel this can only be achieved throughevidence-based evaluation and applied research, and the SDAR* Journal is wellplaced to report and share these findings.
We believe that there are genuine opportunities for building services engineers,architects and academics to form alliances and strategic partnerships in thearea of evidence-based research and evaluation to continuously improve thebuilt environment based on real data and analysis. This continuousimprovement cycle will not only generate much-needed activity in the market,but will deliver more sustainable buildings and communities.
This journal is made up of a strong spine of industry-based research. Itcomprises companies, and individuals within companies, disseminatinginsightful findings based on evidence gathered from live projects that drive ustowards a more sustainable world. We learn from their successes but we alsolearn from the things that went wrong. Critical reflection is central to all of the work published here and, in that way, the quality is enhanced.
In addition, the journal also includes good-quality articles from youngengineers. Indeed, with our instigation of the Irish Young Lighter in 2003, we have a proven track record in encouraging our young bright engineers
of tomorrow.
I would encourage engineers,contractors and other professionals in the built environment to considersubmitting articles for the next issue of this journal which is scheduled forsummer 2012. I would also encouragesubmissions to the Irish Lighter/YoungLighter and SDAR* Awardscompetitions.
Regards,
Derek MowldsChairman CIBSE Republic of Ireland Region
2 Editor’s foreword
2 A readers guide to this issue
5 UCC’s Western Gateway Building – a case study for the integration of low temperature heating and high temperature cooling systemsMichael F. Keohane BE MEngSc CEng, Declan Leonard MSc CEng
17 Criminal Courts of Justice DublinJonathan Tooth, HND in Building Services
Rory Burke BE(Eng), Dip. Proj.Man, Certified BREEAM, BER & LEED
Assessor, ACIBSE, MIEI, Colm Saul BSc(Eng), MCIBSE, MIEI
25 A review of the Passiv Haus Concept, and an examination of how this was applied to a supermarket in IrelandMarc Wegner BE ME MIEI
33 An investigation into why lighting controls fail in buildingsBernard Doyle BEng Tech, BSc
41 An examination into the use of compact fluorescent lamps in the environment James Duff BEng Tech, BSc.
53 Waterford Institute of Technology, Tourism and Leisure BuildingChris Croly BSc (hons) CEng MIEI MCIBSE
The SDAR* Journal is a sustainable design and appliedresearch publication written by engineers and researchers forprofessionals in the built environment
Editor: Dr Kevin Kelly, DIT & CIBSE
Reviewing panel: Professor Eugene Coyle, DIT; Dr Ken Beattie,DIT; Dr David Kennedy, DIT; Mr Michael McNerney, CIBSE; MrAlan Duggan, CIBSE; Mr Keith Sunderland, DIT & CIBSE; Mr Derek Mowlds, CIBSE and Mr Kevin Gaughan, DIT
Published by: CIBSE Ireland and the School of ElectricalEngineering Systems, DITSDAR* website: http://eleceng.dit.ie/sdar/ SDAR* Awards competition:http://eleceng.dit.ie/sdar/sdar_awards.php Irish Lighter: http://eleceng.dit.ie/sdar/irishlighter.php
Produced by: Pressline Ltd, Carraig Court, George’s Avenue,Blackrock, Co Dublin. Tel: 01 - 288 5001/2/3 Fax: 01 - 288 6966email: [email protected]
Printed by: Swift Print Solutions (SPS).© SDAR* Research Journal
Additional copies can be purchased for e50
SDAR Intro pages:Layout 1 14/09/2011 12:29 Page 1

Editor’s foreword A Reader’s Guide
Welcome to the first edition of what will be the mostwidely-read applied research journal in the engineering/builtenvironment sector in Ireland. This journal concentrates onpapers which present insightful findings to working professionals.All papers are evidence-based and are critically reviewed byengineering peers and academics to ensure good quality andauthentic findings. The intention is to disseminate insightfulresearch findings throughout the industry.
The quality of papers is judged less by the success of a projectand more by the insight produced by the findings and the qualityof evidence and analysis presented. There is as much to learnfrom the mistakes and the things that went wrong as there isfrom the things that went right. Insight is often borne out inresearch by the surprises involved.
Apart from papers by working engineers and researchers, thisand all future editions will include papers from young engineers,post-graduate and undergraduate students.
The intention with this journal is to encourage applied researchand disseminate interesting findings in sustainable design backinto our industry. We encourage all professionals involved in thebuilt environment to consider contributing articles to futureeditions.
Research is not just about people in white coats in laboratories.It is about critically evaluating your project innovations andcomparing your findings with those of others. Evidence-basedevaluation is applied research and every project is an individualcase study waiting for analysis. Publication of that appliedresearch allows us all to learn, increase the quality of what we do,and enhance value to the client.
Finally, I would encourage collaboration in this applied researchprocess. This journal is a collaboration between CIBSE Ireland andDIT. Similarly, companies might join with academic institutions toproduce good quality research of their own. My experience isthat working professionals in companies tend to be time poorand data rich, whereas post-graduate students are time rich anddata poor. This offers excellent opportunities for both parties tobenefit, as well as industry generally, when the findings aredisseminated.
The opening paper by Keohane & Leonard of PM Groupwas the winner of the 2011 CIBSE Ireland SDAR* Award. This isan interesting analysis and shows how a groundwater heat pumpand a novelVAV underfloormechanicalventilationsystem installedin the WesternGatewaybuilding ofUniversityCollege Corkcan use lowerenergyconsumptionthan traditionalheating andcoolingsystems. This isa case study evaluation of an innovative approach to theintegration of three technologies in a university building.
The second paper by Tooth, Burke and Saul of J V Tierney was a runner-up in the SDAR* Awards 2011. This paper examinescomputer-simulated energy targets against actual energy
consumption forthe new CriminalCourts of Justicebuilding in Dublin.It also evaluates the benefits ofengineeringsolutions such astwin-skin facadesand heat recovery.Interestingly, theauthors found thatactual energy usedis about 25% lessthan that predictedby the software.They conclude
this is due to occupancy levels and fluctuations that are notpredicted by the software. They considered their evaluation a sanity check and proposed that energy usage profiles begenerated. Their applied research also underpinned existingknowledge of the benefit of twin-skin facades and energyrecovery systems.
CIBSE Sustainable Awards 2011
2
Kevin T. KellyHead of DepartmentElectrical Services EngineeringSchool of Electrical Engineering SystemsDublin Institute of Technology
SDAR Intro pages:Layout 1 14/09/2011 12:30 Page 2
3
A Reader’s Gude
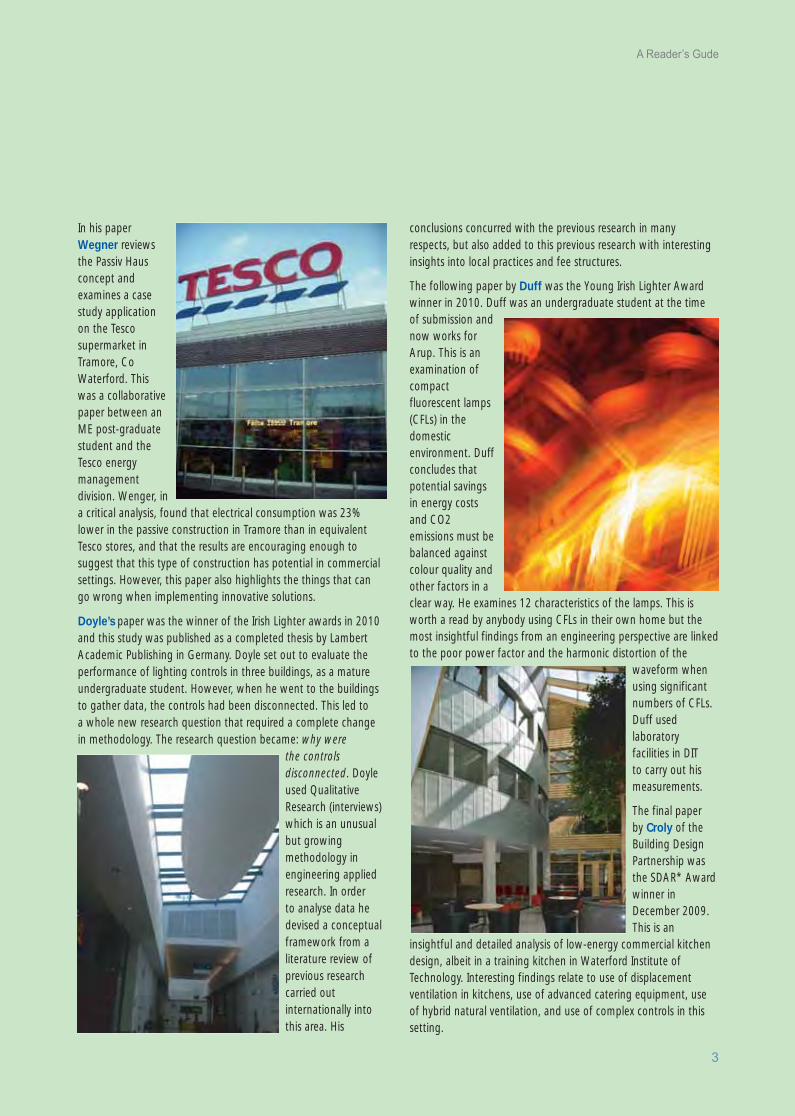
In his paperWegner reviewsthe Passiv Hausconcept andexamines a casestudy applicationon the Tescosupermarket inTramore, CoWaterford. Thiswas a collaborativepaper between anME post-graduatestudent and theTesco energymanagementdivision. Wenger, ina critical analysis, found that electrical consumption was 23%lower in the passive construction in Tramore than in equivalentTesco stores, and that the results are encouraging enough tosuggest that this type of construction has potential in commercialsettings. However, this paper also highlights the things that can go wrong when implementing innovative solutions.
Doyle’s paper was the winner of the Irish Lighter awards in 2010and this study was published as a completed thesis by LambertAcademic Publishing in Germany. Doyle set out to evaluate theperformance of lighting controls in three buildings, as a matureundergraduate student. However, when he went to the buildingsto gather data, the controls had been disconnected. This led to a whole new research question that required a complete changein methodology. The research question became: why were
the controlsdisconnected. Doyleused QualitativeResearch (interviews)which is an unusualbut growingmethodology inengineering appliedresearch. In order to analyse data hedevised a conceptualframework from aliterature review ofprevious researchcarried outinternationally intothis area. His
conclusions concurred with the previous research in manyrespects, but also added to this previous research with interestinginsights into local practices and fee structures.
The following paper by Duff was the Young Irish Lighter Awardwinner in 2010. Duff was an undergraduate student at the time of submission andnow works forArup. This is anexamination ofcompactfluorescent lamps(CFLs) in thedomesticenvironment. Duffconcludes thatpotential savingsin energy costsand CO2emissions must bebalanced againstcolour quality andother factors in aclear way. He examines 12 characteristics of the lamps. This isworth a read by anybody using CFLs in their own home but themost insightful findings from an engineering perspective are linkedto the poor power factor and the harmonic distortion of the
waveform whenusing significantnumbers of CFLs.Duff usedlaboratoryfacilities in DIT to carry out hismeasurements.
The final paper by Croly of theBuilding DesignPartnership wasthe SDAR* Awardwinner inDecember 2009.This is an
insightful and detailed analysis of low-energy commercial kitchendesign, albeit in a training kitchen in Waterford Institute ofTechnology. Interesting findings relate to use of displacementventilation in kitchens, use of advanced catering equipment, useof hybrid natural ventilation, and use of complex controls in thissetting.
SDAR Intro pages:Layout 1 09/09/2011 14:42 Page 3

Engineering a sustainablebuilt environment
CIBSE is the professional body that exists to
“support the science, art and practice of building
services engineering, by providing our members
and the public with first class information and
education services and promoting the spirit of
fellowship which guides our work.”
CIBSE promotes the career of building services
engineers by accrediting courses of study in
further and higher education. It also approves
work-based training programmes and provides
routes to full professional registration and
membership, including Chartered Engineer,
Incorporated Engineer and Engineering
Technician. Once you are qualified, CIBSE
offers you a range of services, all focussed on
maintaining and enhancing professional
excellence throughout your career.
CIBSE members in Ireland are represented by
an active Regional Committee who are involved
in organising CPD events, technical evenings,
training courses, social events and an annual
conference. The committee welcomes new
members, suggestions, and collaborations with
other institutions in the built environment.
The Chartered Institution of Building
Services Engineers
in Ireland
Email: [email protected]
Web: www.cibseireland.org
Providing best practice advice
4
CIBSE Sustainable Awards 2011
SDAR Intro pages:Layout 1 09/09/2011 14:42 Page 4
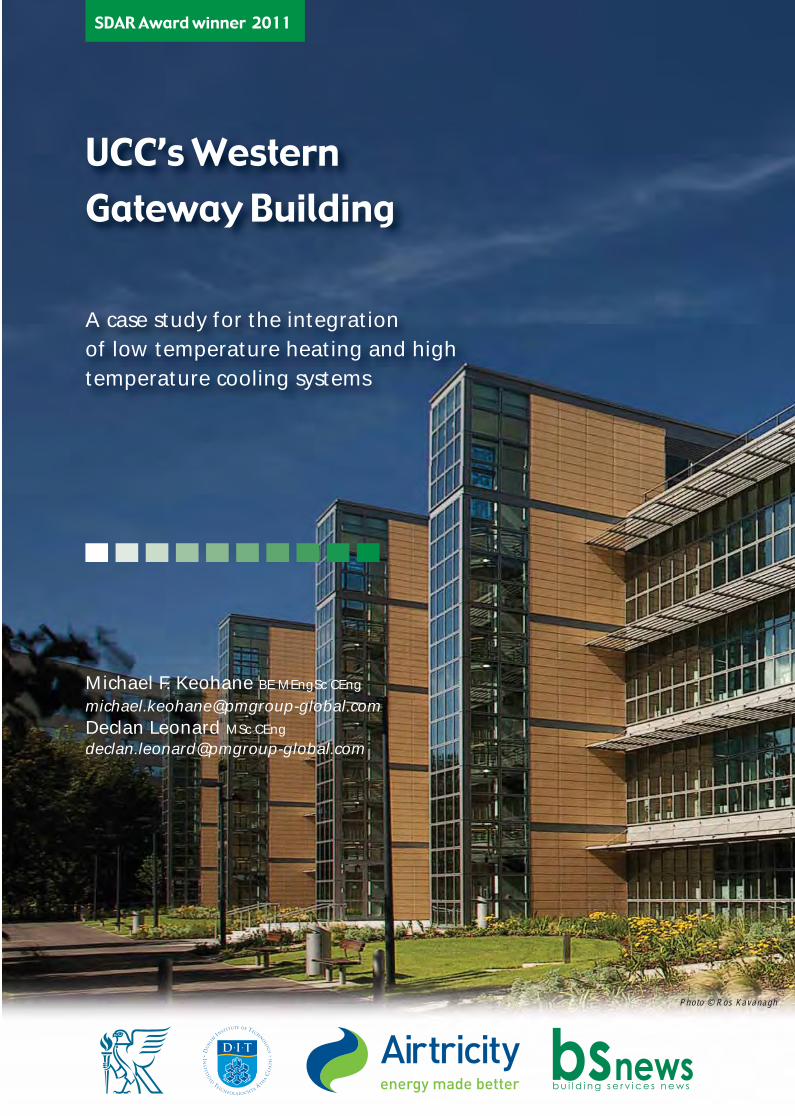
UCC’s Western Gateway Building
A case study for the integration of low temperature heating and hightemperature cooling systems
Michael F. Keohane BE MEngSc CEng
[email protected] Leonard MSc CEng
SDAR Award winner 2011
Photo © Ros Kavanagh
UCC Gateway Building:Layout 1 09/09/2011 16:23 Page 5

Abstract
This paper deals with the installation of a 1 MW
groundwater heat pump for cooling and heating, a
server room heat recovery system and a novel VAV
underfloor mechanical ventilation system, in a large
third level university building in Cork, Ireland. After
describing the building and the mechanical systems
the paper presents energy usage and analysis of
results for the first year in operation. Such an
installation is of interest to engineers and facility
managers in order to determine how all the systems
complement each other, as well as the resultant
energy saving potential compared to conventional
systems. Large scale groundwater heat pumps with
simultaneous heating and cooling capabilities can
provide significant operational cost savings, as
described in the paper.
Key Words:
VAV Underfloor Mechanical Ventilation, Demand
Control Ventilation, Groundwater Heat Pump,
Simultaneous Heating and Cooling, and Server
Room Heat Recovery.
1. IntroductionIn the Cork area a number of a small and medium scalegroundwater heat pumps have been installed which use ground-water from the Lee Buried Ribbon Valley for space heating andcooling of buildings. Installations of the scale 1 MW have notpreviously been attempted.
The presence of a simultaneous heating and cooling load within abuilding significantly enhances the economic and environmentalargument for the installation of heat pumps.
Water-cooled technology for server rooms is now becomingestablished for high heat gain racks (>15kW). This newdevelopment provides an opportunity for high temperature chilledwater cooling and significant heat recovery potential using heatpump systems.
The use of underfloor mechanical ventilation systems has becomepopular in large university buildings where natural ventilation is notsuitable.
This paper outlines an innovative approach to the successfulintegration of all three technologies in the one building. The objectiveof this installation was to reduce significantly the energy costs andcarbon emissions associated with running large third level buildings.
1.1 Project background
University College Cork’s (UCC) Western Gateway Building (WGB) is the largest building on the UCC Complex at 25,000m²(269,100ft²) providing research and teaching accommodation fora range of academic departments such as Computer Science,Biochemistry, Mathematics, Pharmacology, Physiology, ICT andCancer Research.
Master-planning for the site located on the western edge of thecampus (on the old greyhound track on Western Road) by ScottTallon Walker Architects began in 1999. After a series of delays,contract work commenced on the project in September 2006.
The first three floors (16,000m²) of the five storey structure werecompleted in June 2009. Major flooding of the River Lee downstream of Inniscarra at the end of 2009 interrupted buildingoperations until June 2010. Fit out of the shell and core top twofloors commenced in early 2011.
2. Building description The 5-storey reinforced concrete above ground building (plusbasement for M&E plantrooms) is situated on the banks of the RiverLee and is aligned on a southwest/northeast axis. The area south ofthe courtyards is a 4-storey cellular/open plan office block, whichprovides staff accommodation and research space. Areas with highinternal heat gains including the main teaching areas, computerand research labs, cafeterias and toilet blocks are located to thenorth of the building surrounding the main atrium which runs the
CIBSE Sustainable Awards 2011
6
UCC Gateway Building:Layout 1 09/09/2011 16:23 Page 6

full length of the building. Full height glazing (overall U-value 1.84 W/m2k, shading coefficient 0.43, light transmission 67%)dominates the southern and northern facades accounting for 60%of the exposed wall surface area. The main atrium roof light has thesame specification and accounts for 9.5% of the total roof area.
Building element U values, which were specified pre-2006 BuildingRegulations are 0.25 W/m2k for roof and external walls with 0.16W/m2k for the ground floor.
3. Passive design features The building is designed with a number of passive design featuresincluding:
• Building orientation is southeast facing to capture morning sunshine for solar heating and to provide shading against evening sun.
• High heat gain areas are placed to the north of the building to avoid solar gains.
• There are no occupied spaces with eastern and western facades, eliminating low angle sun issues and consequent glare.
• The atrium and courtyards are used to bring light into the core of the building.
• Air tight construction with an actual test of 4.4 m3/hr per m2
@ 50pa.
• Use of thermal mass in the form of exposed concrete soffits for over 90% of the ceiling area.
• Natural ventilation is utilised in areas (33% of existing floor plan) with low heat gain as per UCC policy. Night cooling occurs via automated vents.
• The naturally lit 100-metre long atrium concourse accommodates day-lighting, acts as a common return air path, and solar collector for heat recovery.
• Horizontal Brise Soleil is used on the southern facade to mitigate peak summer solar gains.
• 43m2 of evacuated tube solar water heating panels in conjunction with gas fired condensing instantaneous stand-alone water heater for DHW.
UCC’s Western Gateway Building
7
Fig. 2: Photo collage of building externals and atrium
Fig. 1: Section through WGB from left to right – southern cellular and open plan offices, courtyard, classrooms and labs and main atrium
UCC Gateway Building:Layout 1 09/09/2011 16:23 Page 7

• Localised manual light switching and PIR sensor for occupancydetection (lights off 30 minutes after last occupant).
• Photocells to allow daylight harvesting by continuous lux level dimming to preset levels (350 lux for offices, 500 lux for computer class rooms, 150 lux for the atrium).
4. Ventilaion systems
4.1 Mechanical ventilation description
The mechanical ventilation systems have the following energyefficient properties:
• Underfloor mechanical ventilation is used for areas with highinternal heat gains in which spaces (classrooms, computer labs,lecture theatres, wet labs and research areas) are supplied bypressurised plenum and swirl diffusers (300mm raised access floor) with a minimum supply air temperature of 16°C (Fig 3).
• Displacement ventilation in which auditoria spaces are supplied by pressurised plenum with a minimum supply air temperatureof 18°C.
• 100% fresh air supply with pressure independent VAV systemthat operates on the dual maximum setpoint principle (see Fig. 4), demand based static pressure reset, and supply air temperature reset.
• Widened dead bands between cooling and heating setpoints of 2°C.
• Demand Control Ventilation (DCV) based on CO2 sensing(1,000-ppm setpoint).
• Occupancy detection allowing VAV air supply shutoff for allrooms. If the room is within +/- 3°C of the base setpoint theVAV box closes fully. Should the room go outside theseparameters the VAV box and reheat will re-activate to bring theroom to within +/- 2°C of the base setpoint.
• Each air handling unit (AHU) has an Enthalpy wheel for sensible and latent heat recovery (70% efficient). There is no active humidity control in the building.
• The majority of the spaces (14 of 18 AHUs) utilises the mainatrium as a common return air path. Exhaust air is exfiltratedfrom the rooms at high level to the atrium or corridors, which are linked to the atrium. AHU return air is collected from the top of the atrium.
• When heat recovery is not required (Tex>17°C) the AHU return fans are disabled, and air from the spaces is exhausted throughthe atrium rooflight windows.
• At night the atrium rooflight and gable end windows providenight cooling to vent heat from the building.
• Typical AHUs contain direct drive centrifugal plenum fans withVSDs, an enthalpy wheel and no heating coil. The enthalpywheel provides frost protection and reheats provide all required
CIBSE Sustainable Awards 2011
8
Fig. 3: Underfloor mechanical ventilation schematic for three-storey design,(Keohane 2005)
Fig. 4: Dual maximum with VAV heating – valve and airflow together (Pacificand Gas 2007)
Fig. 5: If heat recovery is not required the AHU return fans are disabled, andair is exhausted through atrium rooflights
Fig. 6: Occupancy detection in green areas, no occupancy in grey areas whereVAV air supply is disabled
UCC Gateway Building:Layout 1 09/09/2011 16:23 Page 8
UCC’s Western Gateway Building
9
heating for spaces. Cooling coils are provided for summer comfort cooling (sized for operation with 13°C chilled water (CHW).
• Postgraduate research areas have VAV fume hoods with PIRautomated sash control. Undergraduate teaching areas have constant volume fume hoods.
• Mixed airflow strobic extract fans are used for fume dilution,and to create the required exhaust stack heights of 14m.
• Kitchen and restaurant, toilets (constant volume) and post-graduate research areas employ traditional VAV overhead mixed air distribution.
4.2 Data analysis
Table 1 indicates the recorded BMS data for the ventilation electricalenergy. Typically two AHUs plus miscellaneous extract fans arewired through a single motor control centre (MCC) panel (withenergy pulse meter). Ten such MCC panels are connected toseparately energy-metered north and south plantroom powersupply panels (five each).
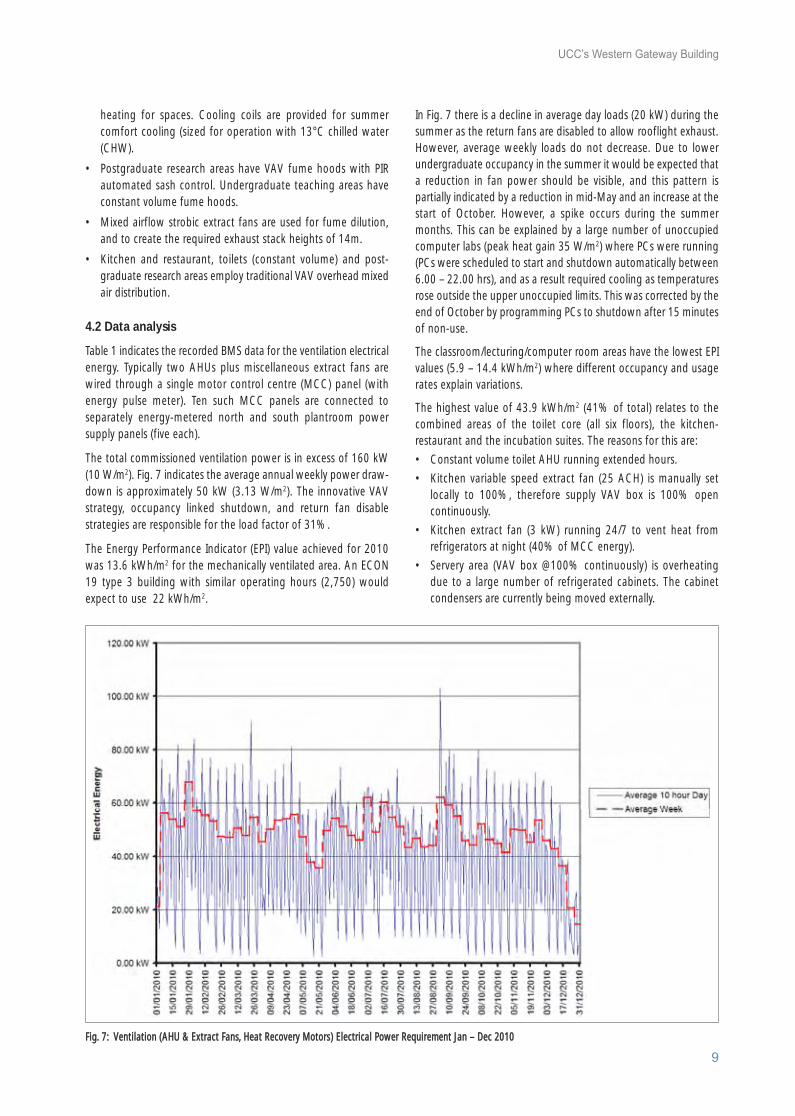
The total commissioned ventilation power is in excess of 160 kW(10 W/m2). Fig. 7 indicates the average annual weekly power draw-down is approximately 50 kW (3.13 W/m2). The innovative VAVstrategy, occupancy linked shutdown, and return fan disablestrategies are responsible for the load factor of 31%.
The Energy Performance Indicator (EPI) value achieved for 2010was 13.6 kWh/m2 for the mechanically ventilated area. An ECON19 type 3 building with similar operating hours (2,750) wouldexpect to use 22 kWh/m2.
In Fig. 7 there is a decline in average day loads (20 kW) during thesummer as the return fans are disabled to allow rooflight exhaust.However, average weekly loads do not decrease. Due to lowerundergraduate occupancy in the summer it would be expected thata reduction in fan power should be visible, and this pattern ispartially indicated by a reduction in mid-May and an increase at thestart of October. However, a spike occurs during the summermonths. This can be explained by a large number of unoccupiedcomputer labs (peak heat gain 35 W/m2) where PCs were running(PCs were scheduled to start and shutdown automatically between6.00 – 22.00 hrs), and as a result required cooling as temperaturesrose outside the upper unoccupied limits. This was corrected by theend of October by programming PCs to shutdown after 15 minutesof non-use.
The classroom/lecturing/computer room areas have the lowest EPIvalues (5.9 – 14.4 kWh/m2) where different occupancy and usagerates explain variations.
The highest value of 43.9 kWh/m2 (41% of total) relates to thecombined areas of the toilet core (all six floors), the kitchen-restaurant and the incubation suites. The reasons for this are:
• Constant volume toilet AHU running extended hours.
• Kitchen variable speed extract fan (25 ACH) is manually setlocally to 100%, therefore supply VAV box is 100% opencontinuously.
• Kitchen extract fan (3 kW) running 24/7 to vent heat fromrefrigerators at night (40% of MCC energy).
• Servery area (VAV box @100% continuously) is overheating due to a large number of refrigerated cabinets. The cabinetcondensers are currently being moved externally.
Fig. 7: Ventilation (AHU & Extract Fans, Heat Recovery Motors) Electrical Power Requirement Jan – Dec 2010
UCC Gateway Building:Layout 1 09/09/2011 16:23 Page 9

CIBSE Sustainable Awards 2011
10
Table I: BMS ventilation energy data
Space Description AHU Commissioned1 Jan – Dec 2010 Area Annual EPINorth of AtriumMCC Panels3 52,995 kWh 5,044 m² 10.5 kWh/m2
AHU 0101 Comp Labs, Lecturing, Offices SFP 1.9 kW/m3/s, 632 m²6.6 l/s/m²
AHU 0102 Recording Studio, Lecturing, SFP 1.9 kW/m3s, 639 m²Comp Labs, Offices 6.0 l/s/m²
AHU 0201 Comp Labs, Lecturing, Offices SFP 1.5 kW/m3/s, 632 m²6.6 l/s/m²
AHU 0202 Comp Labs, Lecturing, Offices SFP 1.5 kW/m3/s, 651 m²5.1 l/s/m²
AHU 0801 Main 300 seat Auditorium SFP 2.0 kW/m3/s, 328 m²11.9 l/s/m²
AHU 0802 Auditorium, Lecturing, Offices, SFP 2.0 kW/m3/s, 619 m²Server Room 6.5 l/s/m²
AHU 0501 Lecturing, Undergraduate Wet Labs SFP 2.2 kW/m3/s, 630 m²7.5 l/s/m²
AHU 0502 Lecturing, Undergraduate Wet Labs, SFP 2.0 kW/m3/s, 591 m²Research Lab 7.6 l/s/m²
Fume hood Extract 5 Under Graduate Fume Hoods 2 X 7.5kW Extract Fans 8,295 kWh 573 m² 14.5 kWh/m2
South of Atrium MCC Panels3 96,380 kWh 5,905 m² 16.3 kWh/m2
AHU 0301 Comp Labs, Research Office SFP 1.6 kW/m3/s, 658 m²5.9 l/s/m²
AHU 0302 Comp Labs, Research Office SFP 1.7 kW/m3/s, 597 m²6.5 l/s/m²
AHU 0303 Cancer Research and 4 Fume hoods, SFP N/A kW/m3/s, 4,000 kWh2 383 m² 10.4 kWh/m2
2 Extract Fans4 N/A l/s/m²
AHU 0401 Comp Labs, Research Office SFP 1.7 kW/m3/s, 660 m²5.4 l/s/m²
AHU 0402 Comp Labs, Research Office SFP 1.6 kW/m3/s, 600 m²6.3 l/s/m²
AHU 0701 Toilet Core all 6 floors SFP 2.6 kW/m3/s, 473 m²8.2 l/s/m²
AHU 0901 Incubation Suites SFP 1.8 kW/m3/s, 591 m²6.0 l/s/m²
AHU 1101 Kitchen and Restaurant SFP 5.4 kW/m3/s, 339 m²10.9 l/s/m²
AHU 0601 Comp Labs, Undergraduate Wet Labs SFP 1.4 kW/m3/s, 795 m²6.0 l/s/m²
AHU 0602 Comp Labs, Undergraduate Wet Labs, SFP 1.9 kW/m3/s, 485 m²7.6 l/s/m²
Mechanical Ventilation Total 149,376 kWh 10,949 m² 13.6 kWh/m2
Natural Ventilation Open Plan Offices, Cellular Offices, 0,000 kWh 5,051 m² 0 kWh/m2
Stairwells, Atrium
Building Total 149,376 kWh 16,000m² 9.4 kWh/m2
1 AHU Commissioned Figures for 100% Design flow, flow rate per m2 is an average of all spaces served
2 BMS Meter not functioning, figures are estimates based on size and the overall North or South MCC reading
3 The area totals for MCC North and South include 648m2 of corridor space split evenly for each panel.
4 AHU and Fume hood Extract Sized for additional floor (766 m2)
15,837 kWh 12.4 kWh/m2
8,180 kWh 6.4 kWh/m2
13,629 kWh 14.4 kWh/m2
7,471 kWh2 6.0 kWh/m2
7,471 kWh2 5.9 kWh/m2
61,602 kWh 43.9 kWh/m2
8,482 kWh 6.9 kWh/m2
14,410 kWh 11.3 kWh/m2
UCC Gateway Building:Layout 1 09/09/2011 16:23 Page 10

• High SPFs for the toilets and kitchen-restaurant AHU.
• Higher airflows for kitchen-restaurant AHU as a result of higher CHW temperatures designed for the underfloor AHUs.
4.3 Conclusions and lessons learned
While the overall fan power energy improves upon ECON by 38%, there are still a number of notable lessons. The commissioningof the AHUs aimed to achieve the design SFPs of 2.0 kW/m3/s orlower, however this was only achieved by 14 of the units (overallaverage 1.9 kW/m3/s). A number of units achieved 1.5 kW/m3/s.
The reasons for higher than expected SFPs include:
• Issues with leaking floor plenums. Only representative sampleareas were tested, all floor plenums should be tested on projects using pressurised plenums. Complex detailing is required to insure integrity.
• High-pressure drop associated with acoustic transfer devices allowing air to return to the atrium.
• End of line VAV boxes on the ground floor with large flow ratesrequired significantly higher than expected static pressure to maintain control. Duct static pressure reset to 350 Pa was required for a 100% demand, even though the rest of the system was operating at low volumes. Where possible situate rooms with large airflow requirements as near to the supply fan as possible.
Other notable lessons learned include:
• Close VAV boxes for spaces experiencing the prolonged periodsof inactivity.
• The absence of a heating coil in the AHUs has resulted in supply air temperatures lower than 16°C in extreme weather (-7°C) with the consequence of draught complaints.
• Higher chilled water temperatures may not reduce energyconsumption for traditional VAV overhead mixed air distributionsystems as fan energy is increased.
• A significant commissioning effort was required to get thesystem operating as per the design intent.
The use of 100% fresh air VAV underfloor mechanical ventilationin conjunction with DCV for areas with high occupant density heatgains in this project has demonstrated the following benefits:
• Significantly lower ventilation energy consumption comparedto traditional VAV mixed air distribution systems.
• Allows the use of heat recovery, which will significantly reducethermal energy use compared to natural ventilation solutions,while achieving high indoor air quality (IAQ) with 100% freshair supply.
• Occupancy detection combined with temperature setback androom airflow disable in large buildings with variable occupancyis a very effective measure.
• Disabling AHU return fans when heat recovery is not required is recommended, where alternative passive exhaust routes exist.
• Thermal wheels for frost protection instead of traditional frostcoils are effective.
• Free-cooling is available for large portions of the year, and thesystem can be integrated with groundwater cooling sources.
UCC’s Western Gateway Building
11
Fig. 8: BMS snapshot – South MCC combined ventilation (AHUs and extract fans, heat recovery motors) electrical power, Dec 2010
UCC Gateway Building:Layout 1 09/09/2011 16:23 Page 11
5. Ground water heat pump and server room heat recovery
5.1 Lee Buried Valley ribbon aquifer
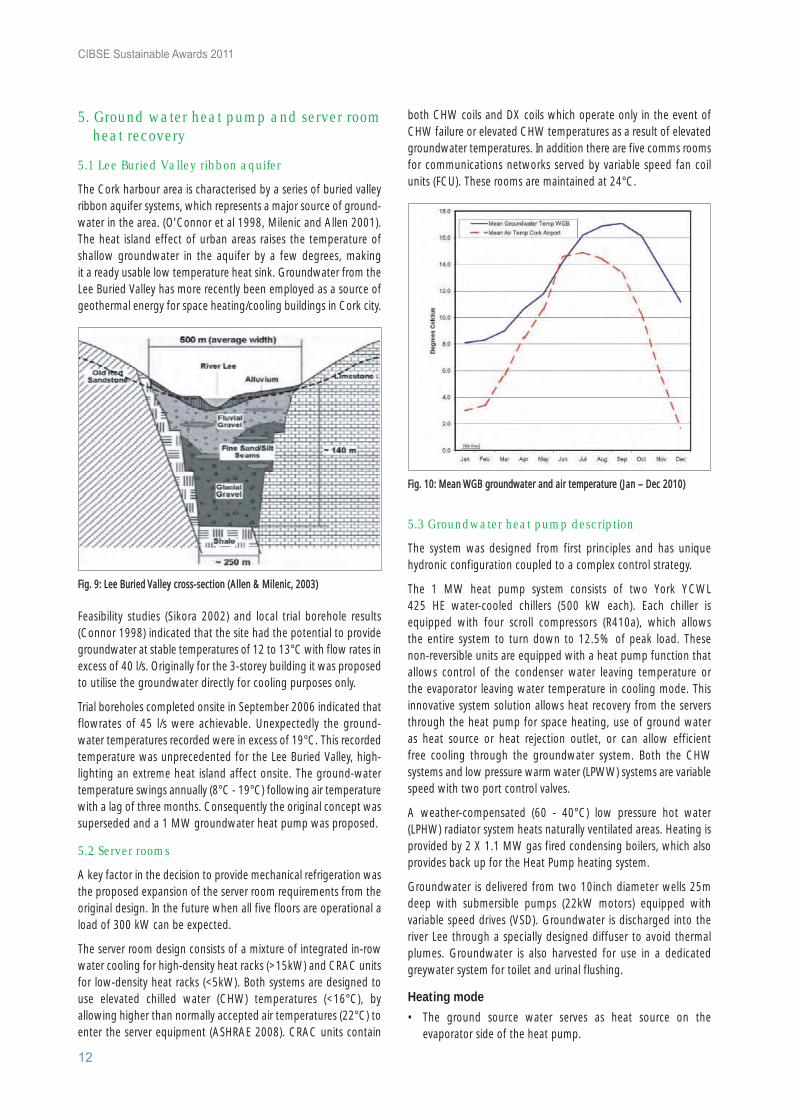
The Cork harbour area is characterised by a series of buried valleyribbon aquifer systems, which represents a major source of ground-water in the area. (O’Connor et al 1998, Milenic and Allen 2001).The heat island effect of urban areas raises the temperature ofshallow groundwater in the aquifer by a few degrees, making it a ready usable low temperature heat sink. Groundwater from theLee Buried Valley has more recently been employed as a source ofgeothermal energy for space heating/cooling buildings in Cork city.
Feasibility studies (Sikora 2002) and local trial borehole results(Connor 1998) indicated that the site had the potential to providegroundwater at stable temperatures of 12 to 13°C with flow rates inexcess of 40 l/s. Originally for the 3-storey building it was proposedto utilise the groundwater directly for cooling purposes only.
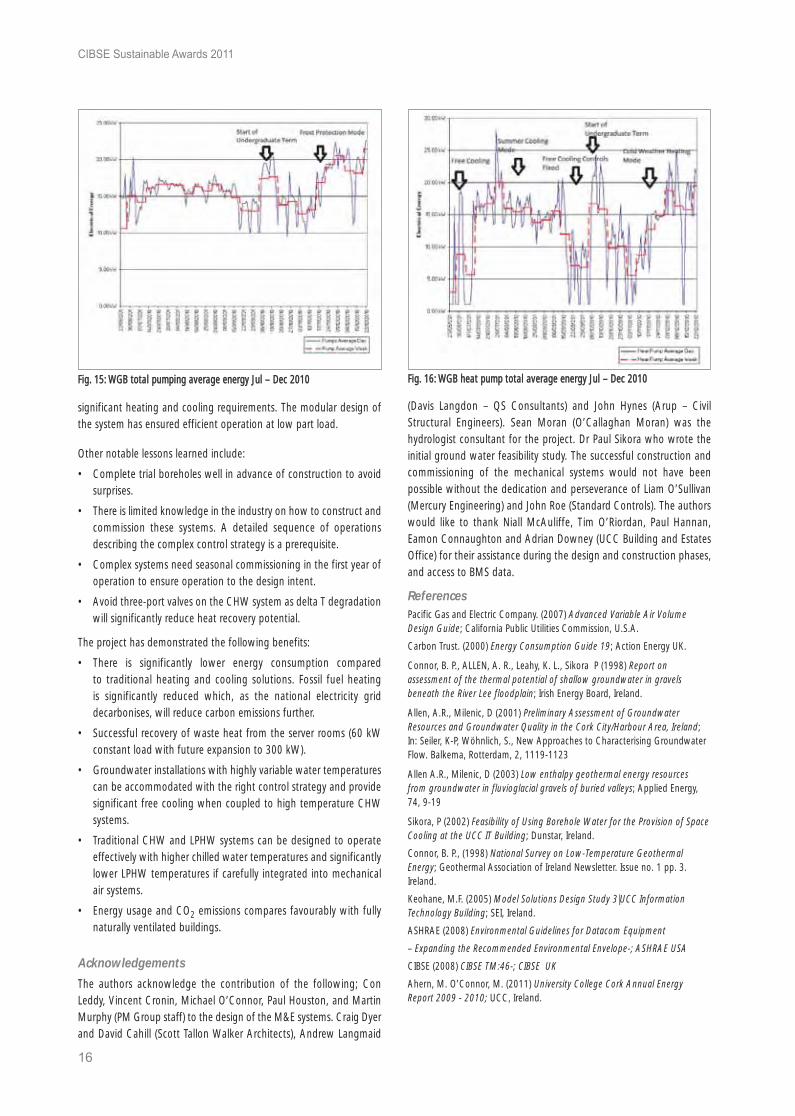
Trial boreholes completed onsite in September 2006 indicated thatflowrates of 45 l/s were achievable. Unexpectedly the ground-water temperatures recorded were in excess of 19°C. This recordedtemperature was unprecedented for the Lee Buried Valley, high -lighting an extreme heat island affect onsite. The ground-watertemperature swings annually (8°C - 19°C) following air temperaturewith a lag of three months. Consequently the original concept wassuperseded and a 1 MW groundwater heat pump was proposed.
5.2 Server rooms
A key factor in the decision to provide mechanical refrigeration wasthe proposed expansion of the server room requirements from theoriginal design. In the future when all five floors are operational aload of 300 kW can be expected.
The server room design consists of a mixture of integrated in-rowwater cooling for high-density heat racks (>15kW) and CRAC unitsfor low-density heat racks (<5kW). Both systems are designed touse elevated chilled water (CHW) temperatures (<16°C), byallowing higher than normally accepted air temperatures (22°C) toenter the server equipment (ASHRAE 2008). CRAC units contain
both CHW coils and DX coils which operate only in the event ofCHW failure or elevated CHW temperatures as a result of elevatedgroundwater temperatures. In addition there are five comms roomsfor communications networks served by variable speed fan coilunits (FCU). These rooms are maintained at 24°C.
5.3 Groundwater heat pump description
The system was designed from first principles and has uniquehydronic configuration coupled to a complex control strategy.
The 1 MW heat pump system consists of two York YCWL 425 HE water-cooled chillers (500 kW each). Each chiller isequipped with four scroll compressors (R410a), which allows the entire system to turn down to 12.5% of peak load. These non-reversible units are equipped with a heat pump function thatallows control of the condenser water leaving temperature or the evaporator leaving water temperature in cooling mode. Thisinnovative system solution allows heat recovery from the serversthrough the heat pump for space heating, use of ground water as heat source or heat rejection outlet, or can allow efficient free cooling through the groundwater system. Both the CHWsystems and low pressure warm water (LPWW) systems are variablespeed with two port control valves.
A weather-compensated (60 - 40°C) low pressure hot water(LPHW) radiator system heats naturally ventilated areas. Heating isprovided by 2 X 1.1 MW gas fired condensing boilers, which alsoprovides back up for the Heat Pump heating system.
Groundwater is delivered from two 10inch diameter wells 25mdeep with submersible pumps (22kW motors) equipped withvariable speed drives (VSD). Groundwater is discharged into theriver Lee through a specially designed diffuser to avoid thermalplumes. Groundwater is also harvested for use in a dedicatedgreywater system for toilet and urinal flushing.
Heating mode
• The ground source water serves as heat source on theevaporator side of the heat pump.
CIBSE Sustainable Awards 2011
12
Fig. 9: Lee Buried Valley cross-section (Allen & Milenic, 2003)
Fig. 10: Mean WGB groundwater and air temperature (Jan – Dec 2010)
UCC Gateway Building:Layout 1 14/09/2011 12:50 Page 12

• The heat pump raises the medium temperature groundwater (8 –19°C) heat source to a temperature level usable for thebuilding (40 – 30°C LPWW).
• The LPWW system consists of AHU heating coils, reheatbatteries, and FCU heating coils.
• The theoretical COP of the heat pump ranges between 5.1 –
7.7 in heating mode depending on LPWW supply temperatures(weather compensated) and CHW return temperatures, whichare groundwater temperature dependent.
Free cooling mode
• Free cooling directly from the ground water without recourseto mechanical refrigeration is possible for large portions of theyear.
• This is beneficial for server room cooling with COPs rangingbetween 10 - 20.
• The ground water provides chilled water in the range of 9 –18°C depending on the time of year. During normal scheduledhours (NSH – typically 8.30 – 21.30 Mon - Fri) the CHWtemperature is restricted to a maximum of 13°C for cooling ofAHU coils and fan coils. Outside of NSH the CHW temperatureis allowed to rise to 18°C to derive the maximum benefit ofground water cooling for the 24/7-server room load.
Cooling mode
• The ground source water serves as a cooling source by providingheat rejection on the condenser side of the heat pump.
• If no heating is required heat pump condenser inlet watertemperatures are controlled in a range of 18 -22°C, dependingon groundwater temperatures.
• The heat pump provides chilled water at 12°C when ground-water temperatures are too high during or outside NSH.
• The theoretical heat pump COP exceeds 7.5 in cooling modefor these conditions.
Simultaneous heating and cooling
• Can occur in heating or cooling mode.
• For dominant cooling loads the condenser water heat rejectionis used by LPWW system (at required setpoint), and any excess heat is rejected to the ground water.
• For dominant heating loads, heat rejected to the CHW systemby the server room and other sources provides the low temperature heat sink for the heat pump to produce upgraded heat for the LPWW system. If this is insufficient then the groundwater system will provide the required elevated CHW temperatures.
• COPs in excess of 10 are theoretically possible.
5.4 Data analysis
Due to the flood reinstatement works there are only six months (Jul – Dec 2010) operational energy data available. These figureshave been extrapolated to provide estimated annual figures for 2010.
In Table 2 the MCC B9 (pumps) figures represent all primary andsecondary pumps for the building, including groundwater pumps.The heat pump EPI of 7.14 kWh/m2 is for the entire building areabut distributed across only the conditioned areas served wouldincrease to 10.4 kWh/m2. This is the combined energy requirementfor heating and cooling for areas of 10,979m2, which illustrates the
UCC’s Western Gateway Building
13
Fig. 11: Ground source heat pump modes of operation
UCC Gateway Building:Layout 1 14/09/2011 12:54 Page 13

effectiveness of the simultaneous heating and cooling heat pump.To put the above figure in perspective, if the server room load of 60kW were to be cooled by an air-cooled chiller with a seasonal COPof 3, the expected EPI would be 16.3 kWh/m2 (area conditioned byheat pump)..
Total mechanical electrical loads (including fans, pumps and heatpump) represents an EPI of 29.5 kWh/m2 which accounts for21.5% of the buildings total for the year.
In Table 3 the natural gas total includes LPHW boiler energy, labgas usage and domestic hot water production by the stand alonegas fired heater.
A standard university building would be expected to achieve EPIs of96.1 kWh/m2 (electric) and 301.9 kWh/m2 (fossil fuels) (CIBSE 2008)for similar operating hours. This represents a 59% reduction inenergy use and a 30% reduction in CO2 emissions (fig. 13). Thebuilding also compares favourably against Naturally VentilatedOffice benchmarks indicated in ECON 19. Compared to the UCCaverage building stock for 09/10, the building represents a 47%improvement in energy usage and a 33% reduction in CO2 emissions.
The server room constant electrical load is currently 60kW whichrepresents 25% of the building total for the year. The server roomis currently well under capacity compared to the original design,however, there are plans for significant further expansion in thenext phase.
CIBSE Sustainable Awards 2011
14
Table 2: WGB heat pump heating and cooling electrical energy
July – December Projected Annual Projected Annual Electrical Energy Electrical Energy EPI
MCC B9 (Pumps) 70,106 kWh 140,211 kWh 8.76 kWh/m2
Heat Pump 1 26,554 kWh 53,109 kWh 3.32 kWh/m2
Heat Pump 2 30,572 kWh 61,145 kWh 3.82 kWh/m2
Total Heat Pump 57,127 kWh 114,254 kWh 7.14 kWh/m2
Table 3: WGB building annual energy
July – December Projected Annual Projected Annual Electrical Energy Electrical Energy EPI
Building Total 1,098,940 kWh 2,197,880 kWh 137.4 kWh/m2
Server Room 262,800 kWh 525,600 kWh 33.9 kWh/m2
Natural Gas 203,105 kWh 406,211 kWh 25.4 kWh/m2
Fig. 12: Simplified ground source heat pump schematic
UCC Gateway Building:Layout 1 09/09/2011 16:23 Page 14

In free cooling mode the submersible well VSD is currentlyoperating at a minimum speed of 31 Hz (5.3 kW) which representsa cooling load of 300 kW (pump increases speed to maintainsupply/exhaust temperature differentials). For free cooling of the server room at night the COP is currently above 10. As thecooling load increases in the future with the additional fit out, or during the summer months (largest recorded cooling currently is 330 kW), the COP of the free cooling mode will increasesignificantly.
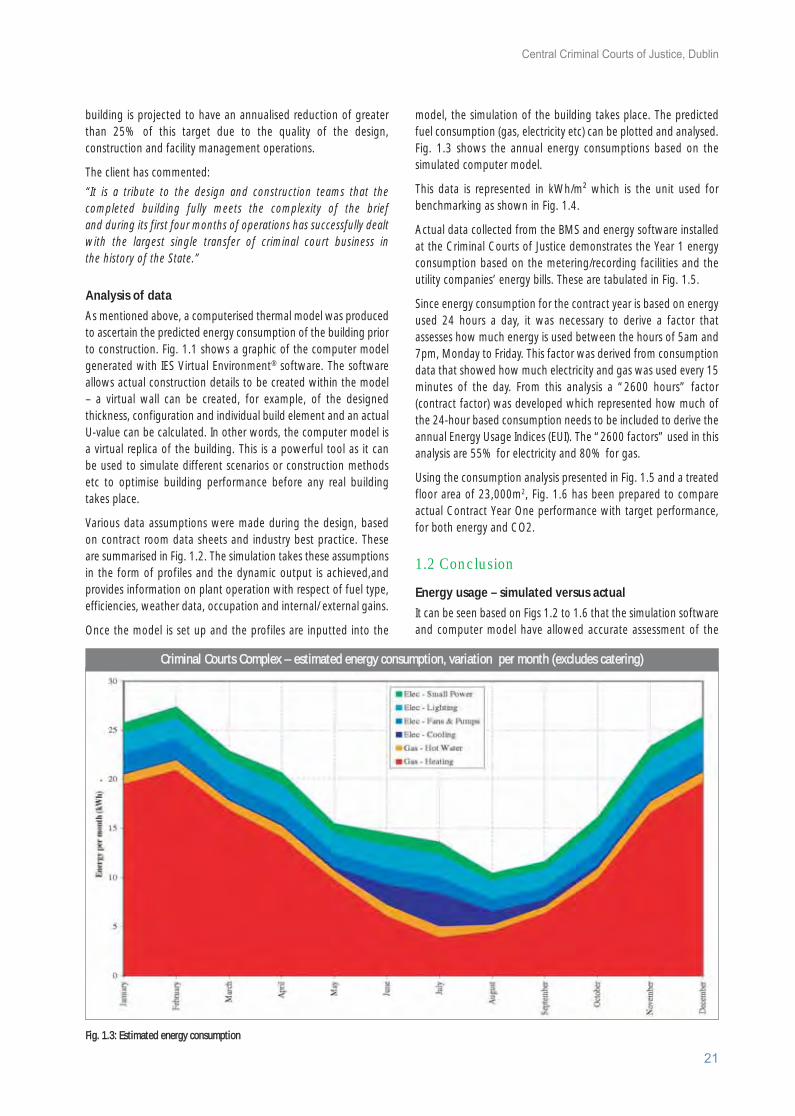
Due to technical errors the energy meters recording cooling andheating demands for the building have not been recording datauntil December. As a result it is not possible to comment on theseasonal efficiency of the heat pump. A number of figures (14, 15,and 16) have been prepared to indicate the behaviour of the heat
pump operation. During the summer an issue with the controls was preventing free cooling of the server room at night, meaningthe heat pump was in cooling mode 24/7. This was rectified inSeptember.
5.5 Conclusions and lessons learned
The analysis of the results indicates that the system is operatingextremely efficiently with an annual combined EPI for cooling andheating of 10.4 kWh/m2. This EPI is likely to improve as the building fitout is completed over the next two years.
Currently the system is significantly oversized as the heating andcooling loads (server room) predicted for the three storey building havenot materialised. However, the additional two floors will have
UCC’s Western Gateway Building
15
Fig. 14: WGB BMS snapshot – heat pump electrical power Dec 2010
Annual kWh/m2/y Benchmark Comparison
0.0
50.0
100.0
150.0
200.0
250.0
300.0
350.0
400.0
450.0
Typical Good Practice Typical Average 09/10 WGB 2010 Actual Energy
Use (Metered or Billed)
CIBSE TM:46 University
Campus
ECON 19 Type 2 Naturally Ventilated UCC
Total Electricity
Total fossil fuel(thermal)
Annual kg CO2/m2/y Benchmark Comparison
0.0
20.0
40.0
60.0
80.0
100.0
120.0
140.0
Typical Good Practice Typical Average 09/10 WGB 2010 Actual Energy
Use (Metered or Billed)
CIBSE TM:46 University
Campus
ECON 19 Type 2 Naturally Ventilated UCC
Total Electricity
Total fossil fuel(thermal)
Fig. 13. CIBSE TM: 46 and ECON 19 Benchmarks adjusted for 2010 Cork Degree Heating Days (2,565) and actual building occupancy hours (5,235) according toCIBSE TM: 46 UCC 09/10 average figure (Ahern & O’Connor 2011) thermally adjusted only from 2,375 degree heating days to Cork 2010 Degree Heating Days (2,565)
UCC Gateway Building:Layout 1 09/09/2011 16:23 Page 15
significant heating and cooling requirements. The modular design ofthe system has ensured efficient operation at low part load.
Other notable lessons learned include:
• Complete trial boreholes well in advance of construction to avoid surprises.
• There is limited knowledge in the industry on how to construct and commission these systems. A detailed sequence of operations describing the complex control strategy is a prerequisite.
• Complex systems need seasonal commissioning in the first year of operation to ensure operation to the design intent.
• Avoid three-port valves on the CHW system as delta T degradation will significantly reduce heat recovery potential.
The project has demonstrated the following benefits:
• There is significantly lower energy consumption compared to traditional heating and cooling solutions. Fossil fuel heating is significantly reduced which, as the national electricity grid decarbonises, will reduce carbon emissions further.
• Successful recovery of waste heat from the server rooms (60 kW constant load with future expansion to 300 kW).
• Groundwater installations with highly variable water temperatures can be accommodated with the right control strategy and provide significant free cooling when coupled to high temperature CHW systems.
• Traditional CHW and LPHW systems can be designed to operate effectively with higher chilled water temperatures and significantly lower LPHW temperatures if carefully integrated into mechanical air systems.
• Energy usage and CO2 emissions compares favourably with fully naturally ventilated buildings.
Acknowledgements
The authors acknowledge the contribution of the following; ConLeddy, Vincent Cronin, Michael O’Connor, Paul Houston, and MartinMurphy (PM Group staff) to the design of the M&E systems. Craig Dyerand David Cahill (Scott Tallon Walker Architects), Andrew Langmaid
(Davis Langdon – QS Consultants) and John Hynes (Arup – CivilStructural Engineers). Sean Moran (O’Callaghan Moran) was thehydrologist consultant for the project. Dr Paul Sikora who wrote theinitial ground water feasibility study. The successful construction andcommissioning of the mechanical systems would not have beenpossible without the dedication and perseverance of Liam O’Sullivan(Mercury Engineering) and John Roe (Standard Controls). The authorswould like to thank Niall McAuliffe, Tim O’Riordan, Paul Hannan,Eamon Connaughton and Adrian Downey (UCC Building and EstatesOffice) for their assistance during the design and construction phases,and access to BMS data.
ReferencesPacific Gas and Electric Company. (2007) Advanced Variable Air VolumeDesign Guide; California Public Utilities Commission, U.S.A.
Carbon Trust. (2000) Energy Consumption Guide 19; Action Energy UK.
Connor, B. P., ALLEN, A. R., Leahy, K. L., Sikora P (1998) Report onassessment of the thermal potential of shallow groundwater in gravelsbeneath the River Lee floodplain; Irish Energy Board, Ireland.
Allen, A.R., Milenic, D (2001) Preliminary Assessment of GroundwaterResources and Groundwater Quality in the Cork City/Harbour Area, Ireland;In: Seiler, K-P, Wöhnlich, S., New Approaches to Characterising GroundwaterFlow. Balkema, Rotterdam, 2, 1119-1123
Allen A.R., Milenic, D (2003) Low enthalpy geothermal energy resources from groundwater in fluvioglacial gravels of buried valleys; Applied Energy,74, 9-19
Sikora, P (2002) Feasibility of Using Borehole Water for the Provision of SpaceCooling at the UCC IT Building; Dunstar, Ireland.
Connor, B. P., (1998) National Survey on Low-Temperature GeothermalEnergy; Geothermal Association of Ireland Newsletter. Issue no. 1 pp. 3.Ireland.
Keohane, M.F. (2005) Model Solutions Design Study 3|UCC InformationTechnology Building; SEI, Ireland.
ASHRAE (2008) Environmental Guidelines for Datacom Equipment
– Expanding the Recommended Environmental Envelope-; ASHRAE USA
CIBSE (2008) CIBSE TM:46-; CIBSE UK
Ahern, M. O’Connor, M. (2011) University College Cork Annual EnergyReport 2009 - 2010; UCC, Ireland.
CIBSE Sustainable Awards 2011
16
Fig. 16: WGB heat pump total average energy Jul – Dec 2010Fig. 15: WGB total pumping average energy Jul – Dec 2010
UCC Gateway Building:Layout 1 09/09/2011 16:23 Page 16

Criminal Courts ofJustice, Dublin
Jonathan Tooth HND IN BUILDING SERVICES
Rory Burke BE(ENG),DIP. PROJ. MAN., CERTIFIED
BREEAM, BER & LEED ASSESSOR, A.CIBSE, [email protected]
Colm Saul BSC(ENG), MCIBSE, [email protected]
SDAR Awards runner-up 2010
SDAR Criminal Courts:Layout 1 09/09/2011 15:28 Page 17

Abstract
The newly completed Criminal Courts of Justice (CCJ)
at Parkgate Street in Dublin 8 is the largest courts
project undertaken in the history of the Irish State.
The design of the heating, ventilation and air
conditioning (HVAC) systems was based on computer
simulated modelling of the building to determine
the optimum plant selection and operation based
on the contract conditions and energy targets.
The report will analyse the computer simulated
energy targets versus the actual energy consumption
and assess the benefit of engineering solutions such
as twin-skin facades and heat recovery based on real
data. The report will draw conclusions on the real
benefit of such systems within the built environment.
In addition to the energy targets, the report will
discuss the commissioning processes involved in
delivering the energy targets required and the
importance of designing metering strategies to
enable the data to be collected and analysed.
Key Words:
Facade, Natural Ventilation, Heat Recovery,
Energy Usage Indices, Metering.
1. Introduction and project detailThe newly completed Criminal Courts of Justice (CCJ) at ParkgateStreet in Dublin 8 is the largest courts project undertaken in the history of the Irish State. This landmark building provides asignificant architectural addition to Dublin. Its architectural design,along with its construction, is befitting of a major civic building ofnational significance. The project was carried out under a PublicPrivate Parnership (PPP) and has been awarded the RIAI PublicChoice Award 2010 and RIAI Best Accessible Award 2010.
The design centralised criminal court activity in one servicedlocation. It is a major new state-of-art facility suited to theadministration of justice in Ireland. The principal users will be theCourts Service, Judiciary, Jurors, Director of Public Prosecution,Legal Profession, Defendants, Gardai, Irish Prison Service, FacilitiesManagement and the General Public. The building is circular inform with the ‘Great Hall’ at its core and is 11 storeys high over anaturally-ventilated basement car park with an area of 25,000m2
and a construction value of e160m. It contains 22 courtrooms, juryretiring rooms, judicial chambers, custodial holding rooms andassociated offices and services.
In addition to being a landmark building, the brief called for thebuilding to be a low energy user with individually-controlled spaces;good daylight; acoustically-treated facilities protected from internaland external noise pollution; and highly-secure, including thesegregation of the following users: defendants in custody, public,jurors and judiciary.
The design called for a challenging energy usage target of notgreater than 240 kWh/m2/year with a resultant carbon emissiontarget of <86 KgCO2/m2/year based on the strict criteria set out inthe PPP contract documents. These documents set very stringenttolerances for the internal environmental conditions and noiselevels. Any deviation outside of these conditions would result inthe non-availability clause being enforced.
Some of the specific features that assist in meeting these energyand environmental targets are the active double skin facade, mixedmode ventilation and use of thermal mass in courtrooms, active chilled beams, low Nox boilers, night cooling, heat recoveryfrom the Great Hall, extensive lighting management systemincorporating presence detection, and daylight sensing. In the case of the double skin facade for example, it reduces winter heatlosses, reduces solar gain into the spaces and provides for solar andglare control and allows for very good levels of natural daylight.
One of the early tasks undertaken by the Building Services DesignTeam was to provide advice to the whole project team on thebuilding envelope. Extensive use of Dynamic Simulation Modellingin the design phase helped to optimise the double skin facadedesign and the control strategy. Dynamic Simulation Modelling alsoallowed the thermal loads and energy consumption to be assessedwhilst providing analysis of the ventilation strategy of Free coolingwith limited mechanical cooling in the great hall and courtrooms.
CIBSE Sustainable Awards 2011
18
SDAR Criminal Courts:Layout 1 09/09/2011 15:28 Page 18

A comprehensive energy strategy was produced to demonstrateand to outline compliance with the energy and carbon emissiontargets and outline to the client how it would be monitored,controlled and reported on.
The active double skin facade is controlled through a FacadeManagement System (FMS) linked to the Building ManagementSystem (BMS). The FMS is currently finishing its extensive seasonal commissioning and 12 months into occupation hasdemonstrated the benefit that the double skin adds to minimisingenergy losses.
Based on actual data, the heat loss through the courtroomsovernight during non-operational hours was exceptionally lowduring the cold conditions of December 2009/January 2010 andwas typically around 2 degrees Celsius, thus demonstrating thebenefit of the active double skin facade and overall thermalperformance of the building envelope that was studied andselected using Dynamic Simulated modelling.
The courtroom design involved the use of a displacementventilation system with highly specified acoustic baffling to meetthe stringent HVAC acoustic criteria. Each courtroom has its own dedicated air handling unit (AHU) supplying air at low leveland the air is returned at high level through acoustic louvers intothe ‘Great Hall’. The AHU’s are variable speed controlled linked to temperature and CO2 control algorithms.
The Great Hall would be regarded primarily as a large transientspace with a diameter of 40m and a height of 32m and is the mainconnecting hub to all the courts. It is the single largest space in the building representing 35% of the all public spaces. A great dealof time was spent modeling the microclimatic conditions of thespace and reviewing the most energy efficient way to meet theinternal environmental conditions. The system selected was a mixedmode ventilation and underfloor heating system comprising ofnatural ventilation openings at low and high level with thesecondary air from the 22 courtrooms assisting in the ventilationand heating of the space. There are roof mounted heat recoveryunits that provide pre-heating to the fresh air make-up into thecourtrooms.
While not in itself a low energy feature, the use of a significantmetering strategy (over 150No meters) has helped to reduce the actual energy usage within the building. This strategy is in linewith the guidelines set out in CIBSE’s TM39 – Building EnergyMetering. According to TM39 good metering/sub-metering, is afundamental energy monitoring and targeting tool and an essentialpart of energy management. Sub-metering in itself does not saveenergy but rather the actions taken as a result of monitoring andusing the data provided. All meters are connected to a dedicatedmonitoring and targeting software package via the BMS.
This software allows the facilities manager to actively monitor andcontrol a significant proportion of the energy consumers in thebuilding. The strategy developed during design, meets and exceedsthe criteria set out in TM 39 and has allowed the client to verifythe energy consumption within the building with the billinginformation supplied by the utility companies.
The environmental brief set by the client was to achieve a “VeryGood” rating under BREEAM for Courts 2006 and was comfortablyachieved. Particular attention was paid during construction to theimpact of site activities with a specific target to reduce, recycle andreuse construction materials where possible. In this category theconstructor (PJ Hegarty’s) scored the maximum of four points underthe construction site impacts criteria. Additionally, all timber usedduring construction was responsibly sourced. In relation to theBuilding Regulations Part L requirements the design exceeded thecarbon emissions target for the notional building by 30%.
The heat recovery system installed demonstrated that by installingthe equipment at an additional capital cost of £80k, the buildingoperation would save £10k per year giving a simple payback of eight years and was deemed to be beneficial to the overall PPP operation.
The building is designed to cater for different levels of perimetersecurity and is provided with an integrated security managementsystem to allow monitoring and control of all CCTV, access control,intruder alarm and call systems from a central graphical userinterface. The building is provided with two security control roomswith a dedicated control room provided for the custodial area. Allfixtures in the custodial area were selected to meet Irish PrisonService anti-ligature requirements including lighting, smokedetectors, ventilation grilles and sprinkler heads.
Commissioning of the CCJ formed a significant item within the construction period, an overall allowance of 16 weeks wasincluded in the contract programme. The HVAC, security, life safetyand BMS systems were commissioned in accordance with CIBSECommissioning Codes. However, the level of approval and sign offwas more stringent due to the nature of the contract. As the CCJ was a design build finance operate and maintain contract(DBFOM), there was a four level sign off for each system(contractor, building services engineer, facility managementcontractor and independent commissioning engineer). Whencompleted, this was witnessed by the client’s site engineering team.
The commissioning data was fundamental to the setting up of the building management system (BMS) and subsequently theenergy management and reporting. The data logs collected by thecontrol system is used in analysing actual building operation versussimulated building operation calculated during the design process.Seasonal commissioning is being carried out to maximise systemperformance and optimise plant operation between seasons.Adjustments are made to set points and time schedules for winterand summer conditions, based on the historical data to furtherenhance the building performance and ultimately the energyusage. J.V. Tierney and Co (M&E Consultants) is assisting the FMcontractor in interpreting and analysing the performance of thebuilding and its systems during the seasonal commissioning phase.
The client, the Courts Service, was fully involved through all designstages given the nature of the PPP project. The PPP company,Amber Infrastructure Group, which managed the project fromdesign to operation, were and are involved with the client on acontinuous basis.
Central Criminal Courts of Justice, Dublin
19
SDAR Criminal Courts:Layout 1 09/09/2011 15:28 Page 19

A collaborative approach was taken by the PPP team throughout all stages of design, construction and commissioning with PJ Hegarty’s taking control of the design build element of theproject. This required regular monthly project workshop meetings,fortnightly design team meetings and weekly commissioningmeetings during the latter stages of the project. This approachensured minimal changes during the process and allowed theproject to be delivered three months ahead of schedule.
The FM contractor G4S contract is to operate the building for 25 years and they were involved from project bid stage throughdesign, to selection and commissioning of equipment and are fully familiar with the design and performance criteria of thebuilding. They have a full-time team based on site includingsecurity, maintenance technicians and cleaning staff to ensure thesmooth daily running of the building complex.
The PPP company made a conscious effort to beat the buildingenergy target by at least 15% and 12 months into operation the
CIBSE Sustainable Awards 2011
20
Fig. 1.1: Rendered wireframe image of the Criminal Courts of Justice
Fig 1.2: Assumptions used for computer simulation
Area Type System Type Plant Estimated Occupancy Occupancy Lighting Lighting Lighting Equipment Equipment EquipmentOperational Occupancy Profile Diversity (W/m2) Profile Diversity Profile DiversityProfile (%) (%)
Courtrooms Displacement 08.00-17.00 As per 09.00-17.00 67% 12 09.00-17.00 80% Court 09.00-17.00 80%CP RDS Technology
Judges Chambers (B1) FCU 07.00-19.00 6 09.00-19.00 25% 12 09.00-19.00 25% 1 PC 09.00-19.00 25%1 Plasma Screen1 Small Printer
Judges Ante Rooms (B2) FCU 07.00-19.00 3 09.00-19.00 25% 12 09.00-19.00 25% 1PC 09.00-19.00 25%Jury Retiring Rooms (C3) FCU 07.00-19.00 12 09.00-19.00 100% 12 09.00-19.00 80% 1 Fridge 09.00-19.00 100%Large Consultation FCU 07.00-19.00 6 09.00-18.00 50% 12 09.00-18.00 80% 2 PCs 09.00-18.00 100%Rooms (A9)Consultation Rooms(10) FCU 07.00-19.00 4 09.00-18.00 50% 12 09.00-18.00 80% 2 PCs 09.00-18.00 100%Public Restaurant (A11[1]) AA 08.00-18.00 100 people 09.00-18.00 100% 12 09.00-18.00 80% Catering 09.00-18.00 100%
13.00-15.00 13.00-15.0020% other 20% other
Kitchen (A11[2]) AA 08.00-18.00 6 10.00-15.00 100% 12 10.00-15.00 80% Catering 10.00-15.00 100%Office Block (E8[2]) CHB 08.00-18.00 24 09.00-18.00 75% 12 09.00-18.00 80% 24 PCs 09.00-18.00 75% Pcs
4 Lge Printers 100% PrintersOffice Block (E8[3]) CHB 08.00-18.00 30 09.00-18.00 75% 12 09.00-18.00 80% 30 PCs 09.00-18.00 75% Pcs
5 Lge Printers 100% PrintersBar Area (H1) CHB 08.00-18.00 60 09.00-18.00 50% 12 09.00-18.00 80% 22 PCs 09.00-18.00 50% Pcs
3 Lge Printers 100% PrintersBar Area (H2) CHB 08.00-18.00 50 09.00-18.00 50% 12 09.00-18.00 80% 50 PCs 09.00-18.00 50% Pcs
7 Lge Printers 100% PrintersBar Area (H3) CHB 08.00-18.00 4 09.00-18.00 100% 12 09.00-18.00 80% 3 PCs 09.00-18.00 50% Pcs
3 Lge Printers 100% PrintersBar Area (H4) CHB 08.00-18.00 150 09.00-18.00 50% 12 09.00-18.00 50% 150 PCs 09.00-18.00 50% Pcs
13 Lge Printers 100% PrintersCustody Area (Support) FCU 07.00-18.00 16 09.00-18.00 100% 12 09.00-18.00 80% 6 PCs 09.00-18.00 100%Custody Area (Cells) AA 07.00-18.00 100 09.00-18.00 100% 12 09.00-18.00 80% – – –Jury Assembly (C1) AA 08.00-12.00 300 09.00-12.00 75% 12 09.00-12.00 80% 2 Plasma Screens 09.00-12.00 100%Jury Assembly (A8) AA 08.00-12.00 97 09.00-12.00 75% 12 09.00-12.00 80% 1 Plasma Screen 09.00-12.00 100%Jury Dining (C4) AA 12.00-16.00 192 19.00-15.00 75% 12 13.00-15.00 80% Catering 13.00-15.00 75%Great Hall UFH 06.00-17.00 – – – Gallery 09.00-18.00 60%
Atrium Top 09.00-18.00 60%Decorative 15.00-18.00 100%
Unless specified otherwise, occupancies are Monday to Friday excluding public holidays.1. Some winter months have an additional 0.30 to 1.00 warmup, e.g. courtrooms, office block, bar area. 2. Above figures are based on a typical core day of 11 hours. This gives an average building operational profile of 55 hours per week.
Criminal Courts Complex – energy model simulation summary data
SDAR Criminal Courts:Layout 1 09/09/2011 15:28 Page 20
building is projected to have an annualised reduction of greaterthan 25% of this target due to the quality of the design,construction and facility management operations.
The client has commented:
“It is a tribute to the design and construction teams that thecompleted building fully meets the complexity of the brief and during its first four months of operations has successfully dealtwith the largest single transfer of criminal court business in the history of the State.”
Analysis of data
As mentioned above, a computerised thermal model was producedto ascertain the predicted energy consumption of the building priorto construction. Fig. 1.1 shows a graphic of the computer modelgenerated with IES Virtual Environment® software. The softwareallows actual construction details to be created within the model – a virtual wall can be created, for example, of the designedthickness, configuration and individual build element and an actualU-value can be calculated. In other words, the computer model isa virtual replica of the building. This is a powerful tool as it can be used to simulate different scenarios or construction methodsetc to optimise building performance before any real building takes place.
Various data assumptions were made during the design, based on contract room data sheets and industry best practice. These are summarised in Fig. 1.2. The simulation takes these assumptionsin the form of profiles and the dynamic output is achieved,andprovides information on plant operation with respect of fuel type,efficiencies, weather data, occupation and internal/ external gains.
Once the model is set up and the profiles are inputted into the
model, the simulation of the building takes place. The predictedfuel consumption (gas, electricity etc) can be plotted and analysed.Fig. 1.3 shows the annual energy consumptions based on thesimulated computer model.
This data is represented in kWh/m² which is the unit used forbenchmarking as shown in Fig. 1.4.
Actual data collected from the BMS and energy software installedat the Criminal Courts of Justice demonstrates the Year 1 energyconsumption based on the metering/recording facilities and theutility companies’ energy bills. These are tabulated in Fig. 1.5.
Since energy consumption for the contract year is based on energyused 24 hours a day, it was necessary to derive a factor thatassesses how much energy is used between the hours of 5am and7pm, Monday to Friday. This factor was derived from consumptiondata that showed how much electricity and gas was used every 15minutes of the day. From this analysis a “2600 hours” factor(contract factor) was developed which represented how much ofthe 24-hour based consumption needs to be included to derive theannual Energy Usage Indices (EUI). The “2600 factors” used in thisanalysis are 55% for electricity and 80% for gas.
Using the consumption analysis presented in Fig. 1.5 and a treatedfloor area of 23,000m2, Fig. 1.6 has been prepared to compareactual Contract Year One performance with target performance,for both energy and CO2.
1.2 Conclusion
Energy usage – simulated versus actual
It can be seen based on Figs 1.2 to 1.6 that the simulation softwareand computer model have allowed accurate assessment of the
Central Criminal Courts of Justice, Dublin
21
Fig. 1.3: Estimated energy consumption
Criminal Courts Complex – estimated energy consumption, variation per month (excludes catering)
SDAR Criminal Courts:Layout 1 09/09/2011 15:28 Page 21

predicted energy usage for the Criminal Courts of Justice based oncontinuous occupancy and internal gains used in the assumptionsnoted above in Fig. 1.2. In conjunction with the building servicesdesign and installation of systems that can accurately record activeenergy consumption, these tools provide the building user with theinformation to enable accurate energy prediction and management.
It can be seen that the actual energy figures are circa 25% less than predicted (Fig. 1.6). This is because the software model usesoccupancy and internal gains that do not fluctuate as they do inreality. The actual energy data can be a useful ‘sanity check’ when
modelling buildings in the future. One thing that could be learntfrom this is that the fluctuations in occupancy and internal gainscould be modelled more realistically using a more complex profile,or indeed reduced from the standard figures traditionally used. Inaddition, installing energy meters as outlined in CIBSE TM39 hasenabled the facilities manager (G4S) to monitor and control energyusage such that consumption is better than that predicted.
Historical energy data can be logged and standard energy usageprofiles can be generated to allow the user to actively manage the energy consumption in a proactive, rather than reactive, way.Bench-marking energy profiles for any system can be achievedeasily through data collection which can also flag issues that mayoccur during the building lifecycle.
Twin skin facades
The Criminal Courts of Justice was designed incorporating a twin skinfacade around the majority of the building. The only exception to thisis the office areas on the north facade. The computer model high-lighted the benefit on energy consumption of the twin skin during thedesign process and along with the installed field devices and controlsystems working together (building management system and facade
CIBSE Sustainable Awards 2011
22
Fig 1.5: Contract year 1 energy consumption
Notes Invoice Electricity Gas Electricity GasMonth kWh kWh 2600hrs 2600hrs
kWh kWh
From 18 Nov Nov-09 105,354 – 57,945 –
Dec-09 237,023 – 130,363 –
Jan-10 254,879 – 140,183 –
Feb-10 228,547 1,670,197 125,701 1,336,158
Mar-10 246,592 356,631 135,626 285,305
Apr-10 211,779 232,317 116,478 185,854
May-10 215,477 178,585 188,512 142,868
Jun-10 235,936 106,289 129,765 85,031
Jul-10 247,394 131,318 136,067 105,054
Aug-10 210,057 110,517 115,531 88,414
Sep-10 205,921 196,955 113,257 157,564
Oct-10 232,260 275,287 127,743 220,310
To 17 Nov Nov-10 137,218 85,7734 75,470 68,587
Totals 2,768,437 3,343,930 1,522,640 2,675,144
Fig 1.6: 2600 energy usage indices
2600 hours bases EUI Electricity Gas Total
Year 1 EUI kWh/m2 66 116 183
Target EUI kWh/m2 90 150 240
Vrce actual to target -26% -22% -24%
Year 1 EUI kgsCO2/m2 41 23 64
Target EUI kgsCO2/m2 56 30 86
Vrce actual to target -26% -22% -24%
Fig 1.4: Estimated energy consumption 9kWh/m2)
Heating Hot Water Cooling Fans and Lighting Small Catering Catering Natural Gas Electricity Total energy(kWh/m2) (kWh/m2) (kWh/m2) Pumps (kWh/m2) Power Gas Electric (kWh/m2) (kWh/m2) (kWh/m2)
(kWh/m2) (kWh/m2) (kWh/m2) (kWh/m2) excluding excluding excludingCatering Catering Catering
January 19.6 0.9 0.1 2.1 2.1 1.0 20.5 5.3 25.7
February 21.0 1.0 0.1 2.1 2.1 1.1 22.0 5.4 27.4
March 16.9 0.9 0.1 1.7 2.2 1.0 17.9 5.0 22.9
April 14.2 1.1 0.2 1.7 2.3 1.2 15.3 5.4 20.7
May 9.9 0.9 0.3 1.5 2.0 1.0 10.7 4.7 15.5
June 6.1 1.1 2.1 1.7 2.3 1.2 7.2 7.3 14.5
July 3.9 1.1 3.4 1.7 2.3 1.2 5.0 8.6 13.6
August 4.6 0.7 1.4 1.3 1.8 0.8 5.2 5.2 10.5
September 6.4 0.7 0.7 1.3 1.8 0.8 7.1 4.6 11.7
October 10.0 1.0 0.3 1.6 2.1 1.1 11.0 5.1 16.1
November 16.6 1.1 0.1 1.9 2.3 1.2 17.7 5.6 23.3
December 19.7 1.0 0.1 2.1 2.3 1.1 20.8 5.6 26.4
SUM 148.8 11.6 8.8 20.6 25.8 12.7 4 6 160.4 67.9 228.3
Including Catering 164.4 73.9 238.3
Criminal Courts Complex – estimated monthly energy consumption (kW/m2)
SDAR Criminal Courts:Layout 1 09/09/2011 15:28 Page 22

management system) it is possible to plot the actual benefit of the twinskin vs the single skin in terms of heat loss comparison between thetwo systems.
To achieve this assessment, data was collected from the roomthermostats in the two areas over a weekend, when building servicessystems are “enabled off” on the BMS time schedule (building closedover the weekend).
As an example Fig. 1.7 shows the actual temperatures plotted in thetwin skin and single skin zones showing the rate of heat loss over a nonconditioned time period. The relevance of this is particularly apparentwhen considering heat up times when the building becomes occupied(Monday morning).
It can be seen from Fig. 1.7 that the rate of heat loss over a weekendperiod is notably less with the twin skin than with the single skin. Thismay appear to be an obvious statement but it cannot be ignored in
relation to overall energy consumption, plant selection and buildingdesign. Consider the difference in energy usage indices discussedearlier if the twin skin solution was not part of the building design.
Heat recovery
The Great Hall in the Criminal Courts of Justice acts as a return air pathfor the court rooms and ancillary spaces (underfloor heating in thegreat hall). The design of this space utilises six heat recovery units (runaround coil) located on the roof that are enabled based on thetemperature profiles within the zone. Exhaust air from the court roomsis passively extracted into the Great Hall and, depending on theconditions, is either naturally exhausted via roof vents at high level ormechanically exhausted via the heat recovery units. The useful heatbuilt up is introduced into the court room supply air via a pre-heatheating coil in the court room supply air handling units.
The computer model was used to predict the actual real benefit of thisheat recovery system with regard to energy savings. Fig. 1.8 indicatesthe predicted benefit of the installation of this heat recovery system interms of reduction in energy use and associated cost saving based onelectricity cost of e0.18/kWh and gas cost of e0.04/kWh.
Acknowledgements
The authors acknowledge P.J. Hegarty & Sons Ltd, G4S and the CourtServices for their assistance in the preparation of this report.
References1. CIBSE (2006) TM39 Building Energy Metering, Chartered Institute of
Building Services Engineers, UK
2. JVT (2008) Energy Strategy Document for the Criminal Courts of Justice, CCJ-PPP Co., Ireland
3. CIBSE (2006) Guide A, Chartered Institute of Building Services Engineers, UK
4. G4S (2010) Utilities Annual Report, G4S Security Ltd., Ireland
Central Criminal Courts of Justice, Dublin
23
Fig. 1.8: Heat recovery predicted energy reduction (%)
(%) Total Total TotalEnergy Electricity Natural(%) (%) Gas (%)
Jan 01-31 -7.6% 2.8% -9.5%Feb 01-28 -8.5% 1.1% -10.2%Mar 01-31 -6.7% 1.2% -8.1%Apr 01-30 -6.6% 0.3% -7.9%May 01-31 -9.9% -0.4% -13.3%Jun 01-30 -8.5% -0.2% -13.1%Jul 01-31 -10.2% -0.8% -23.2%Aug 01-31 -21.6% -1.7% -32.0%Sep 01-30 -13.9% -1.7% -18.3%Oct 01-31 -11.0% -0.4% -14.6%Nov 01-30 -7.0% 0.5% -8.6%Dec 01-31 -7.4% 2.0% -8.9%Summed total -8.7% 0.3% -11.1%
Fig. 1.7: Twin skin vs single skin. Courtroom versus office area
SDAR Criminal Courts:Layout 1 09/09/2011 15:28 Page 23


A review of the Passiv Haus Conceptand an examination of how this was applied to a supermarket in Ireland
Marc Wegner BE ME MIEI
Postgraduate of School of Electrical Engineering Systems, Dublin Institute of TechnologyDublin, [email protected]
SDAR Awards runner-up 2010
Wegner Tesco:Layout 1 09/09/2011 15:41 Page 25

Abstract
The aim of this research is to garner a full
understanding of low energy construction across a
variety of sectors in countries throughout the world,
and then investigate how the Passiv Haus concept was
applied to a Supermarket in Ireland. In order to carry
out this investigation, a case study was performed on
the energy efficiency and performance of a Tesco
store in Tramore. It was found that its electrical
cosumption was 24% lower than equivalent stores
which were not built to the high specification of the
Passiv Haus Standard. As this supermarket is the first
of its kind in the world, and with both the SEAI and
the European Parliament pushing for this method of
construction to be adopted,[1] this standard will most
likely in some shape or form become a new building
standard in Ireland. This supermarket offers a unique
insight into what can be expected in building design
and construction in this sector if it is undertaken.
Key Words:
Passiv Haus; Passive House; Electrical Energy
Consumption in Supermarkets.
1 IntroductionIn Ireland, the Passiv Haus Standard has become more widelyacknowledged in recent years and accepted as a method ofreducing energy consumption and the operating costs of adwelling. However, applying this standard to a commercial buildingis still in relative infancy. This newer approach to using the Passiv Haus Standard was reviewed in this paper by applying ananalysis of the energy consumption of a newly constructed Tescosupermarket in Tramore, Waterford, Ireland.
As this is the first supermarket in the world to be certified by the Passiv Haus Institut (PHI) it is of particular importance todemonstrate whether or not this method of construction showsany real benefits, especially in a commercial sense, as this will beone of the main driving forces behind this movement if it is to besuccessful.
The main aim of this study was to investigate if there were any cost savings with regards to the operational costs of the Tescosupermarket in Tramore, and if there were any improvements inefficiency in energy consumption in comparison to standardbuilding practices.
Tesco have offsite management systems that remotely obtain alldata at the point of use. Given that the store has been in operationsince October 2008, there was over a year’s worth of data availablefor this study. Field equipment was also used to independentlyrecord data for the research.
2 Governmental influenceOn the 8th January 2008 following the work done in the inter-governmental European CEPHEUS research programme, theEuropean Parliament published a document entitled “An ActionPlan for Energy Efficiency: Realising the Potential”. Within thisdocument, which covered a range of aspects, particular mentionwas made of the Passiv Haus:
“…29. Calls on the Commission to propose a bindingrequirement that all new buildings needing to be heatedand/or cooled be constructed to passive house or equivalentnon-residential standards from 2011, and a requirement to usepassive heating and cooling solutions from 2008…[3]”
3 Technical criteria for Passiv Haus
CIBSE Sustainable Awards 2011
26
Table 1: Criteria for non-residential buildings for Passiv Haus certifiacation[2]
*Over runs of this amount is allowable at the discretion of the Passiv Haus Institut
Specific Space Heating Demand Max 15 kWh/(m2a)
Specific Space Heating Load Max. 10 W/m2
Pressurisation Test Result n50 Max. 0.6 h-1
Specific Space Cooling Demand Max. 15 kWh/(m2a)
Total Specific Primary Energy Demand Max. 120 kWh/(m2a)*
Wegner Tesco:Layout 1 09/09/2011 15:41 Page 26
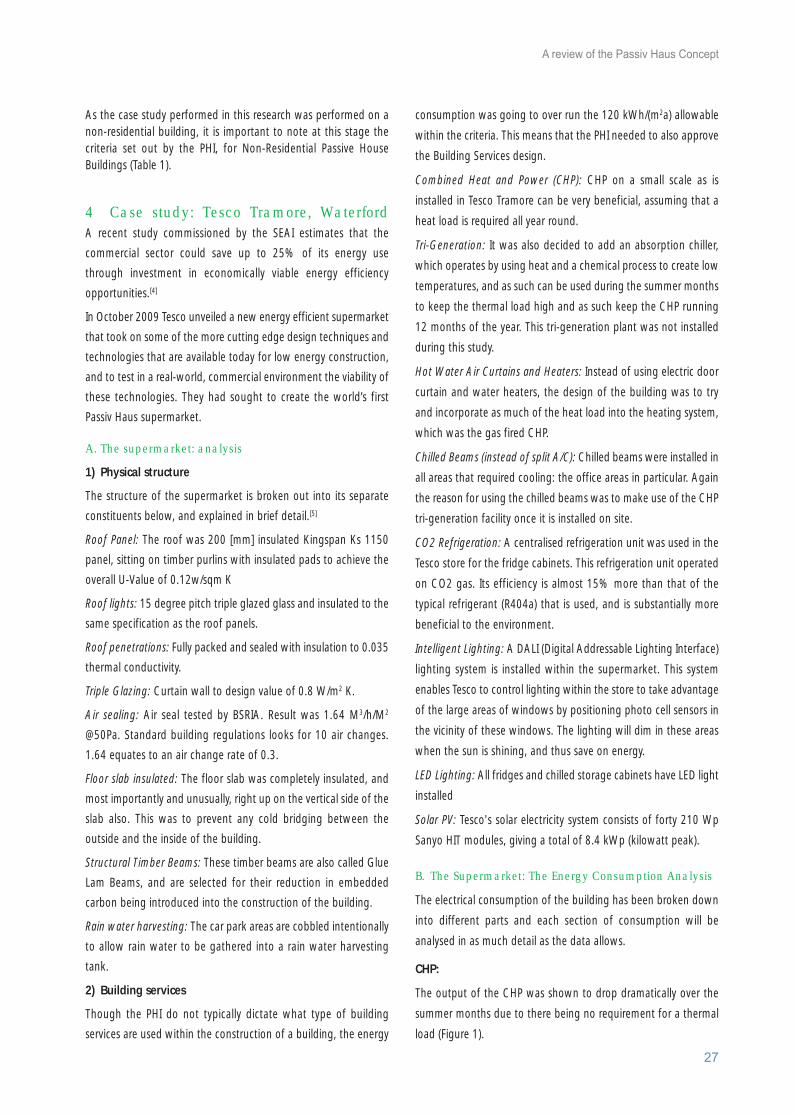
As the case study performed in this research was performed on anon-residential building, it is important to note at this stage thecriteria set out by the PHI, for Non-Residential Passive HouseBuildings (Table 1).
4 Case study: Tesco Tramore, Waterford A recent study commissioned by the SEAI estimates that the
commercial sector could save up to 25% of its energy use
through investment in economically viable energy efficiency
opportunities.[4]
In October 2009 Tesco unveiled a new energy efficient supermarket
that took on some of the more cutting edge design techniques and
technologies that are available today for low energy construction,
and to test in a real-world, commercial environment the viability of
these technologies. They had sought to create the world’s first
Passiv Haus supermarket.
A. The supermarket: analysis
1) Physical structure
The structure of the supermarket is broken out into its separate
constituents below, and explained in brief detail.[5]
Roof Panel: The roof was 200 [mm] insulated Kingspan Ks 1150
panel, sitting on timber purlins with insulated pads to achieve the
overall U-Value of 0.12w/sqm K
Roof lights: 15 degree pitch triple glazed glass and insulated to the
same specification as the roof panels.
Roof penetrations: Fully packed and sealed with insulation to 0.035
thermal conductivity.
Triple Glazing: Curtain wall to design value of 0.8 W/m2 K.
Air sealing: Air seal tested by BSRIA. Result was 1.64 M3/h/M2
@50Pa. Standard building regulations looks for 10 air changes.
1.64 equates to an air change rate of 0.3.
Floor slab insulated: The floor slab was completely insulated, and
most importantly and unusually, right up on the vertical side of the
slab also. This was to prevent any cold bridging between the
outside and the inside of the building.
Structural Timber Beams: These timber beams are also called Glue
Lam Beams, and are selected for their reduction in embedded
carbon being introduced into the construction of the building.
Rain water harvesting: The car park areas are cobbled intentionally
to allow rain water to be gathered into a rain water harvesting
tank.
2) Building services
Though the PHI do not typically dictate what type of building
services are used within the construction of a building, the energy
consumption was going to over run the 120 kWh/(m2a) allowable
within the criteria. This means that the PHI needed to also approve
the Building Services design.
Combined Heat and Power (CHP): CHP on a small scale as is
installed in Tesco Tramore can be very beneficial, assuming that a
heat load is required all year round.
Tri-Generation: It was also decided to add an absorption chiller,
which operates by using heat and a chemical process to create low
temperatures, and as such can be used during the summer months
to keep the thermal load high and as such keep the CHP running
12 months of the year. This tri-generation plant was not installed
during this study.
Hot Water Air Curtains and Heaters: Instead of using electric door
curtain and water heaters, the design of the building was to try
and incorporate as much of the heat load into the heating system,
which was the gas fired CHP.
Chilled Beams (instead of split A/C): Chilled beams were installed in
all areas that required cooling: the office areas in particular. Again
the reason for using the chilled beams was to make use of the CHP
tri-generation facility once it is installed on site.
CO2 Refrigeration: A centralised refrigeration unit was used in the
Tesco store for the fridge cabinets. This refrigeration unit operated
on CO2 gas. Its efficiency is almost 15% more than that of the
typical refrigerant (R404a) that is used, and is substantially more
beneficial to the environment.
Intelligent Lighting: A DALI (Digital Addressable Lighting Interface)
lighting system is installed within the supermarket. This system
enables Tesco to control lighting within the store to take advantage
of the large areas of windows by positioning photo cell sensors in
the vicinity of these windows. The lighting will dim in these areas
when the sun is shining, and thus save on energy.
LED Lighting: All fridges and chilled storage cabinets have LED light
installed
Solar PV: Tesco's solar electricity system consists of forty 210 Wp
Sanyo HIT modules, giving a total of 8.4 kWp (kilowatt peak).
B. The Supermarket: The Energy Consumption Analysis
The electrical consumption of the building has been broken down
into different parts and each section of consumption will be
analysed in as much detail as the data allows.
CHP:
The output of the CHP was shown to drop dramatically over the
summer months due to there being no requirement for a thermal
load (Figure 1).
A review of the Passiv Haus Concept
27
Wegner Tesco:Layout 1 09/09/2011 15:41 Page 27
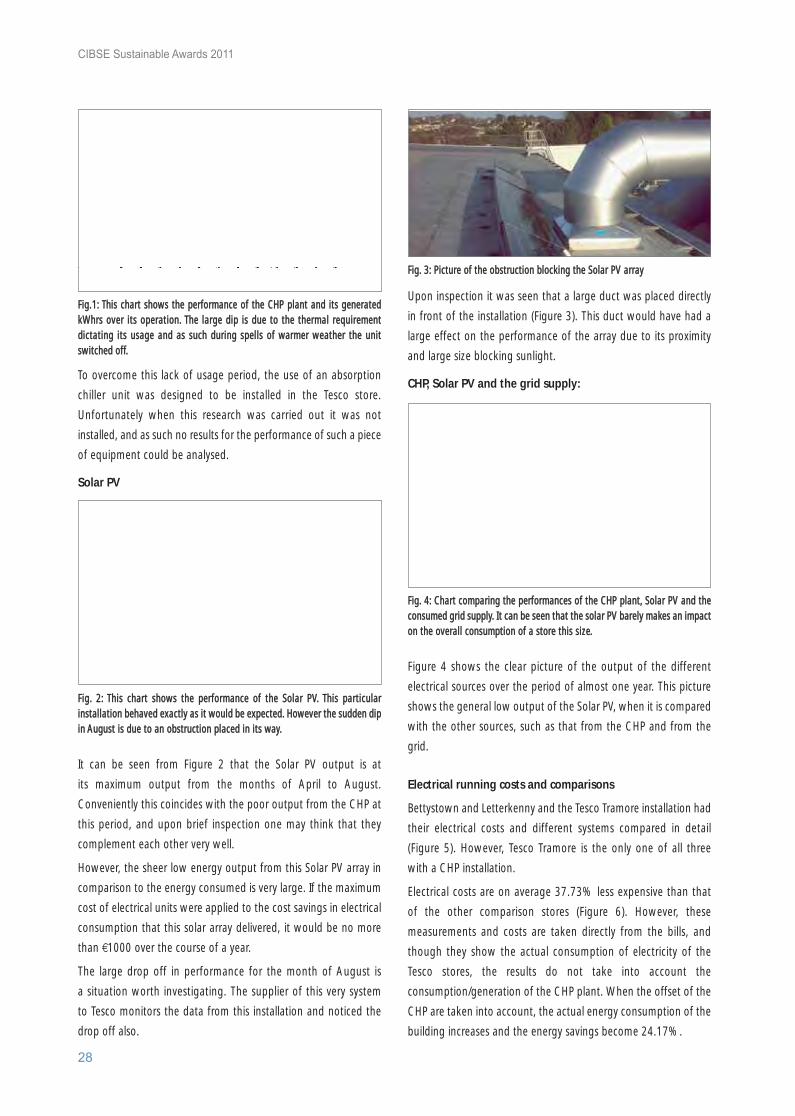
To overcome this lack of usage period, the use of an absorption
chiller unit was designed to be installed in the Tesco store.
Unfortunately when this research was carried out it was not
installed, and as such no results for the performance of such a piece
of equipment could be analysed.
Solar PV
It can be seen from Figure 2 that the Solar PV output is at
its maximum output from the months of April to August.
Conveniently this coincides with the poor output from the CHP at
this period, and upon brief inspection one may think that they
complement each other very well.
However, the sheer low energy output from this Solar PV array in
comparison to the energy consumed is very large. If the maximum
cost of electrical units were applied to the cost savings in electrical
consumption that this solar array delivered, it would be no more
than €1000 over the course of a year.
The large drop off in performance for the month of August is
a situation worth investigating. The supplier of this very system
to Tesco monitors the data from this installation and noticed the
drop off also.
Upon inspection it was seen that a large duct was placed directly
in front of the installation (Figure 3). This duct would have had a
large effect on the performance of the array due to its proximity
and large size blocking sunlight.
CHP, Solar PV and the grid supply:
Figure 4 shows the clear picture of the output of the different
electrical sources over the period of almost one year. This picture
shows the general low output of the Solar PV, when it is compared
with the other sources, such as that from the CHP and from the
grid.
Electrical running costs and comparisons
Bettystown and Letterkenny and the Tesco Tramore installation had
their electrical costs and different systems compared in detail
(Figure 5). However, Tesco Tramore is the only one of all three
with a CHP installation.
Electrical costs are on average 37.73% less expensive than that
of the other comparison stores (Figure 6). However, these
measurements and costs are taken directly from the bills, and
though they show the actual consumption of electricity of the
Tesco stores, the results do not take into account the
consumption/generation of the CHP plant. When the offset of the
CHP are taken into account, the actual energy consumption of the
building increases and the energy savings become 24.17%.
CIBSE Sustainable Awards 2011
28
Fig.1: This chart shows the performance of the CHP plant and its generatedkWhrs over its operation. The large dip is due to the thermal requirementdictating its usage and as such during spells of warmer weather the unitswitched off.
Fig. 3: Picture of the obstruction blocking the Solar PV array
Fig. 2: This chart shows the performance of the Solar PV. This particularinstallation behaved exactly as it would be expected. However the sudden dipin August is due to an obstruction placed in its way.
Fig. 4: Chart comparing the performances of the CHP plant, Solar PV and theconsumed grid supply. It can be seen that the solar PV barely makes an impacton the overall consumption of a store this size.
Wegner Tesco:Layout 1 09/09/2011 15:41 Page 28

Internal environment
Even over the cold October/November 2009 period, the main sales
floor area was kept at a constant 20-23oC with the RH rarely going
over 50% (Figure 7). The internal environment is within agreeable
parameters for any store of this nature. The good control of the
internal environment leads to better control over other systems.
The low humidity levels prevent condensation from fogging up the
fridge cabinets and thus the “de-fogging” heating elements from
turning on. This all serves to add to the efficiency of the overall
building, especially when so much of the shop floor is taken up
with fridge cabinets.
General electrical and lighting readings
The source of data that was used to put together the analysis of
electrical readings on site, as seen in Figure 8, was from the
individual metering in order to help Tesco individually monitor
different aspects of the installation. As can be seen the fluctuations
during the course of the day are due to electrical requirements of
an occupied building moving up and down. This would be due to
perhaps ovens being turned on at the bakery and other items,
though more importantly in the sense of the electrical efficiency
the lighting dimming when it receives daylight to its lighting
sensor at the shop floor. The large dips also indicate the night shift
operation of the store, and show a very large decrease in activity
and the lighting lowering its intensity into night time mode.
A review of the Passiv Haus Concept
29
Fig. 5: Comparison of Tesco stores – CHP output has not been added to theoverall consumption of Tesco Tramore
Fig. 6: Percentage less expensive between Tramore and the average costs of thetwo other Tesco stores
Fig. 8: Behaviour of electrical consumption every 30 minute interval
Fig. 9: Total kWhrs from lighting meters (Tramore)
Fig. 10: Total kWhrs from lighting meters (Letterkenny)
Fig. 7: During the cold October/November 2009 period, the main sales floorarea was kept at a constant 20-23oC with the RH rarely going over 50%
Wegner Tesco:Layout 1 09/09/2011 15:41 Page 29

The lighting demand from Tesco Tramore (Figure 9) is showing
behaviours that is somewhat expected. However, lighting seems to
have dropped to zero over the course of three nights. This would
need to be investigated to ensure the veracity of this data, as this
continually happens throughout the data sample collected.
However some behavioural trends can be ascertained. The daylight
dimming can be seen to be in operation during the lower troughs
during the daylight periods. This time sample is taken during the
month of July, where its effects would most likely be most effective.
Letterkenny has also got data for its lighting output
(Figure 10). It can be seen that the lighting does not have any
peaks or troughs other than those apparent from the night shift.
There are small fluctuations, and without being there on the day
these recordings happened it would be impossible to say what
these are. However, it is important to note that the daylight
dimming and any fluctuations in the lighting demand are non-
existent in this store.
Tramore’s energy profile for the lighting is superior in terms of
performance when it comes to energy consumption. The actual
level of consumption is also about 25% lower than that of
Letterkenny, no doubt due to the high efficient T5 lamps and LED
lighting installed throughout the Tesco store.
Comparison of construction cost
The analysis in Table 2 is a breakdown of the cost of the installation
and build compared to that of a standard Tesco store.
Due to commercial sensitivity, only limited information is made
available, though it does give a good indication for the additional
expense that was incurred during this construction.
It is immediately noticeable that every single item on the list was
more expensive than that of the standard Tesco store.
SummarySo in summary Tesco Tramore does seem to be leaning towards
that of an eco-friendly, highly efficient supermarket. This paper
does not claim to be a definitive piece of work on the Passiv Haus
application to a supermarket, but was written with the goal in mind
to show whether or not the initial indications are promising. With
results as can be seen in Table 3 for the energy consumption, the
results are very encouraging indeed.
Limitations and possible future study
It is important to ensure that the point is made that the purpose of
this research is to ascertain the viability of this standard being
applied in the manner discussed. Some clear limitations to the data
is that of using Tesco’s own on-site recording equipment and access
to energy bills for the research. This meant an over reliance on
Tesco themselves, and although they were more than forthcoming
with their help and openness with this information. Some data was
collected first hand by the researcher and this validated some of
Tesco’s data..
For this research to be carried out to it’s fullest, a wider array of
measurement devices would be required. Light meters, humidity
sensors and temperature sensors at more than just two locations
within the store would be required. A thermal-imaging camera
would be extremely useful in order to examine the details of the
construction more clearly. However, the cost of this equipment
would make it prohibitively difficult to get.
Also, more on site testing methods for verifying the electrical and
gas usage would have been desirable.
It is intended by Tesco that this critical evaluation will allow them
improve and enhance what is clearly a very promising innovation.
This is the first supermarket in the world to attempt a Passiv Haus
construction and this research suggests there will be many more in
the future.
CIBSE Sustainable Awards 2011
30
Table 2: Comparison of construction costs for a Passiv Haus supermarket anda standard format star
Cost Analysis
This store is based on 2008 prices, on average prices have fallen 20% since construction
Based on 30,000sq ft retail area store % of standard item
Timber cladding in lieu of Ranila cladding 389%
Cedar louvre to roof plant in lieu of anodosed aluminimum 120%
Timber frame front, bulk store steel frame in lieu of steel 274%
Triple glazing 173%
Increased specification wall and roof cladding for insulation 125%
Mechanical 235%
Electrical 114%
Refrigeration 162%
Signage 128%
Roof overhang 1.45 at gables 110%
Table 3: The electrical consumption of the Tesco stores as kilowatt hours persquare metre of the sales floor area (SFA)
Store Type Sale Floor Electricity Electricity Electricity ElectricityLocation Area [m2] Consumption Consumption Consumption Consumption
Mains Supply (CPH) Total kWh/m2
Tesco Format 2,747.4 1,199,375.17 345,836 1,545,211.17 560Tramore 30Letterkenny/ Format 2683 1947,799.00 0.00 (None 1,947,799.00 726Ballybrack 30 installed)
Wegner Tesco:Layout 1 09/09/2011 15:41 Page 30

Acknowledgements
I would like to thank Tesco and Tesco’s then Energy Manager MichaelMcNerney for their help and permission in accessing the data usedwithin this research.
References[1] SEI, "Action Plan for Implementation of the EU Energy Performance of
Buildings Directive (EPBD) in Ireland," D. o. C. M. a. N. R. EPBD Working Group, Ed., ed. Dublin: Sustainable Energy Ireland (SEI), July 2006, p. 45.
[2] W. Feist, "Passiv Haus Institut," ed, 2009.
[3] E. Parliment, "Report on an Action Plan for Energy Efficiency: Realising the Potential," Committee on Industry, Research and Energy2008.
[4] SEI, "Energy In Business," 2009.
[5] Tesco, "Tesco Presentation on the First Passiv Haus Supermarket in Europe," 2009.
[6] DALI. (2008, 03/02/2010). DALI Control. Available: http://www.dalicontrol.com/dali/whatisdali.htm
A review of the Passiv Haus Concept
31
Wegner Tesco:Layout 1 09/09/2011 15:41 Page 31

Wegner Tesco:Layout 1 09/09/2011 15:41 Page 32

An investigation into why lighting controls fail in buildings
Bernard Doyle BEng Tech, BSc.
Irish Lighter Award winner 2010
Doyle Lighting:Layout 1 09/09/2011 15:48 Page 33
Abstract
The project began as a post-occupancy evaluation of
lighting controls installed in a range of buildings,
including a public office building, a shopping centre
and a primary school. Actual controlled lighting
consumption was to be compared against past billing
or simulated energy consumption. However, when the
research began it was found that the controls had been
removed from two out of the three buildings. Further
research proved that it was not unusual for lighting
controls to be disconnected following installation.
This raised a much bigger research question – why
were the controls disconnected and what were the
factors governing success or failure of these systems?
To answer this new question a new methodology
to that first envisaged had to be established.
Investigating the reasons for disconnection could
only be achieved by discussion with those involved.
To find out what people know, or think, it is
necessary to ask them. Interviewing
was used to address the new research question.
It was found that little research exists on long-term
performance analysis of lighting controls. A
framework was created to determine if there is
correlation between past findings and the reasons
for failure in the case studies. It should be noted that
there were minimal findings into the failure of
lighting controls systems in buildings in Ireland, which
prompted possible additional reasons for the failure
of these systems, e.g. differing usage patterns,
availability of useful daylight.
The research that followed posed many challenges
requiring the use of qualitative data in an
engineering environment. In order to answer the
research question, a clearly-defined and well-
structured methodology was required. It was
concluded from the research that the conceptual
framework used was appropriate and that the
methods were fit for purpose.
Some of the findings included:
• Maintenance costs are comparitively high
• Misinterpretation of commissioning processes
• Incomplete analysis prior to installation
• The requirement for post-occupancy evaluation in
current engineering practices
Key Words:
Daylight controls, daylight harvesting, problematic
controls.
CIBSE Sustainable Awards 2011
34
Doyle Lighting:Layout 1 09/09/2011 15:48 Page 34

1. Introduction
1.1 Basis for studies
This project began as a post-occupancy evaluation of existinglighting control systems in an office space to determine the installedfinancial savings and CO2 emission reduction. Three buildings werechosen as case studies. It was intended to compare the actualconsumption of energy and greenhouse gas emissions due tolighting with automated controls to previous manually-switchedsystems or simulated systems. However, during the initial stages ofdata acquisition it became apparent that a large number ofdevelopments had significant problems with such controls.
The research question then evolved to a much bigger one, i.e. whywere the controls disconnected and what were the factorsgoverning success or failure of these systems? It became apparentthat disconnection was not untypical and although considerableresearch has been conducted into a comparison of control types,little information was available as to the reasons for failure ofsystems within Ireland. Documented evidence of failed systems isalso a rarity. Galasiu et al[1] highlights the lack of availability of information for long-term performance studies of daylightcontrol systems. However, the use of lighting control systems isbecoming more relevant as energy consumption, energy costs andgreenhouse emissions are pushed to the agenda forefront.
This research attempts to address the issues that result in thedisconnection of lighting controls systems in day-to-day use withinbuildings. The research questions investigate why controls weredisconnected from the public office and the shopping centre, butwere successfully deployed in the school.
1.2 How will the research be conducted?
As no recordings had been taken of the operating system, noquantitative data existed. The reasons for disconnection can only be established by discussions with those involved during the design stages and at times when problems arise. A qualitativemethodology was adapted to address the new research question.Interviewing the parties involved was the method proposed toinvestigate how the supplier, designer and end user felt about thereasons for disconnection.
2. Research methodsA new approach was required for gathering data and the reasonsas to why daylight harvesting systems succeed or fail. Severalapproaches were considered and the methods used are explainedbelow.
2.1 Research questions
The methodology and methods in any research will be determinedby the research questions posed. In this research the questions are:
• Why were controls removed from building A?
• Why were controls removed from Building B?
• What are the reasons for the success of the controls in Building C?
• Are the findings of this research in line with past studies?
• Have faults outside the conceptual framework of this research been discovered?
2.2 Methods
2.2.1 Qualitative research
For the buildings chosen the problems arising were not very welldocumented. Little quantitative data was available for any of theselected case studies and information is therefore only accessiblethrough survey or discussion with those involved. The researchmethod chosen is to be a combination of qualitative data and casestudy review or post occupancy evaluation analsysis. According toHancock and Algozzine,[2] these research traditions are generallyclassed separately. However, for the case studies chosen, acombination of both approaches seemed more fitting.
Engineering usually involves mathematical processes to provide a solution to a given problem. Engineers therefore prefer aquantitative approach. It is noted that the use of a qualitativeapproach means that the researcher must …
• have an understanding of the research area
• establish a participant’s knowledge of the subject area
• be aware of any hidden agenda by the participant
• be impartial to information obtained
• be aware of their own feelings on the subject.
2.2.2 Interviews
Individual interviews were chosen as the main method for data acquisition. Interviewing offers the greatest return onanswering of questions as there are numerous techniques such asprobes and prompts to induce more information from theinterviewee, than simple yes or no answers. This can be one of thedownfalls of surveying. Several structures or formats of interviewmay be employed. Robson[3] describes the relevance of structuredversus unstructured interviews and the applications of each.
Semi-structured interview
Pre-determined questions are prepared, but the order can bemodified based upon the interviewer’s perception of what seemsmost appropriate. Question wording can be changed andexplanations given, particular questions which seem inappropriatewith a particular interviewee can be omitted, or additional onesincluded.[3, p.270]
Powney and Watts[4] suggest a different approach, i.e. respondentinterviews and informant interviews. A respondent type approachis where the interviewer maintains control for the duration of theinterview, i.e. questions are somewhat structured and guidedtowards the interviewer’s research or interests. The open questionstyle allows for structuring of the interview but will afford theopportunity to analyse the interviewee’s true knowledge of thesystems and design processes. Face to face interviewing with openstyle questioning allows probing or any questions to be asked thathad not previously been considered.
An investigation into why lighting controls fail in buildings
35
Doyle Lighting:Layout 1 09/09/2011 15:48 Page 35

During the literature review it became apparent that the WeidtGroup’s study into daylight harvesting, as conducted by Ejadi andVaidya’s,[5] appears to be extremely relevant in this field and it is forthis reason that the findings formed the conceptual framework ofthe research in this document.
2.2.3 Interview transcription
Transcribing as close to the interview session as possible enabledinclusion of emotions or any significant other findings that aroseduring the interview, in the transcipts. The main benefits oftranscribing to text were that important findings in the data wasflagged and grouped for further analysis. This is referred to ascoding.
2.2.4 Coding of data
Data was analysed following the logic of coding, i.e. categorisedunder the conceptual framework of Eijadi and Vaidya’s[6].Interviewees‘ responses were analysed under the headings below:
• Lack of coordination or understanding between the design disciplines concerning the daylighting control system;
• Improper location of daylighting controls;
• Inadequate specification of the controls systems, component parameters and sequence of operations;
• Shop drawings made by contractors that detail the system are not checked, or the lighting designer does not know what to check;
• Field changes to tune a system are not documented and taken back to the designer to complete the feedback loop;
• Findings outside of the conceptual framework.
This template approach will make the analysis of the data moresimplistic as questions were specifically created in a templatemanner to receive answers relating to each of therecommendations of Eijadi and Vaidya. An example of which mightbe asking the supplier, designer, facilities manager and client aboutthe specific input of a client or client representative during thedesign stage of the lighting installation. The answers can then becompared under the “Lack of coordination or understandingbetween the design disciplines concerning the daylighting controlsystem” heading.
2.2.5 Reliability and validity of data
It must be noted that any collectable data was based on theexpressed opinions and knowledge of the participant on the givensubject and, as a result, can only be addressed as qualitative data. Inorder to provide a fair argument similar questioning was purpose-fully created for supplier, designer, client and end user of thedifferent case studies. This process, known as a template approachas defined by a study by Crabtree and Miller,[7] also aides coding.
2.3 Addressing the research questions
2.3.1 RQ 1 – Why were controls removed from building A?
Building A is a public office located in South Dublin. Daylighting
controls, presence detection and timed controls were installedthroughout the building. However, due to several problems someof the control features were disconnected. Interviews wereconducted with the facilities manager and the electrical servicesengineer who carried out the design of building A.
2.3.2 RQ 2 – Why were controls removed from building B?
Building B is a shopping centre located in Co Tipperary. Some of thelighting controls were disconnected after a relatively short period oftime following installation. Interviews took place with the centremanager and the electrical services engineer responsible for thedesign.
2.3.3 RQ 3 – Why were controls successful in building C?
Building C is a primary school located in Co Waterford. In contrastto the other post occupancy evaluations carried out in this research,the daylight controls in Building C remain intact. However, theapproach used in Research Questions 1 and 2 above was appliedto Building C also. The aim was to determine if similar designmethods and installation techniques were used as in Buildings Aand B.
Interviews were conducted with the school caretaker to determineif any problems arose and how they were dealt with. Questioningfollowed the same format as that used in Research Questions 1and 2.
2.3.4 RQ 4 – Are findings in line with the research?
Once all interviews had been conducted and transcribed they werecategorised under the findings of the Weidt Group 2004-2005Dimming Study. This allowed for a comparison of successes of the case studies against the recommendations of the Weidt Group studies.
2.3.5 RQ 5 – Have faults outside the framework beendiscovered?
Any other factors of relevance outside the boundaries of thisframework were highlighted and may create a path to furtherresearch areas.
The three buildings used for the case studies included a publicoffice building, a shopping centre and a school, all of which arelocated in southern Ireland. Items such as maintenance costs,feasibility studies and weather patterns do not fall under theconceptual framework and shall be addressed in this research.
3 Data presentation and resultsHaving conducted the interviews with all parties involved, data wasinitially transcribed and then coded under the common headingslisted previously. As discussed in the Research Methods sectionabove, each building was initially analysed separately, under theconceptual framework of this document. This allowed comparisonsto be made between what was stated by the client and what wasstated by the designer. The findings of each case study were thengrouped under the framework headings for further analysis.
CIBSE Sustainable Awards 2011
36
Doyle Lighting:Layout 1 09/09/2011 15:48 Page 36
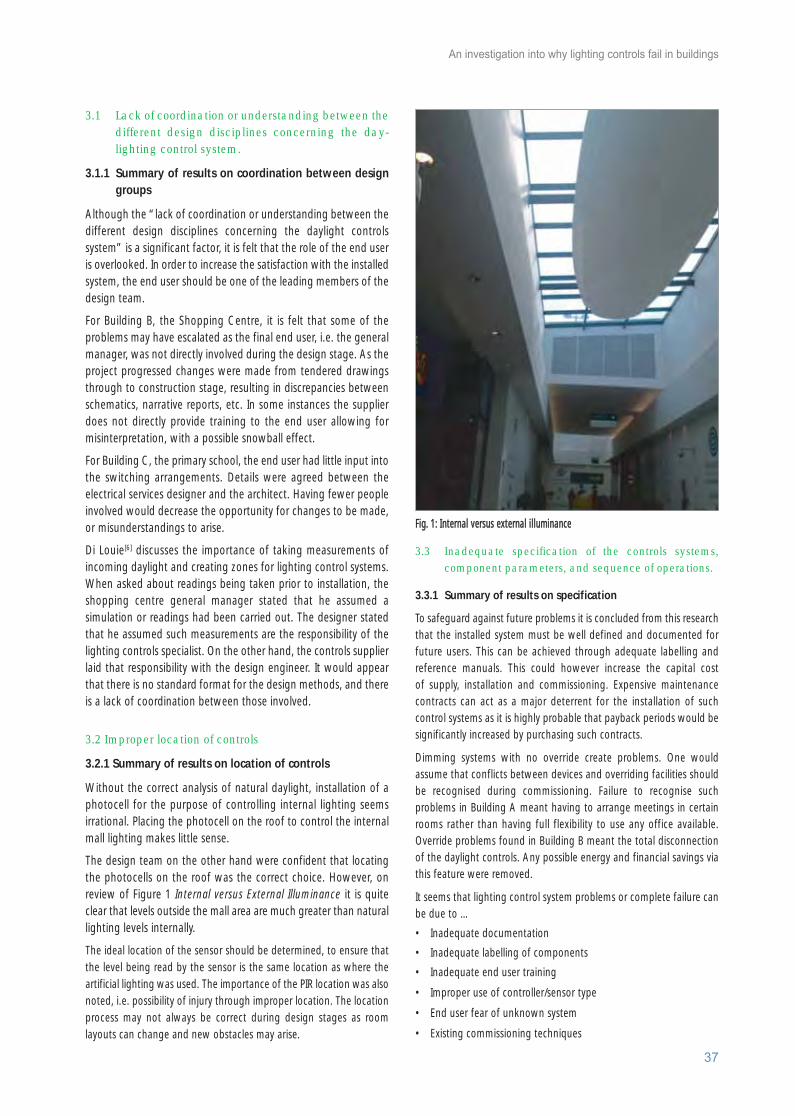
3.1 Lack of coordination or understanding between the different design disciplines concerning the day-lighting control system.
3.1.1 Summary of results on coordination between design groups
Although the “lack of coordination or understanding between thedifferent design disciplines concerning the daylight controlssystem” is a significant factor, it is felt that the role of the end useris overlooked. In order to increase the satisfaction with the installedsystem, the end user should be one of the leading members of thedesign team.
For Building B, the Shopping Centre, it is felt that some of theproblems may have escalated as the final end user, i.e. the generalmanager, was not directly involved during the design stage. As theproject progressed changes were made from tendered drawingsthrough to construction stage, resulting in discrepancies betweenschematics, narrative reports, etc. In some instances the supplierdoes not directly provide training to the end user allowing formisinterpretation, with a possible snowball effect.
For Building C, the primary school, the end user had little input intothe switching arrangements. Details were agreed between theelectrical services designer and the architect. Having fewer peopleinvolved would decrease the opportunity for changes to be made,or misunderstandings to arise.
Di Louie[6] discusses the importance of taking measurements ofincoming daylight and creating zones for lighting control systems.When asked about readings being taken prior to installation, theshopping centre general manager stated that he assumed asimulation or readings had been carried out. The designer statedthat he assumed such measurements are the responsibility of thelighting controls specialist. On the other hand, the controls supplierlaid that responsibility with the design engineer. It would appearthat there is no standard format for the design methods, and thereis a lack of coordination between those involved.
3.2 Improper location of controls
3.2.1 Summary of results on location of controls
Without the correct analysis of natural daylight, installation of aphotocell for the purpose of controlling internal lighting seemsirrational. Placing the photocell on the roof to control the internalmall lighting makes little sense.
The design team on the other hand were confident that locatingthe photocells on the roof was the correct choice. However, onreview of Figure 1 Internal versus External Illuminance it is quiteclear that levels outside the mall area are much greater than naturallighting levels internally.
The ideal location of the sensor should be determined, to ensure thatthe level being read by the sensor is the same location as where theartificial lighting was used. The importance of the PIR location was alsonoted, i.e. possibility of injury through improper location. The locationprocess may not always be correct during design stages as roomlayouts can change and new obstacles may arise.
3.3 Inadequate specification of the controls systems, component parameters, and sequence of operations.
3.3.1 Summary of results on specification
To safeguard against future problems it is concluded from this researchthat the installed system must be well defined and documented forfuture users. This can be achieved through adequate labelling andreference manuals. This could however increase the capital cost of supply, installation and commissioning. Expensive maintenancecontracts can act as a major deterrent for the installation of suchcontrol systems as it is highly probable that payback periods would besignificantly increased by purchasing such contracts.
Dimming systems with no override create problems. One wouldassume that conflicts between devices and overriding facilities shouldbe recognised during commissioning. Failure to recognise suchproblems in Building A meant having to arrange meetings in certainrooms rather than having full flexibility to use any office available.Override problems found in Building B meant the total disconnectionof the daylight controls. Any possible energy and financial savings viathis feature were removed.
It seems that lighting control system problems or complete failure canbe due to …
• Inadequate documentation
• Inadequate labelling of components
• Inadequate end user training
• Improper use of controller/sensor type
• End user fear of unknown system
• Existing commissioning techniques
An investigation into why lighting controls fail in buildings
37
Fig. 1: Internal versus external illuminance
Doyle Lighting:Layout 1 09/09/2011 15:48 Page 37
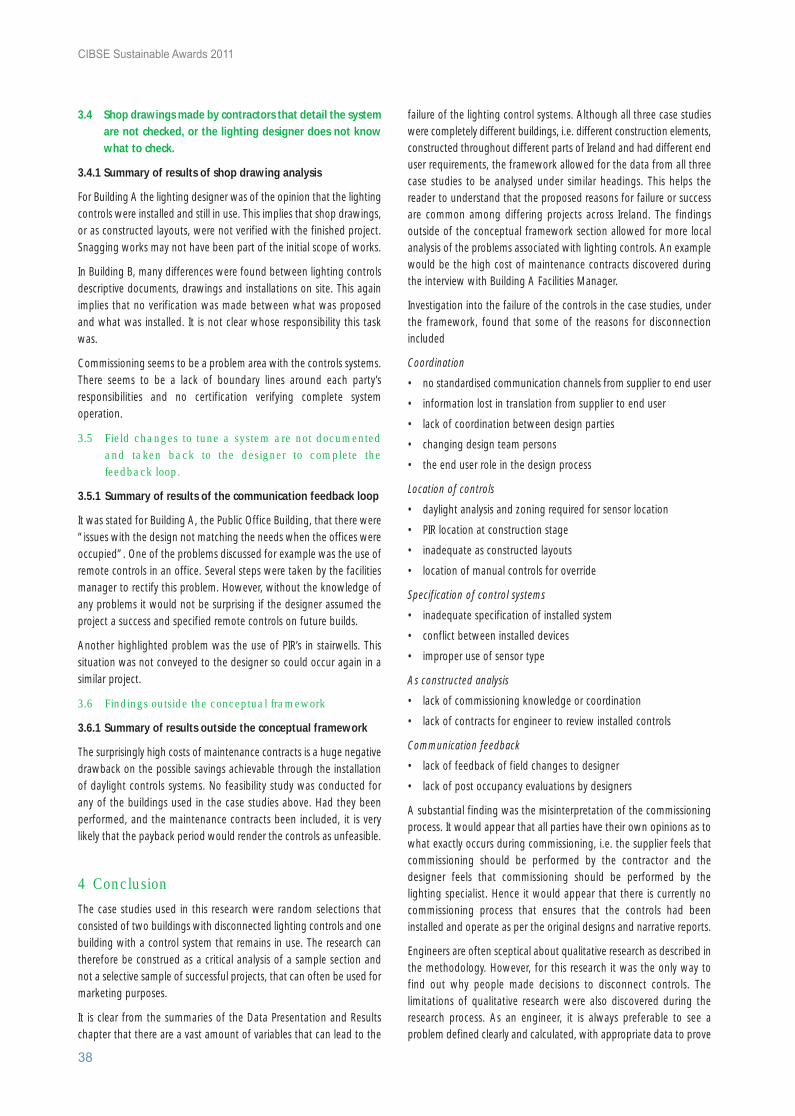
3.4 Shop drawings made by contractors that detail the system are not checked, or the lighting designer does not know what to check.
3.4.1 Summary of results of shop drawing analysis
For Building A the lighting designer was of the opinion that the lightingcontrols were installed and still in use. This implies that shop drawings,or as constructed layouts, were not verified with the finished project.Snagging works may not have been part of the initial scope of works.
In Building B, many differences were found between lighting controlsdescriptive documents, drawings and installations on site. This againimplies that no verification was made between what was proposedand what was installed. It is not clear whose responsibility this taskwas.
Commissioning seems to be a problem area with the controls systems.There seems to be a lack of boundary lines around each party’sresponsibilities and no certification verifying complete systemoperation.
3.5 Field changes to tune a system are not documented and taken back to the designer to complete the feedback loop.
3.5.1 Summary of results of the communication feedback loop
It was stated for Building A, the Public Office Building, that there were“issues with the design not matching the needs when the offices wereoccupied”. One of the problems discussed for example was the use ofremote controls in an office. Several steps were taken by the facilitiesmanager to rectify this problem. However, without the knowledge ofany problems it would not be surprising if the designer assumed theproject a success and specified remote controls on future builds.
Another highlighted problem was the use of PIR’s in stairwells. Thissituation was not conveyed to the designer so could occur again in asimilar project.
3.6 Findings outside the conceptual framework
3.6.1 Summary of results outside the conceptual framework
The surprisingly high costs of maintenance contracts is a huge negativedrawback on the possible savings achievable through the installationof daylight controls systems. No feasibility study was conducted forany of the buildings used in the case studies above. Had they beenperformed, and the maintenance contracts been included, it is verylikely that the payback period would render the controls as unfeasible.
4 ConclusionThe case studies used in this research were random selections thatconsisted of two buildings with disconnected lighting controls and onebuilding with a control system that remains in use. The research cantherefore be construed as a critical analysis of a sample section andnot a selective sample of successful projects, that can often be used formarketing purposes.
It is clear from the summaries of the Data Presentation and Resultschapter that there are a vast amount of variables that can lead to the
failure of the lighting control systems. Although all three case studieswere completely different buildings, i.e. different construction elements,constructed throughout different parts of Ireland and had different enduser requirements, the framework allowed for the data from all threecase studies to be analysed under similar headings. This helps thereader to understand that the proposed reasons for failure or successare common among differing projects across Ireland. The findingsoutside of the conceptual framework section allowed for more localanalysis of the problems associated with lighting controls. An examplewould be the high cost of maintenance contracts discovered duringthe interview with Building A Facilities Manager.
Investigation into the failure of the controls in the case studies, underthe framework, found that some of the reasons for disconnectionincluded
Coordination
• no standardised communication channels from supplier to end user
• information lost in translation from supplier to end user
• lack of coordination between design parties
• changing design team persons
• the end user role in the design process
Location of controls
• daylight analysis and zoning required for sensor location
• PIR location at construction stage
• inadequate as constructed layouts
• location of manual controls for override
Specification of control systems
• inadequate specification of installed system
• conflict between installed devices
• improper use of sensor type
As constructed analysis
• lack of commissioning knowledge or coordination
• lack of contracts for engineer to review installed controls
Communication feedback
• lack of feedback of field changes to designer
• lack of post occupancy evaluations by designers
A substantial finding was the misinterpretation of the commissioningprocess. It would appear that all parties have their own opinions as towhat exactly occurs during commissioning, i.e. the supplier feels thatcommissioning should be performed by the contractor and thedesigner feels that commissioning should be performed by the lighting specialist. Hence it would appear that there is currently nocommissioning process that ensures that the controls had beeninstalled and operate as per the original designs and narrative reports.
Engineers are often sceptical about qualitative research as described inthe methodology. However, for this research it was the only way tofind out why people made decisions to disconnect controls. Thelimitations of qualitative research were also discovered during theresearch process. As an engineer, it is always preferable to see aproblem defined clearly and calculated, with appropriate data to prove
CIBSE Sustainable Awards 2011
38
Doyle Lighting:Layout 1 09/09/2011 15:48 Page 38

a theorem. Without sufficient data a different approach is required.Qualitative data is not conclusive and often needs to be formallysupported by quantitative data. It must also be recognised that in orderto explore what happened, and to establish personal opinions andfeelings in a given situation, a qualitative approach offers the possibilityof rich and insightful findings.
It is concluded from this research that the framework used wasappropriate with methods fit for purpose. It was found that most faultsor problems fit within the confines of the headings used within theconceptual framework. Coding was made easier through use of theheadings, and data could be easily categorised and evaluated.
Post occupancy evaluation is not a common process in the constructionindustry and one would imagine that through adequate feedbackchannels most of the existing problems in current developments couldbe overcome in future builds by using accumulated data from postoccupancy evaluations..
It is hoped that this research can be used as an aid to designers,installers and future research studies to increase the amount of dataavailable on lighting control systems and eradicate minor problems thatsometimes end up resulting in the total disconnection of controls.Solving these problems may increase the uptake of lighting controlson a national level and so help to reduce energy consumption and CO2emissions as per government targets. Studies into a facility forfeedback of realtime savings to the end user, along with further long-term assessment performance studies, could also have a substantialimpact on the uptake of daylight controls systems.
References[1] A. D. Galasiu, et al., Energy Saving Lighting Control Systems for Open-Plan Offices: A Field Study, vol. 4, 1 ed: Leukos, 2007, pp. 7-29.
[2] D. R. Hancock and R. Algozzine, Doing case study research: a practicalguide for beginning researchers. New York: Teachers College; London:Eurospan [distributor], 2006.
[3] C. Robson, Real world research: a resource for social scientists andpractitioner-researchers, 2nd ed. ed. Oxford, UK; Madden, Mass: BlackwellPublishers, 2002.
[4] J. Powney and M. Watts, Interviewing in educational research. London:Routledge & Kegan Paul, 1987.
[5] C. DiLouie, Lighting controls handbook. Lilburn, GA: Fairmont Press,2007.
[6] C. DiLouie. (2006, 2nd March). Why Do Daylight Harvesting ProjectsSucceed or Fail? Available: http://ecmweb.com/construction/electric_why_daylight_harvesting/
[7] B. F. Crabtree and W. L. Miller, Doing qualitative research. Newbury Park,California; London: Sage Publications, 1992.
An investigation into why lighting controls fail in buildings
39
Doyle Lighting:Layout 1 09/09/2011 15:48 Page 39

CIBSE Sustainable Awards 2011
Irish Young Lighter & Irish Lighter AwardsThese awards – jointly promoted by CIBSE, SLL and ILP – are anannual event with the finals and presenta�on of prizes being heldeach September in DIT Kevin St. Typically, the programme of eventsis as follows:
2.00pm Young Lighter final begins
4.40pm Announcement of winners and presen�on of prizes
5.30pm Tea/coffee, sandwiches served
6.30pm Irish Lighter final begins
8.25pm Announcement of winners and presen�on of prizes
8.30pm Wine and finger food Recep�on in Kevin Street penthouse
10.00pm CloseSPONSORS:
Young Irish Lighter & Irish Lighter Awards 2011
Irish Young Lighter Irish Lighter
First Prize e1000 First Prize e1000presented by ILP presented by Enlighten
Generous prizes for Generous prizes forrunners-up runners-up
presented by ILP presented by ILP& CIBSE Ireland & CIBSE Ireland
40
Professional LED & Architectural Lighting
The Chartered Institution of BuildingServices Engineers
Republic of Ireland Branchand
The Society of Light and Lightingpresent the
School ofElectricalEngineeringSystems, DIT
Doyle Lighting:Layout 1 14/09/2011 14:31 Page 40

An examination into the use of compactfluorescent lamps in the domesticenvironment
James Thomas Duff BEng Tech, BSc.Department of Electrical Services Engineering, Dublin Institute of Technology, Kevin St, Dublin 8, Ireland
Young Irish Lighter Award winner 2010
Flourescent Lighting:Layout 1 09/09/2011 15:52 Page 41

Abstract
The Irish government, UK government and European
Commission have recently passed a ban on the sale
of all incandescent/GLS lamps above 100W. This
commenced in September 2009, with smaller
wattages to be phased out by 2012.
This paper sets out to investigate if compact
fluorescent lamps (CFLs) are an adequate, suitable
and appropriate replacement for GLS lamps in
domestic environments. An overview of CFL
performance is undertaken, initially through a
literature review and then through laboratory
measurements. The findings of this are insightful
for all readers using CFLs in their homes.
In-depth research was carried out to examine CFLs,
power factor, harmonic distortion and their likely
effects on the national grid. The possible risk of an
overloaded three-phase neutral conductor are also
evaluated, which provides useful information for
electrical services design engineers.
1. IntroductionThe most popular replacement for GLS lamps appears to be CFLs. This paper will set out to investigate if CFLs are an adequate, suitable and appropriate replacement for GLS lamps in the domestic environment. Initially a literature review will be compiled in an attempt to highlight some of the majorissues associated with CFLs. The headings examined are out-lined below:
2.1 – Efficacy 2.7 – Total Lumen Output
2.2 – Embodied Energy 2.8 – Ultraviolet Radiation
2.3 – Illuminance 2.9 – Mercury and Re-Cycling
2.4 – Manufacturer Wattages 2.10– Power Factor
2.5 – Lamp Life 2.11– Total Harmonic Distortion
2.6 – Colour Rendering and 2.12– Pricing and CostsColour Temperature
The literature review conducted indicated a shortage of researchfindings with respect to power factor, harmonic order currents andlevels of total harmonic distortion produced by commerciallyavailable CFLs. Experiments were conducted to quantify all three and conclusions were drawn from the results obtained. A set of fifteen CFLs and three GLS lamps were used for allexperiments.
Accurately measuring the true power factor of any non-linear load requires root mean squared (RMS) measurements. Standardelectrical instruments are only capable of quantifying displacementpower factor, while true RMS instruments allow for the inclusion of system harmonics and hence, measure true power factor.Incorporating a true RMS voltmeter, a true RMS amp meter, a variacto stabilise the supply voltage and a wattmeter, to a circuitcontaining a lampholder allowed for accurate measurement of trueCFL and GLS power factor.
Individual harmonic order currents and THD levels were recordedusing a single circuit, with different methods of measurement.Again true RMS instrumentation is necessary to give accurateresults. Four methods were used to try and assess the harmonicpatterns produced by the CFLs tested, namely: two power factormeters (one analogue and one digital), an oscilloscope and awattmeter plus true RMS volt and amp meters.
2. Literature review
2.1 Efficacy
There appears to be a general consensus that CFLs will providequite large energy savings over incandescent lamps. Figures around80%[4] and 75%[5] are often suggested. Table 1, from the Lighting
CIBSE Sustainable Awards 2011
42
Flourescent Lighting:Layout 1 09/09/2011 15:52 Page 42

Association[24] shows direct comparisons between lamp type/lampwattage and lumen output.
It is clear from this that significant savings, due to improved efficacy,can be made from the use of CFLs. The European Commission, theEnergy Savings Trust and manufacturers say CFLs use up to 80%less electricity than traditional bulbs, but Kevan Shaw[7] questionshow this figure is calculated. According to a spokeswoman for theEuropean Commission, it is calculated “by comparing the bestcompact fluorescent lamps wattage with the wattage of anequivalent incandescent bulb”[6]. This method results in a 5:1efficacy ratio between the two types of lamp – a claim theEuropean Commission itself says is an exaggeration whenmanufacturers use it. It is the “up to” in this 80% claim that is important. The EC spokeswoman says the saving can be as low as 60%[6].
2.2 Embodied energy and pollutants
Another issue is the embodied energy needed to create a CFL.Manufacturers claim that the energy input required to construct aCFL is six times that required to produce a GLS lamp[7]. This wouldof course be offset by the CFLs longer life, i.e. the CFL will last sixtimes longer. Table 2 shows figures from VITO[7], an environmentalresearch organisation working for the European Commission,which compare energy used in the manufacture of GLS lamps and CFLs
It is clear from these figures that the energy needed to produce aCFL is up to 12 times that needed to produce a GLS lamp.
However, the lifetime embodied energy lost in the manufacture ofCFLs (1.5-2kWh max) seems insignificant when one considers thata 100W GLS lamp uses approximately 100kWh per annum and a20W CFL uses about 20kWh, a saving of 80kWh per annum, or480kWh over six years.
2.3 Illuminance
A recent undergraduate study carried out at The Dublin Institute of Technology[8] compared illuminances from GLS lamps and“equivalent” wattage CFLs. Nine lamps were used, three 100WGLS and six 20W CFLs.
It was found that the CFLs produced 50-60% less light on a surface at a distance of 40cm, than the GLS lamps. The averageGLS value was 778 lux, compared to 367 from the “equivalent”wattage CFLs. However, a more recent undergraduate study at The Dublin Institute of Technology[9] has shown slightly different results. Browne[9] found that illuminance levels were much more comparable (±20%). This may show an improvementin performance in the time between the two studies, or possibly illustrate the variation between individual lamps andmanufacturers. Some tests were conducted for this paper, but theiraccuracy was considered unreliable and excluded for that reason.Overall it appears that CFLs do produce slightly lower illuminancelevels than their so claimed “equivalent” GLS lamps.
2.4 Manufacturer stated “equivalent” wattages
Some users complain that the light quality emitted from CFLs is poor and not as bright as their “equivalent” GLS lamps[4]. This may be due to the method of comparison between the twolamps and wattages. CFLs are compared to “soft output” lamps,which have a lower light output (see Table 1 from The LightingAssociation)[7][24]. The initial lumen output of each lamp should alsobe considered. Shaw[7] claims “manufacturers set the equivalence
An examination into the use of compact fluorescent lamps in the domestic environment
43
Table 1: The Lighting Association, Amended to Include Efficacies[24]
Description Wattage Lumen Output (lm) Efficacy (lm/W)
Incandescent/GLS 25 225 9.040 420 10.560 710 11.875 940 12.5
100 1360 13.6150 2180 14.5
Incandescent – Soft Output 25 200 8.040 370 9.360 630 10.575 840 11.2
100 1200 12.0CFL – Stick Shape 5 230 46.0
8 420 52.511 600 54.514 810 57.918 1100 61.1
CFL – Bulb Shape 5 200 40.08 380 47.5
12 610 50.816 815 50.920 1160 58.0
CFL – Spiral Shape 5 300 60.08 500 62.5
12 725 60.415 1000 66.720 1350 67.523 1550 67.4
Table 2: Embodied energy
Energy used in manufacture Pollutants created in manufacture
GLS = 1MJ of 0.28kWh GLS = 5mg – none hazardous
CFL = 12MJ or 3.33kWh CFL =128mg of which 78mg is hazardous
Table 3: Bernie Illuminance Comparison[8]
GLS Lamps Illuminance (Lux)
Solas 760
General Electric 687
Tesco Generic 887
CFLs Illuminance (Lux)
Omnicron 490
Philips 435
B & Q 346
General Electric 398
Philips Soft Tone 572
Solas 362
Flourescent Lighting:Layout 1 09/09/2011 15:52 Page 43

of output to the worst incandescent lamps, with colour coatings”.He backs this up with a simple example:
• A 12W CFLi at 660lm is advertised as the equivalent of a 60W GLS at 710lm.
• A 21W CFLi at 1230lm is advertised as the equivalent of a 100W GLS at 1340lm.
This raises issues, but it would seem that manufacturers are just trying to provide a simple method of comparison that is easily understood by lay people. However, it may suggest thatmanufacturers claims of 5:1 energy savings are closer to 4:1.
2.5 Lamp lifespan
It is claimed by manufacturers that CFLs can “increase lifespan by a factor of 6 to 12 times that of an incandescent lamp”[4].Lifespan for a lamp is generally stated in hours and for CFLs isusually between 4,000 and 12,000 hours. However, CFLs onlymanage 85% of their output at 2,000 hours[7]. Hence, what willtheir lumen output be at 12,000 hours and will this output besufficient to avoid replacing the lamp? Another complaint is thatsome CFLs burn out far earlier than their estimated lifespan. Abranded bulb from a well-known manufacturer may last the fullestimated lifespan, but a budget lamp from the local supermarketmay not. Even branded bulbs don’t always last as long as expectedand this is because the estimated lifespan is an average[7]. Duringthe testing of a batch of bulbs, they are switched on for threehours, then off for twenty minutes and this process is repeated over and over until half the batch has failed. This point is thenconsidered to be the average lifespan[5]. With this in mind, it mustbe considered that any given bulb could fail at a possible 2,000hours, when its estimated lifespan is 10,000 hours. However, theLighting Industry Federation says, “the main manufacturers do their best to make bulbs that cluster around the average lifemark”[10]. With the above considered, it is clear that CFLs have afar increased lifespan compared to GLS lamps, but individual CFLlifespan is a variable.
2.6 Colour rendering index and colour temperature
It is clear that the colour rendering of any CFL is poor compared to a GLS lamp[11]. In a recent study at The Dublin Institute ofTechnology[8], spectral irradiances in the photopic ranges wereinvestigated. Rather than the CFL spectral curve following a curvesimilar to a Planckian radiator, as with a GLS lamp, the CFLs showedpeaks in spectral irradiance separated by regions of little or noirradiance[8]. Beirnie showed that the CFLs tested had an averageCRI of 72.1[8]. The reason for this is that the CFLs produced anincomplete spectrum, while the GLS lamps produced a completespectrum (Figure 1)[8]. A more recent study at The Dublin Instituteof Technology[9] produced similar results to Beirne. Browne[9]
measured the spectral irradiance of 50 CFLs and found an averageCRI of 77.4. Values ranged from 58.4 to 83.2, although thisaverage value is below the CRI of 80 required by the EU, forcompliance with the EU quality charter of CFLs[9]. The CFL spectrumlacked the higher wavelengths and hence, the colour red, whichour eyes detect as being the warmest. This lack of red light in the
CFL spectrum goes a long way to helping us understand theircolour appearance and cool colour temperature when compared toa GLS lamp.
2.7 Total lumen output
To measure the luminous flux of any CFL would require anexpensive integrating sphere for the spectroradiometric systemused in both Browne and Bernies’ studies. This could calculate theluminous flux emitted into the entire region (sphere) around thebulb[9]. However, due to the expense, not many, if any independentstudies are publicly available that accurately measure the luminousflux of CFLs. The measurement of illuminance offers a pragmaticvalidity check for this research.
2.8 Mercury and re-cycling
CFLs use mercury vapour and the question arises of what to dowith spent lamps? Mercury is an emotive subject and the generalpublic are aware that heavy metals are potentially dangerous.Figures for mercury content per CFL range between 1.5mg and 6mg, in gaseous or liquid form[7][12]. However, according toEuropean Commission Directive 2002/95/EC[26] on the restrictionof hazardous substances in electrical and electronic equipment(RoHS Directive), mercury content in CFLs is limited to 5mg[26]. Anindicative benchmark (best available technology) of 1.23mg ofmercury in energy efficient CFLs is provided in the above mentioned
CIBSE Sustainable Awards 2011
44
Table 4: Beirnie CRI Results[8]
Figure 1: Spectral irradiance of CFLs and GLS[8]
GLS Lamps Colour Rendering Index
Solas 99
General Electric 99.5
Tesco Generic 99.5
CFLs Colour Rendering Index
Omnicron 80
Philips 79
B&Q 77
General Electric 45
Philips Soft Tone 79
Solas 78
Flourescent Lighting:Layout 1 09/09/2011 15:52 Page 44

Ecodesign Regulation (Annex IV)[26]. Simpson provides variouspoints that could be made to argue the effects of mercury vapourin CFLs[12]:
• The “pro CFL” lobby claims that the amount of mercury thatmight get into the environment as a result of CFL use is far less than the quantity of mercury that power stations would put into the atmosphere in order to provide the extra energy needed to power GLS lamps.
• The “anti CFL” lobby claims that an estimated 176 tons of mercury will end up in our landfills annually in Europe as a result of the disposal of CFLs.
• It is stated that elemental mercury, as would be emitted from power stations to the atmosphere, is less harmful than organic mercury compounds that arise from landfill mercury by microbial action.
Energystar®, a U.S Environmental Protection Agency[25] providesfigures on how it believes CFLs will cut down on mercury emissionscompared to GLS lamps. It compares a 13W CFL and a 60W GLS lamp.
Energystar® states that electricity generation is the single biggestsource of mercury emissions in the U.S.[25]. It believes that the 13WCFL above will save 374kWh over its’ lifetime, thus avoiding 4.0mgof mercury emissions through generation[25]. This figure will drop ifthe bulb goes to landfill.
Assuming manufacturers’ figures are correct, then to replace the2.1 billion incandescent lamps sold each year, about 350 millionCFLs will have to be sold annually[7]. This means that in a few years,almost 350 million CFLs will reach their end of life cycle. While themethods for recycling of fluorescent lamps have become wellestablished in industry and commerce, the domestic consumer islikely to dispose of CFLs in their non-recyclable refuse bag. This will
result in either landfill or incineration for most CFLs. This is possiblythe worst way of disposing of mercury. In landfill, certain microbesdigest mercury and excrete it as methyl mercury, a compoundalmost twenty times more toxic than metallic mercury[7]. Methylmercury is easily soluble and could leak out of the landfill into watercourses and eventually the sea, where it may get into fish and couldpossibly become poisonous to humans that consume these fish[7].It is also not particularly clear what the recycling process willactually do with CFLs. Apart from mercury, CFLs include plastic andelectronic components, which may be uneconomical to recycle inany way[12]. Shaw believes that there are limited paths for recyclingand in his experience, many lamp recycling companies will not takeCFLs and those that do can charge substantial sums, between£0.50 and £1.00 per lamp[7]. A local lamp recycling companyprovided details about the process that they use for recycling CFLs.Their method is almost identical to that described by Shaw[7]. Theballast is not separated from the lamp, but rather the entire lampis crushed and materials then separated. The glass element of theCFL can’t be re-used as glass due to the phosphors used to containultraviolet radiation, but Shaw[7] states that this can still be usedfor some construction materials like road paint and wool insulation.The mercury contained within the CFL is mixed in with thephosphors and glass particles and the local lamp recycling companyuses a distillation process to remove it. The control gear and plasticcomponents are then shredded and heated to extract solder andother low melting point metals, as the plastics are largely burnedin the process. The remains, with the ferrous metals extracted, arethen sent to landfill. Shaw claims that there is probably less than1gm of fully recyclable material recovered from each lamp thattypically weighs around 80gm[7]. The local lamp recycling companywas unwilling to disclose exact information on this. It should alsobe noted that this particular company charges e0.95 per CFL, butanother major retailer in Dublin offers a recycling service free ofcharge for CFLs that are purchased in its store.
2.9 Ultraviolet radiation (UVR)
For some time there has been an awareness of the negative effectsof ultraviolet radiation on human health. Most notorious are theacute erythemal effects, such as sunburn and skin cancer. TheInternational Commission for Non-Ionising Radiation Protection(ICNIRP) and the World Health Organisation recommend a dailyeffective irradiance of 30Jm-2 in the ultraviolet radiation range[14].Recent research at The Dublin Institute of Technology[15] and by TheUK Health Protection Agency[16] have analysed the spectralirradiance of a group of commercially available CFLs. Both studiesfound similar and interesting results. Because of their mercurycontent, the CFLs emitted significant quantities of UVA, epically at365nm. Many of the CFLs had sizeable outputs at 313nm (UVB)and in some cases, at 254nm (UVC). The ultraviolet radiationemitted from the double envelope CFLs was much reduced whencompared with that emitted from the single envelope CFLs[15][16][9].Table 6 and Figure 2 are taken from Cantwells’[15] study and give further details indicating exact quantities, in mWm2, ofultraviolet radiation emitted at specific wavelengths and the Mean Spectral Irradiance.
An examination into the use of compact fluorescent lamps in the domestic environment
45
Figure 2: Energystar stated mercury emission savings[25]
Table 5: Energystar mercury emission comparison[25]
Light Bulb Watts Hours kWh National Mercury Mercury TotalType of Use Use Average from from Mercury
Mercury Electricity Land (mg)Emissions Use Filling(mg/kWh) (mg) (mg)
CFL 13 8,000 104 0.012 1.2 0.6 1.8Incandescent 60 8,000 480 0.012 5.8 0 5.8
Flourescent Lighting:Layout 1 09/09/2011 15:52 Page 45

In Cantwells’ study, the biologically effective exposure from each lamp was assessed using the ICNIRP weighting function[14]
and compared to exposure limit values to evaluate potentiallyhazardous exposures. No double envelope CFL exceeded the limit value of 30Jm-2 at 200mm from the lamp within eight hours[15][16][9]. However, 9.4% of the single envelope CFLs exceededthe ICNIRP limit value in less than eight hours (Table 7)[15]. Similarresults were found in other studies[15][9]. This may be due toincorrect or incomplete application of the phosphors coating to the CFL envelope. The Artificial Optical Radiation Directive[20] hasbecome law throughout the European Union as of the 27 April2010. The Directive requires businesses, including those based inthe home, to limit the exposure of workers to optical radiation,including exposure to ultraviolet radiation hazards from generallighting. Since the exposure limits are based on the ICNIRP values,this research may be of significance in this regard. Long term eyeexposure at 200mm from a lamp, or in a close proximity to the source, is unlikely due to the eyes’ aversion response to a bright source. However, unintentional long-term skin exposure isforeseeable at close distances from the CFLs, e.g. hands under adesk lamp or short-term activity near the source. It should also benoted that exposure levels may be substantially increased byreflection from a lamp shade or a luminaire reflector[16]. The aboveconsidered, The UK Health Protection Agency recommends adistance of >30cm from CFLs for area and task lighting[16].
2.9.1 Persons with photosensitive disorders
Ultraviolet radiation is particularly hazardous to those with photo-sensitive skin disorders, such as lupus erythematosus, xeroderma
pigmentosum and skin cancer[27][28]. Although exposure limits havebeen established for people with normal skin, they have not been determined for those with photosensitive disorders[27][28].Sayre[28] states: “UV exposure in doses similar to those emitted from CFLs have been shown to induce DNA damage, tumour formationand erythemal. Additional studies must be done to determine the lowest dose capable of causing damage in photosensitivepatients”. Until these studies are conducted, it is widelyrecommended that patients with photosensitive disorders use bulbsthat emit the lowest levels of ultraviolet radiation with a glassenvelope or filter[27][28][29]. CFLs will obviously not fall into thiscategory. GLS lamps are recommended where possible[27][28][29].Failing this, Sayre recommends that Halogen lamps should be“doped or covered with glass prior to use”[27].
2.10 Power factor
It is claimed that GLS lamps have a power factor of unity, or closeto unity[4][5][7]. There is concern that CFLs have a poor powerfactor[4][5][7]. As power factor reduces, apparent power increases andall components in a distribution system, such as generators,conductors, transformers and switchgear need to be increased insize. The literature review conducted indicated a shortage inpublicly available results for the direct measurement of CFL powerfactor. It is for this reason that this research addresses themeasurement of power factor in detail.
2.11 Total harmonic distortion (THD)
Many loads connected to the national grid require a continuoussinusoidal power supply and if the power quality of the grid isallowed to deteriorate, it could have significant costs associatedwith it. The current waveform drawn from the supply by a CFL isnot even close to sinusoidal (as the electronic CFL draws current inbursts) and if used in large numbers, could be constantly returningdirty power to the national grid. An independent study in NewZealand proved that on a 300kVA supply, a total of 33.4kVA(18.4kW) of CFLs produced 5% total harmonic distortion (THD),which exceeded the national limit on THD[19]. The Europeanstandards are more lenient for low order harmonics and THD than in New Zealand[19]. New Zealand has a large HVDC inter-connector between its’ North and South islands and it is for thisreason that their harmonic limits are so stringent. Watson believesthat widespread use of CFLs will cause significant deterioration inthe quality of power supplied by utility companies[19].
It would seem obvious that prevention is far more costly thanfinding a solution for the problem. This research performs harmonicmeasurement and analysis to assess the possible impact CFLs willhave on power quality before they come into widespread use.
2.12 Pricing and costs
There are many varieties of CFLs on the market at the moment andthey vary in price. Prices in Ireland, appear to be as low as e0.99and as high as e8.95. From this it seems that the market price maynot be determined by the cost of the product, but in turn by theretailers and manufacturers’ profit margins. It appears that the
CIBSE Sustainable Awards 2011
46
Table 6: Mean total irradiance (mWm-2)
UVC UVB UVA Mean EffectiveDistance = 20mm (250-280mm) (280-315mm) (315-400mm) Irradiance
Single Envelope 0.52 570 7900 13Double Envelope 0.37 20 2100 0.46Distance = 200mmSingle Envelope 0.49 15 170 0.43Double Envelope 0.36 0.87 66 0.09
Figure 3: Spectral irradiance of a 20W CFL (blue)
Distance from long axis <8 hours 8-10 hours >10 hoursof CFL = 200mm
% Single Envelopes 9.4 5.6 85
% Double Envelopes 0.0 0.0 100
Table 7: Time to exceed the ICNIRP Exposure Limit value of 30Jm-2 at 200mm
Flourescent Lighting:Layout 1 09/09/2011 15:52 Page 46

typical mark up in the UK is 500%[7]. With such a high mark up,one must wonder about the quality of product being purchased by the retailer and sold to the consumer. Running costs for CFLsmust also be questioned. If the true wattage of CFLs is not as stated by manufacturers, then the running costs will bealtered accordingly.
3. The researchA set of 15 CFLs and three GLS lamps are used for all experimentsunless stated otherwise.
Research questions
3.1 What is the measured wattage and true power factor for a group of commercially-available CFLs in Ireland?
3.2 What are the levels of THD being produced by the tested CFLs and what effect will this have on the supply utility distribution system?
3.3 What is the actual “warm up time” for most CFLs?
3.4 How much variation, in price, exists between the similar CFLs and different manufactures?
3.5 What are the running costs and true CO2 savings from domestic CFLs?
3.1 Power factor
Power factor is defined as the ratio of the real power (W) flowingto a load, to the apparent power (VA) in the circuit[13][25]. It is adimensionless number between 0 and 1. Real power is the capacityof the circuit for performing work in a particular time. Apparentpower is the product of the current and voltage of the circuit. Thisresearch examines the power factor of a group of 15 CFLs andthree GLS lamps.
Methodology
1. Circuit set up as in Figure 4 and Figure 5.
2. Time was allowed for any inrush currents to steady and values were then recorded for wattage, current, voltage and power factor for all fifteen CFLs and each of the three GLS lamps.
Note: It can be seen in Figure 4 that the voltmeter used is notplaced directly across the lamp. It is assumed that the volt dropacross the meters will be negligible.
It should be noted that the power factor meter used in thisexperiment is an analogue meter and only records displacementpower factor. It was included only to indicate the differencebetween true power factor and displacement power factor.Displacement power factor gives an accurate indication of thepower factor in linear circuits only. As the CFLs being used arepredominantly non-linear loads (i.e. they draw current in sharpbursts or pulses), the readings from the true RMS volt and ampmeters were used, along with the measured wattages, to givevalues for true power factor (calculated power factor, Table 8).
Discussion, finding and analysis
The manufacturer-stated wattages for most of the CFLs were veryaccurate when compared with those wattages recorded. Thelargest deviation was just 2W, which only occurred twice from the15 tested lamps. These deviations do not suggest anything unusualand provide no real insight to suggest manufacturers may bestating incorrect wattages. The reason for the high VA (apparentpower) of all the CFLs is the poor power factor associated withthem. The average power factor from the group of 15 CFLs was0.57, with the best being 0.62 and the worst being 0.52. Whenthis is compared to the GLS lamps, they have a far higher powerfactor of almost unity. The average VA for the group of CFLs wasalmost double the measured wattage (18.47W compared to32.13VA). With the GLS lamps, the VA and wattage were almostidentical. Many people appear to have mistaken how poor powerfactor will affect power consumption and CO2 savings from a givenCFL. To illustrate this with an example: Using a typical 12W CFLand a current of 110mA, would give an apparent power of 25.3VA.This will have significant implications for the supply system, but notthe actual power used. What also must be remembered is that this
An examination into the use of compact fluorescent lamps in the domestic environment
47
Table 8: Measued wattages and power factor
Fig. 4: Circuit set up Fig. 5: Circuit illustration
Lamp Lamp Lamp Manufacturer Manufacturer Measured Calculated Volt-AmpsType Ref. No. Shape Stated Power Power (VA)
Wattage Factor Factor
CFL 29 Spiral Philips 20W 0.90 0.55 36.4
CFL 39 Stick Philips 18W 0.99 0.57 29.9
CFL 38 Spiral Philips 15W 0.87 0.53 28.3
CFL 26 Bulb Philips 20W 0.98 0.58 34.5
CFL 68 Stick Philips 20W 0.99 0.61 30.9
CFL 27 Bulb Philips 20W 0.99 0.61 34.6
CFL 42 Bulb Solus 16W 0.99 0.50 32.1
CFL 32 Stick B & Q 20W 0.99 0.59 32.0
CFL 41 Bulb Solus 16W 0.99 0.52 30.1
CFL 35 Stick Tesco 20W 0.98 0.62 35.6
CFL 31 Stick B&Q 18W 0.99 0.57 31.8
CFL 30 Stick B&Q 20W 0.99 0.59 33.8
CFL 45 Bulb GE 15W 0.97 0.57 24.4
CFL 33 Stick B&Q 20W 0.99 0.58 31.2
CFL 34 Stick Tesco 15W 0.99 0.62 35.4
Average = 0.97 0.57
GLS 1 Eveready 100W 1 1 100.4
GLS 1 Solus 60W 1 1 60.1
GLS 3 Solus 40W 1 1 40
Flourescent Lighting:Layout 1 09/09/2011 15:52 Page 47
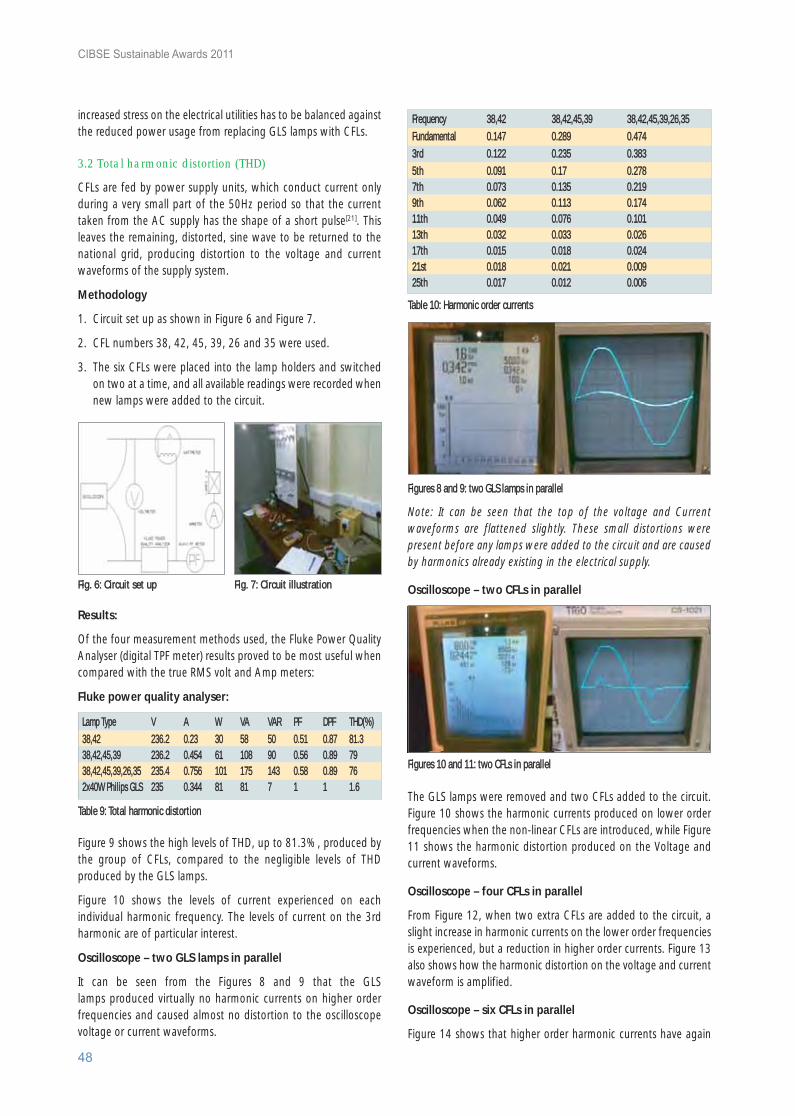
increased stress on the electrical utilities has to be balanced againstthe reduced power usage from replacing GLS lamps with CFLs.
3.2 Total harmonic distortion (THD)
CFLs are fed by power supply units, which conduct current onlyduring a very small part of the 50Hz period so that the currenttaken from the AC supply has the shape of a short pulse[21]. Thisleaves the remaining, distorted, sine wave to be returned to thenational grid, producing distortion to the voltage and currentwaveforms of the supply system.
Methodology
1. Circuit set up as shown in Figure 6 and Figure 7.
2. CFL numbers 38, 42, 45, 39, 26 and 35 were used.
3. The six CFLs were placed into the lamp holders and switched on two at a time, and all available readings were recorded when new lamps were added to the circuit.
Results:
Of the four measurement methods used, the Fluke Power QualityAnalyser (digital TPF meter) results proved to be most useful whencompared with the true RMS volt and Amp meters:
Fluke power quality analyser:
Figure 9 shows the high levels of THD, up to 81.3%, produced bythe group of CFLs, compared to the negligible levels of THDproduced by the GLS lamps.
Figure 10 shows the levels of current experienced on eachindividual harmonic frequency. The levels of current on the 3rdharmonic are of particular interest.
Oscilloscope – two GLS lamps in parallel
It can be seen from the Figures 8 and 9 that the GLS lamps produced virtually no harmonic currents on higher orderfrequencies and caused almost no distortion to the oscilloscopevoltage or current waveforms.
Note: It can be seen that the top of the voltage and Currentwaveforms are flattened slightly. These small distortions werepresent before any lamps were added to the circuit and are causedby harmonics already existing in the electrical supply.
Oscilloscope – two CFLs in parallel
The GLS lamps were removed and two CFLs added to the circuit.Figure 10 shows the harmonic currents produced on lower orderfrequencies when the non-linear CFLs are introduced, while Figure11 shows the harmonic distortion produced on the Voltage andcurrent waveforms.
Oscilloscope – four CFLs in parallel
From Figure 12, when two extra CFLs are added to the circuit, aslight increase in harmonic currents on the lower order frequenciesis experienced, but a reduction in higher order currents. Figure 13also shows how the harmonic distortion on the voltage and currentwaveform is amplified.
Oscilloscope – six CFLs in parallel
Figure 14 shows that higher order harmonic currents have again
CIBSE Sustainable Awards 2011
Fig. 6: Circuit set up Fig. 7: Circuit illustration
Table 9: Total harmonic distortion
Lamp Type V A W VA VAR PF DPF THD(%)38,42 236.2 0.23 30 58 50 0.51 0.87 81.338,42,45,39 236.2 0.454 61 108 90 0.56 0.89 7938,42,45,39,26,35 235.4 0.756 101 175 143 0.58 0.89 762x40W Philips GLS 235 0.344 81 81 7 1 1 1.6
Table 10: Harmonic order currents
Frequency 38,42 38,42,45,39 38,42,45,39,26,35Fundamental 0.147 0.289 0.4743rd 0.122 0.235 0.3835th 0.091 0.17 0.2787th 0.073 0.135 0.2199th 0.062 0.113 0.17411th 0.049 0.076 0.10113th 0.032 0.033 0.02617th 0.015 0.018 0.02421st 0.018 0.021 0.00925th 0.017 0.012 0.006
48
Figures 8 and 9: two GLS lamps in parallel
Figures 10 and 11: two CFLs in parallel
Flourescent Lighting:Layout 1 14/09/2011 16:01 Page 48

decreased, when two extra CFLs are added. Lower order currentshave increased. The distortion to the voltage and current wave-forms has been noticeably amplified.
From Figure 14, the total current of 728mA for six CFLs in a circuitshould be noted.
Discussion, findings and analysis
The objective of this experiment was to quantify the levels of totalharmonic distortion caused to the supply current waveform byCFLs. This could then be compared to GLS lamps. In domesticdwellings, CFLs would be paralleled, usually with six to 10 lampsper circuit. Six CFLs were used in parallel for this experiment. TheGLS lamps produced virtually no total harmonic distortion (less than2%) on the current waveform, where the CFLs produced anaverage of 79% THD. It can be seen that this large distortion ofthe current waveform has a noticeable effect on the levels of THDin the voltage waveform. The levels of total harmonic distortionexperienced on the current waveform get slightly larger as moreCFLs are added to the circuit.
“The biggest problem when installing non-linear loads is the riskof overloading the neutral conductor”[21].
The neutral conductor of most three-phase supply systemsexperiences very low current levels and is usually not protected byfuses or circuit breakers. The CFLs tested produced significant levelsof third order harmonic currents. With this in mind, it is conceivableto think that with large-scale usage, they may provide problemsfor power quality and distribution systems. Many researchers statehigh harmonic distortion is the main drawback of CFLs. It is truethat for the CFLs tested, the relative current distortion expressedas a percent of the fundamental exceeded 80%. However, sincethe current on the fundamental frequency is very low (120mA per
CFL approx), the values of harmonic currents are very low too. Thislarge harmonic distortion will comprise of only a small percentageof the overall load.
It is important to note that using CFLs reduces the total current inthe distribution system and provides released capacity for energysuppliers!
3.3 Time to reach full Lumen output
A common complaint among CFL users is the time that lamps taketo reach their full brightness. This short piece of research sets out to investigate the actual warm up time of the group oftested CFLs.
Methodology
1. The time taken for each lamp to reach its full lumen output was recorded using an amp meter and an illuminance meter.
2. The time was not stopped until the value shown on the illuminance meter had steadied for more than 10 seconds, this 10 seconds was then subtracted from the time on the stop- watch, to give as accurate as possible a time at which the lamp reached full lumen output.
3. This was done seven times per lamp and an average value recorded.
Results:
Discussion, findings and analysis
A common consumer complaint with CFLs is the time the lampstake to reach its full brightness. The reason for this “warm up time”
An examination into the use of compact fluorescent lamps in the domestic environment
49
Figures 12 and 13: four CFLs in parallel
Figures 14 and 15: six CFLs in parallel
Table 11: Time to reach full lumen output
Lamp Lamp Lamp Manufacturer Manufacturer Average TimeType Ref. No. Shape Stated to Reach Full
Wattage Output (Sec)
CFL 29 Spiral Philips 20W 53
CFL 39 Stick Philips 18W 70
CFL 38 Spiral Philips 15W 57
CFL 26 Bulb Philips 20W 126
CFL 68 Stick Philips 20W 55
CFL 27 Bulb Philips 20W 105
CFL 42 Bulb Solus 16W 75
CFL 32 Stick B&Q 20W 91
CFL 41 Bulb Solus 16W 74
CFL 35 Stick Tesco 20W 62
CFL 31 Stick B&Q 18W 85
CFL 30 Stick B&Q 20W 76
CFL 45 Bulb GE 15W 221
CFL 33 Stick B&Q 20W 84
CFL 34 Stick Tesco 15W 55
Average = 85.90
GLS 1 Eveready 100W 2
GLS 2 Solus 60W 2
GLS 3 Solus 40W 2
Flourescent Lighting:Layout 1 09/09/2011 15:52 Page 49

is the time needed to excite the mercury vapour within thefluorescent lamp to the levels needed to provide full lumen output.This small experiment was set up to investigate the associatedwarm-up time with the group of CFLs. It is clear that the associatedwarm-up time does exist and is quite noticeable when comparedto a GLS lamp, which has almost instantaneous full lumen output.It is clear that some CFLs perform better in this area than others.The spiral and stick type lamps proved to be far quicker to reach fulloutput than bulb types. This might suggest that bulb types may begenerally more suited for a room where the lights may be on forlong periods of time, e.g. television rooms, lounge rooms, etc andthe spiral and stick types may be better for use in situations wherethe lights will be frequently switched and quick full lumen outputis needed, e.g. bathrooms, closets, garages, stairwells, etc.
Another important issue to draw from this is the health and safetyconcerns if CFLs are located on stairs and landings and particularlyin the homes of elderly people or those with impaired eyesight.
3.4 Costs in Ireland
From the literature review conducted, it was presumed that thecost of CFLs would vary. With this in mind, investigation into theprice of the fifteen CFLs used in this research was conducted.
CFL Price Vs Performance
The price for each of the lamps was investigated to see if there isany correlation between the purchase price of a lamp and theperformance it will provide. The price list can be seen in Table 13.All prices were sourced from local DIY shops and supermarkets.Where this was not possible, online catalogues were used andprices converted to Euro.
The variation in the price of the CFLs can be seen to be quitesignificant, with the cheapest CFL being one-fifth the cost of the most expensive, despite both being the same wattage.Comparisons are possible between any of the tested lamps, but forthis section a sample comparison between the most expensive andthe cheapest lamp will be conducted using the price, lumen output(manufacturer stated), average illuminance (research not includedin this paper) and the measured VA. It can be seen from Table 14,that despite the price difference of over 500%, the two lampsperform almost equally well under the compared headings. Similarresults are obtained when comparing prices and performance ofother CFLs. This would lead to questions about the mark-up priceof CFLs and whether or not some manufacturers are trying toexploit the ban of the GLS lamp.
3.5 At-a-glance calculations – running costs and carbonemissions:
Running costs
The running costs of CFLs are easily calculated using the kWh pricefrom an electricity supplier and the estimated hourly usage per day,week, month or year. The calculations below assume 1000 hourusage per annum, roughly 2.7 hours per day and use ElectricitySupply Board Ireland kWh prices[22].
Philips 20W CFL – Ref No. 29
20W x 1,000hr/yr = 20kWh/yr x e0.1506 = e3.01 per annum.
Assume ten lamps per household – e3·01 x 10 = e30·10 perannum running costs.
Eveready 100W GLS – Ref No.1
100W x 1,000hr/yr = 100kWh/yr x e0.1506 = e15.06 per annum.
Assume ten lamps per household – e15.06 x 10 = e150.6 perannum running costs.
Savings per annum – e120.50
Note: In Ireland, domestic tariffs do not penalise for poor powerfactor. Should this be implemented in the future, the potentialmonetary savings from CFLs may be reduced.
CO2 Emissions
Again the predicted kWh usage for the year can be used toestimate the potential CO2 savings possible from switching to CFLs.The Carbon Trust provides a conversion figure of 0. 544kg/CO2 perkWh for grid electricity[23] and this will be used for the purposes ofcalculations.
Philips 20W CFL – Ref No.29
20W x 1,000hr/yr = 20kWh/yr x 0·544kg/CO2 = 10·88 kg/CO2 perannum.
CIBSE Sustainable Awards 2011
50
Table 12: Warm up time with tube shape
Table 13: CFL price comparison
Spiral Bulb StickAverage (sec) 55 120.2 72.25
Table 14: Comparison – cheapest vs most expensive
Lamp Type Philips – Ref 39 B&Q Ref 31 Stated Wattage 18W 18W
Price e11.02 e1.95Lumens 1100 lm 1200 lmAverage Illuminance 300.4 lux 354.4 luxVolt Amps 29.9 VA 31.7 VA
Lamp Lamp Manufacturer Manufacturer PriceType No. Stated Wattage – e
CFL 29 Philips 20W 9.50
CFL 39 Philips 18W 11.02
CFL 38 Philips 15W 7.87
CFL 26 Philips 20W 10.99
CFL 68 Philips 20W 8.55
CFL 27 Philips 20W 10.99
CFL 42 Solus 16W 4.35
CFL 32 B&Q 20W 2.20
CFL 41 Solus 16W 4.35
CFL 35 Tesco 20W 3.25
CFL 31 B&Q 18W 1.95
CFL 30 B&Q 20W 2.20
CFL 45 GE 15W 4.37
CFL 33 B&Q 20W 2.20
CFL 34 Tesco 20W 3.25
GLS 1 Eveready 100W 0.99
GLS 1 Solus 60W 0.85
GLS 3 Solus 40W 0.85
Flourescent Lighting:Layout 1 09/09/2011 15:52 Page 50

Assume ten lamps per household – 10.88 kg/CO2 x 10 =108.8kg/CO2 per annum.
Eveready 100W GLS – Ref No.1
100W x 1,000hr/yr = 100kWh/yr x 0.544kg/CO2 = 54·4kg/CO2per annum.
Assume ten lamps per household – 54.4kg/CO2 x 10 = 544kg/CO2per annum.
Savings per annum, per household – 435.2kg/CO2
4. ConclusionsIt can be seen that manufacturer-stated CFL wattages were accurate,but an average true power factor of 0.57 has a significant effect on theapparent power. It leads to an apparent power that is on average,almost 60% greater than the manufacturer-stated wattage. Some ofthe problems that this may cause for electrical utilities are increasedvolt drops or a need to increase the rating of all system components,such as generators, conductors, transformers, switchgear, etc. Manyresearchers suggest that high harmonic distortion is the main drawbackof CFLs. It is true that for the CFLs tested, the relative current distortionexpressed as a percentage of the fundamental exceeded 80%.However, since the current on the fundamental frequency is very low, the values of harmonic currents returned to the distribution systemare very low too, compared with GLS lamps. This minimises risks ofdistribution equipment overheating, transformer secondary voltagedistortion and possible overload three-phase neutral conductors. Theassociated “warm up time” with CFLs does exist and is quite noticeablewhen compared to a GLS lamp, which has almost instantaneous fulllumen output. Some CFLs appear to perform better in this area thanothers. The spiral and stick type lamps proved to be far quicker to reachfull output than bulb types. Care should be taken when using CFLs inthe homes of elderly people and those with impaired eyesight. Thevariation in the price of the CFLs is quite significant, with the cheapestCFL being almost one-fifth the price of the most expensive, eventhough they are the same wattage. From the comparison in Table 14,it can be seen that despite the obvious difference in price, there is littledifference in the performance (under the headings examined) of thetwo CFLs. The financial and environmental benefits of using CFLs indomestic lighting are clearly visible from the calculations in section 3.5.
It is clear that CFLs have a far greater efficacy (lumen/watt) than their GLS equivalent. Using their manufacturer-stated lumen output,the CFLs used in this research had an average efficacy of 58.41lumens/watt, compared to 13.3 lumens/watt from a GLS lamp. Itwould appear that CFLs contain a far greater embodied energy, but this is not significant enough to offset the potential savings they provide compared to GLS lamps. At present, it seems that CFLs produce slightly less illuminance than their GLS “equivalents”.When manufacturers are stating equivalent wattages, there is somediscrepancy between the methods of comparison. However, it appears
that this is merely an effort to provide an easily understood method ofcomparison for the general public. CFL lamp life is hard to analysecritically. CFL lamp life is stated as being six to 12 times that of a GLSlamp, but questions are raised about what CFL lumen output will betowards the end of their lifespan and if this will be sufficient to avoidreplacing the lamp. It is understood that stated lifespan is an average.CFLs produce an incomplete electromagnetic spectrum. They lackhigher wavelengths, which contain the colour red. It is for this reasonthat they produce a cool colour temperature. This seems to be asignificant factor for most users, but the use of lampshades may offsetthis somewhat. The spectral irradiance of CFLs does not follow that ofa Planckian radiator, as with a GLS lamp. It instead shows peaks inspectral irradiance, separated by regions of little or no irradiance. It is for this reason that the colour rendering index of CFLs is lowerthan that of a GLS lamp. In the studies reviewed, the average CRI for CFLs was approximately 78. Very few independent studies existthat accurately measure the total lumen output of CFLs, but thisresearch suggests a comparative ratio of 4.5:1, not the 5:1 stated bymanufacturers may be more accurate. There are two sides to thedebate on mercury content within CFLs. Some argue that moremercury will be released through the generation of electricity for GLSlamps than could possibly be released by incorrect disposal of CFLs.Others argue that the smaller quantities of mercury and mercurycompounds (e.g. methyl mercury) that end up in landfills will do farmore damage than the larger quantities released directly into ouratmosphere. This paper suggests that only a very small fraction of eachCFL will actually be recyclable. It is clear that some CFLs emit ultravioletradiation. The reasoning behind this seems to be incomplete,inadequate or incorrect application of the phosphors coating to lampenvelopes. Cantwells’ study found that 9.4% of single envelope CFLsexceed the ICNIRP recommended limit value of 30Jm-2 within eighthours at a distance of 200mm. No double envelope CFLs exceed thisvalue. As of 27 April 2010, this limit cannot be exceeded in places ofwork, under EU law. The UK EPA recommends a distance of >30cmfrom CFLs for area and task lighting. The effects of CFLs and theiremission of ultra-violet radiation must be taken very seriously wherepersons with photosensitive skin conditions are concerned.
While we must recognise and acknowledge the shortcomings of CFLs,the potential savings in energy, running costs and CO2 emissions provide a powerful argument that CFLs are an improved alternative to GLS lamps.
Acknowledgements
I offer my utmost gratitude to Eamonn Murphy (Department ofElectrical Services Engineering, DIT). His knowledge and expertise with laboratory equipment and instrumentation made this research far easier than it might otherwise have been. I would also like to issuea very special thank you to Dr. Thomas Cantwell (School of Physics,DIT) for his time, support and knowledge of photometric propertiesassociated with CFLs.
An examination into the use of compact fluorescent lamps in the domestic environment
51
Table 15: Running costs and CO2 emissions comparison for “equivalent” lamps
Lamp Lamp Lamp Lifetime Cost CO2 EmissionsType Cost Life (12 Years) (12 Years)
200W CFL e9.50 12,000 e45.62 130.6kg
100W GLS e0.99 1,000 e192.60 652.8kg
Flourescent Lighting:Layout 1 09/09/2011 15:52 Page 51

References
[1] Gormley, J. National Climate Change Strategy 2007 – 2012. IrishGovernment Publication 2006. Online.
Available:http://www.environ.ie/en/Environment/Atmosphere/ClimateChange/PublicationsDocuments/FileDownLoad,5076,en.pdf
[2] Benn, H. Light bulb phase out to begin next year. 2007. Online.
Available: http://www.direct.gov.uk/en/Nl1/Newsroom/DG_070737
[3] Implementing Directive 2005/32/EC of the European Parliament and of theCouncil with Regard to Ecodesign Requirements for Non-DirectionalHousehold Lamps. Official Journal of the European Union. CommissionRegulation (EC) No 244/2009P.29. 23 February 2009.
[4] Jacob, B., 2009. Lamps for improving the energy efficiency of domesticlighting. The Chartered Institute of Building Services Engineers, 16 May 2009.
[5] Burgin, R., 2009. Lets get the facts in focus about the great light bulbdebate. CIBSE Journal, March 2009, pg. 16.
[6] Alexander, R., 2009. Why Eco Light Bulbs Aren’t What They Seem. BBCNews Magazine.
Available: http://news.bbc.co.uk/2/hi/uk_news/magazine/8406923.stm
[7] Shaw, K., 2009. Stop the switch, save the bulb! Lighting Journal, vol73/No 6, December 2008, pg. 28-33.
[8] Beirne, J., and Cantwell, T., 2008. Photometric Comparasion ofIncandescent and Compact Fluorescent Lamps. Dublin Institute of Technology.Dublin.
[9] Browne, L., and Cantwell, T., 2009. Ultraviolet Radiation Emissions fromCompact Fluorescent Lamps. Dublin Institute of Technology. Dublin.
[10] LIF, 2009. The Lighting Industry Federation. Role of Manufacturers in theImprovement of CFL Performance. United Kingdom.
Available: http://www.lif.co.uk/ [10/04/2010]
[11] Derbyshire, D., 2009. The Great Lightbulb Revolt. The Daily Mail. January7, 2009. London
[12] Simpson, R., 2007. Are Compact Fluorescent Lamps with Integral ballastsfit to Replace Incandescent Lamps? UK Displays and Lighting KnowledgeTransfer Network Newsletter. United Kingdom.
[13] IEEE Std. 100 Authortative Dictionary of Standards Terms, 7th editionISBN 0-7381 -2601 -2
[14] The International Commission on Non-Ionising Radiation Protection,Guidelines on Limits of Exposure or Ultraviolet Wavelengths between 180 nmand 400 nm (Incoherent Optical Radiation). Health Physics 87 (2): P. 171-186;2004.
[15] Cantwell, T. et al. 2010. LE-WED. Proceedings of the 12th InternationalSymposium on the Science and Technology of Light Sources and the 3rdInternational Conference on White LEDs and Solid State Lighting. P. 35.
July 11-16, 2010. Eindhoven. Netherlands.
[16] Khazova, M. and O’Hagan, J.B., 2008. Optical Radiation Emissions fromCompact Fluorescent Lamps. Health Protection Agency. United Kingdom.
[17] Directive 2006/25/EC of the European Parliament and the Council of theMinimum Health and Safety Requirements Regarding the Exposure ofWorkers to Risks Arising from Physics Agents (Artifical Optical RadiationDirective). Official Journal of the European Union, L114/38-14/P.59. 27th April 2006.
[18] O Toole, S., 2007. Benefits of “high power factor” Compact FluorescentLamps. New Zealand, October 16, 2007.
[19] Watson, K., Stimpson, SD., Atkinson, G., 2007. HARMONIC DISTORTIONCAUSED BY COMPACT FLUORESCENT LIGHTS ON ELECTRICAL NETWORKS.
Available: http://active.cput.ac.za/energy/web/DUE/DOCS/400/Paper%20-%20Atkinson-Hope%20G.pdf [29/04/2010]
[21] Gothelf, N.. Power Quality Effects of CFLs – A Field Study. 1997.
Available: http://iaeel.org/IAEEL/Archive/Right_Light_Proceedings/Proceedings_body/BOK4/RL42goth.pdf
[22] Electricity Supply Board 2010. Online Tariffs.
Available: http://esb.ie/main/home/index.jsp
[23] Carbon Trust. Resources and Conversion Factors. Online.
Available: http://www.carbontrust.co.uk/cut-carbon-reduce-costs/calculate/carbon-footprinting/pages/conversion-factors.aspx#Greenhouse gas conversions
[24] Dunne, D. 2009. Compact Fluorescent Lamps – FAQ. The LightingAssociation.
Available: http://www.lightingassociation.com/results_search.php
[25] Energystar. Information on Compact Fluorescent Light Bulbs (CFLs) andMercury. U.S. Department of Energy
Available:http://www.energystar.gov/ia/partners/promotions/change_light/downloads/Fact_Sheet_Mercury.pdf
[25] EEE Std. 1459-2000 Trial-Use Standard Definitions for the Measurementof Electric Power Quantities Under Sinusoidal, Non-sinusoidal, Balanced, orUnbalanced Conditions. Institute of Electrical and Electronics Engineers Inc.,2000, 0-7381-1963-6.
[26] Directive 2009/95/EC of the European Parliament. Scientific Committeein Health and Environmental Risks. Official Journal of the European Union. 18May 2002.
[27] Sayre, R. et al. 2008. The Risk of Ultraviolet Radiation Exposure fromIndoor Lamps in Lupus Erythematosus. Elsevier B.V. Philadelphia. U.S.A.
[28] Klein, S., et al. 2009. Analysis of Compact Fluorescent Lights for Use byPatients With Photosensitive Conditions. The American Society ofPhotobiology. Philadelphia. U.S.A.
[29] Sontheimer, RD., 2009. Ultraviolet Light Output of Compact FluorescentLamps: Comparison to Conventional Incandescent and Halogen ResidentialLighting Sources. Utah School of Medicine. U.S.A.
CIBSE (2008) CIBSE TM:46-; CIBSE UK
CIBSE Sustainable Awards 2011
52
Flourescent Lighting:Layout 1 09/09/2011 15:52 Page 52
Waterford Institute of Technology, Tourismand Leisure Building
Chris Croly BSc (hons) CEng MIEI MCIBSE
Building Services Engineering DirectorBuilding Design [email protected]
Waterford Institute of Technology, Tourismand Leisure Building
SDAR Award winner 2009
Croly WIT Building:Layout 1 09/09/2011 15:57 Page 53
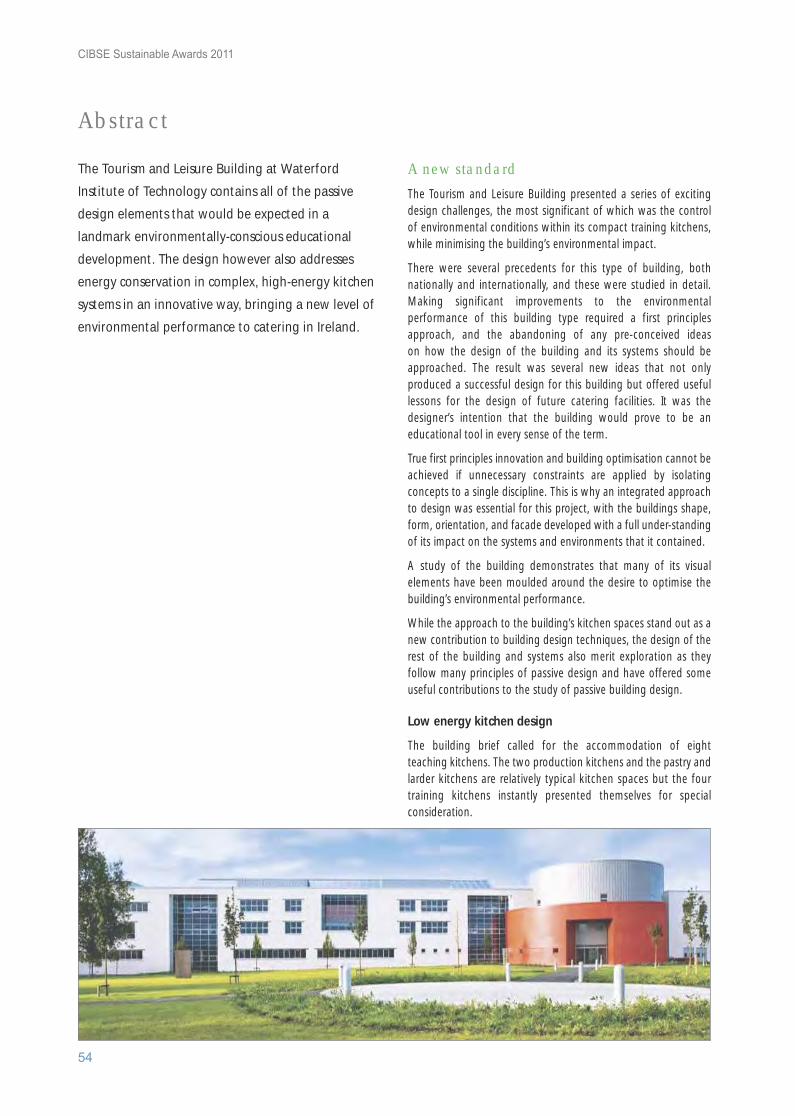
Abstract
The Tourism and Leisure Building at Waterford
Institute of Technology contains all of the passive
design elements that would be expected in a
landmark environmentally-conscious educational
development. The design however also addresses
energy conservation in complex, high-energy kitchen
systems in an innovative way, bringing a new level of
environmental performance to catering in Ireland.
A new standardThe Tourism and Leisure Building presented a series of excitingdesign challenges, the most significant of which was the controlof environmental conditions within its compact training kitchens,while minimising the building’s environmental impact.
There were several precedents for this type of building, bothnationally and internationally, and these were studied in detail. Making significant improvements to the environmentalperformance of this building type required a first principlesapproach, and the abandoning of any pre-conceived ideas on how the design of the building and its systems should beapproached. The result was several new ideas that not onlyproduced a successful design for this building but offered usefullessons for the design of future catering facilities. It was thedesigner’s intention that the building would prove to be aneducational tool in every sense of the term.
True first principles innovation and building optimisation cannot beachieved if unnecessary constraints are applied by isolatingconcepts to a single discipline. This is why an integrated approachto design was essential for this project, with the buildings shape,form, orientation, and facade developed with a full under-standingof its impact on the systems and environments that it contained.
A study of the building demonstrates that many of its visualelements have been moulded around the desire to optimise thebuilding’s environmental performance.
While the approach to the building’s kitchen spaces stand out as anew contribution to building design techniques, the design of therest of the building and systems also merit exploration as theyfollow many principles of passive design and have offered someuseful contributions to the study of passive building design.
Low energy kitchen design
The building brief called for the accommodation of eight teaching kitchens. The two production kitchens and the pastry andlarder kitchens are relatively typical kitchen spaces but the fourtraining kitchens instantly presented themselves for specialconsideration.
CIBSE Sustainable Awards 2011
54
Croly WIT Building:Layout 1 09/09/2011 15:57 Page 54
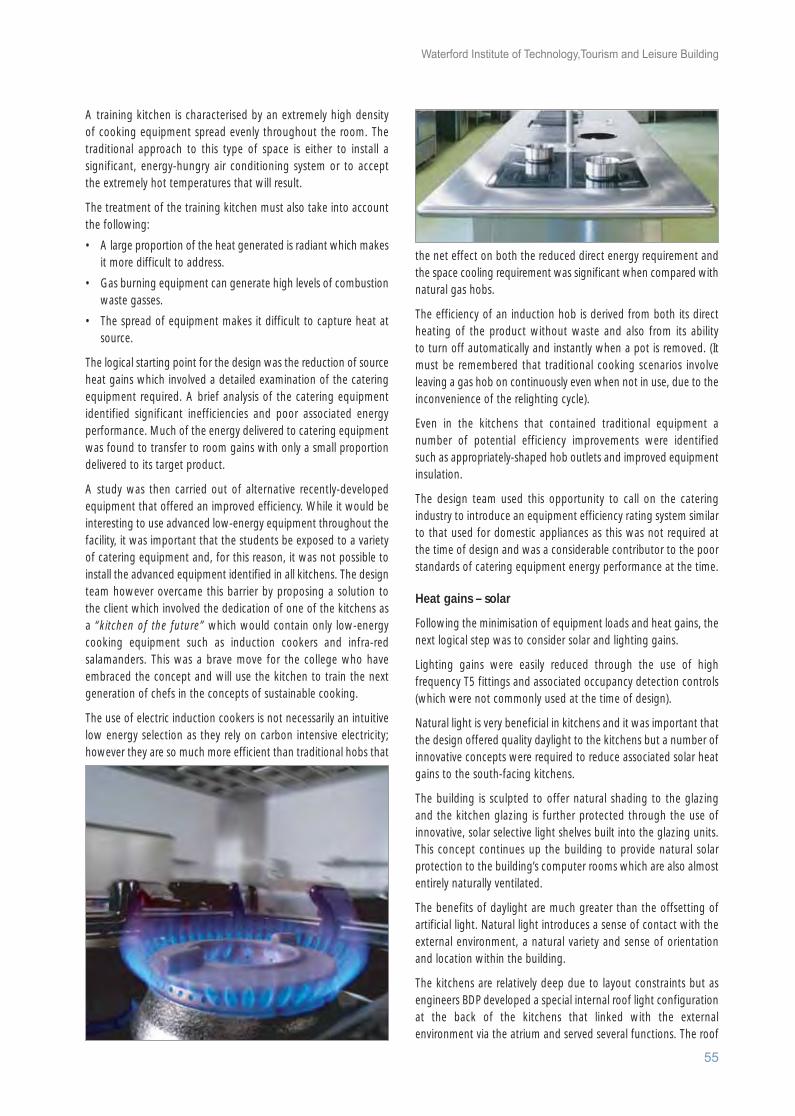
A training kitchen is characterised by an extremely high density of cooking equipment spread evenly throughout the room. Thetraditional approach to this type of space is either to install asignificant, energy-hungry air conditioning system or to accept the extremely hot temperatures that will result.
The treatment of the training kitchen must also take into accountthe following:
• A large proportion of the heat generated is radiant which makesit more difficult to address.
• Gas burning equipment can generate high levels of combustion waste gasses.
• The spread of equipment makes it difficult to capture heat at source.
The logical starting point for the design was the reduction of sourceheat gains which involved a detailed examination of the cateringequipment required. A brief analysis of the catering equipmentidentified significant inefficiencies and poor associated energyperformance. Much of the energy delivered to catering equipmentwas found to transfer to room gains with only a small proportiondelivered to its target product.
A study was then carried out of alternative recently-developedequipment that offered an improved efficiency. While it would beinteresting to use advanced low-energy equipment throughout thefacility, it was important that the students be exposed to a varietyof catering equipment and, for this reason, it was not possible toinstall the advanced equipment identified in all kitchens. The designteam however overcame this barrier by proposing a solution to the client which involved the dedication of one of the kitchens asa “kitchen of the future” which would contain only low-energycooking equipment such as induction cookers and infra-redsalamanders. This was a brave move for the college who haveembraced the concept and will use the kitchen to train the nextgeneration of chefs in the concepts of sustainable cooking.
The use of electric induction cookers is not necessarily an intuitivelow energy selection as they rely on carbon intensive electricity;however they are so much more efficient than traditional hobs that
the net effect on both the reduced direct energy requirement andthe space cooling requirement was significant when compared withnatural gas hobs.
The efficiency of an induction hob is derived from both its directheating of the product without waste and also from its ability to turn off automatically and instantly when a pot is removed. (Itmust be remembered that traditional cooking scenarios involveleaving a gas hob on continuously even when not in use, due to theinconvenience of the relighting cycle).
Even in the kitchens that contained traditional equipment a number of potential efficiency improvements were identified such as appropriately-shaped hob outlets and improved equipmentinsulation.
The design team used this opportunity to call on the cateringindustry to introduce an equipment efficiency rating system similarto that used for domestic appliances as this was not required atthe time of design and was a considerable contributor to the poorstandards of catering equipment energy performance at the time.
Heat gains – solar
Following the minimisation of equipment loads and heat gains, thenext logical step was to consider solar and lighting gains.
Lighting gains were easily reduced through the use of highfrequency T5 fittings and associated occupancy detection controls(which were not commonly used at the time of design).
Natural light is very beneficial in kitchens and it was important thatthe design offered quality daylight to the kitchens but a number ofinnovative concepts were required to reduce associated solar heatgains to the south-facing kitchens.
The building is sculpted to offer natural shading to the glazing and the kitchen glazing is further protected through the use ofinnovative, solar selective light shelves built into the glazing units.This concept continues up the building to provide natural solarprotection to the building’s computer rooms which are also almostentirely naturally ventilated.
The benefits of daylight are much greater than the offsetting ofartificial light. Natural light introduces a sense of contact with theexternal environment, a natural variety and sense of orientationand location within the building.
The kitchens are relatively deep due to layout constraints but asengineers BDP developed a special internal roof light configurationat the back of the kitchens that linked with the externalenvironment via the atrium and served several functions. The roof
Waterford Institute of Technology,Tourism and Leisure Building
55
Croly WIT Building:Layout 1 09/09/2011 15:57 Page 55
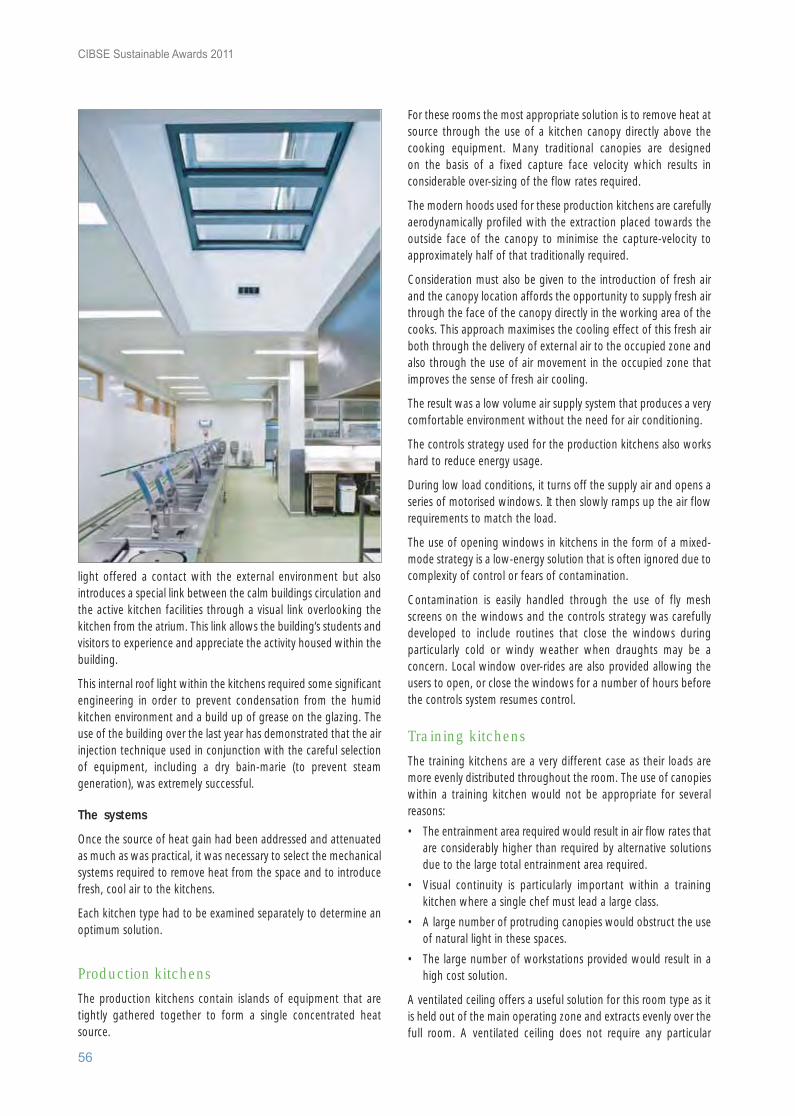
light offered a contact with the external environment but alsointroduces a special link between the calm buildings circulation andthe active kitchen facilities through a visual link overlooking thekitchen from the atrium. This link allows the building’s students andvisitors to experience and appreciate the activity housed within thebuilding.
This internal roof light within the kitchens required some significantengineering in order to prevent condensation from the humidkitchen environment and a build up of grease on the glazing. Theuse of the building over the last year has demonstrated that the airinjection technique used in conjunction with the careful selectionof equipment, including a dry bain-marie (to prevent steamgeneration), was extremely successful.
The systems
Once the source of heat gain had been addressed and attenuatedas much as was practical, it was necessary to select the mechanicalsystems required to remove heat from the space and to introducefresh, cool air to the kitchens.
Each kitchen type had to be examined separately to determine anoptimum solution.
Production kitchens The production kitchens contain islands of equipment that aretightly gathered together to form a single concentrated heatsource.
For these rooms the most appropriate solution is to remove heat atsource through the use of a kitchen canopy directly above thecooking equipment. Many traditional canopies are designed on the basis of a fixed capture face velocity which results inconsiderable over-sizing of the flow rates required.
The modern hoods used for these production kitchens are carefullyaerodynamically profiled with the extraction placed towards theoutside face of the canopy to minimise the capture-velocity toapproximately half of that traditionally required.
Consideration must also be given to the introduction of fresh airand the canopy location affords the opportunity to supply fresh airthrough the face of the canopy directly in the working area of thecooks. This approach maximises the cooling effect of this fresh airboth through the delivery of external air to the occupied zone andalso through the use of air movement in the occupied zone thatimproves the sense of fresh air cooling.
The result was a low volume air supply system that produces a verycomfortable environment without the need for air conditioning.
The controls strategy used for the production kitchens also workshard to reduce energy usage.
During low load conditions, it turns off the supply air and opens aseries of motorised windows. It then slowly ramps up the air flowrequirements to match the load.
The use of opening windows in kitchens in the form of a mixed-mode strategy is a low-energy solution that is often ignored due tocomplexity of control or fears of contamination.
Contamination is easily handled through the use of fly meshscreens on the windows and the controls strategy was carefullydeveloped to include routines that close the windows duringparticularly cold or windy weather when draughts may be aconcern. Local window over-rides are also provided allowing theusers to open, or close the windows for a number of hours beforethe controls system resumes control.
Training kitchens The training kitchens are a very different case as their loads aremore evenly distributed throughout the room. The use of canopieswithin a training kitchen would not be appropriate for severalreasons:
• The entrainment area required would result in air flow rates that are considerably higher than required by alternative solutions due to the large total entrainment area required.
• Visual continuity is particularly important within a training kitchen where a single chef must lead a large class.
• A large number of protruding canopies would obstruct the use of natural light in these spaces.
• The large number of workstations provided would result in a high cost solution.
A ventilated ceiling offers a useful solution for this room type as itis held out of the main operating zone and extracts evenly over thefull room. A ventilated ceiling does not require any particular
CIBSE Sustainable Awards 2011
56
Croly WIT Building:Layout 1 09/09/2011 15:57 Page 56
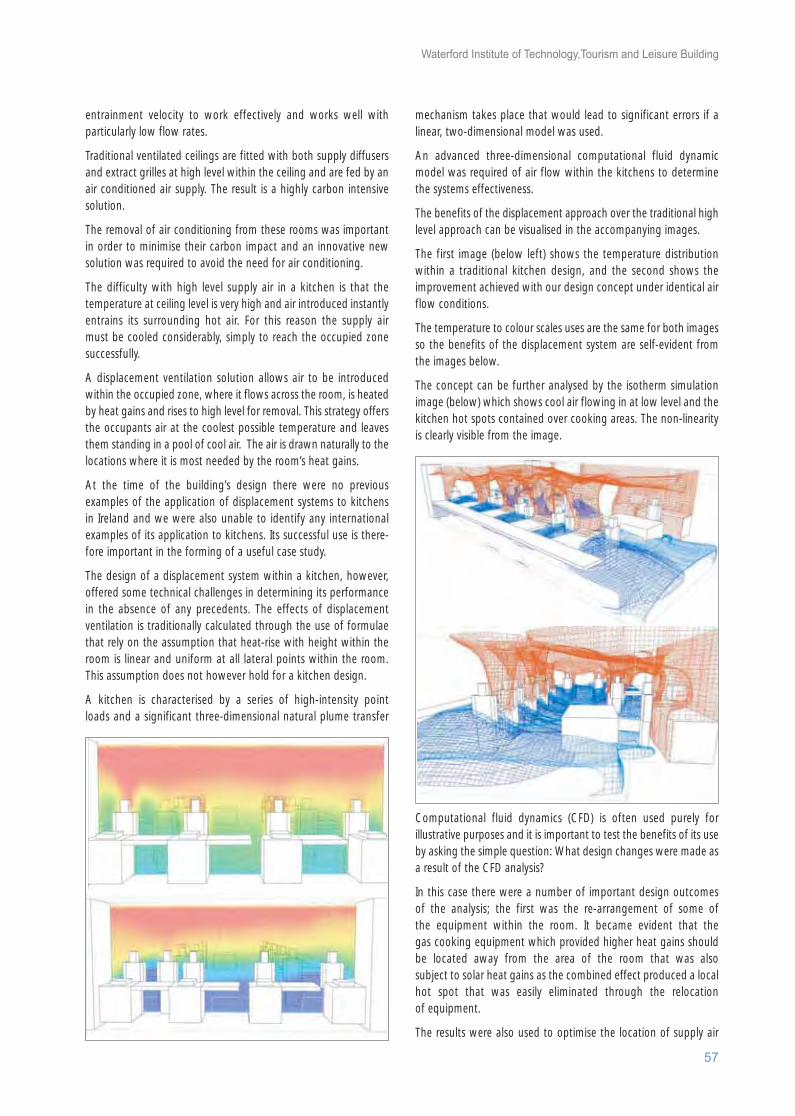
entrainment velocity to work effectively and works well withparticularly low flow rates.
Traditional ventilated ceilings are fitted with both supply diffusersand extract grilles at high level within the ceiling and are fed by anair conditioned air supply. The result is a highly carbon intensivesolution.
The removal of air conditioning from these rooms was important in order to minimise their carbon impact and an innovative newsolution was required to avoid the need for air conditioning.
The difficulty with high level supply air in a kitchen is that thetemperature at ceiling level is very high and air introduced instantlyentrains its surrounding hot air. For this reason the supply air must be cooled considerably, simply to reach the occupied zonesuccessfully.
A displacement ventilation solution allows air to be introducedwithin the occupied zone, where it flows across the room, is heatedby heat gains and rises to high level for removal. This strategy offersthe occupants air at the coolest possible temperature and leavesthem standing in a pool of cool air. The air is drawn naturally to thelocations where it is most needed by the room’s heat gains.
At the time of the building’s design there were no previousexamples of the application of displacement systems to kitchens in Ireland and we were also unable to identify any internationalexamples of its application to kitchens. Its successful use is there-fore important in the forming of a useful case study.
The design of a displacement system within a kitchen, however,offered some technical challenges in determining its performancein the absence of any precedents. The effects of displacementventilation is traditionally calculated through the use of formulaethat rely on the assumption that heat-rise with height within theroom is linear and uniform at all lateral points within the room.This assumption does not however hold for a kitchen design.
A kitchen is characterised by a series of high-intensity point loads and a significant three-dimensional natural plume transfer
mechanism takes place that would lead to significant errors if alinear, two-dimensional model was used.
An advanced three-dimensional computational fluid dynamicmodel was required of air flow within the kitchens to determinethe systems effectiveness.
The benefits of the displacement approach over the traditional highlevel approach can be visualised in the accompanying images.
The first image (below left) shows the temperature distributionwithin a traditional kitchen design, and the second shows theimprovement achieved with our design concept under identical airflow conditions.
The temperature to colour scales uses are the same for both imagesso the benefits of the displacement system are self-evident fromthe images below.
The concept can be further analysed by the isotherm simulationimage (below) which shows cool air flowing in at low level and thekitchen hot spots contained over cooking areas. The non-linearityis clearly visible from the image.
Computational fluid dynamics (CFD) is often used purely forillustrative purposes and it is important to test the benefits of its useby asking the simple question: What design changes were made asa result of the CFD analysis?
In this case there were a number of important design outcomes of the analysis; the first was the re-arrangement of some of the equipment within the room. It became evident that the gas cooking equipment which provided higher heat gains shouldbe located away from the area of the room that was also subject to solar heat gains as the combined effect produced a localhot spot that was easily eliminated through the relocation of equipment.
The results were also used to optimise the location of supply air
Waterford Institute of Technology,Tourism and Leisure Building
57
Croly WIT Building:Layout 1 09/09/2011 15:57 Page 57

grilles to hold cool air at low level as long as possible and avoidforced pluming of cool air.
The results of the CFD analysis were also used to determine thedesign flow rates required to hold a cool air zone within theoccupied zone.
The use of CFD was therefore vital to the success of the project.
It is also important to ask if the analysis was accurate and, toanswer this question, a number of load tests were carried out oncompletion of the building. Temperatures were measured at anumber of locations and elevations within the kitchens during the load tests and were found to be almost identical to thesimulated results.
The load tests were also used to carefully test some of the complexcontrol routines applied, and to ensure that carbon monoxide levelswithin the kitchens were not compromised by the low-energy,reduced-air volume strategies.
Once the displacement system had been designed and optimised,its controls were then optimised through a series of sophisticatedroutines that minimise energy use in a number of interesting ways.These are briefly outlined below:
• Natural ventilation is automatically used at low loads, through insect screened window openings.The automatic windows are carefully controlled to avoid draughts and remain open when appropriate at higher load conditions to form a hybrid ventilation strategy.
• Variable speed drives automatically adapt to the required load, taking into account the cooking load and the use of natural ventilation for make-up air.
• The kitchens automatically switch to high level supply during very cold conditions, operating as an interesting form of kitchen air heat recovery within the ceiling plenum and at high level in the room. This is a simple addition to the strategy that totally eliminates the need for pre-heating of the supply air during cold conditions.
• Carbon monoxide sensors allow the fans to operate at low speed without risk to the users. Load testing has demonstrated that even in the event of the failure of the carbon monoxide sensors, levels within the kitchen remain well within reasonable limits but the sensors provide a useful additional safety measure.
• The natural ventilation is used in conjunction with the mechanical systems in a hybrid mode to optimise internal conditions. There are user over-ride switches provided to allow the user to open or close the windows for a number of hours before control is returned to the building management system.
In a drive to use the building as a learning tool and to also optimiseits control systems, a remote connection has been provided to theconsultant engineer’s offices which has allowed for interestingobservation over a considerable monitoring period.
With complex controls systems it is always a concern that the userswill find the system difficult to understand. However, observationsboth on site and through the remote system have shown that the system optimisation controls work well and that the usersunder-stand the systems operation. Part of the success of acomplex controls system is maintaining a simple user interface andallowing appropriate temporary user over ride.
Hot water
Hot water use in teaching kitchens is significant and is requiredover a short period following each teaching session.
The environmental impact of the kitchen’s hot water consumptionis reduced by the use of dedicated condensing hot water heatersthat were not available on the market at the time of tender butwere added as they became available during the constructionperiod, allowing the building to benefit from the latest technologyavailable for this key energy consumer.
General layout
The building form was carefully laid out on a linear plan in order toexpose south and north facades with the philosophy that due southgains can be dealt with effectively through shading methods.
The south facade is divided by a number of dynamic recesses, oneof which is shown in the following photo (page 59). These recessesallow the drawing of daylight and natural ventilation into thebuilding without exposing it to excessive heat gain. These recesseswere carefully modelled to optimise the natural shading effects.
The south wall form is also assisted by the unusual use of a facadestack wall that conceals the large kitchen ventilation ducts. Theseducts are carefully positioned to allow windows to project through
CIBSE Sustainable Awards 2011
58
Croly WIT Building:Layout 1 09/09/2011 15:58 Page 58

the spaces between the ducts. The moving of the ducts to the external wall allowed a buffer zone to be generated that forms natural recesses to reduce solar gain. The co-ordination andoptimisation of details of this type is a tribute to the design team’sco-ordination of all disciplines.
A generous central atrium divides the building allowing stackventilation, and also allows the night cooling of exposed internalblock work which provides cooling to the majority of internal rooms as they back onto the atrium. This night cooling strategyprovides the simplicity of night cooling without the securityconcerns of motorised external windows.
The building’s main atrium is flooded with light, drawing light allthe way down to the kitchen corridors, and transferring lightthrough internal glazing to the kitchens.
A smaller secondary atrium is used to draw light to the back of therestaurant area where the food prepared by the students isconsumed, offering further training opportunities for pupils.
Light is also drawn through the building with a series of roof lights,so that the building’s users are constantly in contact with thenatural environment.
Unwanted air leakage is the largest source of heat loss from abuilding of this type and an air tightness target of 5m3/m2/hr at atest pressure of 50Pa was achieved. This is a particularly impressiveachievement when it is considered that no specialist sealants,membranes or blocks were used. An achievement that is oftenthought not to be possible with traditional construction and the
building has served as a useful demonstration of what can beachieved through careful detailing and quality workmanship.
Control
The building’s controls also contain many innovative strategies thatare designed to reduce the buildings energy consumption, includingthe use of direct weather compensated condensing boilers.
The board room and restaurant spaces also contain innovativecontrol strategies that automatically detect the room’s requirementsand adjust the ventilation to suit, prioritising natural ventilation astheir primary cooling measure.
The use of load-sensing control strategies offers significantadvantages over traditional methods by reducing energyconsumption and management requirements.
The building also contains an internet-based remote monitoringsystem which allows the design engineers to optimise the controlsystems and follow the buildings progress.
The building’s lighting system is a low energy system complete withautomatic controls that turn off lights when rooms are un-occupiedor when adequate daylight is available.
Waterford Institute of Technology,Tourism and Leisure Building
59
Croly WIT Building:Layout 1 09/09/2011 15:58 Page 59

This is also one of the first buildings to be fitted with waterlessurinals, demonstrating the client’s commitment to lowering the environmental footprint of their buildings and offering ademonstration of the best new conservation methods available.
Modern tools
The CFD study used to analyse the complex air flow within thekitchens demonstrated the application of modern engineeringtechniques to this project. The project also took advantage of anumber of other advanced, in-house engineering techniques tostudy the building.
The atrium daylight and the transfer of light between the atriumand surrounding rooms is a complex process that cannot beaccurately studied with standard daylight analysis software. Anadvanced radiocity-based calculation method was used to fullyaccount for the complex light reflectances through the depth ofthe atrium and to adjacent rooms.
The following images show an early simulation model image of theatrium that was used to study glare and the associated light levelresults output.
The advanced daylight simulations were used at an early stage ofthe project to advise the project architect on the required glazingareas and distribution.
The natural ventilation and thermal mass interaction was studiedthrough the use of a complete building dynamic simulation.
The project was run as a “paperless” project with almost nodrawings printed and all communication carried out using a project email mailbox. While this paperless project technique is nowcommonly used, it was an innovative concept at the time of theprojects design.
The project also adopted the use of BIM (Building InformationModelling) techniques to model the complex services layouts withinthe limited ceiling voids above the kitchens. This modelling alloweda number of complex co-ordination issues to be identified andresolved prior to construction.
Lessons offered
This building extends its teaching function beyond its primarypurpose of a tourism and leisure building.
The building offers a useful case study on the use of passive designtechniques that are optimised for an educational building. It alsooffers useful results for several new, innovative techniques such asthe use of displacement ventilation in kitchens, the use of advancedcatering equipment, the use of hybrid natural ventilation andcomplex controls in a high-usage catering facility. It is hoped that many of the lessons and results achieved can assist in thedevelopment of future low energy buildings of a similar nature.
It is also hoped that the provision of training in the use of lowenergy catering equipment will encourage the future chefs andmanagers who are trained in the building to invest in these lowenergy methods.
The building air tightness target and techniques were also a useful training exercise for the builders involved who gained theknowledge of how to produce future low energy buildings withoutadditional costs.
All of the building’s low energy techniques were achieved at noadditional capital cost and are the result of genuine engineeringtechniques rather than expensive add on technologies.
CIBSE Sustainable Awards 2011
60
Radiocity study of solar glare in the atrium space.
Lux level results for the atrium space.
Croly WIT Building:Layout 1 09/09/2011 15:58 Page 60

Lessons for the future
While the building was recently completed, it was designed overfive years ago and the techniques used should be viewed in thecontext of this time scale as there have been considerable changesin technology over this period.
The building achieved grant funding from SEI for the incorporationof a number of additional energy conservation measures includingthe provision of heat recovery on the kitchen ventilation systemwhich would have made an interesting additional case study.Unfortunately the grant funding was cancelled due to projectdelays (with the overall building funding) and the grant fundingwas removed, preventing the installation of the heat recovery.
While heat recovery is not traditionally assumed appropriate forkitchen systems due to concerns over exchanger fouling, anexamination of the system fans after a year of intensive use (withno grease build up) indicates that the heat recovery system wouldhave been successful if installed. A UV filtering proposal had beenproposed as an additional heat exchanger protection mechanism as UV light can prevent grease build up.
An analysis was also carried out on the potential use of microcombined heat and power for the building as the building has a relatively large hot water load. At the time of design thecalculations determined that a payback period in the order of 60years would be achieved but in the last five years there have beenconsiderable reductions in the cost of small CHP units and it is likelythat the application of CHP to a building of this type might beattractive in current and future market conditions, offering notableadditional energy savings.
The building’s overall energy performance is set to consume lessthan half the energy consumed by a similar building constructed togood practice standards. The building offers a unique case study ofthe use of displacement kitchen ventilation in Irish conditions.
Appendix A
Performance metrics
Kitchen of the future:
The energy savings associated with the provision of the advanced,low energy catering equipment within the “kitchen of the future”were calculated as shown in the table below. The calculation tookinto account both the savings in energy consumption associatedwith the equipment and the associated reduction in spaceconditioning energy.
Kitchen displacement ventilation strategy
The use of the displacement ventilation strategy, compared withan alternative high level supply strategy was calculated to generatethe following savings.
Lighting controls:
The use of low energy lighting and associated controls wascalculated to result in an annual saving of approximately e9,000and to have an additional cost of e65,000 which results in apayback period of 7.2 years.
It should be noted that at the time of design (five years ago) lowenergy lighting and controls was not commonly used and over thelast five years the costs of same have dramatically reduced.
CHP:
An analysis of the use of CHP in the building showed that thesystem would have a 60 year payback period. Note that CHP
Waterford Institute of Technology,Tourism and Leisure Building
61
Per kitchen
Energy saving (cooking and ventilation) 19,792 kWh/yrSaving in CO2 Emissions 3 Tonne / YearCost Saving e3,202.58 per year
Energy saving 20,216 kWh/yrSaving in CO2 Emissions 16 Tonne / YearCost Saving e2,670 per yearAdditional cost e40,814.78
Payback period 15 years
Croly WIT Building:Layout 1 09/09/2011 15:58 Page 61

engine prices have reduced considerably over the last five years andthe payback period under current prices would be in the order often years.
Overall energy monitoring:
The building’s monitoring system shows the combined heating andhot water energy usage during the first year of operation to be 158kWh/m2/yr which is a very impressive figure for a building of thistype. A comparative building of this type would consume 217kWh/m2/yr according to the CIBSE good practice guidelines.
The monitoring also shows that hot water energy consumption was only 6% of the total heating energy use which is surprisinglylow and that the kitchen fan energy was only 7% of the total electrical energy usage. This small fan energy usage supportsthe observations that the advanced controls strategy results in thefans often being run at low volumes and the natural ventilationand mixed mode option being used extensively.
The total water consumption of the building is 20m3/day which is as expected.
Care must however be taken when viewing energy informationfrom the first year of a building’s operation and preliminary results can often be misleading as an indication of the long-term performance of a building of this type.
The electrical energy is monitored by several meters:
• Overall electrical
• Typical kitchen
• Kitchen plant energy
This monitoring information will prove very useful for future projectdesign as very limited data exists on training kitchen energy usagein an Irish climate.
Initial teething problems existed with the electrical energy meterswhich were resolved half way through the year. For this reason full-year electrical energy information is not currently available but will be published later in the monitoring period.
Kitchen CFD testing
As the design of the displacement system relied heavily on the resultsof the CFD modelling it was important to test the completed kitchensand compare the results with the modelling.
A completed kitchen was applied with a known heat load andtemperature measurements were taken at various locations in thekitchen, most importantly at an operator’s position, at various heights.
The results were compared with the CFD model when applied withidentical loads and the results were remarkably similar, showing thatthe use of CFD was a valid design method for the kitchen displacementsystems.
CIBSE Sustainable Awards 2011
62
Croly WIT Building:Layout 1 09/09/2011 15:58 Page 62

School of Electrical Engineering SystemsControl, Energy, Services, Design
Located at the DIT Kevin Street, The School of ElectricalEngineering Systems is one of the longest-establishedschools of electrical engineering in Ireland with courses intechnical engineering commencing at Kevin Street in 1887.
The school's four-year honours degree programme is accredited by Engineers Ireland and the Washington Accord. It caters for education in electrical engineering from levels 6 to 10 (Apprentice to PhD) of the National Qualifications Authority of Ireland
The School of ElectricalEngineering Systemscomprises threedepartments:
• Control Engineering
• Electrical Engineering
• Electrical Services Engineering
For further information contact:
School of Electrical Engineering Systems Dept of Electrical Services EngineeringWeb: http://eleceng.dit.ie Tel:+353-1-402-4612Tel: +353-1-402-4650 Tel:+353-1-402-4666
Bachelor of Engineering (Honours) Degree:Electrical/Electronic Engineering DT021
Master of Science: Energy ManagementDT711 or DT015
Bachelor of Science (Honours) Degree: ElectricalServices & Energy Management DT712 or DT018
Master of Engineering: Sustainable ElectricalEnergy Systems DT704 or DT705
Plus many more courses
63
Croly WIT Building:Layout 1 09/09/2011 15:58 Page 63

CIBSE SDAR* Awards
The Finalists 2011: Rory Burke, Colm Saul, Jonathan Tooth (JV Tierney), Declan Leonard, Michael F.Keohane (PMG), Marc Wegner (DIT Post Graduate).
The SDAR* Awards is an initiative by CIBSE Ireland, organised by the School ofElectrical Engineering in DIT, supported by bs news, and sponsored by John Sisk & Son.SDAR stands for Sustainable Design & Applied Research and it applies to engineeringof the built environment. It is different to other competitions in that it is intended toencourage applied research, disseminate knowledge gained from this research, andraise the level and quality of innovation in projects. Entries must critically evaluate whatthey are doing and examine, in a transparent way, mistakes as well as successes oninnovative projects. In this way the profession builds capacity to innovate successfully,and moves from ideologically-driven projects sometimes offering poor value, to evidence-based innovations that provide proven value.
Entries for SDAR* Awards 2012 are due in soonAbstracts of interesting or innovative projects in which there is data, analysis and
evidence of success or failure are likely to be short listed.
One page abstracts are invited by October 31st 2011 and should be submittedelectronically to [email protected] by this date.
The five judges of the event in 2010 were all industry senior figures:
• Alan Duggan, Arup and Chairman CIBSE Ireland• Justin Keane, John Sisk & Son and CIBSE• Brian Geraghty. BGA Associates and CIBSE• Kevin O Rourke, SEAI• Kevin Gaughan, School of Electrical Engineering Systems DIT.
The event was organised by staff of the Department of Electrical Services Engineeringin DIT as part of their parallel SDAR* research centre. http://eleceng.dit.ie/sdar/
Engineering a sustainablebuilt environment
CIBSE Sustainable Awards 2011
64
SustainableDesign
and Research
in Engineering of the Built Environment
Croly WIT Building:Layout 1 14/09/2011 15:18 Page 64

bs news Faces Up! Aware that many of our readers now use Facebook on a daily basis for both social and
business purposes, bs news has joined your ranks to make it easier for you to access
articles of particular interest. Each month a mix of news stories and feature-length articles
from the printed edition will be posted on Facebook and we look forward to hearing your
views and comments.
Find us on Facebook at building services newswww.facebook.com/pages/Building-Services-News-bs-news
January/February 2011
b u i l d i n g s e r v i c e s n e w snewsbs
APHCI nowopen formembership
Newmandatory EU Directives
Sustainable engineering for the smart economy
Open up to smart
energy solutionsTHE ENERGY SHOW 2011
PUMPS AND CIRCULATORS
CONTRACTOR INITIATIVE
CIBSE ANNUAL CONFERENCE
v Jan 2011:Cov
er April 2009
(D) 17/02/201
1 15:13 Page
1
March/ April 2011
b u i l d i n g s e r v i c e s n e w s
newsbs
CIBSEAnnualConferenceSDAR
AwardsPresentation
Lighting – anenvironmentworth saving?The fundamentalsof heat pumptechnology
May/June 2011b u i l d i n g s e r v i c e s n e w snewsbs
BuildingManagementSystemss andControls
Mowlds isnew CIBSEChairman
Visit to RettigIreland inLimerick
Craftapprenticesendangered
New SDAR Journal Cover:Layout 1 09/09/2011 16:09 Page 4

A Better Business DecisionSwitch to Airtricity today
www.airtricity.com
The SDAR* Journal September 2011 is published by CIBSE Ireland andThe School of Electrical Engineering Systems in the Dublin Institute of Technology.
Produced by:
Pressline Ltd, Carraig Court, George’s Avenue, Blackrock, Co Dublin.Tel: 01 - 288 5001/2/3 Fax: 01 - 288 6966 email: [email protected] web: www.pressline.ie
OBC Airtricity:Layout 1 12/09/2011 09:55 Page 1