sequential analysis of team communications and effects on
TRANSCRIPT

■ 423
36Sequential Analysis of Team Communications and Effects on Team
PerformanceAllan Jeong, PhD
This chapter proposes a set of tools and methods for evaluating, modeling, and predicting team
performance based on the sequential analysis of team communication patterns. The method of sequential analysis is described along with specific software tools and techniques that facilitate the analysis of dialogue moves and move sequences observed in communications exchanged among team members. The dialogic theory and its assump-tions are presented to establish a theoretical frame-work for determining how to sequentially analyze, model, and interpret observed patterns in team communication processes. Step-by-step instructions are presented to illustrate how (a) to assess the effect of latent variables (e.g., message function, response latency, communication style) and exogenous vari-ables (e.g., gender, discourse rules, context) on when and how certain dialogue moves elicit subsequent moves, and (b) to assess how and to what extent the resulting communication patterns correlate with improvements in group decision making, group problem solving, and team performance.
Introduction to Team CommunicationsTeam performance depends not only on the skills and contributions of individual team members but also on the ways in which team members engage in communication processes that facilitate team deci-sion making and problem solving. In other words, how team members communicate with one another
can shape and determine team performance (Fiore, Salas, Cuevas, & Bowers, 2003; Salas & Cannon-Bowers, 2000) as well as team motivation, concen-tration, strategy, skill acquisition, attitudes, feelings, and behavior (Yukelson, 1993). However, precise models of team communication processes and the ways in which specific processes affect team per-formance have not yet been examined adequately (Guerlain, Shin, Guo, Adams, & Calland, 2002). The current state of research on team communications can be attributed to the lack of tools and methods to support the detailed analysis and modeling of team communication processes (Domagoj, Tenenbaum, Eccles, Jeong, & Johnson, 2009).
Some of the tools and methods that can be used to analyze and model team communications and team performance were recently developed to model processes observed in computer-mediated communication (CMC) and computer-supported collaborative learning (CSCL). The tools were devel-oped with the purpose of attaining a deeper under-standing of CMC and its effects on group interac-tion, group performance, and learning (Garrison, 2000; Koschmann, 1999; Mendl & Renkl, 1992). One of these approaches is sequential analysis (Bake-man & Gottman, 1997), a method used to measure and study the sequential nature of messages and responses exchanged within groups to determine how particular processes, and the variables affecting the processes, either help groups achieve or inhibit groups from achieving desired outcomes (Jeong, 2003a; Koschmann, 1999; Soller, 2004). This process-oriented approach enables researchers to develop

424 ■ Allan Jeong, PhD
computational models (represented quantitatively and visually) to explain and predict patterns in group interaction based on specific characteristics of the message and the conditions surrounding the exchange of messages.
A precursor to sequential analysis was content analysis, an analytical method commonly used to study verbal exchanges in interpersonal communi-cations. In content analysis, messages (or dialogue moves) are classified into categories, and the mes-sage frequencies observed in each category are com-puted to determine what communication patterns exist (Rourke, Anderson, Garrison, & Archer, 2001). This approach generates results that are descriptive rather than prescriptive, reporting, for example, the frequencies of arguments, challenges, and explanations observed in team deliberations and decision making. Message frequencies, however, provide little information to explain or predict how participants respond to given types of messages (e.g., argument → challenge versus argument → simple agreement), how response patterns are influ-enced by latent variables (e.g., message function, content, communication style, response latency) and exogenous variables (e.g., gender, personality traits, discussion protocols, type of task), and how particular response patterns help to improve group performance to achieve desired outcomes.
In contrast, sequential analysis enables research-ers to determine the transitional probabilities between dialogue moves across different categories. In other words, sequential analysis determines how likely one dialogue move of a given category (e.g., claim) is to elicit specific types of responses (e.g., challenge, question) based on what is said in conjunction with when, how, who, and why messages are presented (Jeong, 2004, 2006, 2007). Sequential analysis also determines whether the elicited responses help produce sequences of dialogue moves that support critical discourse (e.g., claim → challenge → explain), group decision making, problem solving, and learn-ing. Sequential analysis has been used in studies on interpersonal communication conducted over the last 30 years, including studies on the conversational patterns of married couples, children at play, and mother–infant play (Bakeman & Gottman, 1997, pp. 184-193; Gottman, 1979) and studies on human–computer interaction (Olson, Herbsleb, & Rueter, 1994). More recently, the techniques and tools used to conduct sequential analysis have been refined (Jeong, 2009) and implemented to analyze (as well as visualize) discourse patterns in CMC in response to previous claims that sequential analysis may be the missing factor in research on the effects of com-puter-mediated environments and computer-based
instruction (England, 1985; King & Roblyer, 1984).To help advance research on team communica-
tions and team performance, this chapter describes software tools and a seven-step procedure for sequentially analyzing communication processes based on recent refinements to the original methods developed by Bakeman and Gottman (1997). The procedural descriptions that follow are illustrated with findings from previous studies on group discourse in CMC and computer-supported argu-mentation (Jeong, 2003a, 2003b, 2004, 2006; Jeong & Juong, 2007) in order to provide a more comprehen-sive demonstration of the tools and methods. Nev-ertheless, the described procedures can be readily applied to analyzing team communications in team sports, as was illustrated in a recent study compar-ing the communication patterns between winning and losing teams in doubles tennis (Domagoj et al., 2009). The discussion begins with a proposed set of theoretical assumptions to establish the founda-tion underlying the use of sequential analysis and the research designs for investigating the effects of latent and exogenous variables on group interaction patterns in team communications.
Theoretical FrameworkThe dialogic theory (Bakhtin, 1981) is a theoreti-cal framework that can be used to conceptualize and operationalize team communication measures in group tasks or group learning (Koschmann, 1999). In this theory, language is viewed as part of a social context in which all possible meanings of a word interact, possibly conflict, and affect future meanings. As a result, meaning does not reside in any one utterance (or message). Instead, meaning emerges from examining the relationships between multiple utterances (e.g., a message and replies to the message). Through the process of examining the interrelationships and conflicts that emerge from a social exchange, meaning is renegotiated and reconstructed through extended social interaction. Conflicts that emerge from the interactions are what drive further inquiry, reflection and articulation of individual viewpoints and underlying assumptions.
The two main assumptions are that (1) conflict is produced not by only ideas presented in one message, such as an argument or claim, but also by the juxtaposition of opposing ideas presented in a message and responses to the message and (2) conflicts produced in exchanges trigger subsequent responses that can serve to verify (e.g., argument → challenge → evidence) and justify (e.g., argu-ment → challenge → explain) stated arguments and claims. These assumptions imply that we

Sequential Analysis of Team Communications and Effects on Team Performance ■ 425
should focus on analyzing the frequency of specific message–response pairs (e.g., argument → chal-lenge, challenge → explain) and not the frequency of messages alone (e.g., arguments, challenges, explanations). Support for this theory can be drawn from extensive research on collaborative learning that shows that conflict and the consideration of both sides of an issue are needed to drive inquiry, reflection, articulation of individual viewpoints, and underlying assumptions and ultimately to achieve deeper understanding (Johnson & Johnson, 1992; Wiley & Voss, 1999). The need to explain, justify, or understand is felt and acted on only when conflicts or errors are brought to attention (Baker, 1999). This process plays a key role not only in increas-ing understanding but also in improving decision making (Lemus, Seibold, Flanagin, & Metzger, 2004).
Step 1: Choose a Metric for Measuring and Comparing Group Interaction PatternsA number of possible metrics can be used to ana-lyze and identify patterns in message–response sequences. The two metrics that are perhaps the most meaningful are (1) transitional probabilities, which are probabilities that determine, for example, what percentage of the observed responses to argu-ments are challenges versus supporting evidence versus explanations, and (2) mean response scores, which are the mean number of specific responses elicited per message category, such as the mean number of challenges, supporting evidence, or explanations elicited per stated argument.
Transitional probabilities are computed by tal-lying the frequency of a particular response posted in reply to a particular message type. The results are reported in a frequency matrix (table 36.1). The observed frequencies are converted into relative fre-quencies or transitional probabilities for each response type for each message category (table 36.2). To deter-mine whether the transitional probabilities of each response to each message category are significantly higher or lower than expected and to determine whether a pattern exists in the way in which partici-pants respond to messages in a particular category, z-scores are computed and reported in a Z-matrix (table 36.3). As opposed to using the chi-square test for independence, this z-score statistic, which was proposed by Bakeman and Gottman (1997, pp. 108-111), takes into account not only the observed total number of responses to a particular message cat-egory but also the marginal totals of each response type observed across all message types.
The transitional probabilities can be conveyed visually in the form of a state diagram (figure 36.1) that provides a Gestalt view of team communication processes and a visual means to identify response patterns and predict event sequences that are most likely to occur. For example, the diagram can be used to determine or predict how often arguments will elicit challenges versus counterarguments and how often challenges will elicit explanations versus counterchallenges to determine overall how likely the observed patterns of interaction will lead to constructive dialogue (e.g., argument → challenge → explanation) versus nonproductive dialogue (e.g., argument → opposing argument).
■ Table 36.1 ■
Frequency Matrix Produced With the Discussion Analysis Tool
Arg But Evid Expl RepliesNo
replies Givens%
targets%
givens
Arg 3 101 73 16 193 35 112 .25 .30
But 3 82 88 91 264 24 149 .35 .40
Evid 0 64 50 48 162 22 35 .21 .09
Expl 0 51 22 71 144 55 74 .19 .20
Total responses observed 14 307 233 229 763 136 370
For example, 101 challenges (But) were posted in response to arguments (Arg). This frequency (in bold) was higher than the expected fre-quency based on its z-score value of 3.96 at p < .01. Values significantly lower than expected are in bold and italic. Evid = evidence, EXPL = explanations.
From Jeong, 2009.

426 ■ Allan Jeong, PhD
The second metric, mean response scores, determines the number of times a given type of message elicits a particular type of response. This metric describes the overall level of performance by measuring, for example, the mean number of chal-lenges elicited per argument and the mean number of explanations elicited per challenge. This is simi-lar to measuring the percentage of arguments left unchallenged and the percentage of challenges left unresolved. As a result, this particular metric can be used to determine at what level participants are critically analyzing arguments (e.g., argument → challenge → explain) or are engaging in processes that block critical discourse (e.g., argument → counterargument, argument → no response). When mean response scores are used, statistical methods such as t-tests and ANOVA can be used to test for differences in response patterns among experimen-tal conditions, and effect sizes can be computed to determine to what extent the observed differences are meaningful.
Transitional probabilities can be used to explain observed differences in mean response scores. For example, one group might exhibit a tendency to respond to arguments with more challenges and less supporting evidence, whereas another group might exhibit a tendency to respond to arguments with
■ Table 36.2 ■
Transitional Probability Matrix
Arg But Evid Expl RepliesNo
replies GivensReply rate
Arg .02 .52 .38 .08 193 35 112 .69
But .01 .31 .33 .34 264 24 149 .84
Evid .00 .40 .31 .30 162 22 35 .37
Expl .00 .35 .15 .49 144 55 74 .26
Total responses observed 14 307 233 229 763 136 370 .52
For example, 52% of all responses to arguments (Arg) were challenges (But). Values in bold identify probabilities significantly higher than expected. Values in bold and italic identify probabilities significantly lower than expected. Evid = evidence, Expl = explanations.
■ Table 36.3 ■
Z-Score Matrix
Arg But Evid Expl
Arg −0.34 3.96 2.54 −7.62
But −1.05 −3.76 1.22 1.95
Evid −1.96 −0.21 0.10 −0.12
Expl −1.82 −1.31 −4.41 5.61
Z-scores < −2.32 (in bold and italic) reveal probabilities that were significantly lower than expected. Z-scores ≥ 2.32 (in bold) reveal probabilities that were significantly higher than expected. Arg = argument, But = challenge, Evid = evidence, Expl = explanation.
E4946/Tenenbaum/fig36.1/383061/alw/r1
ARG BUT
EXPL EVID
.08
.01
.15
.52
.31
.35
.40
.34.38
.33
.02
.30
.31.49
Figure 36.1 Transitional state diagram. ARG = argument, BUT = challenge, EVID = supporting evidence, and EXPL = explanation.Reprinted by permission from A. Jeong 2009.

Sequential Analysis of Team Communications and Effects on Team Performance ■ 427
more supporting evidence but fewer challenges. If a significant difference is found in the mean number of challenges elicited per argument between groups, the differences in interaction patterns might suggest that the second group posts fewer challenges in response to arguments because its members allocate more time and resources to developing evidence to support arguments, which leaves less time and resources to challenge arguments. Thus, transitional probabilities and mean response scores can be used simultaneously, with one metric used as the main dependent variable and the other used for post hoc analysis. However, transitional probabilities are best used as the main dependent variable when conduct-ing an exploratory study, whereas mean response scores are best for conducting experimental studies.
Step 2: Specify A Priori Tests for Specific Message–Response Pairs
In research using transitional probabilities or mean response scores, the specific message–response pairs to be examined in a study should be defined a priori because the total number of possible event pairs grows exponentially with the addition of each mes-sage category to the coding scheme. For example, a coding scheme consisting of four categories (e.g., argument, challenge, explain, evidence) produces a 4 × 4 matrix resulting in 16 possible event pairs (e.g., argument → challenge, challenge → argument, challenge → explain, explain → challenge, and so on). Testing all 16 event pairs for differences in mean response scores involves too large a number of con-trasts to adequately control for type I error (finding significant differences when the differences are actually the result of random chance alone). Power can be increased by testing only a select number of event pairs, particularly those that are believed to support group performance (e.g., argument → challenge, challenge → explain).
To identify the most important sequences to examine in a study, the researcher should review existing literature for specific models for achiev-ing specific tasks. The specific message–response sequences that were examined in the previous studies (discussed earlier) were selected on the dialogic theory’s assumptions that deeper and more critical inquiry revolves around exchanges in which opposing or conflicting viewpoints are juxtaposed. The other alternative is to closely examine social exchanges while groups perform a particular task (Mandl & Renkl, 1992) and to identify the subordi-nate skills and skill sequences needed to complete the task by using the techniques for analyzing intel-lectual skills (Dick, Carey, & Carey, 2005, pp. 38-56).
Step 3: Collect Discussions and Messages Parsed and Classified by Dialogue Moves
The next step is to parse transcripts of the team communications into discrete units of analysis. Each unit must be classified by function (or dialogue move) based on an established coding scheme using the same procedures for conducting quantitative content analysis (Rourke, Anderson, Garrison, & Archer, 2001). However, the process of parsing and coding is fraught with a number of methodologi-cal challenges in which the reliability, validity, and feasibility of parsing and coding messages pose significant problems. Messages often address multiple topics or functions, making the process of parsing each message into discrete segments extremely difficult to achieve with high interrater reliability. As a result, researchers have debated the merits of parsing and categorizing messages by sentence, paragraph, message, unit of meaning, and dialogue move. The problem with interrater reliability is then compounded when mapping the links between units presented within a message and units presented within responses to the message (Gunawardena, Lowe, & Anderson, 1997; Newman, Johnson, Cochrane, & Webb, 1996).
One approach to this problem (at least in CMC research) is to instruct participants to classify, label, and post messages that address one and only one function (e.g., argument, evidence, challenge, expla-nation) at a time. Table 36.4 provides instructions for structuring online group debates. In this approach, each message is associated with one and only one dialogue move. As a result, the challenges associ-ated with parsing messages into discrete units of analysis are minimized if not eliminated. Another advantage of this approach is that larger data sets can be attained more easily to generate a sufficient number of event pairs to test transitional probabili-ties and mean response scores.
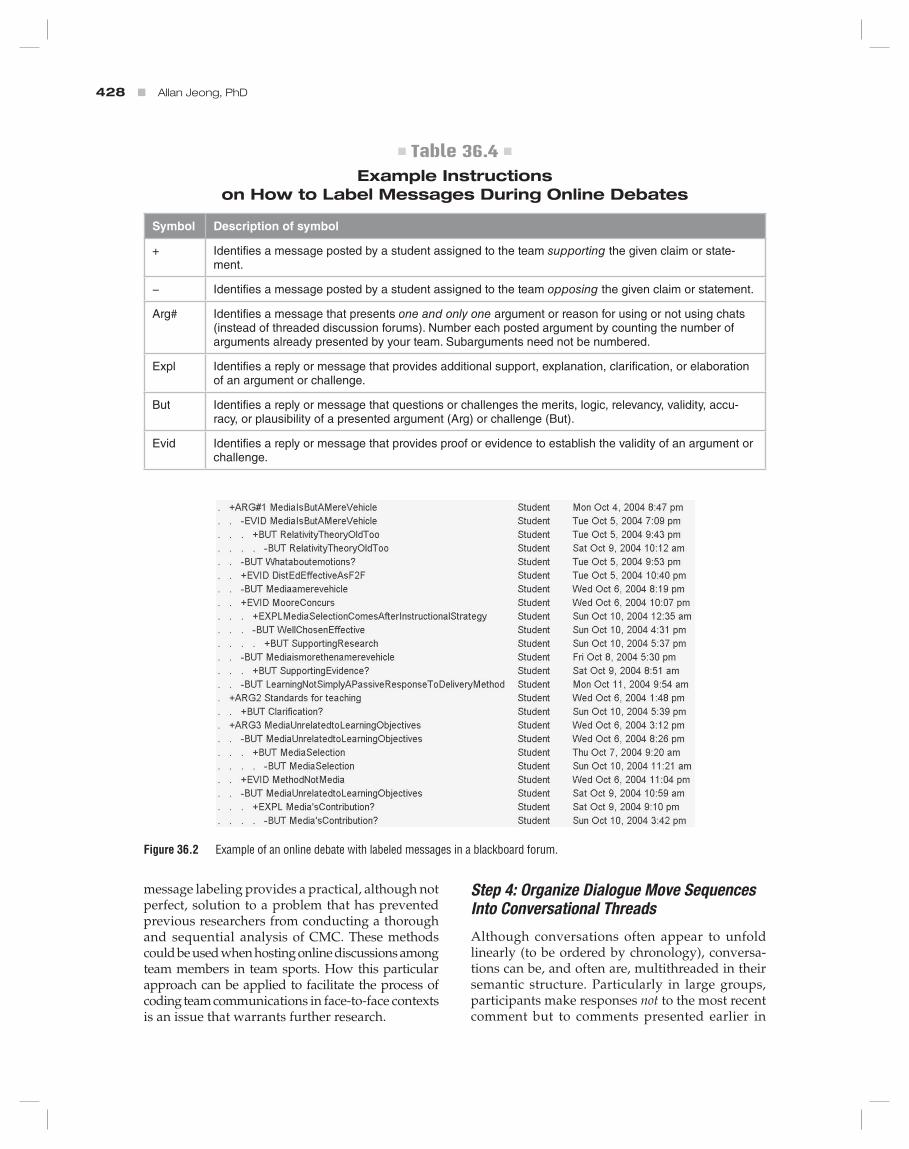
Message labeling has been implemented in a number of computer-supported collaborative argumentation (CSCA) systems to scaffold argu-mentation and problem solving (Carr & Anderson, 2001; Cho & Jonassen, 2002; McAlister, 2003; Slof-fer, Dueber, & Duffy, 1999; Veerman, Andriessen, & Kanselaar, 1999) and to enable participants to see the overall structure and organization of their argu-ments (see figure 36.2). However, message labeling in itself can affect group interactions and the valid-ity of the findings. At this time, the effects of mes-sage labeling have not yet been fully investigated, and initial findings are still inconclusive (Beers, Boshuizen, & Kirschner, 2004; Jeong, 2004; Strijbos, Martens, Jochems, & Kirschner, 2004). Nevertheless,
428 ■ Allan Jeong, PhD
message labeling provides a practical, although not perfect, solution to a problem that has prevented previous researchers from conducting a thorough and sequential analysis of CMC. These methods could be used when hosting online discussions among team members in team sports. How this particular approach can be applied to facilitate the process of coding team communications in face-to-face contexts is an issue that warrants further research.
Step 4: Organize Dialogue Move Sequences Into Conversational Threads
Although conversations often appear to unfold linearly (to be ordered by chronology), conversa-tions can be, and often are, multithreaded in their semantic structure. Particularly in large groups, participants make responses not to the most recent comment but to comments presented earlier in
■ Table 36.4 ■
Example Instructions on How to Label Messages During Online Debates
Symbol Description of symbol
+ Identifies a message posted by a student assigned to the team supporting the given claim or state-ment.
− Identifies a message posted by a student assigned to the team opposing the given claim or statement.
Arg# Identifies a message that presents one and only one argument or reason for using or not using chats (instead of threaded discussion forums). Number each posted argument by counting the number of arguments already presented by your team. Subarguments need not be numbered.
Expl Identifies a reply or message that provides additional support, explanation, clarification, or elaboration of an argument or challenge.
But Identifies a reply or message that questions or challenges the merits, logic, relevancy, validity, accu-racy, or plausibility of a presented argument (Arg) or challenge (But).
Evid Identifies a reply or message that provides proof or evidence to establish the validity of an argument or challenge.
E4946/Tenenbaum/fig36.2/383063/alw/r1
Figure 36.2 Example of an online debate with labeled messages in a blackboard forum.

Sequential Analysis of Team Communications and Effects on Team Performance ■ 429
the conversational thread. For example, in figure 36.2 the sixth message down the list (−But What about emotions?) was posted at 9:53 p.m. in direct response to the second message (+Arg#1) posted 2 days earlier and not in response to the fourth message (+But) posted only 10 min earlier at 9:43 p.m.
The multithreaded nature of conversations observed in face-to-face contexts can be orga-nized visually into a hierarchical structure using a common spreadsheet (as illustrated in figure 36.2). Each dialogue move listed in the hierarchical struc-ture is tagged with the assigned code (e.g., +But). Following each code is a complete transcript of the dialogue move or some title that conveys the main idea presented in the dialogue move. Finally, each coded dialogue move is assigned a thread level—a whole number representing its relative location within the conversational thread. The thread level for each dialogue move is determined by simply counting the number of indentations to the right relative to the first message in each conversational thread. For example, a thread level of 2 is assigned to message +Arg#1 in figure 36.2, a level of 3 is assigned for −Evid, a level of 4 is assigned for +But, a level of 5 is assigned for −But, and a level of 3 is assigned for −But. Thus, the data set is reduced to codes and thread levels so that the dialogue moves
can be sequentially analyzed to identify emerging patterns in team communications.
Step 5: Prepare Data for Analysis According to Questions Under ExaminationThe Discussion Analysis Tool (DAT; Jeong, 2009), which is a software program, can be used to automatically harvest the codes and compute the thread level for each dialogue move recorded in a spreadsheet such as the one illustrated in figure 36.2. All codes are pulled into column A in a DAT spreadsheet (see figure 36.3), and the thread level for each coded dialogue move is recorded in column B. Once all the data are extracted into DAT, the codes must be checked for interrater reliability against the Cohen kappa coefficient (Rourke et al., 2001, p. 6). At this time, DAT is the only tool available for processing data from a hierarchically organized spreadsheet (such as the one in figure 36.2) to pro-duce the data needed to sequentially analyze both linear and multithreaded conversations.
Once all the codes and thread levels have been entered into DAT, the codes in column A can be mod-ified, expanded, and collapsed to examine group interaction patterns from different perspectives depending on the variables that are being examined. For example, the codes in column A of figure 36.3
Figure 36.3 Screen shot of DAT for processing and analyzing message sequences (Jeong, 2006). Codes ending in s are dialogue moves presented in a conversational style. Codes ending in o are dialogue moves presented in a purely expository style.Reprinted by permission from A. Jeong 2006.
E4946/Tenenbaum/fig36.3/383067/alw/r1

430 ■ Allan Jeong, PhD
have been expanded to identify dialogue moves presented in a conversational style (e.g., arguments presented with greetings, emotions, acknowledg-ments, addresses to other members by name, and so on), which are coded as Args, versus dialogue moves presented in a purely expository style, which are coded as Argo.
By appending additional tags (such as s and o) to the codes, different variables can be taken into consideration to examine their effects on team com-munication patterns and vice versa. This procedure has been used in research on team communications in online discussions to analyze the effects of either using or not using qualifiers when stating claims (Jeong, 2005) as well as the effects of response time (Jeong, 2004), gender (Jeong & Davidson-Shivers, 2006), and intellectual openness (Jeong, 2007). These studies all examine how characteristics of a dialogue move (based on why, how, when, and who performs the dialogue move) affect the way other team members respond to a move to produce particular communi-cation patterns. Appending tags to identify dialogue moves produced by high- versus low-performing teams produces state diagrams to reveal potential dif-ferences in communication patterns—differences that can potentially explain and predict team performance.
Step 6: Compute Transitional Probabilities, Z-Scores, and State DiagramsBy clicking on Start Event Sequence Analysis in DAT (see figure 36.3), the conversational exchanges
recorded in the data are translated into a transitional probability matrix (figure 36.4). Comparing the transitional probabilities in the upper-left quadrant of the probability matrix, for example, reveals how often dialogue moves presented in an expository style elicit responses also presented in an exposi-tory style. In contrast, the lower-right quadrant reveals how often dialogue moves presented in a conversational style elicit responses also presented in a conversational style. Each quadrant can be converted into a state diagram to compare, iden-tify differences in, and model interaction patterns in conversational threads that consist of dialogue moves presented in an expository versus conver-sational style (figure 36.5).
One alternative to using DAT is the General Sequential Querier (GSEQ) developed by Bakeman and Quera (1995). GSEQ performs a wide range of statistical functions to analyze event sequences, timed-event sequences, interval sequences, and cross-classified events. What separates DAT from GSEQ is that DAT (a) analyses multithreaded con-versations and events, (b) makes more transparent within Excel the formulas and functions used to compute probabilities and z-scores, (c) provides an interface with Excel and tools to support data preparation and analysis, (d) identifies the location of each event pair tallied in frequency matrices, and (e) generates transitional state diagrams using arrows or edges with varying densities that directly reflect the transitional probabilities among the nodes or events.
Arg But Evid Expl Arg But Evid Expl RepliesNo
replies GivensReply rate
Arg .01 .35 .20 .10 .00 .20 .06 .07 231 27 143 .81
But .00 .43 .11 .05 .00 .34 .03 .04 130 133 239 .44
Evid .00 .38 .09 .18 .00 .31 .04 .00 45 44 81 .46
Expl .00 .48 .10 .00 .00 .34 .00 .07 29 27 50 .46
Arg .02 .46 .07 .06 .00 .35 .04 .00 54 8 32 .75
But .00 .43 .04 .06 .00 .31 .05 .11 94 91 174 .48
Evid .00 .25 .25 .00 .00 .37 .12 .00 8 22 30 .27
Expl .00 .20 .05 .10 .00 .45 .05 .15 20 20 37 .46
n = 3 238 79 50 0 174 30 37 611 372 786 .68
Figure 36.4 Transitional probability matrix of event sequences produced by DAT (Jeong, 2006). Arg = argument, But = challenge, Evid = supporting evidence, Expl = explanation. Values in bold are a message presented in a conversational style. For example, the 32 arguments presented with conversational style elicited 21 total responses, and 90% of the responses were challenges.Reprinted, by permission, from A. Jeong, 2006, “The effects of conversational styles of communication on group interaction patterns and argumentation in online discussions,” Instructional Science 34(5): 367-397.

Sequential Analysis of Team Communications and Effects on Team Performance ■ 431
Step 7: Interpret the Transitional Probabilities for Interaction Patterns
A visual inspection of the transitional state dia-grams in figure 36.5 reveals potential differences in communication patterns produced by dialogue moves that are presented in expository versus con-versational style during argumentative discussions. The diagrams show that arguments presented in a conversational style are far more likely to elicit chal-lenges. Also, challenges presented in a conversa-tional style are far more likely to elicit explanations.
A number of statistical tests can be used to deter-mine whether the noted communication patterns are significantly different. One option is to use the chi-square test to determine, for example, if the transitional probabilities of all responses to Argo versus Args are significantly different. In the study by Jeong (2006), DAT was used to output numerical data that counted the number of challenges elicited by each argument, the number of explanations elic-ited by each challenge, and so on. These data were then analyzed by a common statistical software pro-
gram to test for differences in mean response scores (e.g., the average number of challenges elicited per Argo versus Args) using independent t-tests. These t-tests revealed that (a) the average number of challenges elicited by arguments presented in a conversational style was significantly higher than the number of challenges elicited by arguments presented in an expository style and (b) the aver-age number explanations elicited by arguments presented in a conversational style was significantly higher than the number of explanations elicited by challenges presented in an expository style.
Arriving at a meaningful interpretation of inter-action patterns revealed from sequential analysis is often a difficult process due to the large number of statistical tests that can be performed across the many possible message–response pairs that arise from the complex nature of group interaction. Type I errors can be avoided by minimizing the number of possible tests and comparisons and focusing the analysis on only those message–response sequences that exemplify the processes believed to improve group performance and specified in the a priori
E4946/Tenenbaum/fig36.5a/383069/alw/r1
ARG BUT
EXPL EVID
.16
.18
.52
.73
.82 .59
.09+.38
.18
.01
+.28
.14
a
Figure 36.5 Transitional state diagrams illustrating the response patterns produced from messages with or without conversational language (Jeong, 2006).Reprinted, by permission, from A. Jeong, 2006, “The effects of conversational styles of communication on group interaction patterns and argumentation in online discussions,” Instructional Science 34(5): 367-397.
.23
E4946/Tenenbaum/fig36.5b/410724/alw/r1
ARGs BUTs
EXPLs EVIDs.08
.90
.66
.69
.75
+.23.10
.11
.25
b

432 ■ Allan Jeong, PhD
hypotheses. The final word of caution is that when a particular pattern of interaction is revealed in a z-score matrix (where the transitional probability of an event sequence is significantly higher or lower than the expected frequency), the researcher should verify that the finding is supported by sufficient cell frequencies in the frequency matrix for the given message–response pair and the finding is not biased by coding errors in the message labels.
Recommendations for Researchers and PractitionersMore detailed discussions of the method and its limitations can be found in the cited references. The limitations noted there provide recommendations and ideas for future research. Nevertheless, here are some recommendations. Researchers should (a) examine multiple discussion groups to prevent the idiosyn-crasies of any one particular group from exerting too large an influence on the results, (b) examine the interrelationships among multiple variables and their relative effect using multiple regression, (c) expand the analysis to measure the frequency of three-event sequences to determine whether some event pairs are more effective than others in eliciting desired responses, (d) identify sequences that distinguish experts from novices using multidimensional scaling (Soller, 2004), and (e) test and validate process models across different types of team tasks that take other categories of dialogue moves into consideration to help identify unique patterns of communication that can lead to better team performance.
Despite limitations, the methods and tools described in this chapter provide a road map on how to model and study team communications, the effects of different variables on team com-munications, and the relationship between team communications and team performance. The tools and methods presented here enable researchers to embark on a microlevel approach to measur-ing, visualizing, and formalizing models of team communications at a level not seen before in the effort to identify new directions for research and development of methods that improve team per-formance. From the practitioner’s perspective, the research findings resulting from the proposed tools and methods can support an evidence-based approach to designing training and interventions to improve team communication skills and pro-cesses. The developments in CMC research and technologies in themselves might also serve as useful tools to help teams develop more effective communication.
Sequential analysis can be used to model not just patterns in the dialogue exchanged among athletes on the same or opposing teams but also patterns in the communications between trainer and athlete as well as patterns in the overt interactions between athlete and training technologies. Finally, sequential analysis can also be used to model the sequences of cognitive and emotional responses and behaviors observed in training and competition (Calmeiro, 2006). The hope is that these methods and software tools will enable more researchers to apply sequen-tial analysis to the study of human behavior and performance.