serumcd163andtarcasdiseaseresponsebiomarkersin...
TRANSCRIPT

Predictive Biomarkers and Personalized Medicine
SerumCD163 and TARC asDisease Response Biomarkers inClassical Hodgkin Lymphoma
Kimberley Jones1,2, Frank Vari1, Colm Keane1,3,4, Pauline Crooks1, Jamie P. Nourse1, Louise A. Seymour1,2,3,David Gottlieb5, David Ritchie6, Devinder Gill2,3, and Maher K. Gandhi1,2,3
AbstractPurpose: Candidate circulating disease response biomarkers for classical Hodgkin lymphoma (cHL)
might arise fromHodgkin–Reed–Sternberg (HRS) cells or nonmalignant tumor-infiltrating cells. HRS cells
are sparse within the diseased node, whereas benign CD163þM2 tissue-associatedmacrophages (TAM) are
prominent. CD163þ cells within the malignant node may be prognostic, but there is no data on serum
CD163 (sCD163). The HRS-specific serum protein sTARC shows promise as a disease response biomarker.
Tumor-specific and tumor-infiltrating circulating biomarkers have not been compared previously.
Experimental Design:We prospectively measured sCD163 and sTARC in 221 samples from 47 patients
with Hodgkin lymphoma and 21 healthy participants. Blood was taken at five fixed time-points prior,
during, and after first-line therapy. Results were compared with radiological assessment and plasma
Epstein-Barr virus DNA (EBV-DNA). Potential sources of circulating CD163 were investigated, along with
immunosuppressive properties of CD163.
Results: Pretherapy, both sCD163 and sTARC were markedly elevated compared with healthy and
complete remission samples. sCD163 better reflected tumor burden during therapy, whereas sTARC had
greater value upon completion of therapy. sCD163 correlated with plasma EBV-DNA, and associated with B
symptoms, stage, and lymphopenia. Circulating CD163þ monocytes were elevated in patients, indicating
that sCD163 are likely derived from circulating and intratumoral cells. Depletion of cHL CD163þ
monocytes markedly enhanced T-cell proliferation, implicating monocytes and/or TAMs as potential novel
targets for immunotherapeutic manipulation.
Conclusion: The combination of circulating tumor-infiltrate (sCD163) and tumor-specific (sTARC)
proteins ismore informative than eithermarker alone as disease response biomarkers in early and advanced
disease during first-line therapy for cHL. Clin Cancer Res; 19(3); 731–42. �2012 AACR.
IntroductionClassical Hodgkin lymphoma (cHL) is associated with
high cure rates (1). Those with a rapid response to initialtreatment have the best outcomes, and may benefit fromtruncated treatment regimens. Paradoxically, there remainsa significant minority with refractory disease in whomprolonged exposure to first-line agents induce chemo-resis-tance and unnecessary toxicity. The challenge remains to
tailor treatments to eradicate malignancy with minimalside-effects, and to simultaneously identify those patientsin whom alternate strategies should be instituted early.
Radiological imaging modalities such as computedtomography (CT) or positron emission tomography(PET) scans are typically used to assess treatment efficacy.Although combined functional-anatomical imagingmodality (PET/CT) has a high negative predictive value,its positive predictive value is more modest (2, 3). Out-side of the context of a clinical trial, PET/CT scanning istypically available only before and at the end of, but notduring, therapy. Unlike blood tests, it is impractical toconduct PET/CT before each follow-up visit (4). Further-more, PET/CT interpretation can be confounded by con-current inflammation or infection, and influenced by thetiming of prior therapy.
Ideal biomarkersmust be specific, sensitive, easy to assay,and interpret, with rapid turnaround, high reproducibility,and comparability between laboratories. Serum proteinestimation by ELISA exploits an established technologyused in the diagnostic laboratory. Furthermore, while tissuemarkers could be applied routinely to the diagnostic biopsy
Authors' Affiliations: 1Clinical Immunohaematology Laboratory, Queens-land Institute of Medical Research (QIMR); 2School of Medicine, Universityof Queensland; 3Department of Haematology, Princess Alexandra Hospi-tal, Brisbane, Queensland; 4Griffith University, Gold Coast; 5WestmeadMillennium Institute, University of Sydney, Westmead; and 6Department ofHaematology, Peter MacCallum Cancer Centre and University of Mel-bourne, Melbourne, Australia
Note: Supplementary data for this article are available at Clinical CancerResearch Online (http://clincancerres.aacrjournals.org/).
Corresponding Author: Maher K. Gandhi, Clinical ImmunohaematologyLaboratory, QIMR, 300HerstonRd., Brisbane, QLD4006, Australia. Phone:617-3845-3792; Fax: 617-3845-3510; E-mail: [email protected]
doi: 10.1158/1078-0432.CCR-12-2693
�2012 American Association for Cancer Research.
ClinicalCancer
Research
www.aacrjournals.org 731
on June 23, 2018. © 2013 American Association for Cancer Research. clincancerres.aacrjournals.org Downloaded from
Published OnlineFirst December 5, 2012; DOI: 10.1158/1078-0432.CCR-12-2693

to provide prognostic information, they have no applica-bility in monitoring disease response. In contrast, blood-based biomarkers have potential to provide information ondisease response and detection of early relapse. It is knownthat indirect blood markers of biologic activity, such aserythrocyte sedimentation rate, lymphocyte count, hemo-globin, and albumin have prognostic value at baseline.However, once therapy has commenced, their lack of spec-ificity precludes their clinical value as a measure of diseaseresponse. A validated circulating measure of tumor burden,that is informative in the majority of patients, and accu-rately reflects disease response during first-line therapywould be of great benefit.
In cHL, the malignant Hodgkin –Reed–Sternberg (HRS)cells account for a minority of the diseased nodal cellpopulation. The affected node is primarily composed ofnonneoplastic, tumor-infiltrating cells which are importantin pathogenesis (5). It is yet to be determined whetherdisease response in patients with cHL will be best reflectedby HRS-specific or tumor-infiltrate specific biomarkers.Biomarkers that originate from HRS cells hold the promiseof high specificity, whereas those that reflect the benigntumor-infiltrate may bemore sensitive. The relative kineticsof circulating tumor-specific versus tumor-infiltrating bio-markers during therapy have not been compared.
The cysteine-cysteine thymus and activation related che-mokine (TARC, CCL17) is elevated in HRS cell-lines, pri-mary cHL tissues, and pretherapy cHL patient serum (irre-spective of EBV-tissue status) and holds promise as a tumor-specific disease response marker in cHL (6–11). A recentstudy of 60 cHL patients with serial samples throughouttherapy found that sTARC reflected disease response in bothearly- and advanced-stage cHL and in relapsed disease (11).
cHL nodes are enriched with anti-inflammatory M2macrophages. CD163 is an M2 macrophage marker that is
also expressed in a subset of monocytes, and is highlyexpressed within tumor-infiltrating cells of the malignantnode. Tissue levels of CD163 within the cHL node may beassociated with survival, but results are conflicting (12–18).A study of serum CD163 (sCD163) in patients with stage I/II melanoma found that pretherapy sCD163 was an inde-pendent predictor of survival (19). To our knowledge, nostudy of serum CD163 (sCD163) in Hodgkin lymphomahas been conducted.
We prospectively evaluated sCD163 and sTARC inpatients with Hodgkin lymphoma (43 cHL and 4 nodularlymphocyte predominant: NLPHL) at 5 fixed time-points;pretherapy, during (immediately before the second andthe third cycles), one month, and 6 months after com-pletion of therapy. Results were compared with diseaseresponse as determined by radiological assessment. Inpatients with EBV-related cHL, plasma cell-free EBV-DNAwas quantified. cHL tissue CD163 immunohistochemis-try was correlated to matched serum samples. Potentialsources of circulating CD163 were investigated, alongwith the immunosuppressive properties of CD163 onglobal T-cell proliferation.
Materials and MethodsPatients
Forty-seven newly diagnosed patients withHodgkin lym-phoma were prospectively enrolled. One patient with atop-ic dermatitis was excluded from analysis and will be dis-cussed separately (excluded fromTable 1).Of the remaining46 patients, 42 had cHL and 4wereNLPHL patients. Patientcharacteristics are provided in Table 1. Patients withNLPHLand cHL were analyzed separately. Exclusion criteria werelimited to HIV positivity, active Hepatitis B, or C infection.All patientswere enrolled before commencement of therapyand serial blood samples were taken at 5 fixed time-points:pretherapy, immediately presecond, and prethird therapy,one month and 6 months after therapy. Peripheral bloodmononuclear cells (PBMC), plasma, and sera were cryo-preserved, thawed, and tested in batches as previously out-lined (20). Tissue fromdiagnostic tumorbiopsieswas testedwhen available. Clinical parameters including the Hasenc-lever prognostic score were prospectively recorded (21, 22).Early-stage disease was defined according to the SouthwestOncology Group (SWOG) and Cancer and LeukemiaGroup B (CALGB) previously published definition (AnnArbor stage I or II without any B symptoms, infradiaphrag-matic presentations, or mediastinal masses more than onethird the maximum thoracic diameter; ref. 23).
This was a multi-center, Australia-wide, observational(non-interventional) study conducted under the auspicesof the Australasian Leukaemia & Lymphoma Group(ALLG). Therapy was applied as per clinician’s preference(Table 1). The majority of our patient cohort (85%)was treated with "ABVD" (adriamycin, bleomycin, vinblas-tine, and dacarbazine) combination chemotherapy (24).Other regimens used were "BEACOPP" (bleomycin, etopo-side, adriamycin, cyclophosphamide, procarbazine andprednisolone; ref. 25), ABVD followed by BEACOPP and
Translational RelevanceThe challenge in treating classicalHodgkin lymphoma
(cHL) remains to tailor therapies to eradicate malignan-cy with minimal side-effects, and to simultaneouslyidentify those patients in whom alternate strategiesshould be instituted early. There are currently no circu-lating disease response biomarkers for Hodgkin lym-phoma. Blood biomarkers may assist interpretation ofpositron emission tomography/computed tomography,and can also be conducted at each consultation to assessdisease response and detection of early relapse. Weperform the first comparison of HRS-specific (TARC)and tumor-infiltrate–specific (CD163) serummarkers incHL and show that both serumCD163 and serum TARCby ELISA are cHL disease response biomarkers in early-and advanced-stage disease. Furthermore, functionalanalysis suggests that CD163þ monocyte-mediatedimmunosuppression of T-cells occurs in cHL, providingpotential targets for novel therapeutics.
Jones et al.
Clin Cancer Res; 19(3) February 1, 2013 Clinical Cancer Research732
on June 23, 2018. © 2013 American Association for Cancer Research. clincancerres.aacrjournals.org Downloaded from
Published OnlineFirst December 5, 2012; DOI: 10.1158/1078-0432.CCR-12-2693

‘ChlVPP’ (chlorambucil, procarbazine, prednisolone, andvinblastine; 26).Initial staging and restaging one month after completion
of therapy was by PET and CT scans. Interim diseaseresponse (generally after the third cycle of therapy), andrestaging at the 3 to 6 months after completion of therapywas assessedbyCT, typically in combinationwithPET (70%had interim treatment restaging PET). Complete response(CR) and partial response (PR) were defined as per theInternational Harmonization response criteria (27) or,when applicable (i.e., patients that had interim treatmentCT scans only), the International Working Group responsecriteria was used (28). Refractory disease was defined as
patients with persistent Hodgkin lymphoma at one monthposttherapy, which was either residual disease (if there wasstable or reduced tumor burden as compared with prether-apy), or progressive disease (if there was an increase intumor burden). Relapsewas defined asHodgkin lymphomareappearing in a patient who had previously been in CR atthe interim therapy or one month posttherapy time-point.Relapsed/refractory disease was based on clinical and radio-logical assessment and in some cases by repeat biopsy.
Twenty-one healthy age- and gender-matched participantblood samples were used. This study conformed to theDeclaration of Helsinki and written informed consent wasprovided by all participants and was approved by all par-ticipating hospitals/research institute Human ResearchEthics Committees.
Serum ELISA analysisCD163 and TARC were quantified in 221 serum samples
usingQuantikineHumanCD163ELISAkits (R&DSystems)and RayBio Human TARC ELISA kits (RayBiotech) as permanufacturer’s instructions. A 1:20 dilution was used forsCD163.
Tissue mRNA quantificationRNA was extracted from all available formalin-fixed,
paraffin-embedded (FFPE) tumor biopsies (36 Hodgkinlymphoma in total: 32 cHL and 4 NLPHL; 29 of the 32cHL had paired slides for immunohistochemical stainingavailable) using RecoverAll kit (Ambion) as per manufac-turer’s instructions. RNA was stored at �80�C. SuperscriptIII reverse transcriptase (Invitrogen) was used to producecDNA primed by random hexamer as per manufacturesinstructions. TARC, CD163, CD68 and b-2-microglobulin(b2M) mRNA levels were quantified using real-time PCR(TARC forward primer: 50-CTTCTCTGCAGCACATCCAC-30, TARC reverse primer: 50-AGTACTCCAGGCAG-CAC-TCC-30, CD68 forward primer: 50- CCACACAGGGGT-CTTTGG -30, CD68 reverse primer: 50- TGATGAGAGGCAG-CAAGATG -30, CD163 forward primer: 50- CAATGGGG-TGGACTTACCTG-30, CD163 reverse primer: 50- AAC-CAGTCTGGGTTCCCTGT -30, b2M forward primer: 50-ACTCTCTCTTTCTGGCCTGGAG-30, b2M reverse primer:50-CATTCTCTGCTGGATGACGTGAG-30). All primers weresynthesized by Sigma-Aldrich and used at 0.2 mmol/L.Rotorgene 3000 real-time PCRmachine (Corbett Research)was used to run 20 mL reactions with A&B SYBR Green(Applied Biosystems). Results were normalized to b2M andcomparative quantification was used for analysis. Healthyparticipant PBMC cDNA was used as the standard controlfor CD68 and CD163 and the Hodgkin lymphoma cell lineHDML2 cDNA was used for TARC.
Circulating plasma EBV-DNA quantificationEBV-tissue positivity was determined by EBV encoded
RNA in situ hybridization (EBER-ISH) in conjunction withhematoxylin and eosin staining (29). EBV-DNA was quan-tified in plasma of EBV-related patients with cHL by real-time PCR using primers for the single copy EBV gene BALF5
Table 1. Patient characteristics
Patient characteristicsNo. of Patients(N ¼ 46a) % Total
Age median (range) 35.6 (18–79)Male 25 54%Ann Arbor Stage III–IV 22 48%Serum Albumin, lessthan 40 g/L
32 70%
Haemoglobin, lessthan 105 g/L
9 20%
Lymphocyte Count,at least 0.6 � 109/L
42 91%
White blood cell count,at least 15 � 109/L
7 15%
Hasenclever score,at least 3
16 35%
B symptoms 17 37%EBER-ISH Positive 12 26%EBER-ISH Unavailable 3 7%bEarly stage 10 22%Advanced stage 36 78%Histologic subtypeNodular sclerosing 26 57%Mixed-cellularity 4 9%Lymphocyte-rich 4 9%Lymphocyte depleted 1 2%cHL, unspecified 7 15%NLPHL 4 9%
Treatment cHL Patients(N ¼ 42a)
ABVD 36 85%BEACOPP 2 5%ABVD þ BEACOPP 2 5%ChlVPP 2 5%
aExcluded patient with atopic dermatitis.bEarly stage is defined Ann Arbor stage I or II without any Bsymptoms, infradiaphragmatic presentations or mediastinalmasses greater than one third the maximum thoracic diam-eter. Patients not fulfilling this criteria were defined asadvance stage.
sCD163 and sTARC as Disease Response Biomarkers in cHL
www.aacrjournals.org Clin Cancer Res; 19(3) February 1, 2013 733
on June 23, 2018. © 2013 American Association for Cancer Research. clincancerres.aacrjournals.org Downloaded from
Published OnlineFirst December 5, 2012; DOI: 10.1158/1078-0432.CCR-12-2693

as previously described (20). A threshold of 200 EBVgenomes/mL was used.
ImmunohistochemistryCD163 (mouse anti-human CD163 clone: 10D6, 10mg/
ml, Biocare Medical) staining was conducted on 36 Hodg-kin lymphoma tumor biopsy FFPE Superfrost Plus Adhesiveslides (32 cHL, 4NLPHL; 29/32 cHLhad paired FFPE tumorslices for RNA extraction available). CD163 positivity wasscored by2 independent hematopathologists (C. Keane andL.A. Seymour) using a standardized protocol and the meanvalue recorded. Samples were delineated as high or lowbased on a previously published cutoff of 25% (16–18). Inaddition, dual staining of CD163 and CD68 (mouse anti-humanCD68 clone: PG-M, 40 mg/mL, DAKO)was done on12 samples to confirm CD163 specificity. The number ofHRS cells per 5 fields at �40 magnification (hematoxylinand eosin staining) was quantified in the 32 available cHLslides, and tested for correlation with sTARC.
CD163 flow cytometryCD163þCD14þ monocytes and monocytic myeloid-
derived suppressor cells (mo-MDSC, defined as CD14þ
HLA-DRlow/�) were quantified in PBMC from 10 healthyparticipant and 10 cHL patient at 2 time-points: pretherapyand 6 months posttherapy. Briefly, PBMCs were surfacestained for CD14-PE (Miltenyi), CD163-Alexa-647 (Biole-gend), HLA-DR-PerCP (BD Biosciences), and intracellularstained for CD68-FTIC (Invitrogen). Samples were run onFACSCanto II (BD Biosciences) and analyzed using FlowJoversion 9.2 (Treestar).
Effect of monocyte depletion on global T-cellproliferation
Eight pre-therapy cHL patient (3 nodular sclerosing, 1mixed cellularity, 1 lymphocyte rich, and3 cHLunspecified)and 6 healthy participant samples were randomly selectedfromour cohorts.PBMCwerecarboxyfluorescein succinimi-dyl ester (CFSE) stained (1.5 mmol/L), washed, and thendivided into 2. One half was depleted of CD14þ cells usingEasysep Human CD14 positive selection kit (Stem CellTechnologies), as permanufacturer’s instructions. A total of2.5 � 105 cells from both the depleted and nondepletedpopulationsweresurfacestainedforCD14-PerCPCy5.5(BDPharmingen) and CD163-Alexa-647 (Biolegend) and theproportions of CD163þCD14þ cells determined by flowcytometry.
To account for a higher proportion of T-cells in thedepleted population, depleted and nondepleted cells werecultured at a concentration of 2.0� 106 cells/mL and 2.5�106 cells/Ml, respectively. Both populations were stimulat-ed with Dynabeads Human T-activator CD3/CD28/CD137(1:10, Invitrogen) and expanded for 7 days in RPMI 1640with penicillin/streptomycin, 10% FBS and 20 U/mL inter-leukin (IL)-2. On day 7, cells were surface stained for CD3-APC-Cy7, CD4-APC, and CD8-PerCP (BD Pharmingen).Samples were run on FACSCanto II (BD Biosciences) andanalyzed using FlowJo version 9.2 (Treestar).
Statistical analysisPaired t tests were used to compare matched serum
samples. Wilcoxon-matched pairs tests were used to com-pare matched monocyte-depleted and nondepleted T-cellexpansion samples. Otherwise, the unpaired t test was usedand Welch correction was included when variances weresignificantly different. Correlations were determined usingthe Pearson test with the exception of plasma EBV-DNA(whichhadnon-Gaussiandistribution), inwhich the Spear-man test was used. Receiver operating curve (ROC) analysiswas used to determine the sensitivity and specificity ofsCD163 and sTARC. Statistical analysis was conductedusing GraphPad Prism 5.0 (GraphPad Software Inc).
ResultsPatient characteristics
Forty-seven patients with Hodgkin lymphoma wereaccrued (mean age: 36 years, range: 18–79; female:maleratio, 21:26; 42 cHL, 4 NLPHL, one cHL with atopic der-matitis). Posttherapy samples were available for 37 of 42patients with cHL. Of these 37 patients with cHL, 32remained in CR by the 6-month posttherapy time-point,whereas 5 had relapsed/refractory disease. Two of 5 hadbiopsy proven relapsed/refractory disease, whereas 3 wereconfirmed by clinical and radiological assessment. In addi-tion, 21healthy participant blood sampleswere used (meanage: 36 years; range: 22–68; female:male ratio, 9:12).
Specificity and sensitivity of sCD163 and sTARC asbiomarkers in cHL
First, we conducted ROC analysis to determine the sen-sitivity and specificity of sCD163 and sTARC at definedtime-points. We found that both sCD163 and sTARC arehighly sensitive and specific markers for delineating pre-therapy cHL from healthy participants [sCD163: AUC,0.8776; P < 0.0001; 95% confidence interval (95% CI),0.7877–0.9674; sTARC: AUC, 0.9138, P < 0.0001; 95% CI,0.8440–0.9837; Supplementary Fig. S1A and S1C). Prether-apy sCD163 and sTARC cHL samples were also highlysensitive and specific when compared with CR samples at6 months posttherapy (sCD163: AUC, 0.7333; P ¼ 0.001;95% CI, 0.6072–0.8594; TARC: AUC, 0.8793, P < 0.0001;95%CI, 0.7492–0.9613; Supplementary Fig. S1B and S1D).Cutoff levels were defined by 2 criteria; a value greater thanthe healthy participant mean plus one SD and a value withmore than 80% sensitivity and specificity from the ROCanalysis of pretherapy versus healthy participant values. Acutoff level of 500 ng/mL for sCD163 resulted in 86%sensitivity and 81% specificity at pretherapy and 62%sensitivity and 75% specificity at 6 months posttherapy.For sTARC, the cutoff value was defined as 300 pg/mL with90% sensitivity and 86% specificity at pretherapy and 70%sensitivity and 84% specificity at 6 months posttherapy.
sCD163 and sTARC as disease response biomarkers incHL
Second, we conducted a match-paired analysis ofsCD163 and sTARC at all time-points in all patients with
Jones et al.
Clin Cancer Res; 19(3) February 1, 2013 Clinical Cancer Research734
on June 23, 2018. © 2013 American Association for Cancer Research. clincancerres.aacrjournals.org Downloaded from
Published OnlineFirst December 5, 2012; DOI: 10.1158/1078-0432.CCR-12-2693

cHL attaining CR and remaining in CR at the 6-monthposttherapy time-point. Results were compared withhealthy control participants. Both sCD163 and sTARCwereelevated in pretherapy cHL patients compared with healthyparticipants (sCD163P<0.0001 and sTARCP<0.0001, Fig.1A and B). In addition, both sCD163 and sTARC weresignificantly elevated in pre-therapy cHL patients comparedwithpaired samples takenonemonthposttherapy (sCD163P ¼ 0.0008, sTARC P < 0.0001) and 6-month posttherapy(sCD163 P ¼ 0.0005, sTARC P < 0.0001). Levels of sTARCwas equivalent to healthy participants by presecond ther-apy, whereas levels of sCD163 approached but did notreach equivalence by 6 months posttherapy. These resultsshow that sCD163 and sTARC are disease response biomar-kers in patients with cHL attaining and remaining in CR.Next, we analyzed patients with relapsed/refractory dis-
ease. One patient had biopsy proven refractory disease atone month posttherapy (Fig. 2A), another patient who hadresolution of disease at the interim time-point relapsed
(confirmed by biopsy) at one month posttherapy, (Fig.2B) and 3 patients had clinical- and radiological-confirmedrelapse after one month post-therapy (Fig. 2C–E). The timecourse of sCD163 and sTARC are shown in Fig. 2, inassociation with the tumor burden. In 3 patients, sTARCwas well above threshold at time of refractory/relapseddisease (Fig. 2A, C, and E). In one of these cases (Fig.2C), both sCD163 and sTARC were elevated, whereas in2 of these cases (Fig. 2A and E) sCD163 was not (in the caseshown in Fig. 2A, sCD163 was not elevated pretherapy). Inthe remaining other 2 cases (Fig. 2B and D), both serumbiomarkers were elevated at pretherapy, but neither wereelevated at time of diagnosis of low volume relapsed/refrac-tory disease.
We then analyzed whether sCD163 and/or sTARC wereuseful in the setting of equivocal PET scans (i.e., low-grade avidity of uncertain clinical significance). Out ofour cHL cohort, 4 patients had persistent clinical CRdespite an equivocal restaging PET result. We will discuss
Figure 1. sCD163 and sTARC asbiomarkers in cHL. A–C, comparisonof sCD163, sTARC, andplasmaEBV-DNA levels in cHL patients with CRby one month posttherapy and whoremained in CR at 6 monthsposttherapy. sCD163 levels (A),sTARC levels (B), plasma EBV-DNAlevels (C). Comparison of interim-therapy treatment response. cHLpatients, restricted to those withpaired interim samples that matchedinterim radiological assessment.D, sCD163 levels show a significantdifference between pairedpretherapy and CR interim-therapy(P ¼ 0.0152), whereas no significantdifference was seen between pairedpretherapy and PR interim-therapy(P ¼ NS). E, sTARC levels show asignificant difference between pairedpretherapy versus CR interim-therapy (P ¼ 0.0001) and pairedpretherapy versus PR interim-therapy (P ¼ 0.0001). Error barsrepresent mean with SEM.���,P < 0.001; ��,P < 0.01; �,P < 0.05;NS, P > 0.05.
2,000
A B
C D
E
6,000
4,000
2,000
0
6,000
4,000
2,000
0
250
500
1,500
Pre-
therapy
Pre
2ndPre
3rd1 M
Post
6 M
Post
Healthy
Pre-
therapy
Pre-
therapy
Interim
CR
Interim
PR
Pre-
therapy
Interim
CR
Interim
PR
Pre
2ndPre
3rd1 M
Post
6 M
Post
Healthy
Pre-
therapy
Pre
2ndPre
3rd1 M
Post
6 M
Post
Healthy
1,000
500
0
CD
163 (
ng/µ
L o
f seru
m)
EB
V G
enom
es/m
L o
f pla
sm
a
2,000
150,000
5,000
4,000
3,000
2,000
1,000
200
0
1,500
1,000
500
0
CD
163 (
ng/µ
L o
f seru
m)
TA
RC
(pg/µ
L o
f S
eru
m)
TA
RC
(pg/µ
L o
f seru
m)
sCD163 and sTARC as Disease Response Biomarkers in cHL
www.aacrjournals.org Clin Cancer Res; 19(3) February 1, 2013 735
on June 23, 2018. © 2013 American Association for Cancer Research. clincancerres.aacrjournals.org Downloaded from
Published OnlineFirst December 5, 2012; DOI: 10.1158/1078-0432.CCR-12-2693
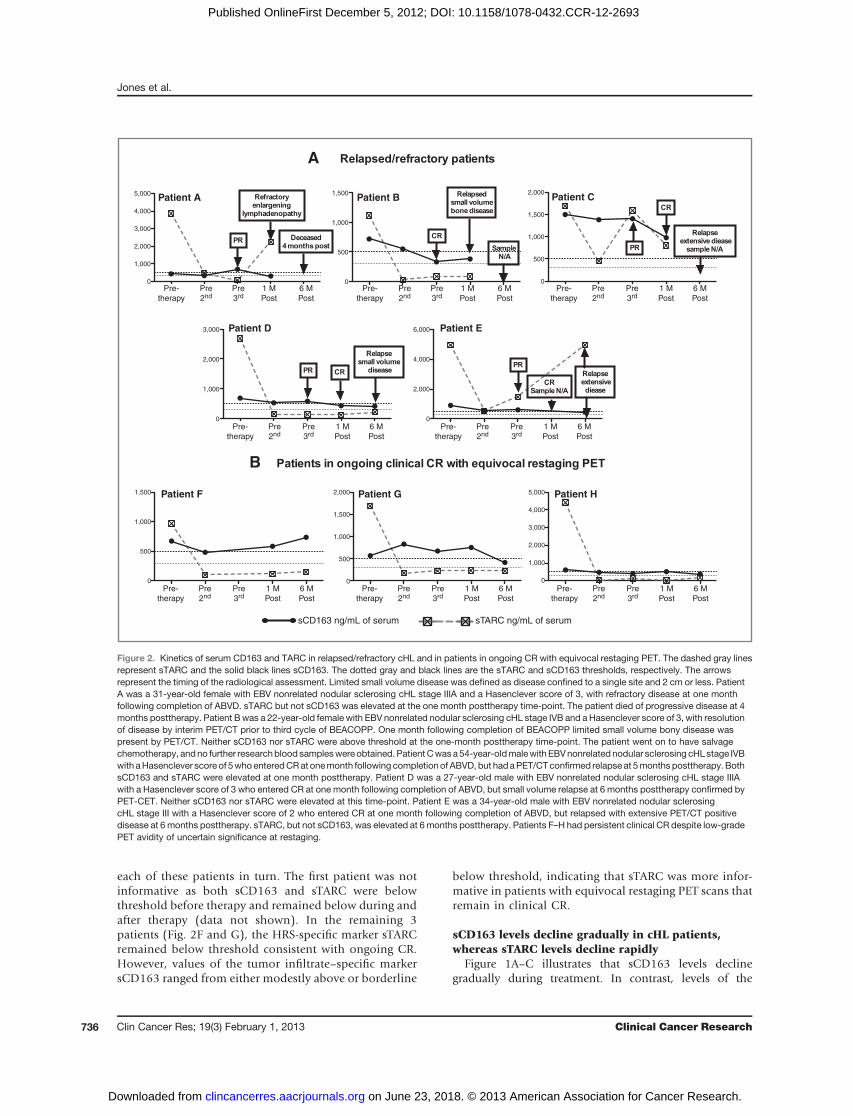
each of these patients in turn. The first patient was notinformative as both sCD163 and sTARC were belowthreshold before therapy and remained below during andafter therapy (data not shown). In the remaining 3patients (Fig. 2F and G), the HRS-specific marker sTARCremained below threshold consistent with ongoing CR.However, values of the tumor infiltrate–specific markersCD163 ranged from either modestly above or borderline
below threshold, indicating that sTARC was more infor-mative in patients with equivocal restaging PET scans thatremain in clinical CR.
sCD163 levels decline gradually in cHL patients,whereas sTARC levels decline rapidly
Figure 1A–C illustrates that sCD163 levels declinegradually during treatment. In contrast, levels of the
Pre-
therapy
Pre
2ndPre
3rd1 M
Post
6 M
Post
Pre-
therapy
Pre
2ndPre
3rd1 M
Post
6 M
Post
Pre-
therapy
Pre
2ndPre
3rd1 M
Post
6 M
Post
Pre-
therapy
Pre
2ndPre
3rd1 M
Post
6 M
Post
Pre-
therapy
Pre
2ndPre
3rd1 M
Post
6 M
Post
Pre-
therapy
Pre
2ndPre
3rd1 M
Post
6 M
Post
Pre-
therapy
sCD163 ng/mL of serum sTARC ng/mL of serum
Pre
2ndPre
3rd1 M
Post
6 M
Post
Pre-
therapy
Pre
2ndPre
3rd1 M
Post
6 M
Post
5,000
4,000
3,000
2,000
1,000
0
5,000
4,000
3,000
2,000
1,000
0
2,000
1,500
1,000
500
0
2,000
1,500
1,000
500
0
1,500
1,000
500
0
6,000
4,000
2,000
0
3,000
2,000
1,000
0
1,500
1,000
500
0
A
Patient A Patient B Patient C
Patient D Patient E
Patient F Patient G Patient H
B
Figure 2. Kinetics of serum CD163 and TARC in relapsed/refractory cHL and in patients in ongoing CR with equivocal restaging PET. The dashed gray linesrepresent sTARC and the solid black lines sCD163. The dotted gray and black lines are the sTARC and sCD163 thresholds, respectively. The arrowsrepresent the timing of the radiological assessment. Limited small volume disease was defined as disease confined to a single site and 2 cm or less. PatientA was a 31-year-old female with EBV nonrelated nodular sclerosing cHL stage IIIA and a Hasenclever score of 3, with refractory disease at one monthfollowing completion of ABVD. sTARC but not sCD163 was elevated at the one month posttherapy time-point. The patient died of progressive disease at 4months posttherapy. Patient Bwas a 22-year-old female with EBV nonrelated nodular sclerosing cHL stage IVB and a Hasenclever score of 3, with resolutionof disease by interim PET/CT prior to third cycle of BEACOPP. One month following completion of BEACOPP limited small volume bony disease waspresent by PET/CT. Neither sCD163 nor sTARC were above threshold at the one-month posttherapy time-point. The patient went on to have salvagechemotherapy, andno further researchblood sampleswereobtained.PatientCwasa54-year-oldmalewith EBVnonrelated nodular sclerosing cHLstage IVBwith aHasenclever score of 5whoenteredCRat onemonth following completionof ABVD, but hadaPET/CTconfirmed relapseat 5months posttherapy. BothsCD163 and sTARC were elevated at one month posttherapy. Patient D was a 27-year-old male with EBV nonrelated nodular sclerosing cHL stage IIIAwith a Hasenclever score of 3 who entered CR at one month following completion of ABVD, but small volume relapse at 6 months posttherapy confirmed byPET-CET. Neither sCD163 nor sTARC were elevated at this time-point. Patient E was a 34-year-old male with EBV nonrelated nodular sclerosingcHL stage III with a Hasenclever score of 2 who entered CR at one month following completion of ABVD, but relapsed with extensive PET/CT positivedisease at 6 months posttherapy. sTARC, but not sCD163, was elevated at 6months posttherapy. Patients F–H had persistent clinical CR despite low-gradePET avidity of uncertain significance at restaging.
Jones et al.
Clin Cancer Res; 19(3) February 1, 2013 Clinical Cancer Research736
on June 23, 2018. © 2013 American Association for Cancer Research. clincancerres.aacrjournals.org Downloaded from
Published OnlineFirst December 5, 2012; DOI: 10.1158/1078-0432.CCR-12-2693

tumor-specific biomarker sTARC dropped rapidly, withlevels presecond therapy comparable with healthy partici-pants. Interestingly, a similar pattern to sTARC wasobserved for plasma EBV-DNA in patients with EBV-relatedcHL (Fig. 1C). Circulating cell-free EBV-DNA is an estab-lished tumor-specific biomarker in EBV-related cHL(20, 29–31).Our next aim was to determine the association between
each serum biomarker and the interim radiological assess-ment. The serum sample taken closest to the interim radio-logical assessment (typically prethird therapy) was com-pared with its paired pretherapy sample. Interestingly, forsCD163 levels, there was no significant difference betweenpretherapy samples and those in PR at the interim time-point. However, there was a significant difference forsCD163 between pretherapy and those in CR at the interimtime-point (P ¼ 0.0152; Fig. 1D). At pretherapy, 21% ofpatients were below the sCD163 threshold, rising to 33%and 48% in those attaining PR and CR respectively by theinterim time-point.In contrast, therewas a significant difference betweenpre-
therapy sTARC levels and both PR and CR samples atthe interim time-point (P ¼ 0.0001 for both; Fig. 1E).For sTARC at pre-therapy, 14% of patients were belowthreshold, and the proportions below threshold in thoseattaining PR and CR were similar to each other at 75% and86% respectively by the interim time-point. This is consis-tent with a more rapid decline in the tumor-specific circu-lating biomarker as compared with the tumor-infiltratebiomarker.We then determinedwhether the kinetics of the biomark-
er (stratified by CR/PR) at the interim time-point wasassociated with outcome once chemotherapy was complet-ed. All patients in CR at the interim time-point maintainedongoingCR at one and6months posttherapy. Interestingly,of those PR patients below the sCD163 threshold at theinterim time-point, all achieved and maintained ongoingCR, whereas 4 of the 8 patients above the sCD163 thresholdwent on to have refractory/relapsed disease. However, forsTARC, the results were less clear-cut. There were 4 patientsabove the sTARC threshold at the interim therapy time-point. Two remained in ongoing CR, whereas one hadrefractory disease and one relapsed by 6 months postther-apy. Similarly, 2 (of 9) patients below the sTARC thresholdhad relapsed disease by 6 months posttherapy.
sCD163 levels correlate with tissue CD163 proteinlevelsBiopsy tissue was available in 32 cHL patients from our
cohort. Tissue CD163 protein levels (quantified by immu-nohistochemistry) were modestly correlated to matchingpretherapy sCD163 levels (r ¼ 0.4005, 95% CI, 0.05373–0.6611, P ¼ 0.0256). The number of HRS cells did notcorrelate with pretherapy sTARC levels (P ¼ NS). TissueCD163 protein levels were associated with the Hasencleverprognostic score (P¼ 0.0332, score <3: 31.3%� 3.9%,�3:51.4% � 6.5%) and with advanced stage disease (P ¼0.0025, early: mean 21.2% � SEM 2.5, advanced: mean
37.8%� SEM 4.3; refs. 21–23). No other associations werefound between tissue CD163 protein levels and any otherclinical characteristics. In addition to measuring CD163protein levels, real-time reverse transcription PCR wasused to measure tissue CD163, CD68, and TARC mRNAlevels. Tissue CD163 mRNA levels weakly correlated withtissue protein levels (r¼ 0.3898, 95% CI, 0.02703–0.6618,P ¼ 0.0366); however, neither CD163 nor TARC tissuemRNA levels correlated with paired pretherapy serum pro-tein levels and TARC tissue mRNA levels did not correlatewith number of HRS cells. No associations were foundbetween any of the clinical parameters and mRNA levelsof CD163, CD68, and TARC. CD163 and CD68 mRNAlevelsmoderately correlated (r¼ 0.3851, 95%CI, 0.04202–0.6470, P ¼ 0.0295). Twelve cHL tissue samples were dualstained for CD163 and CD68. In these, CD163 cells wereuniversally positive for CD68, whereas the proportion ofCD68 cells that were CD163 positive was variable.
cHL patients have a higher proportion of totalcirculating CD163þCD14þ monocytes, suggesting thatnot all of the elevated circulating CD163 is tumorderived
Pretherapy cHLpatients (n¼10) had ahigher proportionof circulating CD14þ monocytes within the mononucleargate compared with 10 healthy control participants (P ¼0.0006; Fig. 3A). The proportion of circulating CD163þ
CD14þ cells were also higher in patients with cHL com-pared with healthy control participants (P ¼ 0.0437, Fig.3B). All these patients remained in CR at 6 months post-therapy. They continued to have an elevated proportion oftotal monocytes and CD163þ monocytes (P ¼ 0.0010, Fig.3A and P¼ 0.0332, Fig. 3B, respectively). Levels of sCD163did not correlatewith the proportion of circulatingCD163þ
CD14þ cells in cHL. mo-MDSCs were not elevated in cHLcompared with healthy control participants.
sCD163 levels are associated with B symptoms, AnnArbor stage, lymphocyte count, and plasma EBV-DNAin cHL
Pretherapy sCD163 and sTARC levels were associatedwith patient characteristics as outlined in Table 2. HighersCD163 levels were significantly associated with B symp-toms (P ¼ 0.0351), Ann Arbor stage (P ¼ 0.0328), lowerlymphocyte counts (P¼ 0.0297), and (in EBV-related cHL)with higher plasma EBV-DNA (P ¼ 0.0197). sTARC levelswere inversely associated with age (P ¼ 0.0250). We thenconducted a correlation analysis between plasma EBV-DNAand sCD163 and sTARC. sCD163 was strongly correlatedwith plasma EBV-DNA (r ¼ 0.791, P ¼ 0.001), whereassTARC was not.
Depletion of CD163þ monocytes enhancesproliferation of T cells in cHL
To further investigate the inverse association betweensCD163 and lymphocyte count, we assessed global CD4þ
and CD8þ T-cell proliferation in the presence or absence ofCD163þ monocytes. We randomly selected patients with
sCD163 and sTARC as Disease Response Biomarkers in cHL
www.aacrjournals.org Clin Cancer Res; 19(3) February 1, 2013 737
on June 23, 2018. © 2013 American Association for Cancer Research. clincancerres.aacrjournals.org Downloaded from
Published OnlineFirst December 5, 2012; DOI: 10.1158/1078-0432.CCR-12-2693

8 cHL and 6 healthy participants. As the majority ofCD14þ monocytes are CD163þ (pretherapy cHL patientmean ¼ 65%), we compared in vitro proliferation ofCD14þ-depleted PBMC with nondepleted PBMC in thepretherapy cHL and healthy participants. CFSE stainingwas used to quantify CD4þ and CD8þ T-cell proliferationfollowing stimulation by T-cell proliferation beads. Totalpercent proliferation and extent proliferation (top tenpercentile) were compared. In vitro depletion of mono-cytes from pretherapy cHL samples led to enhancementof CD4þ and CD8þ T-cell proliferation, indicating thatmonocyte-dependent T-cell immunosuppression occursin patients with cHL (total proliferation CD4þ P ¼0.0078, CD8þ P ¼ 0.0078, extent of proliferationCD4þ P ¼ 0.0078, CD8þ P ¼ 0.0078, Fig. 4). Monocytedepletion from healthy participants also enhanced pro-liferation; however, this only reached significance forCD8þ T-cell total proliferation (P ¼ 0.0313).
CD163 but not TARC levels are elevated in the serum ofpatients with NLPHL
TARC is expressed by the HRS cells of cHL, as well asthe thymus, subsets of dendritic cells, endothelial cells, andactivated PBMC (6, 32). HRS cells are not present inNLPHLand it is known that TARC is not expressed by primaryNLPHL tissues (6, 10). Consistent with this, sTARC was notelevated in all 4 pretherapy NLPHL patients compared withhealthy participants and were significantly lower than pre-therapy cHL samples (P < 0.0001). This indicates thatsTARC is specific for HRS cells and is not a useful circulatingbiomarker for NLPHL.
Using the previously published cutoff, CD163 proteinwas present at low levels in 3 of the 4 NLPHL tissues (mean17%, range 12–31%; refs. 16–18). Interestingly, sCD163levels were elevated in all 4 pretherapy NLPHL patientscompared with healthy participants (P¼ 0.001) at a similarlevel comparedwith pretherapy cHL samples. Further inves-tigation into the use of sCD163 as a disease responsebiomarker for NLPHL is warranted.
sTARC is not a disease response biomarker in cHLpatients with concomitant severe allergic disease
One patient with stage IVB EBV-related nodular scle-rosing cHL in the setting of long standing methotrexatetherapy for severe atopic dermatitis was censored from allanalysis. The dermatitis remained poorly controlled forthe duration of the study. This patient was treated withABVD, which resulted in radiological PR at the interimtime-point and CR at the end of therapy. This patient’ssCD163 was elevated (646 ng/mL) at pretherapy andborderline at the interim time-point (493 ng/mL). EBV-DNA was present pretherapy, but could not be detected atany subsequent time-point. At one month posttherapy,sCD163 fell below the cutoff to 340 ng/mL. Interestingly,sTARC was grossly elevated at all time-points with themean more than 10 times our threshold value (mean3163 pg/mL, range 2383–3920 pg/mL). Serum TARClevel is known to be elevated in a range of allergic diseasesuch as atopic dermatitis (32, 33).
DiscussionWe present the first study comparing tumor-infiltrate
versus tumor-specific circulating disease response biomar-kers in Hodgkin lymphoma patients. Both sCD163 andsTARC are sensitive and specific disease response biomar-kers in the majority of cHL. However, when results arestratified by interim radiological assessment, sCD163 seemsto more accurately reflect disease response than sTARCduring therapy in cHL. Reflecting the relative abundanceof tumor-infiltrating cells compared with HRS cells,sCD163 levels were 350-fold higher at pretherapy com-pared with sTARC, and then declined less rapidly (thansTARC and plasma EBV-DNA) once chemotherapy hadcommenced. However, in patients completing first-linetherapy who went on to have persistent clinical CR despitelow-grade PET avidity of uncertain significance at restaging,sCD163 was frequently (albeit only modestly) abovethreshold, whereas sTARC values remained below thresh-old. sTARC appeared more frequently elevated than
A B
Tota
l
Tota
l
Pretherapy
cHL
Posttherapy
cHL
Healthy Pretherapy
cHL
Posttherapy
cHL
Healthy
Figure 3. Comparison of total circulating CD163þCD14þmonocytes in patients with cHL versus healthy participants. Error bars represent mean with SEM. A,percentage of monocytes (defined as CD14þ) within the total population of viable mononuclear cells (pre-therapy cHL vs. healthy P ¼ 0.0006, posttherapycHL vs. healthy P ¼ 0.0010). B, percentage of CD163þ monocytes within the total population of viable mononuclear cells (pretherapy cHL vs. healthyP ¼ 0.0437, posttherapy cHL vs. healthy P ¼ 0.0332).
Jones et al.
Clin Cancer Res; 19(3) February 1, 2013 Clinical Cancer Research738
on June 23, 2018. © 2013 American Association for Cancer Research. clincancerres.aacrjournals.org Downloaded from
Published OnlineFirst December 5, 2012; DOI: 10.1158/1078-0432.CCR-12-2693

sCD163 in thosewith relapsed/refractory disease.However,in a patient with active atopic dermatitis sTARC was per-sistently elevated despite attaining CR. Thus the combina-tion of sCD163 and sTARC seem more informative thaneither biomarker alone. Finally, we found that patients withcHL had increased total circulating CD163þCD14þ mono-cytes, suggesting that the diseased node is not the onlysource of sCD163. Depletion of circulating CD163þCD14þ
monocytes in cHL enhanced both CD4þ and CD8þ T-cellproliferation.Tissue-associated macrophages (TAM) are potentially
one of the most powerful independent markers for clinical
prediction in cHL, (12–18) as well as potentially represent-ing a novel therapeutic target (34). The best markers ofTAMs are still a matter of debate (35). Results from studiesare conflicting, with some, but not all, finding that highprotein expression (by immunohistochemistry) of themonocyte/macrophage markers CD68 and CD163 corre-lated with adverse outcomes (12–15). Although our studywas not designed to test the prognostic ability of tissueCD163, we did find (in line with some but not all priorreports), that values were associated with both Hasencleverscore and the presence or absence of early-stage disease. Theinconsistency between reported studies may in part reflect
Table 2. cHL patient characteristics and pretherapy serum protein levels
Patient characteristicsTotal(N ¼ 42) % Total
Mean� SEMserum CD163(ng/mL) CD163 P
Mean � SEMserum TARC(pg/mL) TARC P
Age NS 0.0250Less than 45 years 30 71% 725.9 � 52.61 2442 � 295.4At least 45 years 12 29% 816.8 � 137.7 816.8 � 137.7
Gender NS NSFemale 20 48% 731.9 � 53.66 1912 � 376.6Male 22 52% 770.1 � 91.57 2240 � 354.1Ann Arbor Stage 0.0328 NSI–II 20 48% 632.6 � 61.04 1748 � 327.4III–IV 22 52% 860.3 � 80.92 2389 � 383.4
B symptoms 0.0351 NSNo 26 62% 647.8 � 43.18 1968 � 325.3Yes 16 38% 921.0 � 112.4 2272 � 424.4
Hasenclever score NS NSAt least 3 27 64% 670.8 � 45.55 1996 � 330.6Less than 3 15 36% 897.8 � 120.1 2242 � 411.8
Lymphocyte count 0.0297 NSAt least 1 � 109/L 15 36% 933.8 � 110.1 2621 � 467.6Less than 1 � 109/L 27 64% 650.8 � 48.73 1785 � 293.1
Stage NS NSEarly 9 21% 609.8 � 86.72 1763 � 554.9Advanced 33 79% 790.6 � 63.15 2171 � 291.3
Histology NS NSNodular sclerosing 26 62% 793.6 � 67.99 2140 � 326.9Other specified cHL 9 21% 651.0 � 95.64 1141 � 517.8cHL, unspecified 7 17%
EBER-ISH NS NSNegative 27 64% 808.1 � 66.62 2357 � 314.4Positive 12 29% 611.4 � 103.1 1286 � 464.1Unavailable 3 7%
Plasma EBV-DNAa 0.0197 NSAt least 200 genomes/mL 5 12% 344.7 � 74.42 583.3 � 326.6Less than 200 genomes/mL 7 17% 801.9 � 127.5 1788 � 724.8NA 29 69%
NOTE: Bold type indicates significant P values.Abbreviations: NS, not significant; SEM, standard error of the mean; Other specified cHL, mixed-cellularity, lymphocyte-rich, andlymphocyte-depleted cHL subtypes.aIn patients with EBV-related cHL.
sCD163 and sTARC as Disease Response Biomarkers in cHL
www.aacrjournals.org Clin Cancer Res; 19(3) February 1, 2013 739
on June 23, 2018. © 2013 American Association for Cancer Research. clincancerres.aacrjournals.org Downloaded from
Published OnlineFirst December 5, 2012; DOI: 10.1158/1078-0432.CCR-12-2693

the different populations tested and their retrospectivenature, and also the intrinsic variability that is inherent inquantifying protein by immunohistochemistry. In contrast,quantification of proteins by ELISA is readily standardizedbetween laboratories. We observed amodest but significantcorrelation between tissue and sCD163, and also (consis-tent with previous studies of tissue CD163) that sCD163correlated with B symptoms and Ann Arbor stage (13, 14).
Previous studies have implied that EBVþ HRS cells mod-ulate the tumor microenvironment (36–38). Intriguingly,we show a strong positive correlation with sCD163 andplasma EBV-DNA levels, suggesting a possible interactionwith EBV proteins in HRS cells and CD163þ monocyte/macrophages. Monocytes have been shown to enhanceproliferation and LMP1 expression of tumor cells in nasalnatural killer/T-cell lymphoma (NNKTL), which is also anEBV latency type II-associated malignancy (39). Consistentwith this, 4 studies (with sample sizes ranging from approx-imately 100–300 tissues) have found that tissue CD163protein does correlate with the presence of EBV-positiveHRS cells (13–16). Cell-free EBV-DNA was not tested inthese studies. Although we found no association betweentissue CD163 protein levels and EBV-related cHL, ourresults are likely underpowered to show this association.Further studies are required to investigate the mechanisticbasis for the association between CD163 and EBV in cHL.
Interestingly, sCD163 correlated with low lymphocytecount. At present, it is not fully understood how HRS cellsrecruit monocyte/macrophages, and once recruited to thetumor microenvironment, how these cells impact hostsystemic circulating immunity. HRS cells may result in
increased CD163þ monocytes/macrophages. These, inturn, may mediate impaired T-cell proliferation, resultingin the inverse association between sCD163 and circulatinglymphocyte count numbers that we observed. It has beenshown in diffuse large B-cell lymphoma and follicularlymphoma that mo-MDSC inhibit T-cell proliferation(40). Notably, we found that mo-MDSC were not elevatedin cHL, whereas circulating CD163þCD14þ monocyteswere high compared with healthy participants. In function-al assays, we show that monocyte depletion enhances T-cellproliferation in both cHL and healthy participants, albeit toa greater extent in cHL. Understanding why monocytes areelevated in cHL and the mechanism by which monocyteslimit T-cell proliferation may be critical to understandingthe pathogenesis of cHL and have therapeutic implications,particularly as inhibition of TAMs with blocking moleculeshas been shown to slow tumor growth inother cancers (34).
The elevated circulating CD163þCD14þ monocytes incHL suggest that the diseased node is not the only source ofsCD163.Consistentwith this, although sCD163was greatlyreduced at 6 months posttherapy in CR cHL patients,sCD163 remained modestly elevated compared to healthyparticipants. Circulating CD163þCD14þ monocytes alsoremained elevated at 6 months posttherapy in CR cHLcompared with healthy participants, possibly accountingfor the remaining sCD163 levels.
This is the first study of sCD163 as a marker of diseaseresponse and the first to compare tumor-specific and tumor-infiltrate markers in cHL. Both sCD163 and sTARC weremarkedly elevated in pretherapy cHL samples and signifi-cantly declined in complete responders. Our sTARC results
A C
B D
Figure 4. Monocyte depletionenhances T-cell proliferation inpatients with cHL. Histogramsshow (A) CD4þ and (B) CD8þ T-cellproliferation from eight patientswith cHL (labeled I–VIII). T-cellproliferation from CD14þ cell-depleted PBMC in gray and fromnondepleted PBMC in black. CD4þ
(C) andCD8þ (D) T-cell proliferationfrom cHL patient and healthyparticipant CD14þ cell-depletedPBMC and nondepleted PBMCrepresented as total percentproliferation above background.Error bars represent mean withSEM. ��, P < 0.01; NS, P > 0.05.
Jones et al.
Clin Cancer Res; 19(3) February 1, 2013 Clinical Cancer Research740
on June 23, 2018. © 2013 American Association for Cancer Research. clincancerres.aacrjournals.org Downloaded from
Published OnlineFirst December 5, 2012; DOI: 10.1158/1078-0432.CCR-12-2693

are comparable with the recent study by Plattel and collea-gues (11). In both cases, sTARCwas elevated pretherapy anddropped rapidly to normal levels following the first cycle oftherapy in the majority of responding patients. A similartrend was also observed in a phase II study of patientsreceiving panobinostat (41). In both the Platell and collea-gues’ study and our study (11), there was little differencebetweenCR andPR sTARC levels at themid-treatment time-point. In our study, the gradual decline of sCD163 through-out treatment and elevated levels of sCD163 inPRversusCRat the mid-treatment time-point suggests that the tumor-infiltrate marker may have higher specificity during treat-ment. However, although our numbers of relapsed/refrac-tory patients were limited, sCD163was elevated in only oneof the 5 patients at time of relapse/refractory disease. Incontrast, sTARC was elevated in 3 of 5, suggesting sTARCmay be a more sensitive marker of relapse. Notably, the 2relapsed patients with nonelevated levels of sTARC had lowtumor volume, one with ongoing disease confined to thebone. The work of Platell and colleagues found that sTARCwas elevated in all 12 of their relapsed cHL patients, how-ever, sCD163was notmeasured (11). The different levels ofsTARC and sCD163 may reflect a change in the relativeproportions of tumor and tumor-infiltrating cells in thediseased nodes of refractory/relapsed patients. Biopsieswere not taken at refractory/relapse presentation, otherwisea comparison of tumor composition between biopsiestaken at initial presentation and at relapse may have beeninformative.We show for the first time that sCD163 is elevated in
patients with cHL. Circulating CD163 seems to arise fromboth tumor tissue and CD163þ monocytes. sCD163 cor-related with cell-free EBV-DNA, and was associated with Bsymptoms, stage, and low lymphocyte count. Depletion ofCD163þ monocytes enhanced T-cell proliferation, impli-catingmonocytes and/or TAMs as potential novel targets forimmunotherapeutic manipulation. Finally, our results sug-gest that the combination of tumor-infiltrate (CD163) andtumor-specific (TARC) serumproteins aremore informativethan either marker alone as disease response biomarkers in
early- and advanced-stage disease during first-line therapyfor cHL. It is likely that circulating disease response bio-markers will vary according to the regimen and dose sched-ule. Future studies are needed to evaluate the differences inkinetics of serum disease response biomarkers in patientstreated with commonly used first-line regiments such asABVD, escalated BEACOPP and BEACOPP-14.
Disclosure of Potential Conflicts of InterestD. Gottlieb has a commercial research grant from Celgene and honoraria
from speakers’ bureau from Gilead. No potential conflicts of interest weredisclosed by the other authors.
Authors' ContributionsConception and design: K.L. Jones, M.K. GandhiDevelopment of methodology: K.L. Jones, F. Vari, J.P. Nourse, M.K.GandhiAcquisitionofdata (provided animals, acquired andmanagedpatients,provided facilities, etc.): K.L. Jones, C. Keane, P. Crooks, L.A. Seymour, D.Gottlieb, D.S. Ritchie, D. Gill, M.K. GandhiAnalysis and interpretation of data (e.g., statistical analysis, biosta-tistics, computational analysis): K.L. Jones, F. Vari, C. Keane, J.P. Nourse,L.A. Seymour, D.S. Ritchie, M.K. GandhiWriting, review, and/or revision of themanuscript: K.L. Jones, F. Vari, C.Keane, D. Gottlieb, D.S. Ritchie, D. Gill, M.K. GandhiAdministrative, technical, or material support (i.e., reporting or orga-nizing data, constructing databases): K.L. Jones, P. Crooks, D.S. Ritchie,M.K. GandhiStudy supervision: M.K. Gandhi
AcknowledgmentsThis was an Australasian Leukaemia & Lymphoma Group sponsored
study. The authors thank Susan Arnold for her assistancewith data collectionand Clay Winterford for immunohistochemistry staining.
Grant SupportWork in theClinical Immunohaematology laboratory is sponsored by the
National Health and Medical Research Council (Australia), LeukaemiaFoundation (Australia), Cancer Council of Queensland, and QueenslandOffice of Health and Medical Research. K.L. Jones is supported by theLeukaemia Foundation (Australia), the Australian Centre for Vaccine Devel-opment, and QIMR.
The costs of publication of this article were defrayed in part by thepayment of page charges. This article must therefore be hereby markedadvertisement in accordance with 18 U.S.C. Section 1734 solely to indicatethis fact.
Received August 15, 2012; revised November 21, 2012; acceptedNovember 28, 2012; published OnlineFirst December 5, 2012.
References1. EvensAM,HutchingsM,Diehl V. Treatment of Hodgkin lymphoma: the
past, present, and future. Nat Clin Pract Oncol 2008;5:543–56.2. Hutchings M, Mikhaeel NG, Fields PA, Nunan T, Timothy AR. Prog-
nostic value of interim FDG-PET after two or three cycles of chemo-therapy in Hodgkin lymphoma. Ann Oncol 2005;16:1160–8.
3. Barnes JA, LaCasce AS, Zukotynski K, Israel D, Feng Y, Neuberg D,et al. End-of-treatment but not interim PET scan predicts outcome innonbulky limited-stage Hodgkin's lymphoma. Ann Oncol 2011;22:910–5.
4. Jones K, Gandhi MK. Can a blood test monitor lymphoma? LeukLymphoma 2010;51:957–9.
5. Gandhi MK, Lambley E, Duraiswamy J, Dua U, Smith C, Elliott S,et al. Expression of LAG-3 by tumor-infiltrating lymphocytes iscoincident with the suppression of latent membrane antigen-spe-cific CD8þ T-cell function in Hodgkin lymphoma patients. Blood2006;108:2280–9.
6. van den Berg A, Visser L, Poppema S. High expression of the CCchemokine TARC in Reed-Sternberg cells. A possible explanation for
the characteristic T-cell infiltratein Hodgkin's lymphoma. Am J Pathol1999;154:1685–91.
7. MaY, Visser L, RoelofsenH, de VriesM, Diepstra A, van Imhoff G, et al.Proteomics analysis of Hodgkin lymphoma: identification of newplayers involved in the cross-talk between HRS cells and infiltratinglymphocytes. Blood 2008;111:2339–46.
8. Niens M, Visser L, Nolte IM, van der Steege G, Diepstra A, Cordano P,et al. Serum chemokine levels in Hodgkin lymphoma patients: highlyincreased levels of CCL17 and CCL22. Br J Haematol 2008;140:527–36.
9. Weihrauch MR, Manzke O, Beyer M, Haverkamp H, Diehl V, Bohlen H,et al. Elevated serum levels of CC thymus and activation-relatedchemokine (TARC) in primary Hodgkin's disease: potential for a prog-nostic factor. Cancer Res 2005;65:5516–9.
10. Peh SC, Kim LH, Poppema S. TARC, a CC chemokine, is frequentlyexpressed in classic Hodgkin's lymphoma but not in NLP Hodgkin'slymphoma, T-cell-rich B-cell lymphoma, andmost cases of anaplasticlarge cell lymphoma. Am J Surg Pathol 2001;25:925–9.
sCD163 and sTARC as Disease Response Biomarkers in cHL
www.aacrjournals.org Clin Cancer Res; 19(3) February 1, 2013 741
on June 23, 2018. © 2013 American Association for Cancer Research. clincancerres.aacrjournals.org Downloaded from
Published OnlineFirst December 5, 2012; DOI: 10.1158/1078-0432.CCR-12-2693

11. Plattel WJ, van den Berg A, Visser L, van der Graaf AM, Pruim J, Vos H,et al. Plasma thymus and activation-regulated chemokine as an earlyresponse marker in classical Hodgkin's lymphoma. Haematologica2012;97:410–5.
12. Steidl C, Lee T, Shah SP, Farinha P, Han G, Nayar T, et al. Tumor-associatedmacrophages and survival in classic Hodgkin's lymphoma.N Engl J Med 2010;362:875–85.
13. Yoon DH, Koh YW, Kang HJ, Kim S, Park CS, Lee SW, et al. CD68 andCD163 as prognostic factors for Korean patients with Hodgkin lym-phoma. Eur J Haematol 2012;88:292–305.
14. Kamper P, Bendix K, Hamilton-Dutoit S, Honore B, Nyengaard JR,d'Amore F. Tumor-infiltrating macrophages correlate with adverseprognosis and Epstein-Barr virus status in classical Hodgkin's lym-phoma. Haematologica 2011;96:269–76.
15. BarrosMH, Hassan R, Niedobitek G. Tumor-associatedmacrophagesin pediatric classical hodgkin lymphoma: association with Epstein-Barr virus, lymphocyte subsets and prognostic impact. Clin CancerRes 2012;18:3762–71.
16. Azambuja D, Natkunam Y, Biasoli I, Lossos IS, Anderson MW, MoraisJC, et al. Lack of association of tumor-associated macrophages withclinical outcome in patients with classical Hodgkin's lymphoma. AnnOncol 2012;23:736–42.
17. Harris JA, Jain S, Ren Q, Zarineh A, Liu C, Ibrahim S. CD163 versusCD68 in tumor associated macrophages of classical Hodgkin lym-phoma. Diagn Pathol 2012;7:12.
18. Sanchez-EspiridionB,Martin-MorenoAM,Montalban C,Medeiros LJ,Vega F, Younes A, et al. Immunohistochemical markers for tumorassociated macrophages andsurvival in advanced classical Hodgkinlymphoma. Haematologica 2012;97:1080–4.
19. Jensen TO, Schmidt H, Moller HJ, Hoyer M, Maniecki MB, Sjoegren P,et al.Macrophagemarkers in serumand tumor have prognostic impactin American Joint Committee on Cancer stage I/II melanoma. J ClinOncol 2009;27:3330–7.
20. Jones K, Nourse JP, Keane C, Crooks P, Gottlieb D, Ritchie DS, et al.Tumor-specific but not nonspecific cell-free circulating DNA can beused to monitor disease response in lymphoma. Am J Hematol2012;87:258–65.
21. Hasenclever D, Diehl V. A prognostic score for advanced Hodgkin'sdisease. International Prognostic Factors Project on Advanced Hodg-kin's Disease. N Engl J Med 1998;339:1506–14.
22. Franklin J, Paulus U, Lieberz D, Breuer K, Tesch H, Diehl V. Is theinternational prognostic score for advanced stage Hodgkin's diseaseapplicable to early stage patients?GermanHodgkin LymphomaStudyGroup. Ann Oncol 2000;11:617–23.
23. Specht L, HasencleverD. Prognostic Factors. In: Engert A, Horning SJ,editors. Hodgkin lymphoma: a comprehensive update on diagnosticsand clinics. Berlin Heidelberg: Springer; 2010. p. 108.
24. Bonadonna G, Zucali R, Monfardini S, De Lena M, Uslenghi C. Com-bination chemotherapy of Hodgkin's disease with adriamycin, bleo-mycin, vinblastine, and imidazole carboxamide versus MOPP. Cancer1975;36:252–9.
25. Diehl V, Franklin J, Pfreundschuh M, Lathan B, Paulus U, HasencleverD, et al. Standard and increased-dose BEACOPP chemotherapycompared with COPP-ABVD for advanced Hodgkin's disease. N EnglJ Med 2003;348:2386–95.
26. McKendrick JJ, Mead GM, Sweetenham J, Jones DH, Williams CJ,Ryall R, et al. ChlVPP chemotherapy in advanced Hodgkin's disease.Eur J Cancer Clin Oncol 1989;25:557–61.
27. Cheson BD, Pfistner B, Juweid ME, Gascoyne RD, Specht L, HorningSJ, et al. Revised response criteria for malignant lymphoma. J ClinOncol 2007;25:579–86.
28. Cheson BD, Horning SJ, Coiffier B, Shipp MA, Fisher RI, Connors JM,et al. Report of an international workshop to standardize responsecriteria for non-Hodgkin's lymphomas. NCI Sponsored InternationalWorking Group. J Clin Oncol 1999;17:1244.
29. Gandhi MK, Lambley E, Burrows J, Dua U, Elliott S, Shaw PJ, et al.Plasma Epstein-Barr virus (EBV) DNA is a biomarker for EBV-positiveHodgkin's lymphoma. Clin Cancer Res 2006;12:460–4.
30. Gallagher A, Armstrong AA, MacKenzie J, Shield L, Khan G, Lake A,et al. Detection of Epstein-Barr virus (EBV) genomes in the serum ofpatients with EBV-associated Hodgkin's disease. Int J Cancer1999;84:442–8.
31. Hohaus S, Santangelo R, Giachelia M, Vannata B, Massini G, CuccaroA, et al. The viral load of Epstein-Barr virus (EBV) DNA in peripheralblood predicts for biological and clinical characteristics in Hodgkinlymphoma. Clin Cancer Res 2011;17:2885–92.
32. ShimadaY, TakeharaK, SatoS. Both Th2 andTh1 chemokines (TARC/CCL17, MDC/CCL22, and Mig/CXCL9) are elevated in sera frompatients with atopic dermatitis. J Dermatol Sci 2004;34:201–8.
33. Hijnen D, De Bruin-Weller M, Oosting B, Lebre C, De Jong E,Bruijnzeel-Koomen C, et al. Serum thymus and activation-regulatedchemokine (TARC) and cutaneous T cell- attracting chemokine(CTACK) levels in allergic diseases: TARC and CTACK are dis-ease-specific markers for atopic dermatitis. J Allergy Clin Immunol2004;113:334–40.
34. DenardoDG,BrennanDJ,Rexhepaj E, Ruffell B, ShiaoSL,MaddenSF,et al. Leukocyte complexity predicts breast cancer survival and func-tionally regulates response to chemotherapy. Cancer Discov 2011;1:54–67.
35. Heusinkveld M, van der Burg SH. Identification and manipulation oftumor associated macrophages in human cancers. J Transl Med2011;9:216.
36. Barros MH, Vera-Lozada G, Soares FA, Niedobitek G, Hassan R.Tumor microenvironment composition in pediatric classical Hodgkinlymphoma is modulated by age and Epstein-Barr virus infection. Int JCancer 2011;131:1142–52.
37. Chetaille B, Bertucci F, Finetti P, Esterni B, Stamatoullas A, PicquenotJM, et al. Molecular profiling of classical Hodgkin lymphoma tissuesuncovers variations in the tumor microenvironment and correlationswith EBV infection and outcome. Blood 2009;113:2765–3775.
38. Gandhi MK, Moll G, Smith C, Dua U, Lambley E, Ramuz O, et al.Galectin-1 mediated suppression of Epstein-Barr virus specificT-cell immunity in classic Hodgkin lymphoma. Blood 2007;110:1326–9.
39. Ishii H, Takahara M, Nagato T, Kis LL, Nagy N, Kishibe K, et al.Monocytes enhance cell proliferation and LMP1 expression of nasalnatural killer/T-cell lymphoma cells by cell contact-dependent inter-action through membrane-bound IL-15. Int J Cancer 2012;130:48–58.
40. Lin Y, Gustafson MP, Bulur PA, Gastineau DA, Witzig TE, Dietz AB.Immunosuppressive CD14þHLA-DR(low)/�monocytes in B-cell non-Hodgkin lymphoma. Blood 2011;117:872–81.
41. Younes A, Sureda A, Ben-Yehuda D, Zinzani PL, Ong TC, Prince HM,et al. Panobinostat in patients with relapsed/refractory Hodgkin'slymphoma after autologous stem-cell transplantation: results of aphase II study. J Clin Oncol 2012;30:2197–203.
Jones et al.
Clin Cancer Res; 19(3) February 1, 2013 Clinical Cancer Research742
on June 23, 2018. © 2013 American Association for Cancer Research. clincancerres.aacrjournals.org Downloaded from
Published OnlineFirst December 5, 2012; DOI: 10.1158/1078-0432.CCR-12-2693

2013;19:731-742. Published OnlineFirst December 5, 2012.Clin Cancer Res Kimberley Jones, Frank Vari, Colm Keane, et al. Classical Hodgkin LymphomaSerum CD163 and TARC as Disease Response Biomarkers in
Updated version
10.1158/1078-0432.CCR-12-2693doi:
Access the most recent version of this article at:
Material
Supplementary
http://clincancerres.aacrjournals.org/content/suppl/2012/12/05/1078-0432.CCR-12-2693.DC1
Access the most recent supplemental material at:
Cited articles
http://clincancerres.aacrjournals.org/content/19/3/731.full#ref-list-1
This article cites 40 articles, 17 of which you can access for free at:
Citing articles
http://clincancerres.aacrjournals.org/content/19/3/731.full#related-urls
This article has been cited by 8 HighWire-hosted articles. Access the articles at:
E-mail alerts related to this article or journal.Sign up to receive free email-alerts
Subscriptions
Reprints and
To order reprints of this article or to subscribe to the journal, contact the AACR Publications Department at
Permissions
Rightslink site. Click on "Request Permissions" which will take you to the Copyright Clearance Center's (CCC)
.http://clincancerres.aacrjournals.org/content/19/3/731To request permission to re-use all or part of this article, use this link
on June 23, 2018. © 2013 American Association for Cancer Research. clincancerres.aacrjournals.org Downloaded from
Published OnlineFirst December 5, 2012; DOI: 10.1158/1078-0432.CCR-12-2693