servaas van der berg department of economics, university ... · pdf fileapartheid’s...
TRANSCRIPT

Apartheid’s Enduring Legacy: Inequalities in Education1
Servaas van der BergDepartment of Economics, University of Stellenbosch,
South Africa
This paper provides a broad overview of the economic dimensions of theeducational situation in South Africa a decade after the political tran-sition. An important question is whether changes since the transitionhave substantially ameliorated the role of race in education. Census andsurvey data show that quantitative educational attainment differentials(years of education) have been substantially reduced, but qualitativedifferentials remain larger. Despite massive resource shifts to black schools,overall matriculation results did not improve in the post-apartheid period.Thus the school system contributes little to supporting the upwardmobility of poor children in the labour market. The persistence of formerracial inequalities is reflected in extremely poor pass rates in mainly blackschools (the majority of schools), with high standard deviations.Regressions of matriculation pass rates from school level data show thatracial composition of schools—as proxy for former school department—remains a major explanatory factor besides socio-economic background (asmeasured by school fees set by school governing bodies) and educationalinputs (measured by teacher–pupil ratios and teacher salaries as proxy forqualifications and experience). Furthermore, remarkable differentials inperformance among black schools cannot be accounted for by socio-econ-omic background or teaching resources, pointing to the importance ofschool management. The malfunctioning of large parts of the schoolsystem appears largely a problem of x-inefficiency rather than allocativeefficiency. This requires urgent attention to the functioning of poorly
# The author 2007. Published by Oxford University Press on behalf ofthe Centre for the Study of African Economies. All rights reserved. Forpermissions, please email: [email protected]
1 Revised version of a paper delivered to the Oxford University/University ofStellenbosch conference on The South African Economic Policy under Democracy:A 10 year review, Stellenbosch, 27–28 October 2005. Parts of this paper are alsodrawn from presentation to earlier conferences.
Corresponding author: Servaas van der Berg, Department of Economics,University of Stellenbosch, South Africa. E-mail: [email protected]
JOURNAL OF AFRICAN ECONOMIES, VOLUME 16, NUMBER 5, PP. 849–880doi:10.1093/jae/ejm017 online date 2 August 2007
at University of S
tellenosch on January 21, 2011jae.oxfordjournals.org
Dow
nloaded from

performing schools, to permit continued upward mobility of the largestpart of the workforce as well as to support sustained economic growth.
JEL classification: I21
1. Introduction
This paper provides an overview of the educational situation inSouth Africa a decade after the political transition, with the focuson its economic dimensions. This overview often draws on theauthor’s own previous work, with the empirical contribution con-fined to a production function analysis of educational outcomes.An important question is whether changes since the transitionhave substantially ameliorated the role of race in education. Ascomparative inter-temporal data are scarce, this paper thus analysesrecent educational outcomes to show that race, and the race-basedformer school systems, still remain the most pervasive determinantsof educational outcomes.
Section 2 addresses the South African educational context, interms of inequality in educational attainment and quality. An over-view of educational inequality in Section 2.1 shows that quantitativeeducational attainment differentials have been substantiallyreduced, but Section 2.2 shows that quality differentials are endur-ing. Section 2.3 touches on sources of inequality other than race,including evidence of growing educational stratification amongblacks. Section 3 analyses school performance and its determinants,using regression analysis and Section 4 provides a brief economicperspective on school education policy. Section 5 concludes.
A case will be made that the school system still largely fails inenhancing upward mobility of poor children in the labourmarket, inter alia because of the continued weak performance ofmany black schools. The empirical analysis will show that racialcomposition of a school—as proxy for former school department—remains a major determinant of matriculation pass rates. Theconclusion points to enduring socio-economic and racial differen-tials in school outcomes, but also cautions against seeking thesolution mainly through resource shifts. For as Hanushek (2002b:pp. 3–4) has remarked, ‘Eager to improve quality and unable to
850 Servaas van der Berg
at University of S
tellenosch on January 21, 2011jae.oxfordjournals.org
Dow
nloaded from

do it directly, government policy typically moves to what isthought to be the next best thing–providing added resources toschools. Broad evidence from the experience in the United Statesand the rest of the world suggests that this is an ineffective wayto improve quality.’ The empirical analysis in this paper fully sup-ports this perspective: for resource inputs to improve educationalquality may first require some other conditions for quality edu-cation to be met, e.g., well-functioning school and education man-agement, and effective quality control systems. The conclusions arealarming in that they show that quality differentials betweenschools are large and enduring, that despite fiscal resource shiftsthere has been little reduction in these differentials, and thatthere are major impediments to overcoming these qualitativedifferences in school performance.
2. The Education and Skills Context
2.1. Educational Attainment
The legacy of apartheid education, with racially segregated schoolsand under-resourcing of schools for blacks, is still evident in largeeducational differentials between whites and blacks. A perhapseven greater impact was on educational quality differentials, dis-cussed in Section 2.2. Race remains the main correlate of both edu-cation quality and quantity, but race and class are to some extentconflated (despite growing socio-economic cleavages within theblack population).
Census data showed that quantitative educational attainmentdifferentials (in mean years of education completed) had been sub-stantially reduced even during the apartheid era (Louw et al., 2005).The black cohort born in 1920 had on average attained 7.2 feweryears of education than whites, the 1950 cohort 6.0 years less, the1960 cohort 4.9 years less, the 1970 cohort 3.6 and the 1980 cohortonly 2.3 years less. There were still large differentials in mean attain-ment by race and urban versus rural location, but gender differ-ences were quite small.
High levels of educational inequality had given rise to large earn-ings inequalities. Thus it is significant that inequality in educationalattainment had declined both within and between race groups.Mean educational attainment level rose and the coefficient of
Apartheid’s Enduring Legacy 851
at University of S
tellenosch on January 21, 2011jae.oxfordjournals.org
Dow
nloaded from

variation declined over the 30-year period while the variancedeclined even among blacks.2 Despite apartheid, black educationalattainment grew apace in the 1970s and 1980s, although growthlevelled off somewhat in the 1990s. Up to age 15 there is nowalmost universal school enrolment, but there is a noticeable dropout of the school system at the upper secondary level, and highmatric failure rates reflect weak educational quality.
While the white population has educational levels almost similarto those for developed countries, backlogs still plague other groups.Altogether 70% of whites above age 26 had completed matric ormore; almost 15% had a degree. In comparison, only 19% ofblacks over 26 years had completed matric or more and only 1.4%had graduated. For younger cohorts of blacks, the educational lagbehind whites had narrowed considerably. There is a dramaticallyhigher proportion (36.2%) with at least matric among the blackcohort aged 26–30, but the number of university graduates hadnot yet shown such improvement, in part because poor schoolquality limited university access.
In 1970, only 43,000 people matriculated; in 1990, 191,000 did andin 2005, 347,000 did. The growth rate of matriculants of 7.8% peryear in the period 1970–1990 thus dropped to a still respectable4.1% per year in the next 15 years. However, the annual rate didslow in the immediate post-transition period and only recoveredrecently, as Figure 1 shows—some of this improvement in pass
2 Lam (1999) discussed the significance of this finding. As the earnings functionliterature shows that earnings are log-linearly related to educational attainment,even a reduction in mean-invariant measures of educational inequality—such asthe coefficient of variation—does not guarantee a reduction in earnings inequal-ity if the variance increases with constant returns to education. If the logarithm ofearnings of worker i is
log yi ¼ aþ bSi þ ui
(yi is earnings, Si schooling, ui residual uncorrelated with schooling), then
varðlog yiÞ ¼ b2varðSiÞ þ varðuiÞ
Thus earnings inequality (variance of log-earnings) is a linear function of vari-ance in schooling. If schooling inequality is measured by the coefficient of variationCV ¼ s/m (standard deviation divided by mean), which is mean-invariant, thengreater earnings inequality is possible despite reduced schooling inequality.Lam showed that in Brazil the standard deviation for schooling indeed roseless than the mean for cohorts born during 1925–1950. Thus, although the coeffi-cient of variation declined, lower schooling inequality did not reduce high earn-ings inequality as the variance of schooling attainment rose. This was unlike thecase in South Africa.
852 Servaas van der Berg
at University of S
tellenosch on January 21, 2011jae.oxfordjournals.org
Dow
nloaded from

rates resulted from a reduction in the number of candidates due torestrictions introduced on over-age children in the school system.The performance in terms of endorsements or university exemp-tions had not improved as much. The 16,000 endorsements obtainedin 1970 grew at 6.7% per year to 60,000 in 1990, but thereaftergrowth decelerated to a paltry 2.4% per year to arrive at almost87,000 exemptions in 2005.
2.2. Educational Quality
Many black pupils now attend formerly white schools,3 whileamong formerly black schools there is great variation in quality.
Figure 1: Matric Candidates, Passes and Pass Rate, 1980–2005. Source: SA Institute ofRace Relations, 2001, p.156; Department of National Education, website.
3 Data for 1997 for seven provinces (all but Mpumalanga and Eastern Cape)showed that, even so soon after the transition, about 22,000, or 5.4%, of the400,000 pupils in mainly white schools (those with more than 70% whitepupils) were blacks, while in ‘mixed’ schools (where no race group constitutedmore than 70% of pupils), 197,000 out of 488,000 (40.3%) were black and104,000 (21.3%) white. Nevertheless, most black pupils (95.8%) were still in pre-dominantly black schools. In 2003, 93.2% of black matric candidates were inschools where most matriculants were black. Some of these schools, however,could formerly have been schools restricted to other race groups.
Apartheid’s Enduring Legacy 853
at University of S
tellenosch on January 21, 2011jae.oxfordjournals.org
Dow
nloaded from

South African schools generally perform at an even lower level thanmost of their African counterparts, despite greater South Africanresources, less acute poverty and more educated parents.International tests show that intervention is required at a muchearlier stage than matric. Promotion to higher grades appears tobe relatively easy, thus educational attainment (years of educationcompleted) may exaggerate progress in cognitive levels mastered.
Taylor et al. (2003: p. 41) summarised some evidence on edu-cational quality as follows: ‘Studies conducted in South Africa from1998 to 2002 suggest that learners’ scores are far below what is expectedat all levels of the schooling system, both in relation to other countries(including other developing countries) and in relation to the expectationsof the South African curriculum.’ This view is supported by a growingbody of evidence:
† The 1993 Statistics for Living Standards and Developmenthousehold survey showed severe quality problems in largeparts of the education system (Fuller et al., 1995; Van derBerg et al., 2001). Blacks aged 13–18 had reached 78–86%of the years of education attained by whites, but their lit-eracy scores were 50–63% and their numeracy scores only36–47% of white levels. Case and Deaton’s (1999: 1078,table VIII) regression results indicated that the averagecognitive backlog experienced by black teenagers wouldhave required 10 years of schooling to bring them on parwith their white counterparts.
† The 1995 MLA (Monitoring Learning Achievement) studyfound that South African Grade 4 pupils’ numeracy scoreof 30% was by far the lowest of 12 participating Africancountries. In literacy, South Africa outperformed only 3 ofthe 12 countries.
† South Africa’s performance on the Grade 6 education evalua-tion test conducted by the Southern African Consortium forMonitoring Educational Quality in 2000 (SACMEQ II)placed it in the bottom half of the 14 participating countrieson both Reading and Mathematics (see Table 1). SouthAfrica’s high standard deviation indicated large inequalityin performance; the intraclass correlation coefficient, rho(the proportion of variance between individuals thatoccurred between rather than within schools) was also
854 Servaas van der Berg
at University of S
tellenosch on January 21, 2011jae.oxfordjournals.org
Dow
nloaded from

Table 1: Mean Score and Scores of Poor (Low SES) and Rich (High SES) Pupils on SACMEQ II Grade 6 Reading and Mathematics Testsby Country (Arranged by Mean Scores in Each Test)
Reading (arranged by mean score) Mathematics (arranged by mean score)
Low SES High SES Mean Low SES High SES Mean
Seychelles 561.8 594.4 582.0 Mauritius 550.0 607.7 584.6Kenya 525.3 577.5 546.5 Kenya 546.9 587.1 563.3Tanzania 528.8 575.2 545.9 Seychelles 532.4 567.8 554.3Mauritius 508.3 555.1 536.4 Mozambique 527.5 532.6 530.0Swaziland 519.1 541.0 529.6 Tanzania 509.0 545.5 522.4Botswana 502.5 543.6 521.1 Swaziland 511.3 522.2 516.5Mozambique 510.5 523.0 516.7 Botswana 498.9 529.8 512.9South Africa 440.2 543.6 493.3 Uganda 496.3 519.2 506.3Uganda 472.3 495.5 482.4 South Africa 446.8 524.3 486.3Zanzibar 468.1 492.2 478.2 Zanzibar 474.0 483.9 478.1Lesotho 449.2 454.5 451.2 Lesotho 448.6 444.9 447.2Namibia 421.5 486.1 448.8 Zambia 425.5 444.8 435.2Zambia 423.6 456.5 440.1 Malawi 428.2 442.2 432.9Malawi 422.9 440.7 428.9 Namibia 408.7 461.3 430.9SACMEQ Average 500.0 SACMEQ Average 500.0
Note: SES refers to socio-economic status, measured here using a proxy for affluence based on answers on household pos-sessions obtained from the pupil questionnaire.
Source: Indicators on SACMEQ website. Available online at: http://www.sacmeq.org/indicate.htm
Ap
artheid
’sE
nd
urin
gL
egacy
855
at University of Stellenosch on January 21, 2011 jae.oxfordjournals.org Downloaded from

extremely high (Van der Berg, 2006). A government report(South Africa, Department of Education, 2003a: 102) notedthe weak South African performance despite much higherexpenditure per pupil. Surprisingly also, despite its greaterfiscal resources, South Africa lagged many countries in theregion in availability of textbooks in the classroom, particu-larly in Mathematics.
† In the 2003, Trends in International Mathematics and ScienceStudy (TIMSS), South Africa Grade 8 students scored 264 forMathematics compared to the average of 467 for all 53 parti-cipating countries, and 244 for Science, compared to theinternational average of 474 (Human Sciences ResearchCouncil, 2005). This was no improvement on the 1999scores (see Table 2). South Africa maintained its bottomrank, below all five other participating African countries(Egypt, Tunisia, Morocco, Botswana and Ghana) (HumanSciences Research Council, 2005; Taylor et al., 2003). Whileformer white schools performed just below the internationalaverage, the scores in former black schools were only half asmuch in Mathematics and even worse in Science.
† The 2003 Systemic Evaluation of 54,000 Grade 3 pupils indi-cated serious shortcomings in education quality. For life
Table 2: Mathematics and Science Scores in TIMSS Grade 8 Tests in ComparativePerspective, 1999 and 2003
Mathematics Science
1999 2003 1999 2003
International averagea 487 467 488 474South Africa
Country average 275 264 243 244Former white schools — 456 — 468Former black schools — 227 — 200
Source: Human Sciences Research Council (HSRC) 2005.aInternational sample changed between surveys.
856 Servaas van der Berg
at University of S
tellenosch on January 21, 2011jae.oxfordjournals.org
Dow
nloaded from

skills and listening comprehension, scores were 54 and69%, but for reading comprehension only 38% and fornumeracy 30% (South Africa, Department of Education,2003b: p. viii– ix). Here too there were great inequalities.
Figure 2 shows lowess (locally weighted) regressions for pupilmathematics scores against socio-economic status (SES) for SouthAfrica and for 13 other African countries combined in SACMEQ II.Apart from at the top of the SES distribution, South Africanpupils under-perform compared to their equally poor counterparts,despite more favourable pupil/teacher ratios, teacher qualificationsand availability of textbook.
Table 3 shows that the number of candidates who wroteMathematics at the Higher Grade almost halved between 1997and 2001, and the pass rate increased from one-third to 56%.Worryingly, however, only 15.5% of black candidates passed thisexam—in all, only just over 3,000 pupils. As a good performancein Higher Grade Mathematics is required for entry into universitystudies in Science, Engineering, Medicine and Commerce, this isparticularly alarming from the perspective of the skills constraintand black access to skilled positions. Even at Standard Grade, the
Figure 2: Lowess Regression on School Mean Maths Score by Mean SES Level of School,South Africa vs. Other Countries. Source: Own Calculations Based on SACMEQ Data
Apartheid’s Enduring Legacy 857
at University of S
tellenosch on January 21, 2011jae.oxfordjournals.org
Dow
nloaded from

Table 3: Higher and Standard Grade Matriculation Passes in Mathematics and Physical Science for All Pupils and Black Pupils
Higher grade Standard grade Higher plus standard grade
Wrote Pass Percentage of
candidates
Percentage of all
matriculants
Wrote Pass Percentage of
candidates
Percentage
of all matriculants
Pass Percentage of all
matriculants
Mathematics1997 68,500 22,800 33.3 4.1 184,200 66,900 36.3 12.0 89,700 16.0
1998 60,300 20,300 33.7 3.7 219,400 68,600 31.3 12.4 88,900 16.1
1999 50,100 19,900 39.7 3.9 231,200 82,200 35.6 16.1 102,100 20.02000 38,520 19,327 50.2 3.9 245,497 79,631 32.4 16.3 98,958 20.2
2001 34,870 19,504 55.9 4.3 229,075 72,301 31.6 16.1 91,805 20.4
2002 — 20,528 — 4.6 — 101,289 — 22.8 121,817 27.42000:Blacks 20,243 3,128 15.5 — 180,202 41,540 23.1 44,668 —
Physical Science
1997 76,100 27,000 35.5 4.8 65,200 35,200 54.0 6.3 62,200 11.1
1998 73,300 26,700 36.4 4.8 83,800 43,200 51.6 7.8 69,900 12.61999 66,500 24,200 36.4 4.7 93,500 44,000 47.1 8.6 68,200 13.3
2000 55,699 23,344 41.9 4.8 107,486 54,884 51.1 11.2 78,228 16.0
2001 48,996 24,280 49.6 5.4 104,851 45,314 43.2 10.1 69,594 15.52002 — 24,888 — 5.6 — 70,763 — 15.9 95,651 21.6
2000:Blacks 33,657 5,136 15.3 — 77,680 32,874 42.3 — 38,010 —
Source: South Africa, Department of Education, 2001b. National Strategy for Mathematics, Science and Technology ingeneral and further education and training. Pretoria: June, Table 1, p. 8 and Table 2, p. 12; South Africa, Department ofEducation 2001c. Preliminary Report: 2001 Senior Certificate Examination. Pretoria, Spreadsheet Total (1); and South Africa,National Treasury 2003. Intergovernmental Fiscal Review 2003, Pretoria, Tables 4.18 and 4.19.
858S
ervaas
van
der
Berg
at University of Stellenosch on January 21, 2011 jae.oxfordjournals.org Downloaded from

success rate for blacks of 23% was below the national averageof 32%. Only 4.6% of all matriculants passed Mathematics at theHigher Grade in 2002. The performance of black students inPhysical Science was as perturbing. Only 27% of all matric candi-dates passed Mathematics at some level in 2002, and just 22%passed Physical Science. This poor performance was despite thecompensation of 5% per subject (marks are multiplied by a factorof 1.05) to candidates whose home language is neither Afrikaansnor English (Fatti, 2006: 56).4 A contributory factor was that only50 and 42% of teachers teaching Mathematics and Science, respecti-vely, had studied these subjects beyond secondary school level(Edusource, 1999: p. 5).
In 2003, matric passes constituted 28% of the 19-year-old cohortamong blacks and 68% among whites (Table 4). Almost one in 10of the white cohort achieved a matric A-aggregate in publicschools versus just more than one in a 1000 of the black cohort.
Table 4: Matric-Aged Cohort and Matriculation Results in Public Schools by Race, 2003
Black Coloured Indian White Total Blackshare(%)
Matric-aged cohort 819,700 76,400 21,800 66,900 984,800 83Pass matric 229,871 27,988 15,673 45,883 323,057 71Maths passes 96,949 10,424 9,971 29,387 148,582 65Endorsements 42,310 5,523 8,988 24,000 82,265 51Higher grade maths
passes9,669 1,494 3,945 11,942 27,671 35
Higher grade maths Dsymbol (50%) or better
3,768 884 2,749 8,969 16,822 22
A-aggregate mark 833 405 1,871 6,503 9,929 8
Source: Own calculations from matriculation data obtained from Department ofEducation.
4 Language policy in schools is currently strongly debated in South Africa. Officialpolicy is presently mother tongue instruction up to Grade 4, but many education-ists favour postponing the switch to English medium instruction, so that studentsfirst can be better trained in their home language.
Apartheid’s Enduring Legacy 859
at University of S
tellenosch on January 21, 2011jae.oxfordjournals.org
Dow
nloaded from

Moreover, almost half of these A-achieving black candidatesattended schools in which blacks were not in the majority in thematric class, probably indicating that these were former whiteor Indian schools. Figure 3 shows the results in Higher GradeMathematics by race group. This was already a select group, asfew black pupils entered for Higher Grade Mathematics. Theresults of black candidates in mainly black schools generallywere dismal: the mode lay well below 20. In contrast, black stu-dents outside mainly black schools also performed much betterand not much different from other groups. However, this was arelatively select group within the black population: they wereusually more urban and often came from a higher socio-economicbackground.
2.3. Other Educational Inequalities
Differential quality of school education is a major cause of unequallabour market earnings. In some Latin American countries, where
Figure 3: Density Curves for Higher Grade Maths by Race, 2003. Source: OwnCalculations from Matriculation Data Obtained from Department of Education
860 Servaas van der Berg
at University of S
tellenosch on January 21, 2011jae.oxfordjournals.org
Dow
nloaded from

private education offers an important route to quality education, ‘. . .individuals from the lower deciles receive a primary education whose quality(measured in terms of income generation capacity) is 35 percent lower thanthat of the next decile above.’ (Inter-American Development Bank,1998: 54). Growing inequality of educational attainment amongblacks contributes to increasing stratification within black society.Figure 4 shows that children from the top two black deciles pro-gressed considerably better through the school system than theirpoorer counterparts, and only at about age 15 started laggingbehind whites.
Children of more educated parents progress better in school andthey also fare better in the labour market once they leave school.Data from the 2001 census show that for children who had matricu-lated, having a parent who had also matriculated virtually doubledown earnings, whereas for children with tertiary education, earn-ings were only 40% higher in cases where parents had matriculated.Parent education translated into higher earnings for children,whether through the quality of education, some other non-observedaspect of human capital transmitted from parents to children orparent social networks.
Figure 4: Years of Education by Age, Race and Income Group, Census 2001.Source: Derived from Census 2001
Apartheid’s Enduring Legacy 861
at University of S
tellenosch on January 21, 2011jae.oxfordjournals.org
Dow
nloaded from

3. Analysing School Performance Usinga School-Level Data Set
3.1. Inequalities in School Outcomes
Post-transition performance in numbers of pupils matric passes orendorsements for university studies has not been particularlygood. Despite more resources for historically black schools,output of the school system barely kept pace with populationgrowth. Weak matriculation performance is particularly severe inthe poorest provinces, which benefited most from resource shifts.
Table 5 illustrates uneven school level performance. This is basedon racial composition and school fees (a measure of socio-economicstatus) in 1997, linked to the matriculation results for the years 1999and 2000. A school was identified with a particular race group ifmore than 70% of pupils in 1997 were drawn from that racegroup. There were massive differentials between the poorest andthe richest school groups (average pass rate of 44 versus 97%), andbetween predominantly black and predominantly white schools(43 versus 97%). To put this into historical context, in 1994, theblack pass rate had been 49% as against the 97% of whites. Thusthere had seemingly been no improvement in pass rates in blackschools in the first few years of the new dispensation, despitelarge resource shifts, while mainly white schools accommodatedfar more black pupils than before. However, mobility does notexplain the failure to improve pass rates in predominantly blackschools, since 96% of black pupils were still in historically blackschools (which constituted some 80% of the total school population).
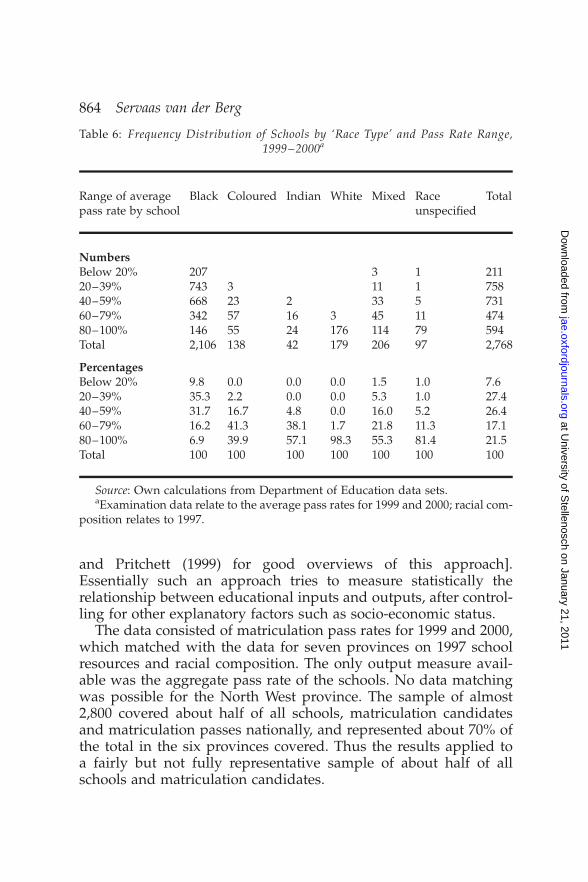
While pass rates in more affluent schools were almost uniformlyhigh, predominantly black schools performed abysmally, with mostrecording pass rates in the range 20–60% or even lower (Table 6). Incontrast, only 3 out of 179 mainly white schools had pass ratesbelow 80%. Among poor mainly black schools that chargedschool fees of less than R30 per annum, the best performing quartilehad a pass rate of 68%, against the 18% of the worst quartile, despitesimilar socio-economic status and legacies of inadequate teachingresources. The difference therefore probably should be soughtin the functioning of schools and/or in the unobserved character-istics of students, since more motivated students may have chosento attend schools which functioned better, i.e., school qualityand student unobserved characteristics may have been jointly
862 Servaas van der Berg
at University of S
tellenosch on January 21, 2011jae.oxfordjournals.org
Dow
nloaded from

determined. However, as geographical impediments limited mobi-lity, differences in school functioning may be the dominant factor.Evidence presented later shows little indication of systematic mobi-lity in response to quality differentials.
3.2. Explaining School Performance
A production function approach is now applied to this data set toanalyse school performance [see Hanushek (2002c) and Filmer
Table 5: Number of Schools, Mean and Standard Deviation of Average Matriculation PassRates in Sample by School Fee Group, ‘Race Type’ and Province, 1999/2000a
Number of schools Mean (%) Standard deviation (%)
Total sample 2,768 55.5 27.3School fee group:
,R20 651 43.9 23.4R20–R49 1,177 47.8 22.2R50–R99 496 54.1 22.2R100–R199 82 69.7 23.2R200–R999 243 91.9 15.0R1000þ 119 97.2 8.6
School ‘race type’.70% black 2,106 43.3 20.3.70% coloured 138 75.5 14.2.70% indian 42 80.5 12.3.70% white 179 97.3 3.8
Mixed 206 79.0 21.5Race not specified 97 91.8 13.9
ProvinceLimpopo 1,002 43.9 20.2Free state 289 49.1 29.5Kwazulu-Natal 784 55.7 25.5Gauteng 367 62.2 29.5Northern Cape 87 66.2 25.6Western Cape 239 81.8 19.7
Source: Own calculations from Department of Education data sets.aExamination data relate to the average pass rates for 1999 and 2000; school fees
and racial composition relate to 1997. The racial composition or socio-economic status of some schools may have changed between 1997 and 2000.
Apartheid’s Enduring Legacy 863
at University of S
tellenosch on January 21, 2011jae.oxfordjournals.org
Dow
nloaded from
and Pritchett (1999) for good overviews of this approach].Essentially such an approach tries to measure statistically therelationship between educational inputs and outputs, after control-ling for other explanatory factors such as socio-economic status.
The data consisted of matriculation pass rates for 1999 and 2000,which matched with the data for seven provinces on 1997 schoolresources and racial composition. The only output measure avail-able was the aggregate pass rate of the schools. No data matchingwas possible for the North West province. The sample of almost2,800 covered about half of all schools, matriculation candidatesand matriculation passes nationally, and represented about 70% ofthe total in the six provinces covered. Thus the results applied toa fairly but not fully representative sample of about half of allschools and matriculation candidates.
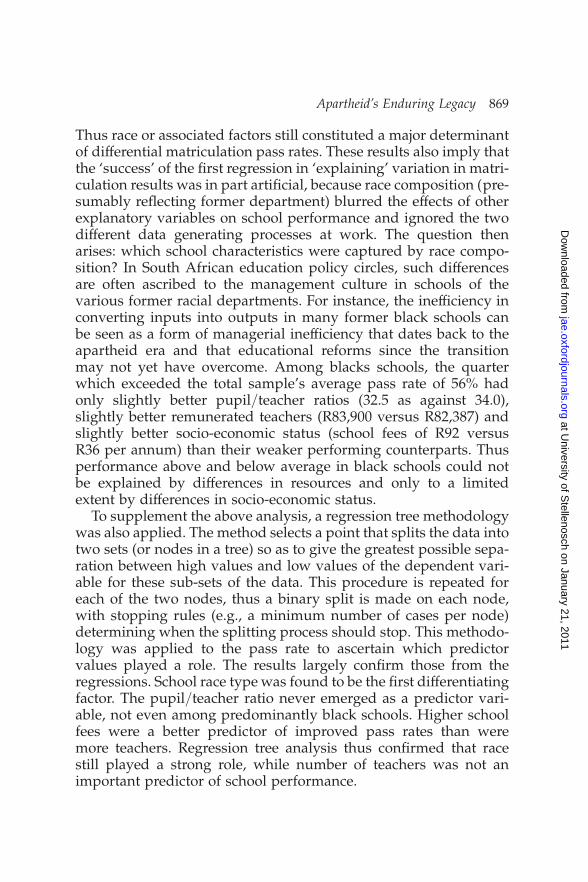
Table 6: Frequency Distribution of Schools by ‘Race Type’ and Pass Rate Range,1999–2000a
Range of averagepass rate by school
Black Coloured Indian White Mixed Raceunspecified
Total
Numbers
Below 20% 207 3 1 21120–39% 743 3 11 1 75840–59% 668 23 2 33 5 73160–79% 342 57 16 3 45 11 47480–100% 146 55 24 176 114 79 594Total 2,106 138 42 179 206 97 2,768
PercentagesBelow 20% 9.8 0.0 0.0 0.0 1.5 1.0 7.620–39% 35.3 2.2 0.0 0.0 5.3 1.0 27.440–59% 31.7 16.7 4.8 0.0 16.0 5.2 26.460–79% 16.2 41.3 38.1 1.7 21.8 11.3 17.180–100% 6.9 39.9 57.1 98.3 55.3 81.4 21.5Total 100 100 100 100 100 100 100
Source: Own calculations from Department of Education data sets.aExamination data relate to the average pass rates for 1999 and 2000; racial com-
position relates to 1997.
864 Servaas van der Berg
at University of S
tellenosch on January 21, 2011jae.oxfordjournals.org
Dow
nloaded from

The examination data set contained pass rates for 1999 and 2000,and the number of candidates who wrote the examination in 2000.The correlation between the pass rates for 1999 and 2000 (r ¼ 0.85)indicated a large measure of stability in pass rates at the schoollevel. The average pass rate over the 2 years was used as performancemeasure to reduce the effect of year-to-year variations, and thenumber of candidates in each school who wrote in 2000 was usedto weight each observation (school). This was the dependent vari-able. The 1997 racial composition of schools provides a fair approxi-mation of the racial composition of each school’s matric class in 1999and 2000, and 1997 educational resources and school fees (averageactual fees paid) were taken as a crude proxy for these variablesover the high school career. Apartheid-era resource differentialsbetween schools had not been eliminated in 1997, so that the datacaptured a variety of experiences. Teacher resources were measuredby pupil/teacher ratio, average teacher salaries (a measure of theirqualifications and experience) or a combination of these two, viz.average teacher costs per pupil. Racial composition of schools wasused as a proxy for former race departments. Mobility betweenschools meant that the racial composition of schools may havebeen endogenous, if mobility occurred in response to schoolquality. However, the broad pattern of mobility since the openingup of schools meant that former black schools were easily identified.
The data are summarised in Table 7. A priori, one would haveexpected matriculation pass rates to improve with higher schoolfees, a lower pupil/teacher ratio, higher teacher salaries, fewerblack pupils and in historically better-endowed provinces.Regression results were broadly consistent with these expectations.Regression 1 in Table 8 shows that matriculation pass rates ofschools were associated with pupil socio-economic background asmeasured by school fees, teaching resources (pupil/teacher ratioand average teacher salary), provincial location and the race cate-gory of schools. The Western Cape and Kwazulu-Natal performedsignificantly better than similar schools in Limpopo, the referenceprovince. All other variables were highly significant and theirsigns as expected. A full log-transformation did not improve thefit. The coefficient of determination was high for a cross-sectionalregression of this nature where the dependent variable, pass rates,reflects little differentiation at the upper end. Tests showed theresults to be insensitive to the presence of outliers.
Apartheid’s Enduring Legacy 865
at University of S
tellenosch on January 21, 2011jae.oxfordjournals.org
Dow
nloaded from

The coefficient of the dummy for mainly white schools indicatedthat, holding constant the level of school fees, pupil/teacher ratios,teacher salary level and province, a school containing mainly whitepupils had a matriculation pass rate 26 percentage points higherthan a similar mainly black school (the reference category).Therefore, a large part of the 54 percentage points differencebetween black and white schools could not be explained away byschool fees, educational resources and province—and even thesefactors were highly correlated with race. This finding was highlydisturbing, that a large part of the educational system was stillunable to overcome the ravages of apartheid education. It appearedthat the reason should be sought in the poor ability of many schoolsto convert school resources into educational outcomes, perhapsrelated to dysfunctional management structures.
Replacing the pupil/teacher ratio and the teacher salary by asingle combined variable, the teacher cost per pupil,5 or using a
Table 7: Descriptive Statistics: Schools from Six Provinces
Matric passrate
Fees perpupil
Pupils perteacher
Average teachersalary
Black schools (n ¼ 2106)Mean (%) 43 R 49 33.7 R 82,720Standard deviation (%) 20 R 118 9.9 R 7,498
Other schools (n ¼ 662)a
Mean (%) 85 R 545 27.1 R 97,574Standard deviation (%) 17 R 679 5.2 R 5,747
All schools (n ¼ 2768)Mean (%) 56 R 194 31.7 R 87,084Standard deviation (%) 27 R 443 9.3 R 9,756
a179 mainly white schools, 179 mixed schools, 138 mainly coloured, 42 mainlyIndian and 97 schools for which race composition was unknown.
5 The coefficient for school fees per pupil was five times as large as that for teachercost per pupil. This implied that school fees did more than only augment fiscalresources, possibly because school fees was spent more effectively than otherschool expenditures (being controlled by school governing bodies, who werecloser to schools’ real needs), or because school fees was a good proxy for econ-omic status.
866 Servaas van der Berg
at University of S
tellenosch on January 21, 2011jae.oxfordjournals.org
Dow
nloaded from

Table 8: Regressions of Matriculation Pass Rates by School in Six Provinces, 1999–2000(t-values Shown Below Coefficients)
Dependent variable: pass rate(average 1999 and 2000)
Regression 1:All schools
Regression 2:Mainly blackschools
Regression 3:Other schools
School fees per pupil (R per annum) 0.037 0.105 0.029(13.90)�� (9.27)�� (14.27)��
Square of school fees per pupil 20.000011 20.0000051 20.00000778(10.58)�� (4.86)�� (10.56)��
Pupil/teacher ratio 20.129 20.085 20.346(2.93)�� (1.90) (2.87)��
Average teacher salary(in thousands of Rand)
0.435 0.412 0.913
(5.95)�� (4.43)�� (5.75)��
Mainly coloured school (dummy) 23.024(11.66)��
Mainly Indian school (dummy) 24.351(9.05)��
Mixed school (dummy) 17.872(9.29)��
Mainly white school (dummy) 25.706(13.00)��
Race unspecified (dummy) 26.554(10.69)��
Kwazulu-Natal (dummy) 5.521 4.528 3.228(4.86)�� (3.47)�� (0.82)
Free State (dummy) –2.001 –2.004 5.404(1.29) (1.14) (1.37)
Northern Cape (dummy) 2.332 3.929 5.379(1.19) (1.23) (1.27)
Gauteng (dummy) –1.263 –0.713 1.337(1.04) (0.48) (0.36)
Western Cape (dummy) 7.056 3.630 12.108(3.65)�� (1.00) (3.17)��
Constant 11.049 10.025 13.431(1.81) (1.36) (1.12)
N 2768 2106 662R2 0.59 0.12 0.48
Robust t-statistics in parentheses.�Indicates 0.05 level of significance.��Indicates 0.01 level of significance.
Apartheid’s Enduring Legacy 867
at University of S
tellenosch on January 21, 2011jae.oxfordjournals.org
Dow
nloaded from

log specification for school fees left other coefficients relatively unaf-fected, suggesting that the model was not greatly influenced by theparticular specification. Non-linear specifications of the pupil/teacher ratio variable did not improve the fit.
However, the bimodal distribution of school pass rates signifiedtwo underlying data generation processes rather than a singleone. These processes may be better understood if they were model-led separately, thus the initial sample was split into two groups, viz.mainly black schools versus other schools. The results could besummarised as follows:
† School fees and educational resources had a significantlypositive influence on matriculation pass rates in bothregressions, and again this effect declined with risingschool fees.
† Surprisingly, the coefficient for school fees was much largerin black schools than in other schools, pointing to strongsocio-economic differentiation within dominantly blackparts of the school system.
† The coefficient for the pupil/teacher ratio was statisticallyinsignificant in mainly black schools, where high pupil/teacher ratios historically had been particularly detrimental.These results may explain why, on their own, teacherresource shifts to blacks schools may have had limitedimpact in improving overall educational performance. Thecorrelation coefficient of 20.06 between the 1999–2000matriculation results and the pupil/teacher ratio for blackschools in 1997 (when apartheid-era differentials had notyet been fully eliminated) meant that less than 4% of thevariation in matriculation pass rates among black schoolscould be explained by the pupil/teacher ratio.
† The coefficient of determination of 0.12 for Regression 2 indi-cated that the model left the large variation in pass rates inblack schools around a low mean largely unexplained. Instriking contrast, 48% of the smaller variation in matricresults in other schools was explained by these few explana-tory variables.
† Kwazulu-Natal’s black schools fared significantly betterthan expected, while for other schools the Western Capesignificantly outperformed other provinces.
868 Servaas van der Berg
at University of S
tellenosch on January 21, 2011jae.oxfordjournals.org
Dow
nloaded from
Thus race or associated factors still constituted a major determinantof differential matriculation pass rates. These results also imply thatthe ‘success’ of the first regression in ‘explaining’ variation in matri-culation results was in part artificial, because race composition (pre-sumably reflecting former department) blurred the effects of otherexplanatory variables on school performance and ignored the twodifferent data generating processes at work. The question thenarises: which school characteristics were captured by race compo-sition? In South African education policy circles, such differencesare often ascribed to the management culture in schools of thevarious former racial departments. For instance, the inefficiency inconverting inputs into outputs in many former black schools canbe seen as a form of managerial inefficiency that dates back to theapartheid era and that educational reforms since the transitionmay not yet have overcome. Among blacks schools, the quarterwhich exceeded the total sample’s average pass rate of 56% hadonly slightly better pupil/teacher ratios (32.5 as against 34.0),slightly better remunerated teachers (R83,900 versus R82,387) andslightly better socio-economic status (school fees of R92 versusR36 per annum) than their weaker performing counterparts. Thusperformance above and below average in black schools could notbe explained by differences in resources and only to a limitedextent by differences in socio-economic status.
To supplement the above analysis, a regression tree methodologywas also applied. The method selects a point that splits the data intotwo sets (or nodes in a tree) so as to give the greatest possible sepa-ration between high values and low values of the dependent vari-able for these sub-sets of the data. This procedure is repeated foreach of the two nodes, thus a binary split is made on each node,with stopping rules (e.g., a minimum number of cases per node)determining when the splitting process should stop. This methodo-logy was applied to the pass rate to ascertain which predictorvalues played a role. The results largely confirm those from theregressions. School race type was found to be the first differentiatingfactor. The pupil/teacher ratio never emerged as a predictor vari-able, not even among predominantly black schools. Higher schoolfees were a better predictor of improved pass rates than weremore teachers. Regression tree analysis thus confirmed that racestill played a strong role, while number of teachers was not animportant predictor of school performance.
Apartheid’s Enduring Legacy 869
at University of S
tellenosch on January 21, 2011jae.oxfordjournals.org
Dow
nloaded from

Unobserved characteristics such as motivation or mobility ofmore able students to better schools may have influenced some ofthese findings. However, the small magnitude of physical mobilitysignified that this was unlikely to provide a major explanation.A Western Cape study showed that mobility was not systematiceven in urban areas. Changes in enrolment in 2000 and in 2001were virtually uncorrelated (r ¼ 0.07), and many schools experiencedlarge enrolment increases in 2000, followed by enrolment lossesin 2001 or vice versa. (Van der Berg and Achterbosch, 2001: p. 13). Inthe absence of information to parents and students about schoolquality, this lack of systematic mobility is not surprising.
Other studies on school production functions in South Africa arerelatively scarce. The findings presented above accord with those ofCrouch and Mabogoane (1998), who showed that much of the vari-ation in school performance could not be explained by input vari-ables or by controls for socio-economic status. Although Fiske andLadd interpreted their findings differently, their regression (Fiskeand Ladd, 2004: p. 250, Appendix Table B) implied that a largereduction of the Western Cape pupil/teacher ratio, from 35 to 25,would have improved the matric pass rate by only 5 percentagepoints, if teacher quality was left unchanged. This was swampedby dummies for the former racial departments: compared toformer white schools, the negative impact of a school having beenpart of the former black department was 29 percentage points,and 12 percentage points in the case of the former coloured depart-ment. Using quality of Western Cape matric results rather than onlypass rates leads to broadly similar conclusions (Van der Berg andBurger, 2002), that resources alone leave much unexplained thatare captured by dummies for former department. But this stillleaves the mystery of how to interpret the former departmentdummy.
Both Gustafsson (2005) and Van der Berg (2006) used hierarchicallinear models (HLM, also known as multi-level models) onSACMEQ data. This richer data set allowed controls for home back-ground variables (socio-economic status, parent education, books athome and whether the child lived with the parents), but Gustafsson(2005) notes how little (7%) of within school variance in results isexplained by these factors. Socio-economic status seemed to havea limited impact on pupil performance except for the richestschools. Pupil/teacher ratios had at best a mild influence—although
870 Servaas van der Berg
at University of S
tellenosch on January 21, 2011jae.oxfordjournals.org
Dow
nloaded from

Gustafsson (2005) found some evidence of non-linear effects thatshowed that very high class sizes may be particularly detrimental.Some other school level resources (textbooks and school facilities)influenced learning, but all inputs together accounted for only asmall part of the between school variance in results.
Production functions thus appear to be consistent with a perspec-tive that teacher resources may only play a stronger role in improv-ing school performance in poorer schools if certain efficiencyconditions are met. This may imply that, at the margin, resourcesmay only matter conditionally. The policy implication is thatadditional fiscal resources by themselves may make only a limitedcontribution to improving educational performance. Better schoolmanagement is probably most important, while availability ofgood teachers remains a binding constraint. Getting more qualifiedteachers and better management into poor schools is more thanonly a fiscal problem. Issues of location (urban/rural and city/township), language, race and union opposition to salary differen-tiation all play a role, and teacher training is slow to yield results.
4. An Economic Perspective on School Education Policy
Faced with an educational system ravaged by apartheid, the newgovernment tackled a number of tasks simultaneously: re-unificationof the education system; deracialisation of schools; curriculum; andthe highly contentious introduction of outcomes-based education.Efforts aimed at more equitable access to quality schooling includedshifts in the allocation of education expenditure; infrastructureinvestments, notably the construction and repair of school build-ings; and a primary school nutrition programme reaching about5 million school children.
South Africa allocates a large share of its national resources topublic education—its public education spending ratio of 6% ofGDP is high by world standards. Moreover, school educationspending increased relatively rapidly immediately after the tran-sition. Substantial further increases of fiscal resources for educationdo not seem viable. But larger financial flows to education did notcause a commensurate increase in real resources for schools, asfiscal resource shifts were overshadowed by salary increases for tea-chers (in part to eliminate apartheid-era discrimination in teachersalaries). In contrast to international experience, teacher salaries
Apartheid’s Enduring Legacy 871
at University of S
tellenosch on January 21, 2011jae.oxfordjournals.org
Dow
nloaded from

outpaced the growth of per capita GDP so that the relative burdenof teacher salaries (measured as a fraction of per capita GDP)increased.6 But even before the transition, Donaldson (1992:p. 147) had noted that ‘...the constraint at work . . . is not (only)finance, but the limited real resources available to the economy.Competent teachers, nurses, doctors and community workers arescarce, as is the capacity to produce books, medical supplies, andbuilding materials. So the growth and improved distribution ofsocial services must be viewed as the growth and improved distri-bution of the inputs required for delivering these services.’
Inter- and intra-provincial fiscal redistribution after the transitiontargeted education spending much better at the poor (see Van derBerg, 2000). An analysis of Western Cape data showed that thelimited remaining fiscal inequalities between schools largelyresulted from differences in qualifications and experience of tea-chers (Fiske and Ladd, 2004: p. 124, Table 6-6). Table 9 shows com-plete equalisation of the pupil/teacher ratio in Western Capeschools by 2002, across former departments and also by schoolpoverty quintile (arranged by economic status of their neighbour-hood), but with major differentials in teacher quality. Nationally,teachers paid by the state increased from 24 to 31 per 1000 studentsin formerly black schools, and decreased from 59 to 31 in formerlywhite schools. Private funding allowed richer schools to sup-plement teaching resources from parental fees; formerly whiteschools on average had another 12 teachers per 1000 studentspaid for by parents through the school governing body, thusoverall there was a reduction in teacher numbers from 59 to 43per 1000 pupils in formerly white schools. Surprisingly, however,these large changes had little effect on relative performance inthese two groups of schools.
This massive shift in teacher resources took place without majorconflict and flight of the more affluent into private schools. The 3%of children in private schools remains small compared with almostone-third in many Latin American countries, which face similar
6 Lee and Barro (1997: pp. 17–18) provide some international evidence of the rela-tive decline of teachers’ salaries: ‘The ratios of estimated real salaries of primaryschool teachers to per capita GDP have typically declined over time; from 1965 to1990, the value dropped from 2.5 to 2.2 in the OECD, from 4.9 to 3.6 in the overallgroup of developing countries, and from 7.4 to 1.7 in the (centrally plannedeconomies).’
872 Servaas van der Berg
at University of S
tellenosch on January 21, 2011jae.oxfordjournals.org
Dow
nloaded from

Table 9: Some Indicators of Performance, Resources and Teacher Qualification by Former Department and Poverty Quintile,Western Cape 2002
DET HOR HOD CED Q1 Q2 Q3 Q4 Q5 Total
Number writing matric 5,415 17,363 296 12,550 7,229 7,091 7,181 7,040 7,083 35,624Matric aggregate 823 919 1,097 1,289 844 891 997 1,192 1,264 1,037Matric aggregate (%) 39 44 52 61 40 42 47 57 60 49Pass rate (%) 68 83 94 99 71 81 88 94 97 86School fees p.a. R122 R221 R340 R2,369 R129 R244 R424 R1,623 R2,576 R1,033Poverty rate (%) 47 31 28 18 47 38 29 22 14 29REQV Index 13.91 14.09 14.14 14.51 13.95 14.05 14.18 14.40 14.48 14.21
Teachers per 1000 pupils byqualification of teachers
REQV17 0.09 0.17 0.14 0.81 0.12 0.24 0.17 0.76 0.66 0.39REQV16 0.95 1.60 2.24 3.35 1.08 1.29 2.06 2.96 3.24 2.12REQV15 5.49 5.49 6.64 8.03 5.47 5.00 6.28 7.21 8.03 6.39REQV14 14.07 15.86 16.70 17.37 14.57 16.70 15.89 16.54 16.97 16.13REQV13 8.54 6.07 3.82 1.26 8.13 6.31 4.81 2.84 1.48 4.73REQV12 0.43 0.14 0.00 0.03 0.36 0.11 0.08 0.13 0.04 0.14REQV11 0.01 0.03 0.00 0.00 0.02 0.00 0.05 0.01 0.01 0.02
(continued on next page)
Ap
artheid
’sE
nd
urin
gL
egacy
873
at University of Stellenosch on January 21, 2011 jae.oxfordjournals.org Downloaded from

Table 9: Continued
DET HOR HOD CED Q1 Q2 Q3 Q4 Q5 Total
REQV10 0.19 0.06 0.86 0.05 0.14 0.10 0.08 0.03 0.05 0.08Qualifications unknown 0.65 0.56 0.62 0.50 0.61 0.55 0.49 0.53 0.58 0.55REQV 14 or higher 20.6 23.12 25.72 29.56 21.24 23.23 24.4 27.47 28.9 25.03Total: Publicly appointed teachers 30.41 29.98 31.01 31.40 30.50 30.31 29.91 31.00 31.07 30.55SGB appointed teachers 0.07 1.12 0.99 11.61 0.21 1.26 2.58 7.85 11.52 4.66Total: All teachers 30.48 31.10 32.00 43.01 30.71 31.57 32.49 38.85 42.59 35.21
Note: DET (Department of Education and Training), HOR (House of Representatives), HOD (House of Delegates) andCED (Cape Education Department). These were the former departments dealing with blacks, coloured, Indian and whites,respectively, in the apartheid era in the Western Cape. Q1–Q5 are the poverty quintiles of schools, derived from thesocio-economic status of the area surrounding the schools. REQV10 is a qualification of matric or equivalent; eachadditional unit increase implies one more year of tertiary education, with REQV17 being a doctorate or equivalent.
874S
ervaas
van
der
Berg
at University of Stellenosch on January 21, 2011 jae.oxfordjournals.org Downloaded from

equity and quality problems. Retaining most children in publicschools also prevented the flight of scarce qualified teachers toprivate schools. An important decision here was to continue toallow schools to charge school fees, which allowed more affluentcommunities to supplement school resources.
Despite the fiscal resource shifts, there were still stark differencesin teacher qualifications between more and less privileged schools,e.g., almost 30 teachers with a REQV of 14 or above—the supposedminimum desired qualification for secondary schools, viz. 4 years ofpost-matric education—per 1000 pupils in formerly white schoolsversus only 21 in former black schools. The absence of enough qua-lified teachers remains one of the most intractable problems in over-coming apartheid legacies, as this limits the potential impact ofresource shifts to poorer schools. For a good overview of the teachersupply issue in the presence also of AIDS, refer to Simkins (2002).
Personnel spending is very dominant, thus even a small shifttowards non-personnel spending would considerably improveavailability of complementary classroom resources. These may inany event provide the highest marginal return to further invest-ment, as Filmer and Pritchett (1999) argued. Jansen (2005: p. 75)also contends that textbooks may be particularly useful in empowe-ring both pupils and weak teachers:
‘Textbooks serve two functions in developing countries. First, they provide
learners with substantive learning content to complement and even
compensate for the weak knowledge base of teachers. Second . . . textbooks
provide under-qualified or less than competent teachers with reliable and
accessible learning content to guide, inform and even correct their
teaching. The combination of incompetent teachers and the non-
availability of textbooks holds dire consequences for teacher preparation
and student achievement. . .’
After the transition, teacher unions used their strong bargainingpower to raise real salaries substantially, crowding out other edu-cational spending. From 1995–6 to 1997–8, personnel expenditureincreased by 20% in real terms, while non-personnel expendituredeclined by 17% (South Africa, Budget Office, 1998: p. 27). Thusincreased non-personnel spending appears warranted. However,the clearest need now is to utilise existing resources better. This wasalready partly acknowledged by 1996 with the launch of the COLTS(Culture of Learning, Teaching, and Service) campaign, ‘. . .the first
Apartheid’s Enduring Legacy 875
at University of S
tellenosch on January 21, 2011jae.oxfordjournals.org
Dow
nloaded from

more or less official recognition of the fact that efficiency and workeffort problems, rather than funding by itself, were at the heart ofthe problems in the education sector’ (South Africa, Budget Office,1998: p. 35).
School level inefficiencies often result from a principal-agentproblem. Outputs of the educational system are extremelycomplex to monitor, as is teacher effort (input). The educationalauthorities did attempt to shift monitoring to the parent communityas the final ‘principal’, but this was hard where parents themselveshad little formal education. One avenue for addressing a principal-agent problem is through providing more information. The edu-cation authorities have a paucity of information for decisionmaking. Identifying under-performing schools in order to takeremedial action requires understanding school performance.Educational policy improvements need evidence on what worksand what does not, and ‘(d)eveloping such evidence means that regularhigh quality information about student outcomes must be generated.’(Hanushek, 2002a: p. 36). The Department of Education acknowl-edged this in a recent report and consequently undertook to:
‘- Invest in a system that integrates existing performance data from
schools and produces performance scores specific to the country,
provinces, sub-provincial units down to the district/circuit, and
poverty quintiles. . . .
- Research input-output trends in South African schools (as part of the
research into production functions) and in other, similar schooling systems
in order to arrive at normative scores that can be used to gauge the
performance success of schools with varying levels of resourcing, and
varying levels of socio-economic disadvantage.
- Produce comprehensive and user-friendly statistics for public
consumption that will allow comparisons between provinces and districts/
circuits in terms of learner performance. Both absolute scores and scores
that factor out socio-economic variations should be provided. Normative
scores that will allow the public to assess where the schooling system is
functioning best, and worst, should also be made available. Public
dissemination of this information will be aimed at producing constructive
debate and pressures, and will begin during 2004.’ (South Africa,
Department of Education, 2003a)
This would certainly increase openness and information. Teachers,schools and education departments currently have limited
876 Servaas van der Berg
at University of S
tellenosch on January 21, 2011jae.oxfordjournals.org
Dow
nloaded from

accountability to parents and communities for ensuring educationquality, while parents and society have little information aboutthe effectiveness of specific schools. Systematic availability of suchinformation would increase pressures for weaker schools to bringtheir performance more closely into line with better-performingschools. The poor information is illustrated by the fact that noteven matriculation results have hitherto been analysed properlyin a multivariate framework by the education authorities. Literacyand numeracy levels are already far below expectations at earlyages, where there is hardly any measurement of quality.According to Moloi (2005), most pupils at Grade 6 level performedat Grade 3 level or worse in Mathematics tests. So the problem mayrequire intervention much before matric. But evaluating the appro-priateness of alternative interventions requires proper investigationof the data, and the availability of such data.
5. Conclusion
Improving black education is crucial to reducing the racial earningsgap. Educational access is now almost universal and racial gaps ineducational attainment (years of education completed) have alsobeen substantially reduced. The major cause for concern now liesin severe problems with the quality of education of many schools.Only limited scope remains for additional resource outlays orresource shifts to redress this. Moreover, the evidence presentedsupports the view that providing more resources to poor schoolshas thus far little improved educational performance.
Robust economic growth may reduce poverty and racial inequal-ity in coming decades. But from the perspective of distribution—and even as a growth factor itself—an improvement in the qualityof education of South Africa’s poor is likely to be highly rewarding.This requires urgent attention to the functioning of poorly perform-ing schools, to permit continued upward mobility of the largest partof the workforce as well as to support sustained economic growth.
References
Case, A. and A. Deaton (1999) ‘School Inputs and EducationalOutcomes in South Africa’, Quarterly Journal of Economics, 114(3): 1047–84.
Apartheid’s Enduring Legacy 877
at University of S
tellenosch on January 21, 2011jae.oxfordjournals.org
Dow
nloaded from

Crouch, L. and T. Mabogoane (1998) ‘When the Residuals MatterMore Than the Coefficients: An Educational Perspective’,Studies in Economics and Econometrics, 22 (2): 1–14.
Donaldson, A. (1992) Content, Quality and Flexibility: The Economicsof Education System Change, Spotlight 5/92, Johannesburg: SouthAfrican Institute of Race Relations.
Edusource (1999) Edusource Data News 24, Johannesburg: EducationFoundation. March.
Fatti, L.P. (2006) ‘The Statistical Adjustment of Matric Marks’, inVijay, R. (ed.), Marking Matric: Colloquium Proceedings. HumanSciences Research Council, Pretoria, February, pp. 45–57.
Filmer, D. and L. Pritchett (1999) ‘What Education ProductionFunctions Really Show: A Positive Theory of EducationExpenditures’, Economics of Education Review, 18 (2): 223–39.
Fiske, E.B. and H.F. Ladd (2004) Elusive Equity: Education Reform inPost-Apartheid South Africa, Brookings: Washington, D.C.
Fuller, B., P. Pillay and N. Sirur (1995) Literacy Trends in South Africa:Expanding Education While Reinforcing Unequal Achievement?Mimeo, Saldru: University of Cape Town.
Gustafsson, M. (2005) The Relationships Between Schooling Inputs andOutputs in South Africa: Methodologies and Policy RecommendationsBased on the 2000 SACMEQ Dataset. Paper to SACMEQInvitational Conference, 28–30 September 2005. InternationalInstitute for Educational Planning, Unesco, Paris.
Hanushek, E.A. (2002a) The Failure of Input-Based Schooling Policies.NBER Working Paper 9040, Cambridge, MA: National Bureauof Economic Research
Hanushek, E.A. (2002b) The Long-Run Importance of School Quality.NBER Working Paper 9071, Cambridge, MA: National Bureauof Economic Research.
Hanushek, E.A. (2002c) Publicly Provided Education. NBER WorkingPaper, Cambridge, MA: National Bureau of Economic Research.
Human Sciences Research Council (HSRC) (2005) TIMSS 2003Results. Online: http://www.hsrc.ac.za/research/programmes/ESSD/timss2003/index.html (accessed 21 December 2005).
Inter-American Development Bank (IADB) (1998). Facing Up toInequality in Latin America. Economic and Social Progress in
878 Servaas van der Berg
at University of S
tellenosch on January 21, 2011jae.oxfordjournals.org
Dow
nloaded from

Latin America 1998–1999 Report, Washington, D.C.: JohnsHopkins University Press.
Jansen, J. (2005) ‘Educationally Essential: Teachers, Textbooks andTime’, in S. Brown (ed.), 2005. Conflict and Governance.Transformation Audit. Institute for Justice and Reconciliation:Cape Town, 71–5.
Lam, D. (1999) Generating Extreme Inequality: Schooling, Earnings, andIntergenerational Transmission of Human Capital in South Africa andBrazil. Research Report 99–439, Ann Arbor: Population StudiesCenter, University of Michigan.
Lee, J.-W. and R.J. Barro (1997) Schooling Quality in a Cross Section ofCountries. NBER Working Paper 6198, Cambridge, MA: NationalBureau of Economic Research.
Louw, M., S. Van der Berg and D. Yu (2005) Educational Attainmentand Intergenerational Social Mobility in SA. Paper to theConference of the Economic Society of South Africa. Durban,September.
Moloi, M.Q. (2005) Mathematics Achievement in South Africa:A Comparison of the Official Curriculum with Pupil Performance inthe SACMEQ II Project. Paper to SACMEQ InternationalInvitational Conference, 28–30 September 2005. InternationalInstitute for Educational Planning, Unesco, Paris.
Simkins, C. (2002) The Jagged Tear: Human Capital, Education, andAIDS in South Africa, 2002–2010. CDE Focus 7. Centre forDevelopment and Enterprise: Johannesburg.
South Africa, Budget Office (1998) 1998 Medium Term ExpenditureReview: Education, Pretoria: Department of Finance.
South Africa, Department of Education (2003a) Report to theMinister: Review of the Financing, Resourcing and Costs ofEducation in Public Schools. 3 March. Pretoria: Department ofEducation.
South Africa, Department of Education (2003b) Systemic Evaluation2003: Foundation Phase: Mainstrea, Pretoria: Department ofEducation.
South African Institute of Race Relations (2001) South African Survey2000/01, Braamfontein: SAIRR.
Taylor, N., J. Muller and P. Vinjevold (2003) Getting Schools Working,Cape Town: Pearson Education.
Apartheid’s Enduring Legacy 879
at University of S
tellenosch on January 21, 2011jae.oxfordjournals.org
Dow
nloaded from

Van der Berg, S. (2000). An Analysis of Fiscal Incidence of SocialSpending in South Africa, 1993–97. Report to the Department ofFinance, Pretoria and funded by Deutsche Gesellschaft furTechnische Zusammenarbeit. Stellenbosch, Mimeo.
Van der Berg, S. (2006) How Effective are Poor Schools? Poverty andEducational Outcomes in South Africa. Paper to SACMEQInternational Invitational Conference, September 2005,International Institute for Educational Planning, Unesco, Paris.Working Paper 6-2006. Bureau for Economic Research/Dept ofEconomics: Stellenbosch.
Van der Berg, S. and T. Achterbosch (2001) School Education in theWestern Cape: Matching Supply to Demand. Report for theWestern Cape Education Department. Stellenbosch, 23 April.
Van der Berg, S. and R. Burger (2002) ‘Education and Socio-Economic Differentials: A Study of School Performance in theWestern Cape’, South African Journal of Economics, 71 (3), 496–522.
Van der Berg, S., L. Wood and N. Le Roux (2002) ‘Differentiation inBlack Education’, Development Southern Africa, 19 (2): 289–306.
880 Servaas van der Berg
at University of S
tellenosch on January 21, 2011jae.oxfordjournals.org
Dow
nloaded from