service lines and activity-based costing reveal … lines and activity-based costing reveal true...
TRANSCRIPT
Copyright © 2017 Health Catalyst 1
HEALTHCARE ORGANIZATION
Integrated Delivery Network
PRODUCTS
Enterprise Data
Activity-Based
Service Lines and Activity-Based Costing Reveal True Cost of Care for UPMC
Success Story
EXECUTIVE SUMMARY
Between 2007 and 2014, U.S. healthcare costs per capita increased by almost 25 percent. The way in which health systems are typically organized, managed, and budgeted (as departments and units within separate hospitals) works against them when they attempt to improve population health and decrease costs. The University of Pittsburgh Medical Center (UPMC), a large health system with more than 20 hospitals and 500 clinics, was keenly aware of this challenge as it embarked on population health and value-based care initiatives that spanned the entire organization.
The health system determined that it needed to break down the virtual walls between care centers and standardize service lines across the enterprise. By extension, this organizational change mandated the need for activity-based costing that would deliver the insight necessary to run a service line effectively. UPMC organized six service lines within the health system, each spearheaded by clinical and financial leadership. Each service line uses the health system’s innovative, data-driven activity-based costing methodology to understand the true cost of care.
Notable, measurable results of UPMC’s service lines and activity-based costing methodology to date include:
$42 million of cost reduction opportunities (approximately 2 percent of targeted service line cost)
$5.0 million in realized supplies savings
Transparency toward identification of contribution margin variation for specific procedures
Up to 97 percent improvement in time to access information
INACCURATE COSTING INHIBITS HEALTHCARE IMPROVEMENT GOALS
In 2012, healthcare costs per person averaged almost $9,000 (a significant increase from 2007, when per capita costs hovered around $7,600).1 Two years later, that average had jumped to
Costing Data Mart
Warehouse
Copyright © 2017 Health Catalyst 2
$9,400.2 With costs still rising, healthcare leaders throughout the United States are determined to put the brakes on cost increases while simultaneously improving quality.
One of the biggest challenges health systems face as they seek to improve quality and control costs is that neither they nor the individual care providers who work with them know how much it really costs to deliver patient care.3 The reason for this surprising lack of visibility is that costing in U.S. healthcare has historically been based on charges or reimbursement rather than on the actual cost of providing care.
The traditional way in which healthcare organizations are structured—managed and budgeted according to departments and units—contributes to this problem. The departmental structure doesn’t accurately reflect a patient’s journey through the care-delivery system, because a patient being treated for a single condition crosses many departmental and organizational boundaries throughout the continuum.
The University of Pittsburgh Medical Center (UPMC), a large health system with more than 20 hospitals and 500 clinics, was keenly aware of this structural challenge. UPMC leaders recognized that in order to improve care and compete in today’s healthcare market, they needed to change their paradigm: they needed to consider all of the services they offered from a patient perspective (rather than from a facility or departmental perspective). They decided to break down departmental silos and adopt a service-line approach to care delivery.
At the same time, these leaders understood that to successfully improve quality and lower costs in this service-line approach, they would have to solve the costing problem. They would have to devise new ways to accurately measure the cost of providing care across the continuum and to relate the true cost of care to patient outcomes. Through innovative organizational changes, an activity-based costing methodology, and data-driven decision-making, UPMC is achieving this goal.
POPULATION HEALTH REQUIRES ALIGNMENT ACROSS DEPARTMENTS AND HOSPITALS
When organized and administered as separate hospitals, health systems frequently find that each hospital or department’s strategic priorities don’t align with overall system priorities. Despite the positive intentions of administrators and providers, such misalignment often results in waste, unnecessary clinical variation, and operational inefficiencies.
Activity-based cost accounting is a forensic tool, and cost is the evidence left behind from clinical variation. We are learning to use that evidence to influence practice changes that will positively impact clinical outcomes.
Rob DeMichiei Executive Vice President
and Chief Financial Officer UPMC
Copyright © 2017 Health Catalyst 3
UPMC leaders found this to be the case in their large health system. Providers, budgeting, and care routines varied by location. Furthermore, hospitals and departments frequently made decisions without insight into how those decisions might affect the rest of the hospital or other hospitals in the system. And although UPMC offered similar clinical services across facilities, differences in billing and documentation systems and methodologies made it impossible to accurately compare and contrast the cost of those services among facilities—let alone to compare costs against competitors.
As the health system took on more risk and embarked on population health initiatives, UPMC leaders needed a flexible way to measure and track costs that would allow them to compare and contrast similar patient populations across care locations, providers, and services. They believed that gaining that level of transparency into utilization and cost would allow them to engage physicians in meaningful conversations that would help them understand cost drivers, identify operational and clinical variation, and create a culture of accountability and continuous improvement.
ORGANIZATIONAL CHANGES ENABLE IMPROVED CARE AND COST TRANSPARENCY
UPMC leaders recognized that in order to succeed in population health and value-based care, they needed to reorganize along service lines. Furthermore, they understood that in order to manage service lines effectively, they had to adopt activity-based costing.
Organizing along service lines
To establish the collaboration and systemwide perspective needed to make good decisions for patients and for the organization, UPMC set out to break down the virtual walls between separate care locations. It initiated this new journey by creating and standardizing service lines across the entire health system.
UPMC started by forming four new service lines including Women’s Health, Orthopedics, Heart and Vascular, Neurology and Neurosurgery. In addition, it had various pre-existing service lines, Pediatrics, Cancer, and Psychiatric Services that were already organized with their own budgets, discrete units, and support staff.
However, deciding to expand service lines and getting providers to think in terms of service lines were two completely different propositions. UPMC discovered that relationship-building among service line providers from different care locations was key. To carry
Without the level of financial transparency that activity-based costing gives us, there is no way to hold anyone accountable for financial performance. Transparency creates a culture of accountability.
Rob DeMichiei Executive Vice President
and Chief Financial Officer UPMC
Copyright © 2017 Health Catalyst 4
out this critical work, each service line has a formal leadership structure with three components:
The service line team, a collaborative group of UPMC clinicians and administrators from across the system serving as champions within the service line
The executive team is typically comprised of an executive operational leader and a physician leader
The financial lead, who serves as the primary contact for all financial matters for the assigned area and collaborates with other financial areas such as supply chain
By bringing together service line practitioners across the system, UPMC has removed the institutional barriers to effective collaboration and decision-making. This new structure allows for meaningful, data-supported discussions about the benefits of particular care routines and procedures and the cost of care. It fosters understanding and support so that practice changes can be made that have a positive impact on systemwide operations and patient outcomes in all care locations.
Launching an activity-based costing methodology
The Health Care Advisory Board has ascertained that to successfully organize around service lines, each service line must have a single, integrated financial statement and must measure and share its performance at both the facility and system levels.4 Having reached the same conclusion, UPMC leaders determined that while moving to service lines, they would also revise their costing methodology and financial reporting structure.
These leaders knew that some costs in healthcare (pharmaceuticals, supplies, and blood, for example) are fairly easy to measure. Tracking these expenses to the patient level can usually be done through the billing system, provided the supply is charged directly to the patient account. UPMC’s solution takes this concept to a more granular level, by including the costs of any supply documented on the patient account, regardless of whether it was charged for directly or not. These costs come under the heading of direct costs. But to accurately measure the full cost of providing care, UPMC needed a way to track not only these direct costs but also utilization of services - and the specific cost of providing that service—at the patient level.
To this end, UPMC adopted a new activity-based costing (ABC) methodology. The intent of this ABC model is to track expenses at a level of detail that will allow UPMC to differentiate the costs of providing the same services to different patients.
Activity-based cost management is something you have to have in your toolkit. Things are happening too quickly in today’s environment. You need good information in a timely manner so that you know the whole story and can react quickly in a meaningful way.
Susan Mammarella Director
UPMC Corporate FP&A
Copyright © 2017 Health Catalyst 5
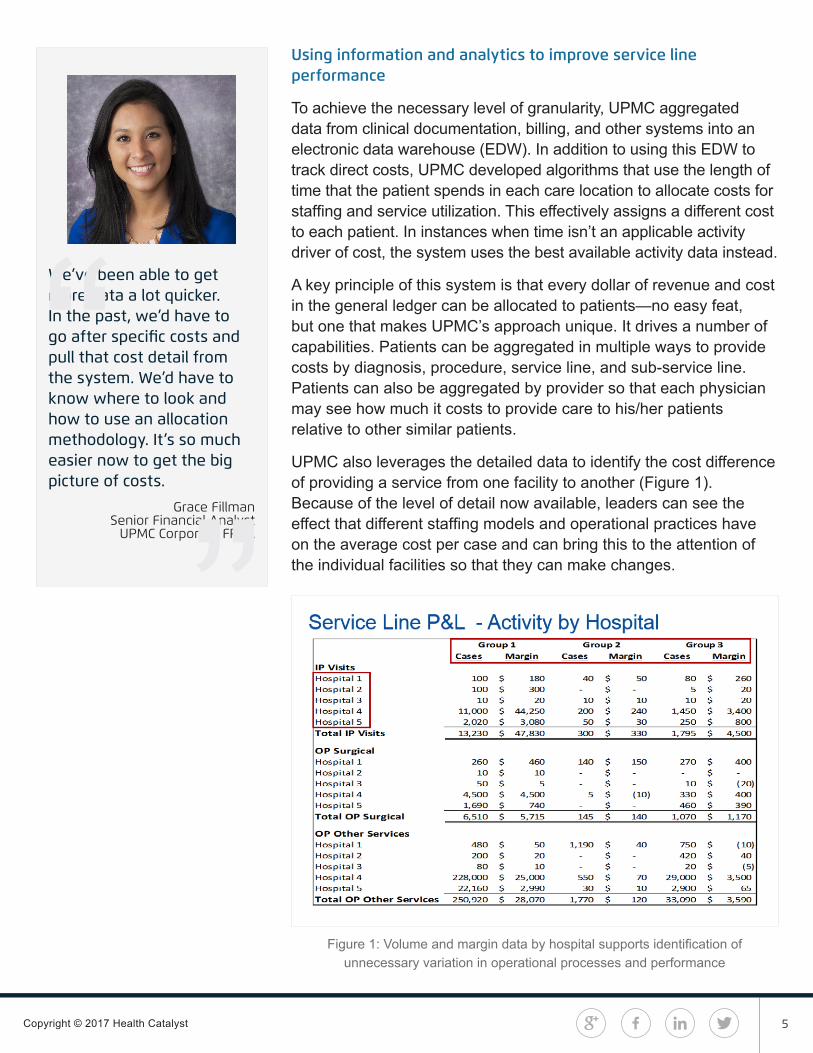
Using information and analytics to improve service line performance
To achieve the necessary level of granularity, UPMC aggregated data from clinical documentation, billing, and other systems into an electronic data warehouse (EDW). In addition to using this EDW to track direct costs, UPMC developed algorithms that use the length of time that the patient spends in each care location to allocate costs for staffing and service utilization. This effectively assigns a different cost to each patient. In instances when time isn’t an applicable activity driver of cost, the system uses the best available activity data instead.
A key principle of this system is that every dollar of revenue and cost in the general ledger can be allocated to patients—no easy feat, but one that makes UPMC’s approach unique. It drives a number of capabilities. Patients can be aggregated in multiple ways to provide costs by diagnosis, procedure, service line, and sub-service line. Patients can also be aggregated by provider so that each physician may see how much it costs to provide care to his/her patients relative to other similar patients.
UPMC also leverages the detailed data to identify the cost difference of providing a service from one facility to another (Figure 1). Because of the level of detail now available, leaders can see the effect that different staffing models and operational practices have on the average cost per case and can bring this to the attention of the individual facilities so that they can make changes.
Figure 1: Volume and margin data by hospital supports identification of unnecessary variation in operational processes and performance
We’ve been able to get more data a lot quicker. In the past, we’d have to go after specific costs and pull that cost detail from the system. We’d have to know where to look and how to use an allocation methodology. It’s so much easier now to get the big picture of costs.
Grace Fillman Senior Financial Analyst
UPMC Corporate FP&A

Copyright © 2017 Health Catalyst 6
However, since this difference in cost by facility is driven by factors outside the control of the physician, leaders found that to be effective in communicating to physicians, they also needed to be able to drill down into utilization data, rather than cost, and to present to physicians only the information about supplies and processes that are within their control. Thus, both facilities and individual practitioners are given consistent, accurate, and actionable data on which to base decisions, change behavior, and identify opportunities for improvement.
Additionally, each service line receives a quarterly service line financial packet. This includes an executive summary that trends service line performance compared to actual, projection, and (beginning in FY17) budget. They also receive service line and sub-service line margin reports (Figure 2), as well as physician variation reports.
Figure 2: High level service line report provides collective service line data for executive review
Service line leaders now depend on these reports to understand the contribution margin of procedures or sub-service lines within each service line. This in turn allows them to identify and analyze procedures or populations that indicate potential savings opportunity and, because of the new systemwide service lines, to engage the right stakeholders to effect practice changes, reduce costs, and improve outcomes across the system.
Instead of Finance coming up with ideas and putting them out there, we work with a group of physicians as a sounding board, to go through the data, understand it, and identify areas of opportunity. Then they go back and sell those ideas to the other physicians.
Paula Lounder Director
UPMC Payer Provider Programs

Copyright © 2017 Health Catalyst 7
Activity-based costing in healthcare in action
Not every service line is the same. Size, clinical complexity, reimbursement models, and access to complete information influence each service line’s ability to drive improvement. Orthopedics and neurology and neurosurgery, for example, have focused on supplies and implants as their first opportunity for improvement. Women’s Health and Heart and Vascular, on the other hand, have looked at specific sub-service lines and procedures to change practice from open surgery to minimally invasive techniques or to shift toward or away from the use of robotic surgery. Each decision is based on clinical indications and outcomes, and further informed by cost.
For example, in Women’s Health, a comparative analysis of the cost and outcomes of various ways to do a hysterectomy led the physicians to conclude that minimally invasive techniques resulted in the best outcomes for their patients at the lowest cost. Use of minimally invasive techniques subsequently trended up as a percent of hysterectomy procedures.
That said, sometimes cost reduction is as simple as showing physicians how much things actually cost. After one orthopedic physician was shown that a special light he liked cost $370 per use, he stopped using it—with no negative repercussions to patients and an immediate reduction in his cost per case. In a related move, some service lines developed menus of less expensive and clinically equivalent supply choices.
UPMC SEES MILLIONS IN SAVINGS
As result of organizing by service line, equipping decision-makers with the information they need to operate service lines effectively, and implementing an activity-based costing methodology UPMC has achieved notable and measurable results, and identified significant cost savings opportunities.
$5.0 million in realized supplies savings to date, with $42 million cost savings opportunities identified (approximately 2 percent of cost) for targeted service lines
Two specific examples included in the $5.0 million savings realized to date come from developing and incentivizing physicians to use a menu of supplies in neurology and neurosurgery which has translated to $1 million in cost savings, and a similar menu for orthopedics implants and supplies which has reaped $1.5 million in savings.
Finance is now being viewed as a partner and a resource for data to help clinicians find opportunities for improvement.
Paula Lounder Director
UPMC Payer Provider Programs
Copyright © 2017 Health Catalyst 8
UPMC has identified $42 million in net savings opportunities for the upcoming 2017 fiscal year representing changes in physician patterns of usage for supplies and implants, reductions in care variation and productivity improvements. The majority of these opportunities are resulting from increased physician engagement through targeted service line development and the use of activity-based costing data necessary to measure the opportunities.
Transparency in recognizing contribution margin variation for specific procedures
UPMC’s ability to show cost and outcomes variation by specific procedures (sub-service lines) is causing practitioners to more rapidly adopt the use of the processes that demonstrate the best outcomes at the lowest cost.
Up to 97 percent improvement in time to access information
With the efficiencies realized through new analytic capabilities, orthopedics saved a full FTE by reducing the time to gather data for reports. Heart and Vascular can now obtain reports and information in a single hour instead of in the full week it used to take.
WHAT’S NEXT?
UPMC’s initial success with identifying budget savings associated with targeted service lines will place even more emphasis on holding these service lines accountable to delivering the budgeted cost reduction. In addition, service line expansion and increased collaboration between service lines and the functional areas within the hospital structure will lead to incremental opportunities. The health system will also expand its data warehouse and analytics platform to further simplify the integration of quality outcomes and cost data.
REFERENCES
1. Herman, B. (2014). 9 Drivers of High Healthcare Costs in the U.S. Becker’sHospital CFO. Retrieved from http://www.beckershospitalreview.com/finance/9-drivers-of-high-healthcare-costs-in-the-u-s.html
2. The World Bank, Data. (2016). Health expenditure per capita (current US$).Retrieved from http://data.worldbank.org/indicator/SH.XPD.PCAP
3. Kaplan, R. S., & Porter, M. E. (2011). The Big Idea: How to Solve the CostCrisis in Health Care. Harvard Business Review. Retrieved from https://hbr.org/2011/09/how-to-solve-the-cost-crisis-in-health-care#
Copyright © 2017 Health Catalyst
4. Umansky, B. (2016). The system approach to service line management:A guide to organizing service line structures to derive value from systems.Health Care Advisory Board. Retrieved from https://www.advisory.com/research/health-care-advisory-board/white-papers/2016/the-system-approach-to-service-line-management
RELATIONSHIP BETWEEN UPMC AND HEALTH CATALYST®
In January 2016, UPMC and Health Catalyst announced an agreement in which Health Catalyst licensed for commercial use an activity-based cost management system developed by UPMC as part of its effort to advance patient care while lowering costs. On February 29, 2016, Health Catalyst announced the close of a Series E capital raise that was co-led by UPMC, which is also a Health Catalyst customer.
ABOUT HEALTH CATALYST
Health Catalyst is a mission-driven data warehousing, analytics, and outcomes improvement company that helps healthcare organizations of all sizes perform the clinical, financial, and operational reporting and analysis needed for population health and accountable care. Our proven enterprise data warehouse (EDW) and analytics platform helps improve quality, add efficiency and lower costs in support of more than 50 million patients for organizations ranging from the largest US health system to forward-thinking physician practices.
For more information, visit www.healthcatalyst.com, and follow us on Twitter, LinkedIn, and Facebook.