servo-controlled pneumatic pressure oscillator for ... pdfs/fulltext14.pdfservo-controlled pneumatic...
TRANSCRIPT
P1: JLS
Annals of Biomedical Engineering [AMBE] pp1151-ambe-483463 March 9, 2004 8:39 Style file version 14 Oct, 2003
Annals of Biomedical Engineering, Vol. 32, No. 4, April 2004 (©2004) pp. 596–608
Servo-Controlled Pneumatic Pressure Oscillator for RespiratoryImpedance Measurements and High-Frequency Ventilation
DAVID W. KACZKA1 and KENNETH R. LUTCHEN2
1Department of Anesthesiology and Critical Care Medicine, Johns Hopkins University School of Medicine, Baltimore, MD; and2Department of Biomedical Engineering, Boston University College of Engineering, Boston, MA
(Received 3 November 2002; accepted 17 November 2003)
Abstract—The ability to provide forced oscillatory excitation ofthe respiratory system can be useful in mechanical impedancemeasurements as well as high frequency ventilation (HFV). Ex-perimental systems currently used for generating forced oscilla-tions are limited in their ability to provide high amplitude flows ormaintain the respiratory system at a constant mean pressure duringexcitation. This paper presents the design and implementation ofa pneumatic pressure oscillator based on a proportional solenoidvalve. The device is capable of providing forced oscillatory ex-citations to the respiratory system over a bandwidth suitable formechanical impedance measurements and HVF. It delivers highamplitude flows (>1.4 l/s) and utilizes a servo-control mechanismto maintain a load at a fixed mean pressure during simultaneousoscillation. Under open-loop conditions, the device exhibited astatic hysteresis of approximately 7%, while its dynamic magni-tude and phase responses were flat out to 10 Hz. Broad-band mea-surement of total harmonic distortion was approximately 19%.Under closed-loop conditions, the oscillator was able to maintaina mechanical test load at both positive and negative mean pressuresduring oscillatory excitations from 0.1 to 10.0 Hz. Impedance ofthe test load agreed closely with theoretical predictions. We con-clude that this servo-controlled oscillator can be a useful tool forrespiratory impedance measurements as well as HFV.
Keywords—Proportional solenoid valve, Closed-loop pressurecontrol, Forced oscillations, Harmonic distortion.
INTRODUCTION
The measurement of respiratory input impedance, thecomplex ratio of transrespiratory (or transpulmonary) pres-sure to flow at the airway opening as a function of frequency,is becoming an increasingly popular method for assessingthe dynamic mechanical status of the lungs. When measuredover low frequencies (0.1–10 Hz), respiratory impedancecan be a sensitive indicator of serial and parallel airwayheterogeneity,19 provides insight into the locus of airwayconstriction,18 and may be useful in partitioning the me-chanical properties of airways and lung tissues.15
Address correspondence to David W. Kaczka, MD, PhD, Departmentof Anesthesiology and Critical Care Medicine, Johns Hopkins UniversitySchool of Medicine, Blalock 1412, 600 North Wolfe Street, Baltimore,MD 21287. Electronic mail: [email protected]
Several approaches have been developed to measure lowfrequency respiratory impedance in humans and large ani-mals. The most common is to excite the respiratory sys-tem with small amplitude pseudorandom noise using aloud-speaker.9 While straightforward, this technique hasseveral technical and clinical drawbacks. It requires high-performance subwoofer speakers relatively free of har-monic distortion. Moreover, only nonphysiologic flows canbe generated (typically less than 0.2 l/s) that are oftenload-dependent unless a closed-loop design is employed.3,5
Finally, this approach requires considerable subject coop-eration. Awake subjects require training to achieve the nec-essary prolonged periods of apnea and respiratory musclerelaxation,9 which makes the method impractical for routineuse in patients with impaired lung function. In anesthetizedand paralyzed patients, this technique usually requires tem-porary interruption of artificial ventilatory support.23
More recent studies have incorporated high amplitudebroad-band flow forcings into waveforms that mimic phys-iological breathing maneuvers.12,13,15,20 Specifically, Opti-mal Ventilator Waveforms (OVWs)20 and Enhanced Ven-tilator Waveforms (EVWs)14 concentrate flow spectralenergy at specific frequencies to minimize nonlinear har-monic distortion in the resulting pressure waveforms. Thephases of these waveforms are optimized to achieve tidalvolume excursions sufficient for gas exchange, and thusare more clinically appropriate for awake and anesthetizedpatients.12,13,15 Presently, these waveforms must be gener-ated by piston–cylinder arrangements actuated by servo-controlled linear motors, allowing for delivery of highamplitude and load-independent oscillatory flows.15,20,27,28
Despite the ability of such systems to produce high fidelityflow waveforms,15,27 they can be extremely inefficient dueto mechanical friction and stick-slip effects between the pis-ton and cylinder.1 Moreover, their use in humans or largeanimals require high-powered electrical driving amplifiers,capable of dissipating over 200 W.28
Regardless of the method employed to acquire respira-tory impedance data, a more vexing problem is the abil-ity of either approach to make oscillatory measurements
0090-6964/04/0400-0596/1C© 2004 Biomedical Engineering Society
596
P1: JLS
Annals of Biomedical Engineering [AMBE] pp1151-ambe-483463 March 9, 2004 8:39 Style file version 14 Oct, 2003
Servo-Controlled Pneumatic Pressure Oscillator 597
while the lungs are maintained at a specified mean vol-ume or pressure. Since lung volume can significantly im-pact respiratory impedance,22 the ability to provide forcedoscillations at different lung volumes or mean airway pres-sures is useful in understanding the impact of PEEP, pe-riodic sighs, and recruitment/derecruitment manuevers ondynamic lung mechanics. Previous forced oscillation stud-ies have relied on the manual adjustment of small biasflows into the breathing circuit to compensate for leaksand to maintain specified lung volumes during oscillatoryexcitations.2,13,15 While several investigators have devel-oped closed-loop systems to maintain mean airway pres-sure during forced oscillations,3,5,7,28,29 they must rely onseparate servo-controlled systems operating in parallel toan oscillatory pressure or flow generator.
In addition to the diagnostic information that forced os-cillations provide, such excitations can be therapeutic aswell. High frequency ventilation (HFV) is becoming a stan-dard of care in neonatal lung injury, and there has beenrenewed interest in using this ventilatory modality in thetreatment of pediatric and adult lung injury as well.16 Incontrast to conventional mechanical ventilation, HFV main-tains gas exchange using small tidal volumes (often lessthan anatomic dead space) delivered at supraphysiologicrates (i.e., 5–15 Hz). However, the use of HFV in clinicalenvironments requires fine control over both the mean levelof airway pressure as well as the amplitude of peak-to-peakpressure oscillations.
Given the limitations of devices currently available forgenerating forced oscillations in humans and large animals,our goal was to design and implement an oscillator capa-ble of delivering physiological flows and tidal volumes overa frequency range sufficient for impedance measurementsand HFV. The specific design goals of this prototype de-vice were: 1) the capability for high amplitude flow de-livery (>1.4 l/s) with a dynamic response suitable for lowfrequency respiratory impedance measurements as well asHFV; 2) utilization of a servo-control mechanism to main-tain the respiratory system at a specified mean pressureduring oscillatory excitation; and 3) the minimization ofelectrical power consumption compared to traditional lin-ear motor driven devices used for the same purposes. In ad-dition, we investigated the static and dynamic performanceand linearity of the device over a bandwidth appropriatefor respiratory impedance measurements as well as HFV.The ability of the device to maintain a mechanical test loadat a specified mean pressure during oscillatory excitationwas assessed under closed-loop conditions. Finally the de-vice was used to measure the impedance of a test load, theresults of which were compared to theoretical predictions.
OVERVIEW OF PNEUMATIC PRESSUREOSCILLATOR
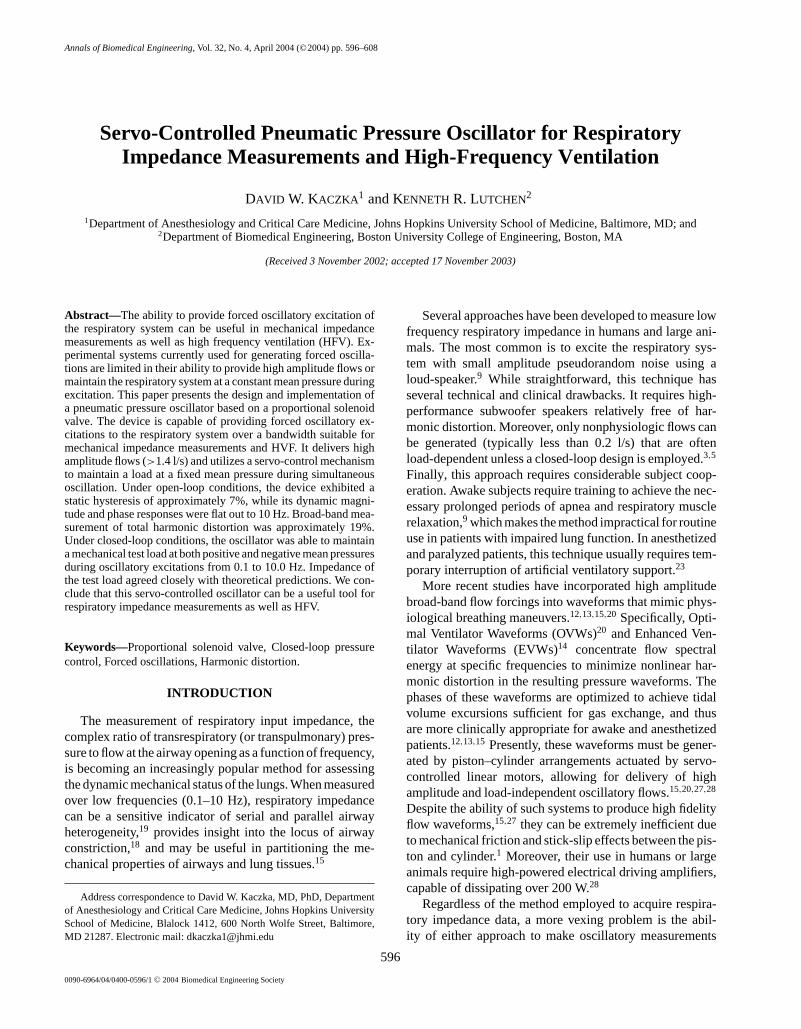
The pneumatic pressure oscillator is schematically de-picted in Fig. 1. The key component of this system is its pro-
portional solenoid (PSOL) valve (ASCO PosiflowTM ModelSD8202G4V, Florham Park, NJ). This valve has a maximumorifice diameter of 5/32′′, and is capable of delivering up to∼3.0 l/s for a 10 PSI pressure drop. Flow through the valveis determined by the position of its spring-loaded core. Anelectric current applied to the solenoid coil generates anelectromagnetic pullforce on the core. When this pullforceexceeds the opposing spring force, the core moves upwardand opens the valve. The degree to which the valve opensis thus proportional to the current applied to the coil. Ac-curate positioning of the core is provided by ASCO’s Elec-tronic Control Unit (ECU) Model 8908001, which convertsa 0–10 V control signal to a 24 V pulse-width modulatedcoil-excitation signal. The average current through the coiland the amplitude of the current variations is dependent onthe switching frequency of the pulse-width modulator (fac-tory configured to 300 Hz). The ECU provides additionalcontrol of the current to compensate for any temperature-dependent changes in coil resistance. The combined ECU-PSOL system is powered electrically by a single 24 VDClinear power supply (Power-One HC24-2.4-A, Camarillo,CA), and consumes less than 23 W of electrical power.
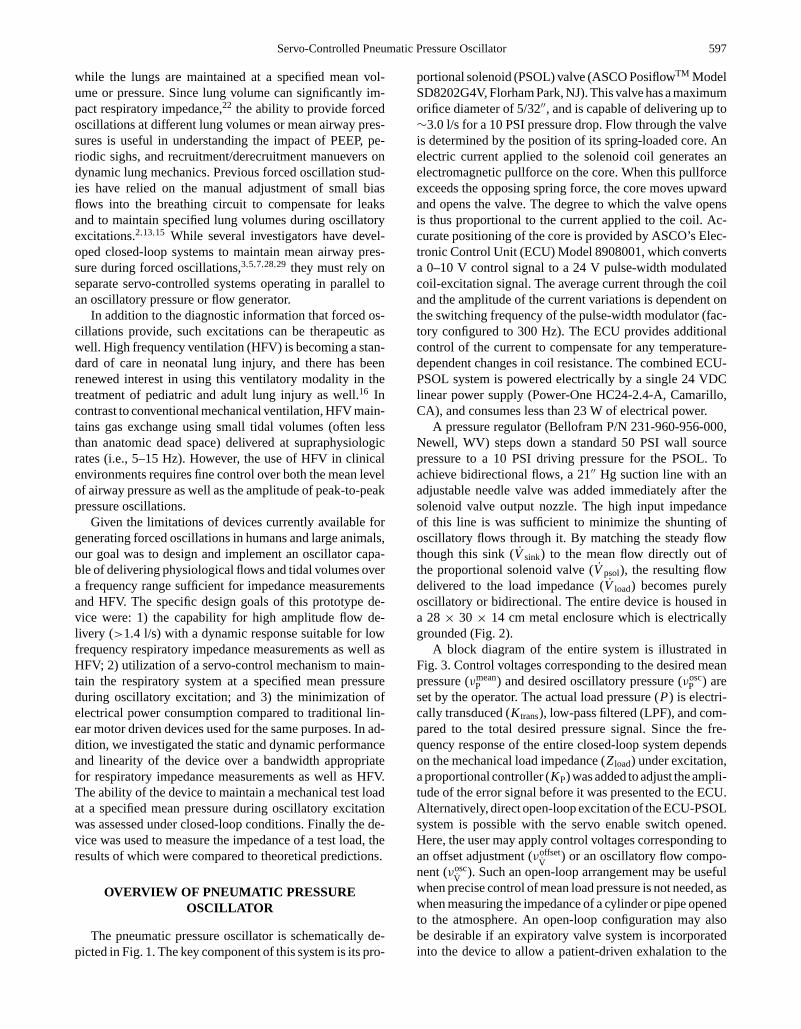
A pressure regulator (Bellofram P/N 231-960-956-000,Newell, WV) steps down a standard 50 PSI wall sourcepressure to a 10 PSI driving pressure for the PSOL. Toachieve bidirectional flows, a 21′′ Hg suction line with anadjustable needle valve was added immediately after thesolenoid valve output nozzle. The high input impedanceof this line is was sufficient to minimize the shunting ofoscillatory flows through it. By matching the steady flowthough this sink (̇Vsink) to the mean flow directly out ofthe proportional solenoid valve (V̇psol), the resulting flowdelivered to the load impedance (V̇ load) becomes purelyoscillatory or bidirectional. The entire device is housed ina 28× 30× 14 cm metal enclosure which is electricallygrounded (Fig. 2).
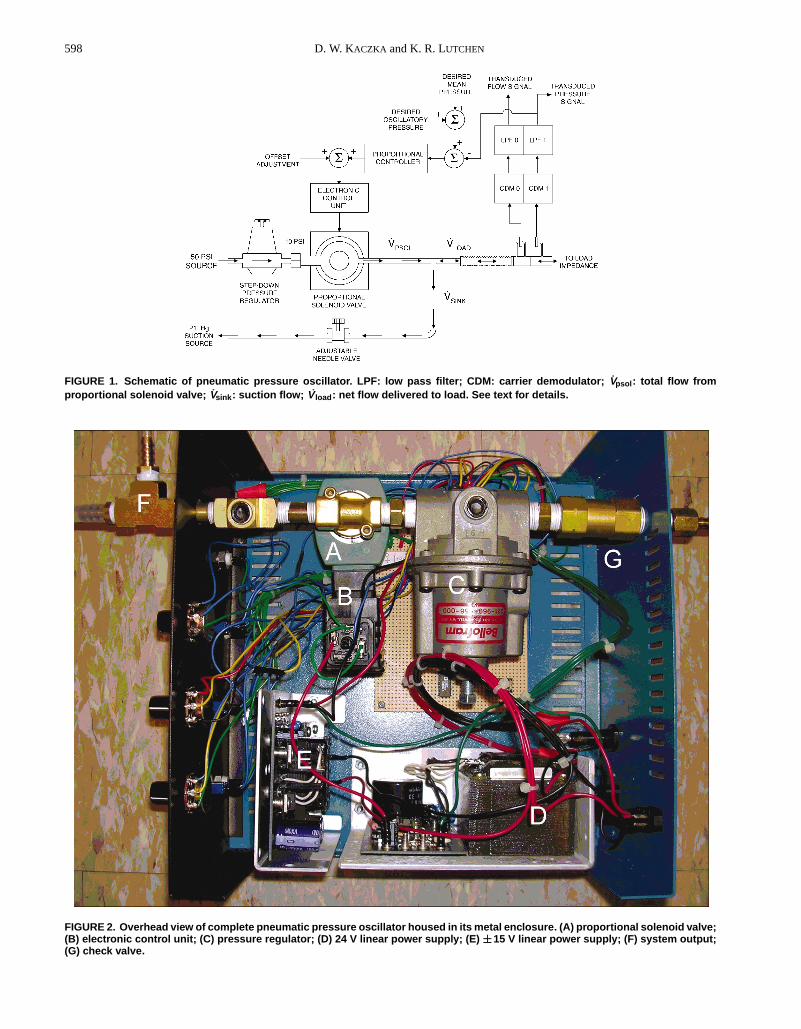
A block diagram of the entire system is illustrated inFig. 3. Control voltages corresponding to the desired meanpressure (νmean
P ) and desired oscillatory pressure (νoscP ) are
set by the operator. The actual load pressure (P) is electri-cally transduced (Ktrans), low-pass filtered (LPF), and com-pared to the total desired pressure signal. Since the fre-quency response of the entire closed-loop system dependson the mechanical load impedance (Zload) under excitation,a proportional controller (KP) was added to adjust the ampli-tude of the error signal before it was presented to the ECU.Alternatively, direct open-loop excitation of the ECU-PSOLsystem is possible with the servo enable switch opened.Here, the user may apply control voltages corresponding toan offset adjustment (νoffset
V̇) or an oscillatory flow compo-
nent (νoscV̇
). Such an open-loop arrangement may be usefulwhen precise control of mean load pressure is not needed, aswhen measuring the impedance of a cylinder or pipe openedto the atmosphere. An open-loop configuration may alsobe desirable if an expiratory valve system is incorporatedinto the device to allow a patient-driven exhalation to the
P1: JLS
Annals of Biomedical Engineering [AMBE] pp1151-ambe-483463 March 9, 2004 8:39 Style file version 14 Oct, 2003
598 D. W. KACZKA and K. R. LUTCHEN
FIGURE 1. Schematic of pneumatic pressure oscillator. LPF: low pass filter; CDM: carrier demodulator; V̇psol : total flow fromproportional solenoid valve; V̇sink : suction flow; V̇ load : net flow delivered to load. See text for details.
FIGURE 2. Overhead view of complete pneumatic pressure oscillator housed in its metal enclosure. (A) proportional solenoid valve;(B) electronic control unit; (C) pressure regulator; (D) 24 V linear power supply; (E) ±±15 V linear power supply; (F) system output;(G) check valve.
P1: JLS
Annals of Biomedical Engineering [AMBE] pp1151-ambe-483463 March 9, 2004 8:39 Style file version 14 Oct, 2003
Servo-Controlled Pneumatic Pressure Oscillator 599
FIGURE 3. Block diagram of pneumatic pressure oscillator. vmeanP : control voltage for desired mean pressure; νosc
P : control voltagefor desired oscillatory pressure; νoffset
V̇: control voltage for offset flow adjustment; νosc
V̇: control voltage for oscillatory flow; KP:
proportional controller gain; ECU: electronic control unit; PSOL: proportional solenoid valve; V̇psol : total flow from proportionalsolenoid valve; V̇sink : suction flow; V̇ load : net flow delivered to load; Zload : load impedance; P: load pressure; Ktrans : pressuretransducer gain; LPF: low pass filter.
atmosphere or against PEEP.14 In this situation, direct exci-tation of the PSOL occurs during inspiration. Mean airwaypressure will not be servo-controlled and will instead be afunction of both peak and end-expiratory pressures as wellas breathing frequency.
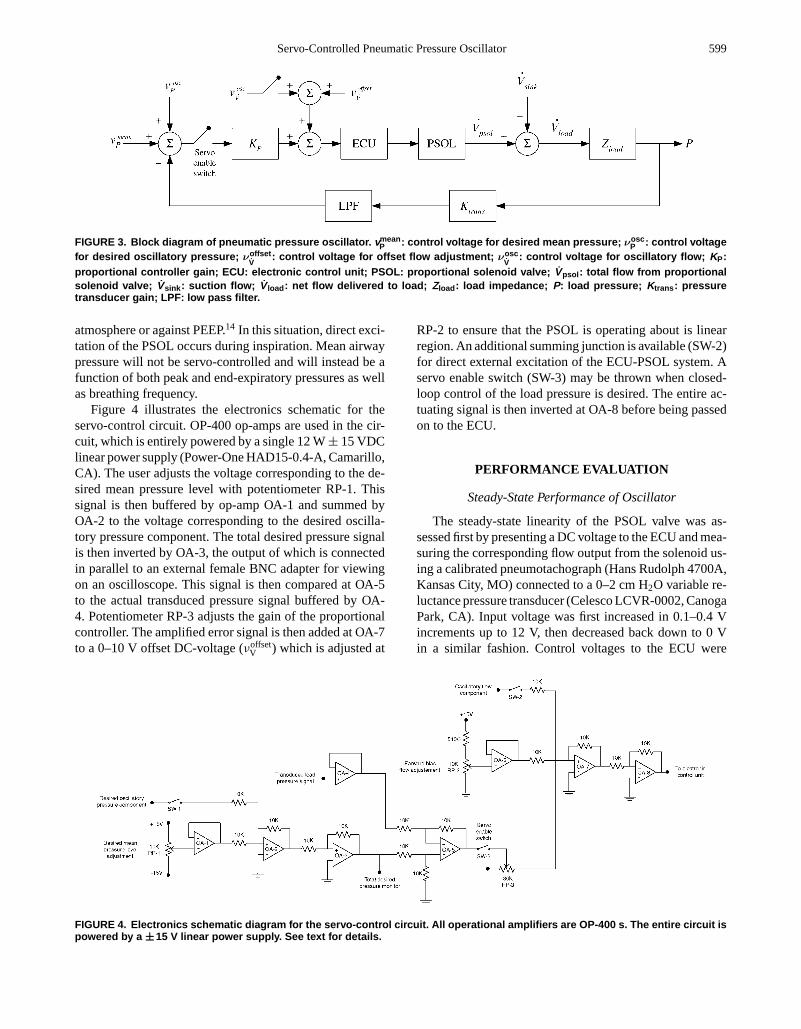
Figure 4 illustrates the electronics schematic for theservo-control circuit. OP-400 op-amps are used in the cir-cuit, which is entirely powered by a single 12 W± 15 VDClinear power supply (Power-One HAD15-0.4-A, Camarillo,CA). The user adjusts the voltage corresponding to the de-sired mean pressure level with potentiometer RP-1. Thissignal is then buffered by op-amp OA-1 and summed byOA-2 to the voltage corresponding to the desired oscilla-tory pressure component. The total desired pressure signalis then inverted by OA-3, the output of which is connectedin parallel to an external female BNC adapter for viewingon an oscilloscope. This signal is then compared at OA-5to the actual transduced pressure signal buffered by OA-4. Potentiometer RP-3 adjusts the gain of the proportionalcontroller. The amplified error signal is then added at OA-7to a 0–10 V offset DC-voltage (νoffset
V ) which is adjusted at
RP-2 to ensure that the PSOL is operating about is linearregion. An additional summing junction is available (SW-2)for direct external excitation of the ECU-PSOL system. Aservo enable switch (SW-3) may be thrown when closed-loop control of the load pressure is desired. The entire ac-tuating signal is then inverted at OA-8 before being passedon to the ECU.
PERFORMANCE EVALUATION
Steady-State Performance of Oscillator
The steady-state linearity of the PSOL valve was as-sessed first by presenting a DC voltage to the ECU and mea-suring the corresponding flow output from the solenoid us-ing a calibrated pneumotachograph (Hans Rudolph 4700A,Kansas City, MO) connected to a 0–2 cm H2O variable re-luctance pressure transducer (Celesco LCVR-0002, CanogaPark, CA). Input voltage was first increased in 0.1–0.4 Vincrements up to 12 V, then decreased back down to 0 Vin a similar fashion. Control voltages to the ECU were
FIGURE 4. Electronics schematic diagram for the servo-control circuit. All operational amplifiers are OP-400 s. The entire circuit ispowered by a ±±15 V linear power supply. See text for details.
P1: JLS
Annals of Biomedical Engineering [AMBE] pp1151-ambe-483463 March 9, 2004 8:39 Style file version 14 Oct, 2003
600 D. W. KACZKA and K. R. LUTCHEN
measured by a digital multimeter (Tektronix DM511,Heerveen, The Netherlands). Hysteresis of the combinedECU-PSOL system was determined as the maximum dif-ference in flow over this single calibration cycle expressedas a percent of the full-scale flow.
Dynamic Performance of Oscillator—Open Loop
To evaluate the load-free performance of the PSOL valvein terms of the quality of its generated flow waveforms, wedetermined its open-loop dynamic response using a pseu-dorandom signal consisting of 15 sinusoids with equivalentamplitudes and random phases. The frequency componentswere chosen to obey the non-sum non-difference (NSND)criteria of Suki and Lutchen (30) such that the impact ofharmonic distortion and cross-talk in the system outputwould be minimized. A 2048 point NSND waveform withenergy concentrated between 0.098 and 40.97 Hz was gen-erated with a digital-to-analog converter (Data TranslationsDT2811, Marlboro, MA) at a shift frequency of 100 Hz. Theoutput of the D/A converter was low pass filtered at 50 Hz (8-pole Butterworth, Ithaco) and electronically summed with a5-V DC component (at OA-6 in Fig. 4) to ensure operationof the PSOL about its mid-range to minimize the effects ofsaturation nonlinearities (see Fig. 5 in Results section). Theoutput nozzle of the PSOL was opened to atmosphere, andflow was measured using the same pneumotach arrange-ment described above. Both the input voltage and outputflow signals were low pass filtered at 50 Hz, sampled at100 Hz with an analog-to-digital converter (Data Transla-tions DT-2811). The amplitude of the D/A output was ad-justed to achieve peak NSND voltages of 0.4, 0.8, 1.2, 1.6,and 2.0 V which were presented to the ECU in random or-der. The open-loop transfer function of the combined ECU-PSOL system was determined from the ratio of the crosspower spectrum of the input voltage and output flow to theautopower spectrum of voltage. After neglecting the firstthree transient NSND cycles, six 20.48-s rectangular win-dows with 83% overlap were used to calculate the transferfunction, which was expressed in polar coordinates. Mea-surements were made with and without the suction in-lineto determine the impact of suction on the dynamics andlinearity on the output flow.
To quantify dynamic nonlinear harmonic distortionand cross-talk of the open-loop system, we used an har-monic distortion index (kd) appropriate for broad-bandexcitations:32
kd = 100%×√
PNI
PTOT(1)
where PTOT is the total power in the signal (i.e., sum ofsquared magnitudes in the frequency-domain) andPNI isthe power at noninput (i.e., non-NSND) frequencies. Todetermine the impact of nonlinearities and noise present atnon-NSND frequencies in the analogue input driving signal,
we calculatedkd for both the input voltage and output flowwaveforms.
Dynamic Performance of Oscillator—Closed Loop
The closed-loop performance of the system was assessedusing a simulated mechanical load impedance consistingof a screen-mesh resistor in series with a 20 l glass bot-tle packed with copper wool to minimize the temperaturechanges associated with cyclic gas compression. The re-sistive load (Rload) of the screen-mesh was experimentallydetermined to be approximately 4 cm H2O/l/s. The elasticload (Eload) provided by the bottle was determined fromBoyle’s Law:
Eload= β P0
V0(2)
whereP0 represents the absolute mean bottle pressure (ap-proximately 1033 cm H2O for 1 atm),V0 represents thecompressible volume of the chamber (20 l in our case), andβ is a constant equal to 1.0 for isothermal compression and1.4 for adiabatic compression.25,27 Assuming a mean bottlepressure of zero relative to atmosphere, we computed thetheoretical elastic loads of the bottle as 51.68 and 72.35 cmH2O/l for isothermal and adiabatic compression, respec-tively. The input driving signal to the system was identicalto the NSND waveform described above.
Peak oscillatory NSND control voltage amplitudes wereadjusted to 1, 2, 3, 4, and 5 V and applied in random order.The mean load pressure was maintained at 0 cm H2O. A0–50 cm H2O pressure transducer (Celesco LCVR-0050)was located proximal to the screen resistor for measure-ment and feedback of the load pressure. The proportionalcontroller gainKP was set to approximately 0.3 by adjustingthe RP-3 potentiometer of Fig. 4. Both the desired and actualpressure signals were sampled and processed as describedpreviously. The closed-loop transfer function of the systemwas computed using the cross-power spectral method withthe actual load pressure as the system output. Thekd indiceswere also computed for the input control voltage and outputload pressure.
Dynamic Performance of Oscillator—MeanPressure Control
The ability of the closed-loop system to maintain a loadat a given desired mean pressure during simultaneous oscil-latory excitations was assessed by driving the system with0.1, 1.0, and 10.0 Hz sine waves while maintaining the meanpressure level of the resistor-bottle load at –10, 0, and 10 cmH2O. The different mean pressure levels were achieved bymanually adjusting the RP-1 potentiometer of Fig. 4. Sinewaves were generated by the D/A board at shift frequencyof 100 Hz and low-pass filtered at 50 Hz. The correspond-ing load pressure was also low-pass filtered at 50 Hz andsampled at 100 Hz by the A/D board. To test the ability
P1: JLS
Annals of Biomedical Engineering [AMBE] pp1151-ambe-483463 March 9, 2004 8:39 Style file version 14 Oct, 2003
Servo-Controlled Pneumatic Pressure Oscillator 601
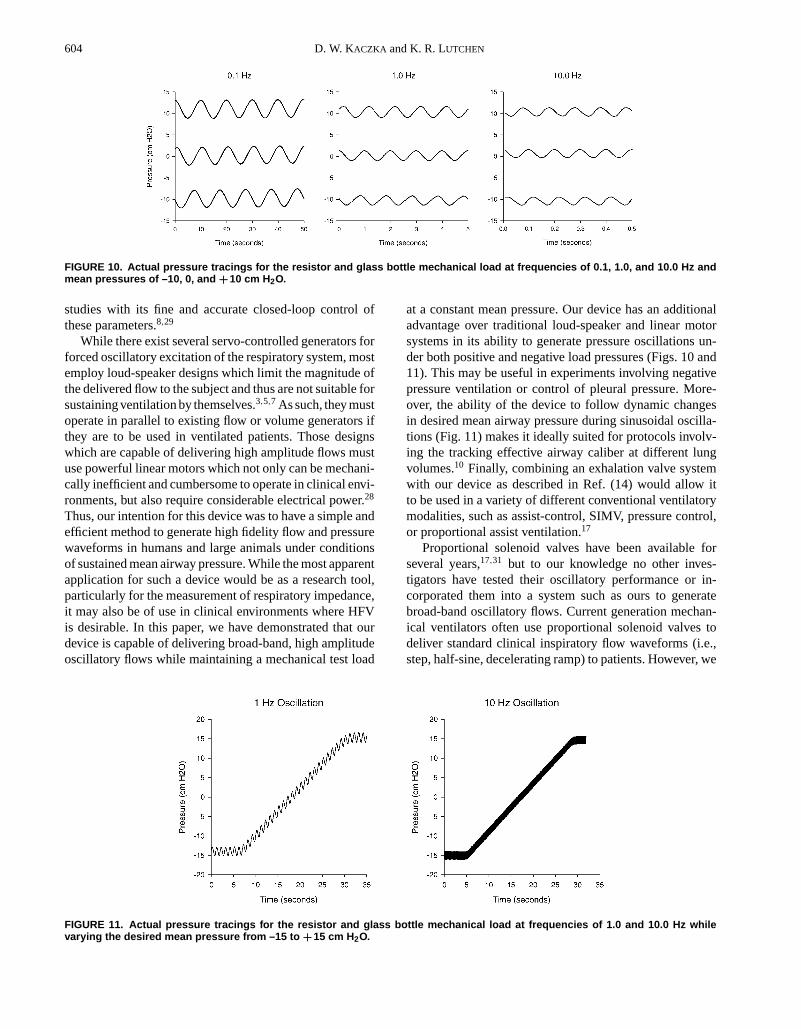
of the system to follow dynamic changes in desired meanpressure, we linearly increased the desired mean bottle pres-sure from−15 cm H2O to+15 cm H2O over a period of 27 swhile simultaneously oscillating the load at frequencies of1.0 and 10.0 Hz.
Impedance Measurements
Mechanical impedance of the test load was measuredusing the same 2048 point NSND waveform as the inputdriving pressure signal to the system with mean load pres-sures adjusted to−10, 0, and+10 cm H2O. The deliveredflow and load pressure were transduced as detailed earlier,although both signals were low pass filtered at 10 Hz priorto sampling.Zload was determined from the ratio of thecross-power spectrum of the load pressure and flow to theautopower spectrum of flow, again using a 20.48 s rectan-gular window with 83% overlap. Load resistance (Rload)and elastance (Eload) at each specified NSND frequency( fk) were computed from the real (Re) and imaginary (Im)components ofZload:
Rload( fk) = Re{Zload( fk)} (3)
Eload( fk) = −2π fkIm {Zload( fk)} (4)
RESULTS
Steady-State Performance of Proportional Solenoid
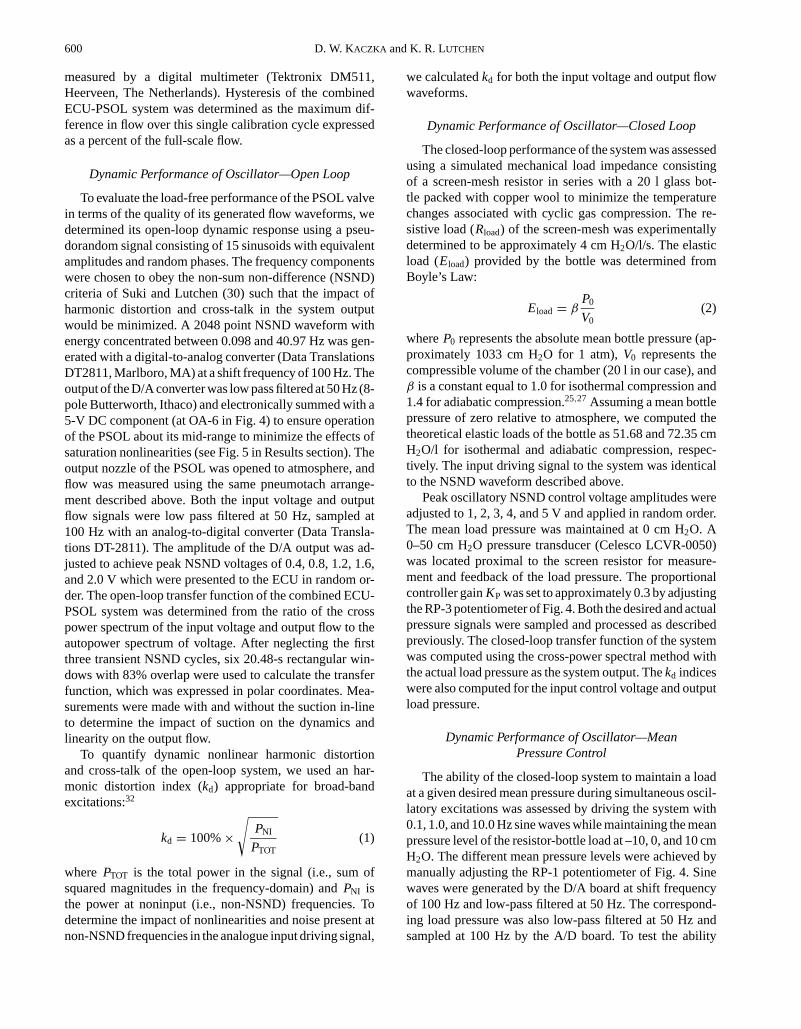
The steady-state voltage–flow curves for both increas-ing and decreasing control voltages are shown in Fig. 5.Both limbs were sigmoidal in nature, but were fairly linearover the 3–8 V range, corresponding to minimum and maxi-
mum flows of approximately 0.2 to 2.5 l/s, respectively. ThePSOL valve exhibited approximately 7% hysteresis over thefull range of flows from 0 to 2.85 l/s.
Dynamic Performance of PSOL—Open Loop
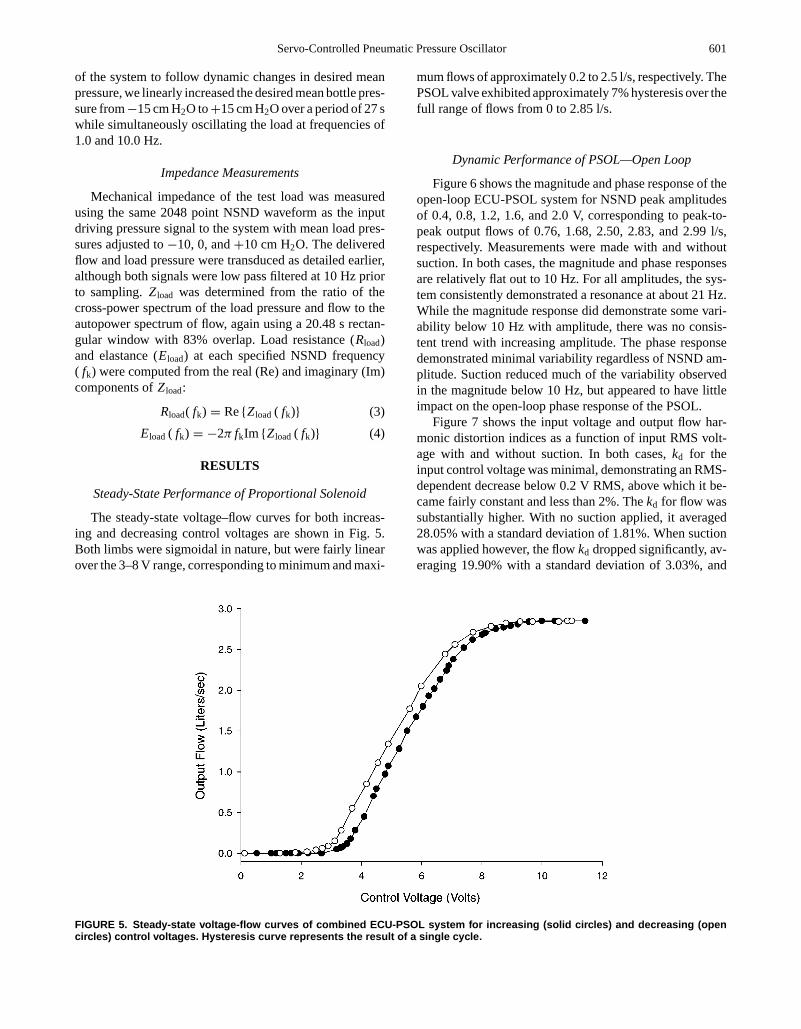
Figure 6 shows the magnitude and phase response of theopen-loop ECU-PSOL system for NSND peak amplitudesof 0.4, 0.8, 1.2, 1.6, and 2.0 V, corresponding to peak-to-peak output flows of 0.76, 1.68, 2.50, 2.83, and 2.99 l/s,respectively. Measurements were made with and withoutsuction. In both cases, the magnitude and phase responsesare relatively flat out to 10 Hz. For all amplitudes, the sys-tem consistently demonstrated a resonance at about 21 Hz.While the magnitude response did demonstrate some vari-ability below 10 Hz with amplitude, there was no consis-tent trend with increasing amplitude. The phase responsedemonstrated minimal variability regardless of NSND am-plitude. Suction reduced much of the variability observedin the magnitude below 10 Hz, but appeared to have littleimpact on the open-loop phase response of the PSOL.
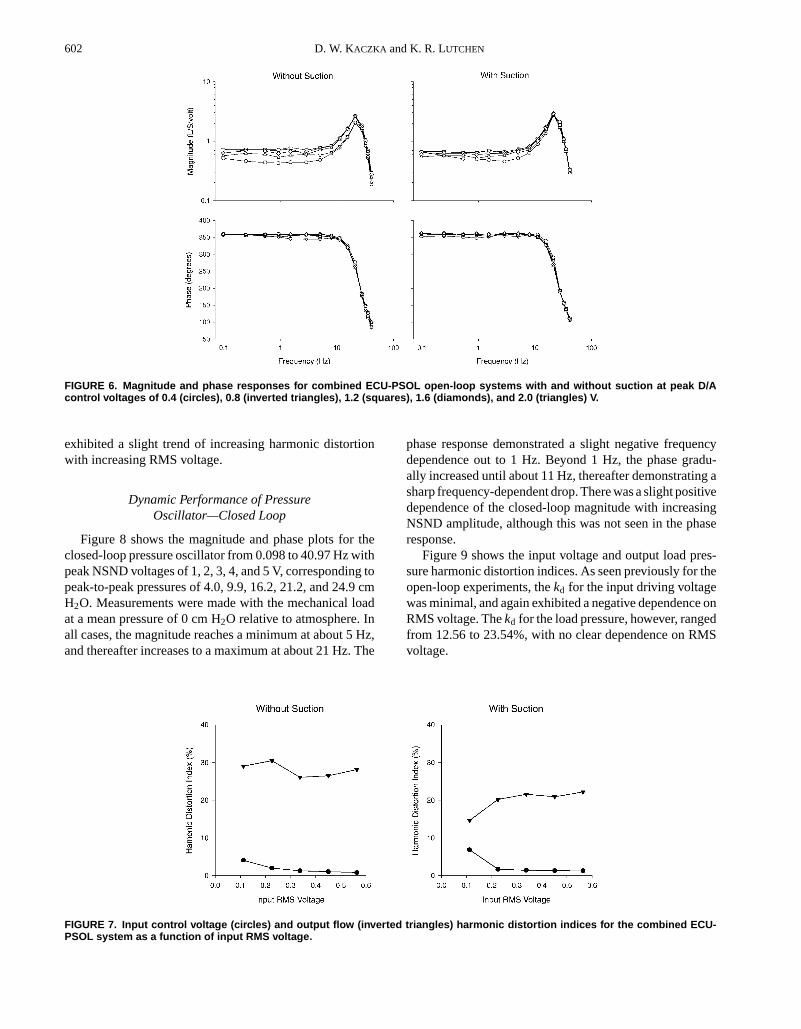
Figure 7 shows the input voltage and output flow har-monic distortion indices as a function of input RMS volt-age with and without suction. In both cases,kd for theinput control voltage was minimal, demonstrating an RMS-dependent decrease below 0.2 V RMS, above which it be-came fairly constant and less than 2%. Thekd for flow wassubstantially higher. With no suction applied, it averaged28.05% with a standard deviation of 1.81%. When suctionwas applied however, the flowkd dropped significantly, av-eraging 19.90% with a standard deviation of 3.03%, and
FIGURE 5. Steady-state voltage-flow curves of combined ECU-PSOL system for increasing (solid circles) and decreasing (opencircles) control voltages. Hysteresis curve represents the result of a single cycle.
P1: JLS
Annals of Biomedical Engineering [AMBE] pp1151-ambe-483463 March 9, 2004 8:39 Style file version 14 Oct, 2003
602 D. W. KACZKA and K. R. LUTCHEN
FIGURE 6. Magnitude and phase responses for combined ECU-PSOL open-loop systems with and without suction at peak D/Acontrol voltages of 0.4 (circles), 0.8 (inverted triangles), 1.2 (squares), 1.6 (diamonds), and 2.0 (triangles) V.
exhibited a slight trend of increasing harmonic distortionwith increasing RMS voltage.
Dynamic Performance of PressureOscillator—Closed Loop
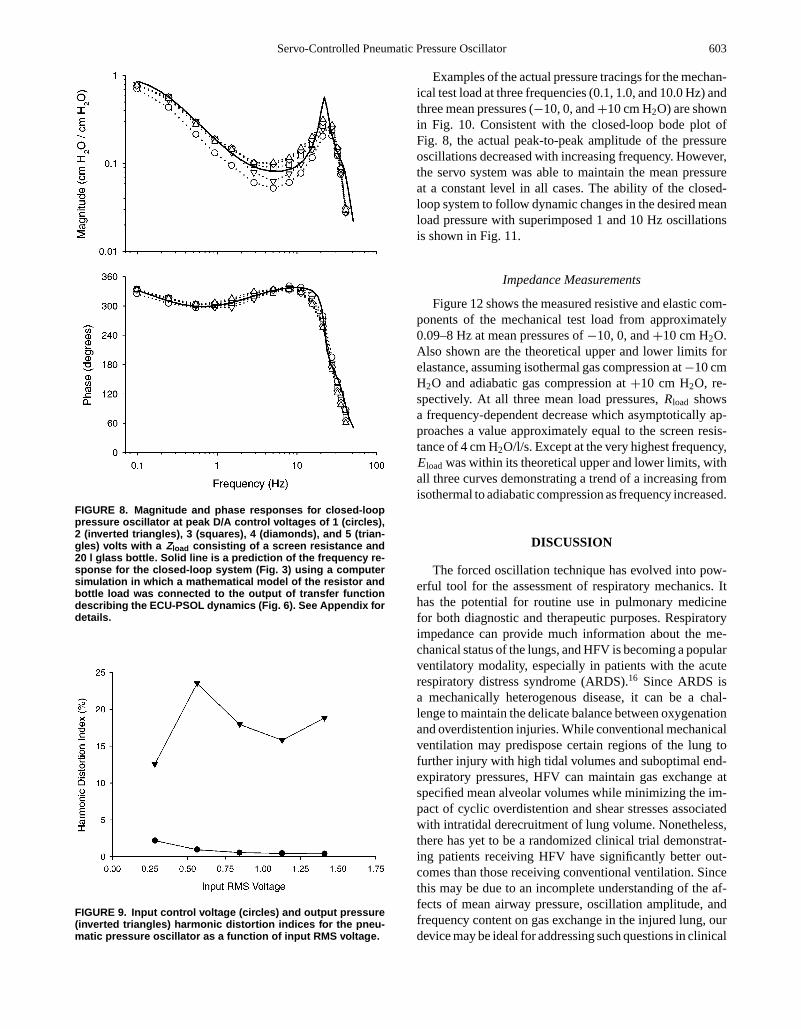
Figure 8 shows the magnitude and phase plots for theclosed-loop pressure oscillator from 0.098 to 40.97 Hz withpeak NSND voltages of 1, 2, 3, 4, and 5 V, corresponding topeak-to-peak pressures of 4.0, 9.9, 16.2, 21.2, and 24.9 cmH2O. Measurements were made with the mechanical loadat a mean pressure of 0 cm H2O relative to atmosphere. Inall cases, the magnitude reaches a minimum at about 5 Hz,and thereafter increases to a maximum at about 21 Hz. The
phase response demonstrated a slight negative frequencydependence out to 1 Hz. Beyond 1 Hz, the phase gradu-ally increased until about 11 Hz, thereafter demonstrating asharp frequency-dependent drop. There was a slight positivedependence of the closed-loop magnitude with increasingNSND amplitude, although this was not seen in the phaseresponse.
Figure 9 shows the input voltage and output load pres-sure harmonic distortion indices. As seen previously for theopen-loop experiments, thekd for the input driving voltagewas minimal, and again exhibited a negative dependence onRMS voltage. Thekd for the load pressure, however, rangedfrom 12.56 to 23.54%, with no clear dependence on RMSvoltage.
FIGURE 7. Input control voltage (circles) and output flow (inverted triangles) harmonic distortion indices for the combined ECU-PSOL system as a function of input RMS voltage.
P1: JLS
Annals of Biomedical Engineering [AMBE] pp1151-ambe-483463 March 9, 2004 8:39 Style file version 14 Oct, 2003
Servo-Controlled Pneumatic Pressure Oscillator 603
FIGURE 8. Magnitude and phase responses for closed-looppressure oscillator at peak D/A control voltages of 1 (circles),2 (inverted triangles), 3 (squares), 4 (diamonds), and 5 (trian-gles) volts with a Zload consisting of a screen resistance and20 l glass bottle. Solid line is a prediction of the frequency re-sponse for the closed-loop system (Fig. 3) using a computersimulation in which a mathematical model of the resistor andbottle load was connected to the output of transfer functiondescribing the ECU-PSOL dynamics (Fig. 6). See Appendix fordetails.
FIGURE 9. Input control voltage (circles) and output pressure(inverted triangles) harmonic distortion indices for the pneu-matic pressure oscillator as a function of input RMS voltage.
Examples of the actual pressure tracings for the mechan-ical test load at three frequencies (0.1, 1.0, and 10.0 Hz) andthree mean pressures (−10, 0, and+10 cm H2O) are shownin Fig. 10. Consistent with the closed-loop bode plot ofFig. 8, the actual peak-to-peak amplitude of the pressureoscillations decreased with increasing frequency. However,the servo system was able to maintain the mean pressureat a constant level in all cases. The ability of the closed-loop system to follow dynamic changes in the desired meanload pressure with superimposed 1 and 10 Hz oscillationsis shown in Fig. 11.
Impedance Measurements
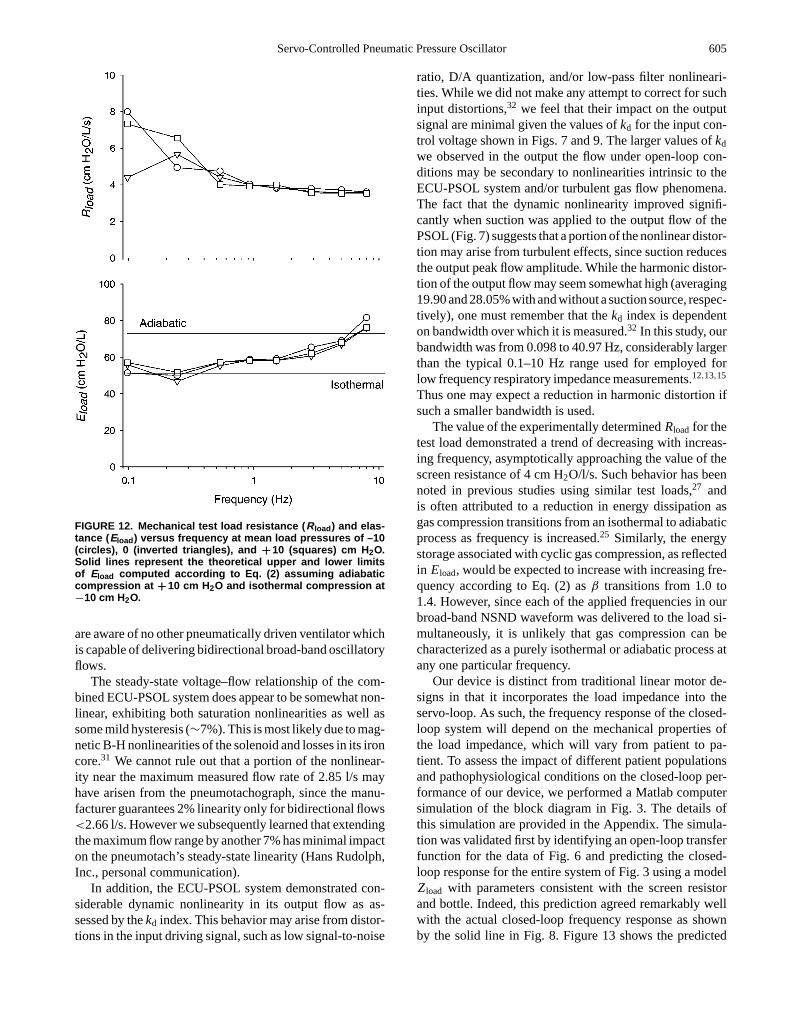
Figure 12 shows the measured resistive and elastic com-ponents of the mechanical test load from approximately0.09–8 Hz at mean pressures of−10, 0, and+10 cm H2O.Also shown are the theoretical upper and lower limits forelastance, assuming isothermal gas compression at−10 cmH2O and adiabatic gas compression at+10 cm H2O, re-spectively. At all three mean load pressures,Rload showsa frequency-dependent decrease which asymptotically ap-proaches a value approximately equal to the screen resis-tance of 4 cm H2O/l/s. Except at the very highest frequency,Eload was within its theoretical upper and lower limits, withall three curves demonstrating a trend of a increasing fromisothermal to adiabatic compression as frequency increased.
DISCUSSION
The forced oscillation technique has evolved into pow-erful tool for the assessment of respiratory mechanics. Ithas the potential for routine use in pulmonary medicinefor both diagnostic and therapeutic purposes. Respiratoryimpedance can provide much information about the me-chanical status of the lungs, and HFV is becoming a popularventilatory modality, especially in patients with the acuterespiratory distress syndrome (ARDS).16 Since ARDS isa mechanically heterogenous disease, it can be a chal-lenge to maintain the delicate balance between oxygenationand overdistention injuries. While conventional mechanicalventilation may predispose certain regions of the lung tofurther injury with high tidal volumes and suboptimal end-expiratory pressures, HFV can maintain gas exchange atspecified mean alveolar volumes while minimizing the im-pact of cyclic overdistention and shear stresses associatedwith intratidal derecruitment of lung volume. Nonetheless,there has yet to be a randomized clinical trial demonstrat-ing patients receiving HFV have significantly better out-comes than those receiving conventional ventilation. Sincethis may be due to an incomplete understanding of the af-fects of mean airway pressure, oscillation amplitude, andfrequency content on gas exchange in the injured lung, ourdevice may be ideal for addressing such questions in clinical
P1: JLS
Annals of Biomedical Engineering [AMBE] pp1151-ambe-483463 March 9, 2004 8:39 Style file version 14 Oct, 2003
604 D. W. KACZKA and K. R. LUTCHEN
FIGURE 10. Actual pressure tracings for the resistor and glass bottle mechanical load at frequencies of 0.1, 1.0, and 10.0 Hz andmean pressures of –10, 0, and ++10 cm H2O.
studies with its fine and accurate closed-loop control ofthese parameters.8,29
While there exist several servo-controlled generators forforced oscillatory excitation of the respiratory system, mostemploy loud-speaker designs which limit the magnitude ofthe delivered flow to the subject and thus are not suitable forsustaining ventilation by themselves.3,5,7 As such, they mustoperate in parallel to existing flow or volume generators ifthey are to be used in ventilated patients. Those designswhich are capable of delivering high amplitude flows mustuse powerful linear motors which not only can be mechani-cally inefficient and cumbersome to operate in clinical envi-ronments, but also require considerable electrical power.28
Thus, our intention for this device was to have a simple andefficient method to generate high fidelity flow and pressurewaveforms in humans and large animals under conditionsof sustained mean airway pressure. While the most apparentapplication for such a device would be as a research tool,particularly for the measurement of respiratory impedance,it may also be of use in clinical environments where HFVis desirable. In this paper, we have demonstrated that ourdevice is capable of delivering broad-band, high amplitudeoscillatory flows while maintaining a mechanical test load
at a constant mean pressure. Our device has an additionaladvantage over traditional loud-speaker and linear motorsystems in its ability to generate pressure oscillations un-der both positive and negative load pressures (Figs. 10 and11). This may be useful in experiments involving negativepressure ventilation or control of pleural pressure. More-over, the ability of the device to follow dynamic changesin desired mean airway pressure during sinusoidal oscilla-tions (Fig. 11) makes it ideally suited for protocols involv-ing the tracking effective airway caliber at different lungvolumes.10 Finally, combining an exhalation valve systemwith our device as described in Ref. (14) would allow itto be used in a variety of different conventional ventilatorymodalities, such as assist-control, SIMV, pressure control,or proportional assist ventilation.17
Proportional solenoid valves have been available forseveral years,17,31 but to our knowledge no other inves-tigators have tested their oscillatory performance or in-corporated them into a system such as ours to generatebroad-band oscillatory flows. Current generation mechan-ical ventilators often use proportional solenoid valves todeliver standard clinical inspiratory flow waveforms (i.e.,step, half-sine, decelerating ramp) to patients. However, we
FIGURE 11. Actual pressure tracings for the resistor and glass bottle mechanical load at frequencies of 1.0 and 10.0 Hz whilevarying the desired mean pressure from –15 to ++15 cm H2O.
P1: JLS
Annals of Biomedical Engineering [AMBE] pp1151-ambe-483463 March 9, 2004 8:39 Style file version 14 Oct, 2003
Servo-Controlled Pneumatic Pressure Oscillator 605
FIGURE 12. Mechanical test load resistance ( Rload ) and elas-tance ( Eload ) versus frequency at mean load pressures of –10(circles), 0 (inverted triangles), and ++10 (squares) cm H 2O.Solid lines represent the theoretical upper and lower limitsof Eload computed according to Eq. (2) assuming adiabaticcompression at ++10 cm H2O and isothermal compression at−10 cm H2O.
are aware of no other pneumatically driven ventilator whichis capable of delivering bidirectional broad-band oscillatoryflows.
The steady-state voltage–flow relationship of the com-bined ECU-PSOL system does appear to be somewhat non-linear, exhibiting both saturation nonlinearities as well assome mild hysteresis (∼7%). This is most likely due to mag-netic B-H nonlinearities of the solenoid and losses in its ironcore.31 We cannot rule out that a portion of the nonlinear-ity near the maximum measured flow rate of 2.85 l/s mayhave arisen from the pneumotachograph, since the manu-facturer guarantees 2% linearity only for bidirectional flows<2.66 l/s. However we subsequently learned that extendingthe maximum flow range by another 7% has minimal impacton the pneumotach’s steady-state linearity (Hans Rudolph,Inc., personal communication).
In addition, the ECU-PSOL system demonstrated con-siderable dynamic nonlinearity in its output flow as as-sessed by thekd index. This behavior may arise from distor-tions in the input driving signal, such as low signal-to-noise
ratio, D/A quantization, and/or low-pass filter nonlineari-ties. While we did not make any attempt to correct for suchinput distortions,32 we feel that their impact on the outputsignal are minimal given the values ofkd for the input con-trol voltage shown in Figs. 7 and 9. The larger values ofkd
we observed in the output the flow under open-loop con-ditions may be secondary to nonlinearities intrinsic to theECU-PSOL system and/or turbulent gas flow phenomena.The fact that the dynamic nonlinearity improved signifi-cantly when suction was applied to the output flow of thePSOL (Fig. 7) suggests that a portion of the nonlinear distor-tion may arise from turbulent effects, since suction reducesthe output peak flow amplitude. While the harmonic distor-tion of the output flow may seem somewhat high (averaging19.90 and 28.05% with and without a suction source, respec-tively), one must remember that thekd index is dependenton bandwidth over which it is measured.32 In this study, ourbandwidth was from 0.098 to 40.97 Hz, considerably largerthan the typical 0.1–10 Hz range used for employed forlow frequency respiratory impedance measurements.12,13,15
Thus one may expect a reduction in harmonic distortion ifsuch a smaller bandwidth is used.
The value of the experimentally determinedRload for thetest load demonstrated a trend of decreasing with increas-ing frequency, asymptotically approaching the value of thescreen resistance of 4 cm H2O/l/s. Such behavior has beennoted in previous studies using similar test loads,27 andis often attributed to a reduction in energy dissipation asgas compression transitions from an isothermal to adiabaticprocess as frequency is increased.25 Similarly, the energystorage associated with cyclic gas compression, as reflectedin Eload, would be expected to increase with increasing fre-quency according to Eq. (2) asβ transitions from 1.0 to1.4. However, since each of the applied frequencies in ourbroad-band NSND waveform was delivered to the load si-multaneously, it is unlikely that gas compression can becharacterized as a purely isothermal or adiabatic process atany one particular frequency.
Our device is distinct from traditional linear motor de-signs in that it incorporates the load impedance into theservo-loop. As such, the frequency response of the closed-loop system will depend on the mechanical properties ofthe load impedance, which will vary from patient to pa-tient. To assess the impact of different patient populationsand pathophysiological conditions on the closed-loop per-formance of our device, we performed a Matlab computersimulation of the block diagram in Fig. 3. The details ofthis simulation are provided in the Appendix. The simula-tion was validated first by identifying an open-loop transferfunction for the data of Fig. 6 and predicting the closed-loop response for the entire system of Fig. 3 using a modelZload with parameters consistent with the screen resistorand bottle. Indeed, this prediction agreed remarkably wellwith the actual closed-loop frequency response as shownby the solid line in Fig. 8. Figure 13 shows the predicted
P1: JLS
Annals of Biomedical Engineering [AMBE] pp1151-ambe-483463 March 9, 2004 8:39 Style file version 14 Oct, 2003
606 D. W. KACZKA and K. R. LUTCHEN
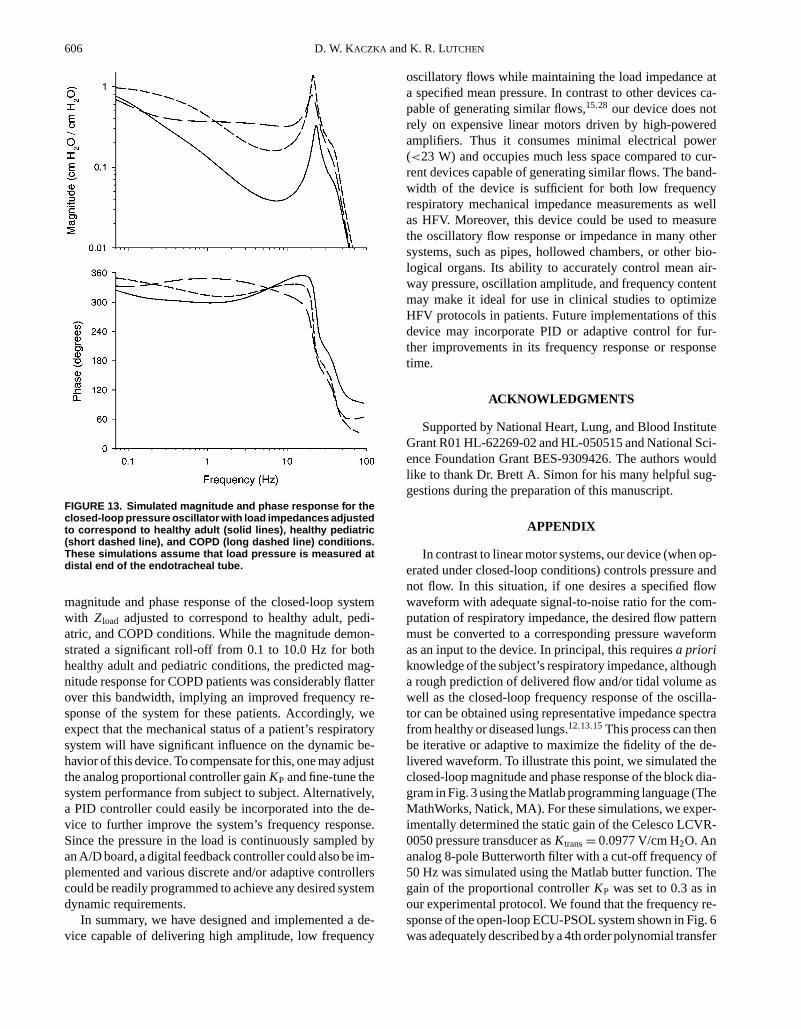
FIGURE 13. Simulated magnitude and phase response for theclosed-loop pressure oscillator with load impedances adjustedto correspond to healthy adult (solid lines), healthy pediatric(short dashed line), and COPD (long dashed line) conditions.These simulations assume that load pressure is measured atdistal end of the endotracheal tube.
magnitude and phase response of the closed-loop systemwith Zload adjusted to correspond to healthy adult, pedi-atric, and COPD conditions. While the magnitude demon-strated a significant roll-off from 0.1 to 10.0 Hz for bothhealthy adult and pediatric conditions, the predicted mag-nitude response for COPD patients was considerably flatterover this bandwidth, implying an improved frequency re-sponse of the system for these patients. Accordingly, weexpect that the mechanical status of a patient’s respiratorysystem will have significant influence on the dynamic be-havior of this device. To compensate for this, one may adjustthe analog proportional controller gainKP and fine-tune thesystem performance from subject to subject. Alternatively,a PID controller could easily be incorporated into the de-vice to further improve the system’s frequency response.Since the pressure in the load is continuously sampled byan A/D board, a digital feedback controller could also be im-plemented and various discrete and/or adaptive controllerscould be readily programmed to achieve any desired systemdynamic requirements.
In summary, we have designed and implemented a de-vice capable of delivering high amplitude, low frequency
oscillatory flows while maintaining the load impedance ata specified mean pressure. In contrast to other devices ca-pable of generating similar flows,15,28 our device does notrely on expensive linear motors driven by high-poweredamplifiers. Thus it consumes minimal electrical power(<23 W) and occupies much less space compared to cur-rent devices capable of generating similar flows. The band-width of the device is sufficient for both low frequencyrespiratory mechanical impedance measurements as wellas HFV. Moreover, this device could be used to measurethe oscillatory flow response or impedance in many othersystems, such as pipes, hollowed chambers, or other bio-logical organs. Its ability to accurately control mean air-way pressure, oscillation amplitude, and frequency contentmay make it ideal for use in clinical studies to optimizeHFV protocols in patients. Future implementations of thisdevice may incorporate PID or adaptive control for fur-ther improvements in its frequency response or responsetime.
ACKNOWLEDGMENTS
Supported by National Heart, Lung, and Blood InstituteGrant R01 HL-62269-02 and HL-050515 and National Sci-ence Foundation Grant BES-9309426. The authors wouldlike to thank Dr. Brett A. Simon for his many helpful sug-gestions during the preparation of this manuscript.
APPENDIX
In contrast to linear motor systems, our device (when op-erated under closed-loop conditions) controls pressure andnot flow. In this situation, if one desires a specified flowwaveform with adequate signal-to-noise ratio for the com-putation of respiratory impedance, the desired flow patternmust be converted to a corresponding pressure waveformas an input to the device. In principal, this requiresa prioriknowledge of the subject’s respiratory impedance, althougha rough prediction of delivered flow and/or tidal volume aswell as the closed-loop frequency response of the oscilla-tor can be obtained using representative impedance spectrafrom healthy or diseased lungs.12,13,15 This process can thenbe iterative or adaptive to maximize the fidelity of the de-livered waveform. To illustrate this point, we simulated theclosed-loop magnitude and phase response of the block dia-gram in Fig. 3 using the Matlab programming language (TheMathWorks, Natick, MA). For these simulations, we exper-imentally determined the static gain of the Celesco LCVR-0050 pressure transducer asKtrans= 0.0977 V/cm H2O. Ananalog 8-pole Butterworth filter with a cut-off frequency of50 Hz was simulated using the Matlab butter function. Thegain of the proportional controllerKP was set to 0.3 as inour experimental protocol. We found that the frequency re-sponse of the open-loop ECU-PSOL system shown in Fig. 6was adequately described by a 4th order polynomial transfer
P1: JLS
Annals of Biomedical Engineering [AMBE] pp1151-ambe-483463 March 9, 2004 8:39 Style file version 14 Oct, 2003
Servo-Controlled Pneumatic Pressure Oscillator 607
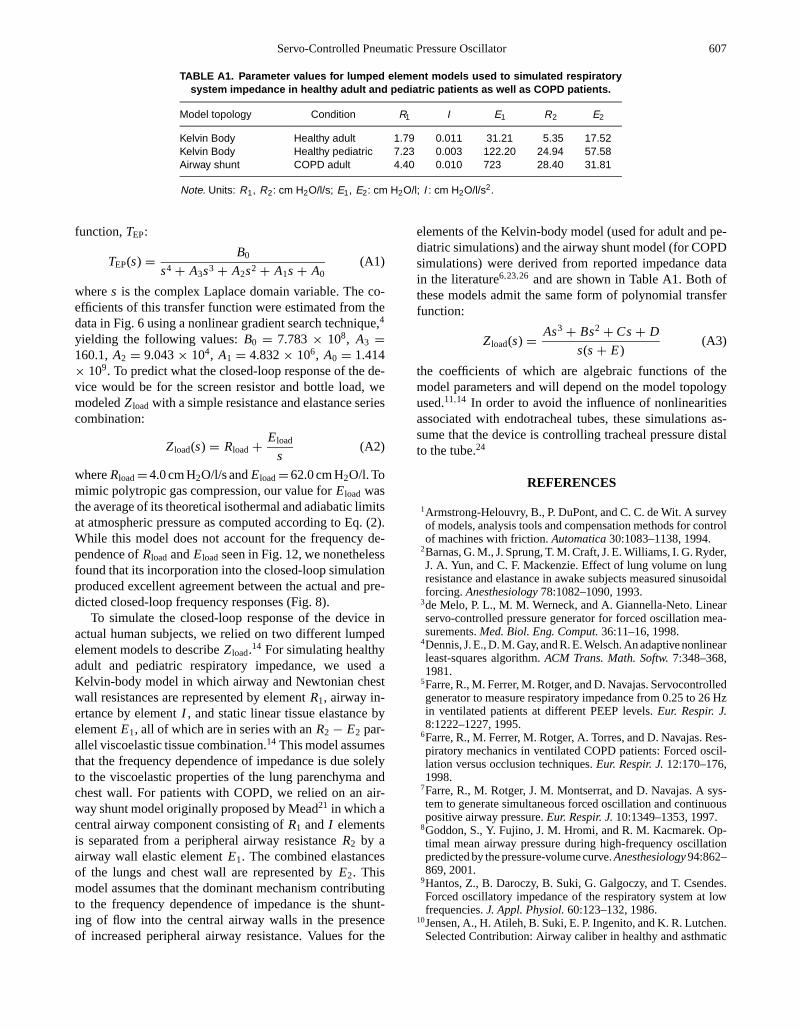
TABLE A1. Parameter values for lumped element models used to simulated respiratorysystem impedance in healthy adult and pediatric patients as well as COPD patients.
Model topology Condition R1 I E1 R2 E2
Kelvin Body Healthy adult 1.79 0.011 31.21 5.35 17.52Kelvin Body Healthy pediatric 7.23 0.003 122.20 24.94 57.58Airway shunt COPD adult 4.40 0.010 723 28.40 31.81
Note. Units: R1, R2: cm H2O/l/s; E1, E2: cm H2O/l; I : cm H2O/l/s2.
function,TEP:
TEP(s) = B0
s4+ A3s3+ A2s2+ A1s+ A0(A1)
wheres is the complex Laplace domain variable. The co-efficients of this transfer function were estimated from thedata in Fig. 6 using a nonlinear gradient search technique,4
yielding the following values:B0 = 7.783× 10⁸, A3 =160.1,A2 = 9.043× 10⁴, A1 = 4.832× 10⁶, A0 = 1.414× 10⁹. To predict what the closed-loop response of the de-vice would be for the screen resistor and bottle load, wemodeledZload with a simple resistance and elastance seriescombination:
Zload(s) = Rload+ Eload
s(A2)
whereRload=4.0 cm H2O/l/s andEload=62.0 cm H2O/l. Tomimic polytropic gas compression, our value forEload wasthe average of its theoretical isothermal and adiabatic limitsat atmospheric pressure as computed according to Eq. (2).While this model does not account for the frequency de-pendence ofRload andEload seen in Fig. 12, we nonethelessfound that its incorporation into the closed-loop simulationproduced excellent agreement between the actual and pre-dicted closed-loop frequency responses (Fig. 8).
To simulate the closed-loop response of the device inactual human subjects, we relied on two different lumpedelement models to describeZload.14 For simulating healthyadult and pediatric respiratory impedance, we used aKelvin-body model in which airway and Newtonian chestwall resistances are represented by elementR1, airway in-ertance by elementI , and static linear tissue elastance byelementE1, all of which are in series with anR2− E2 par-allel viscoelastic tissue combination.14 This model assumesthat the frequency dependence of impedance is due solelyto the viscoelastic properties of the lung parenchyma andchest wall. For patients with COPD, we relied on an air-way shunt model originally proposed by Mead21 in which acentral airway component consisting ofR1 and I elementsis separated from a peripheral airway resistanceR2 by aairway wall elastic elementE1. The combined elastancesof the lungs and chest wall are represented byE2. Thismodel assumes that the dominant mechanism contributingto the frequency dependence of impedance is the shunt-ing of flow into the central airway walls in the presenceof increased peripheral airway resistance. Values for the
elements of the Kelvin-body model (used for adult and pe-diatric simulations) and the airway shunt model (for COPDsimulations) were derived from reported impedance datain the literature6,23,26 and are shown in Table A1. Both ofthese models admit the same form of polynomial transferfunction:
Zload(s) = As3+ Bs2+ Cs+ D
s(s+ E)(A3)
the coefficients of which are algebraic functions of themodel parameters and will depend on the model topologyused.11,14 In order to avoid the influence of nonlinearitiesassociated with endotracheal tubes, these simulations as-sume that the device is controlling tracheal pressure distalto the tube.24
REFERENCES
1Armstrong-Helouvry, B., P. DuPont, and C. C. de Wit. A surveyof models, analysis tools and compensation methods for controlof machines with friction.Automatica30:1083–1138, 1994.
2Barnas, G. M., J. Sprung, T. M. Craft, J. E. Williams, I. G. Ryder,J. A. Yun, and C. F. Mackenzie. Effect of lung volume on lungresistance and elastance in awake subjects measured sinusoidalforcing.Anesthesiology78:1082–1090, 1993.
3de Melo, P. L., M. M. Werneck, and A. Giannella-Neto. Linearservo-controlled pressure generator for forced oscillation mea-surements.Med. Biol. Eng. Comput.36:11–16, 1998.
4Dennis, J. E., D. M. Gay, and R. E. Welsch. An adaptive nonlinearleast-squares algorithm.ACM Trans. Math. Softw.7:348–368,1981.
5Farre, R., M. Ferrer, M. Rotger, and D. Navajas. Servocontrolledgenerator to measure respiratory impedance from 0.25 to 26 Hzin ventilated patients at different PEEP levels.Eur. Respir. J.8:1222–1227, 1995.
6Farre, R., M. Ferrer, M. Rotger, A. Torres, and D. Navajas. Res-piratory mechanics in ventilated COPD patients: Forced oscil-lation versus occlusion techniques.Eur. Respir. J.12:170–176,1998.
7Farre, R., M. Rotger, J. M. Montserrat, and D. Navajas. A sys-tem to generate simultaneous forced oscillation and continuouspositive airway pressure.Eur. Respir. J.10:1349–1353, 1997.
8Goddon, S., Y. Fujino, J. M. Hromi, and R. M. Kacmarek. Op-timal mean airway pressure during high-frequency oscillationpredicted by the pressure-volume curve.Anesthesiology94:862–869, 2001.
9Hantos, Z., B. Daroczy, B. Suki, G. Galgoczy, and T. Csendes.Forced oscillatory impedance of the respiratory system at lowfrequencies.J. Appl. Physiol.60:123–132, 1986.
10Jensen, A., H. Atileh, B. Suki, E. P. Ingenito, and K. R. Lutchen.Selected Contribution: Airway caliber in healthy and asthmatic
P1: JLS
Annals of Biomedical Engineering [AMBE] pp1151-ambe-483463 March 9, 2004 8:39 Style file version 14 Oct, 2003
608 D. W. KACZKA and K. R. LUTCHEN
subjects: Effects of bronchial challenge and deep inspirations.J.Appl. Physiol.91:506–515, 2001.
11Kaczka, D. W., G. M. Barnas, B. Suki, and K. R. Lutchen.Assessment of time-domain analyses for estimation of low-frequency respiratory mechanical properties and impedancespectra.Ann. Biomed. Eng.23:135–151, 1995.
12Kaczka, D. W., E. P. Ingenito, S. C. Body, S. E. Duffy, S. J.Mentzer, M. M. DeCamp, and K. R. Lutchen. Inspiratory lungimpedance in COPD: Effects of PEEP and immediate impact oflung volume reduction surgery.J. Appl. Physiol.90:1833–1841,2001.
13Kaczka, D. W., E. P. Ingenito, E. Israel, and K. R. Lutchen.Airway and lung tissue mechanics in asthma: Effects ofalbuterol. Am. J. Respir. Crit. Care Med.159:169–178,1999.
14Kaczka, D. W., E. P. Ingenito, and K. R. Lutchen. Techniqueto determine inspiratory impedance during mechanical ventila-tion: Implications for flow-limited patients.Ann. Biomed. Eng.27:340–355, 1999.
15Kaczka, D. W., E. P. Ingenito, B. Suki, and K. R. Lutchen.Partitioning airway and lung tissue resistances in humans: Ef-fects of bronchoconstriction.J. Appl. Physiol.82:1531–1541,1997.
16Krishman, J. A., and R. G. Brower. High-frequency ventilationfor acute lung injury and ARDS.Chest118:795–807, 2000.
17Lua, A. C., K. C. Shi, and L. P. Chua. Proportional assist ventila-tion system based on proportional solenoid valve control.Med.Eng. Phys.23:381–389, 2001.
18Lutchen, K. R., and H. Gillis. Relationship between heteroge-neous changes in airway morphometry and lung resistance andelastance.J. Appl. Physiol.83:1192–1201, 1997.
19Lutchen, K. R., Z. Hantos, and A. C. Jackson. Importance oflow-frequency impedance data for reliably quantifying parallelinhomogeneities of respiratory mechanics.IEEE Trans. Biomed.Eng.35:472–481, 1988.
20Lutchen, K. R., K. Yang, D. W. Kaczka, and B. Suki. Optimalventilation waveforms for estimating low-frequency respiratoryimpedance.J. Appl. Physiol.75:478–488, 1993.
21Mead, J. Contribution of compliance of airways to frequency-dependent behavior of lungs.J. Appl. Physiol.26:670–673,1969.
22Michaelson, E. D., E. D. Grassman, and W. Peters. Pulmonarymechanics by spectral analysis of forced random noise.J. Clin.Invest.56:1210–1230, 1975.
23Navajas, D., R. Farre, J. Canet, M. Rotger, and J. Sanchis. Res-piratory input impedance in anesthetized paralyzed patients.J. Appl. Physiol.69:1372–1379, 1990.
24Navajas, D., R. Farre, M. Rotger, and J. Canet. Recording pres-sure at the distal end of the endotracheal tube to measure respi-ratory impedance.Eur. Respir. J.2:178–184, 1988.
25Peslin, R., and J. J. Fredberg. Oscillation mechanics of the respi-ratory system. InHandbook of Physiology the Respiratory Sys-tem. Mechanics of Breathing. Bethesda: American PhysiologicalSociety, 1986, Sec. 3, Vol. III, Pt. 1, Chapter 11, pp. 145–178.
26Petak, F., B. Babik, T. Asztalos, G. L. Hall, Z. I. Deak, P. D. Sly,and Z. Hantos. Airway and tissue mechanics in anesthetizedparalyzed children.Pediatr. Pulmonol.35:169–176, 2003.
27Schuessler, T. F., and J. H. T. Bates. A computer-controlled re-search ventilator for small animals: Design and evaluation.IEEETrans. Biomed. Eng.42:860–866, 1995.
28Simon, B. A., and W. Mitzner. Design and calibration of ahigh-frequency oscillatory ventilator.IEEE Trans. Biomed. Eng.38:214–218, 1991.
29Simon, B. A., G. G. Weinman, and W. Mitzner. Mean airwaypressure and alveolar pressure during high-frequency ventila-tion. J. Appl. Physiol.57:1069–1078, 1984.
30Suki, B., and K. R. Lutchen. Pseudorandom signals to estimateapparent transfer and coherence functions of nonlinear systems:Applications to respiratory mechanics.IEEE Trans. Biomed.Eng.39:1142–1151, 1992.
31Vaughan, N. D., and J. B. Gamble. The modeling and simulationof a proportional solenoid valve.J. Dyn. Syst. Meas. Control118:120–125, 1996.
32Zhang, Q., B. Suki, and K. R. Lutchen. Harmonic distortion fromnonlinear systems with broadband inputs: Applications to lungmechanics.Ann. Biomed. Eng.23:672–681, 1995.