session 1: introduction - university of warwick in economics from trinity college dublin msc, mres...
TRANSCRIPT

Session 1: Introduction
Michael McMahon
University of Warwick
McMahon (University of Warwick) Introduction 1 / 22

To Cover
1 The Abouts2 Syllabus3 Assignments and Grading4 Some philosophical points about Economics
McMahon (University of Warwick) Introduction 2 / 22

The Abouts
About you and about me
About the course in general
Resources
McMahon (University of Warwick) Introduction 3 / 22

The AboutsAbout you and about me
Dr. Michael McMahon
Biographical information:
IrishBA in Economics from Trinity College DublinMSc, MRes and PhD in Economics from London School of EconomicsWorked as a professional economist for the Bank of England, ECB, andCentral Bank of IrelandTaught for Warwick, LSE, NYU and University of Chicago.
Your name, your area of work, your economics and statisticsbackground, and your chance to ask me any questions about me.
McMahon (University of Warwick) Introduction 4 / 22

The AboutsAbout the course
1 Lectures (40%)2 Class Discussion of Relevant Literature and current situation (40%)3 Computer Based Work (20%)
McMahon (University of Warwick) Introduction 5 / 22

The AboutsAbout the course
Economist Article....the measure of your learning.
McMahon (University of Warwick) Introduction 6 / 22

The AboutsAbout the course
There are 3 main themes to be covered in the course:
1 Macroeconomic Theory;2 Money, banking and the �nancial system (including the current crisisand policy responses);
3 Macroeconomic indicators and an introduction to the use of statisticsin macroeconomics.
McMahon (University of Warwick) Introduction 7 / 22

The AboutsAbout the timetable - Day 1
The Basic Real Business Cycle Model (Theme 1)
Introducing the RBC modelDiscussing the costs of business cycles and the argument forstabilisation policyMeasuring business cycles using data (computer based work)Understanding and interpreting macroeconomic indicators
The economics of sectoral diversi�cation (Theme 1)
Bene�ts of diversi�ed economiesHow di¤erent sectors behave over the business cycle and economicadjustment across sectors
A brief introduction to forecasting and factor models (Theme 3)
the eurocoin indicator of the CEPR
McMahon (University of Warwick) Introduction 8 / 22

The AboutsAbout the timetable - Day 2
Evening / Overnight Problem: Full problem set details to beprovided but expected to be done in 30 - 90 minutes.
Money and Banking (Theme 2)
The basics of the �nancial system including the main instrumentsWhy the current crisis? Focus on the concept of leverage and balancesheet e¤ects.Fiscal policy response including a discussion of how �scal policyoperates in the economy.A brief discussion of monetary policy including models of monetarypolicyClass discussion of the liquidity trap, the zero nominal bound oninterest rates and �quantitative easing�
McMahon (University of Warwick) Introduction 9 / 22

The AboutsAbout the timetable - Day 3
Evening / Overnight Problem: To be decided - likely to considerthe issues of oil and monetary unions (full problem set details to beprovided but expected to be done in 30 - 90 minutes).Basic approaches to the labour market (Theme 1)
Search and Matching Models of the Labour MarketE¤ects of labour market regulation
The Macroeconomic E¤ects of Oil (Theme 1)How oil a¤ects the economyAnalysing the e¤ects of oil in the US and EUThe e¤ects of oil in oil-exporting countries
The Economics of Customs Unions (Theme 1)The bene�ts of customs unionsA brief introduction to the new economic geography (Krugman andVenables)Discussion of the GCC
McMahon (University of Warwick) Introduction 10 / 22

The AboutsResources
Lectures
Course pack
http://www2.warwick.ac.uk/fac/soc/economics/staff/faculty/mcmahon/adced_course
Macroeconomic data
The Economist magazine, The FT, WSJ, etc...
McMahon (University of Warwick) Introduction 11 / 22

Grading
Students will be assessed on 5 criteria:
Understanding of the theoretical components of the course
Understanding of the practical components of the course
Ability to combine the theoretical and practical elements of the coursein answers/project;
Communication of ideas � these should be both concise and clear;
Attitude to fellow students and the lecturer.
McMahon (University of Warwick) Introduction 12 / 22

GradingGrade expectations
Top Marks: The student has an excellent understanding of the materialcovered within the lectures of the course. Moreover, the student has shownan ability to think beyond the basic material and to relate the sessions toone another in a highly perceptive way. Moreover, this student understandsthe limitations of the analytical tools developed in the course. The studentpresents ideas, both written and orally, in a clear and concise manner. Inboth class participation and also other interactions with the student, (s)hedisplays an excellent attitude; receptive to comments and eager to learn.
McMahon (University of Warwick) Introduction 13 / 22

GradingGrade expectations
Middle Grade: Good understanding with some lack of clarity on eithertheoretical or empirical issues. Presentation of ideas may be moreambiguous or less well structured. Nonetheless, the student is clearlymotivated and works well within the course.
McMahon (University of Warwick) Introduction 14 / 22

GradingGrade expectations
Lower Grade: The student has only partial understanding of some areasof the course. This leads to greater ambiguities in his/her presentation ofideas.
McMahon (University of Warwick) Introduction 15 / 22

Grading
Each participant will be individually assessed via the following:
1 Two "within course" problem sets (20 points)
these short problems will involve the use of data from large databasessuch as FRED database at the St. Louis Fed, IMF and World Bankdatabases, or ILO data.each problem will be submitted by individual participants and will beworth up to 10 points.
2 2-week individual research exercise (80 points)
Assignment provided at the end of the course
McMahon (University of Warwick) Introduction 16 / 22

Basics Concepts You Must Be Aware OfGDP - Real versus Nominal Concepts
Nominal GDP in year t =N
∑i=1pit .qit (1)
Real GDP (year K prices) in year t =N
∑i=1piK .qit (2)
De�ning the price level as a de�ator
Base Z de�atort =nominal GDPt
(real GDP in year Z prices)t(3)
Calculating growth
Growth between t and t + 1 =
�Xt+1Xt
� 1�
(4)
� lnXt+1 � lnXtMcMahon (University of Warwick) Introduction 17 / 22

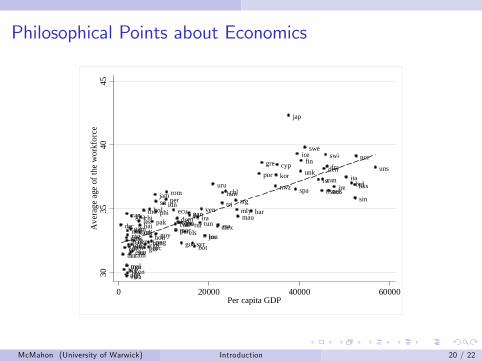
Philosophical Points about Economics
Economics is a way of thinking - not a set of laws and rules
This framework for thinking can then be applied to many topics
Freakonomics
Empirical work is very tricky
LSE (my alma mater!) - motto is "Rerum Cognoscere Causas"
The following material is just for fun, but the frame of mind that theexercise highlights is all important for economics.
McMahon (University of Warwick) Introduction 18 / 22

Philosophical Points about Economics
McMahon (University of Warwick) Introduction 19 / 22
Philosophical Points about Economics
drc
tan
bur
eth
ngr
mlw
maluga
mad
car
rwa
nigmoz
bur
togben
gam
zam
ken
sil
cha
gha
angsennepcam
lescdihaichi
ind
guizimbannic
bol
honpng
pak
jam
phisri
guy
idnperrom
ecu
colmorpar
domegycos
gua
thaels
panfijtur
syrbot
iratun
ven
jorbra
uru
mexrsa
trihunchl
argmlymau
bar
por
gre
nwzkorcyp
jap
spa
ice
unkfin
swe
isrost
canden
swi
fra
netausireita
belhks
sin
nor
uns
3035
4045
Ave
rage
age
of t
he w
orkf
orce
0 20000 40000 60000Per capita GDP
McMahon (University of Warwick) Introduction 20 / 22

Questions?
McMahon (University of Warwick) Introduction 21 / 22

END
McMahon (University of Warwick) Introduction 22 / 22

Session 2: Business Cycle Theory
Michael McMahon
University of Warwick
McMahon (University of Warwick) Business Cycles 1 / 53
To Cover
1 Measuring business cycles using data2 Introducing the business cycle theory3 Discussing the costs of business cycles and the argument forstabilisation policy
4 Understanding and interpreting macroeconomic indicators.
McMahon (University of Warwick) Business Cycles 2 / 53

Business Cycles
De�nitionCycle is made of an expansion (boom) and a contraction (recession).During the expansion all good things (GDP, employment, productivity,. . . )tend to go up, or grow faster than �normal,� and bad things(unemployment) tend to fall. During the contraction good things go downand bad things go up.
To be contrasted with economic growth.
McMahon (University of Warwick) Business Cycles 3 / 53
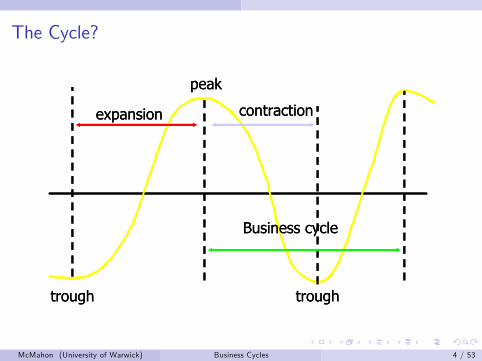
The Cycle?
trough
peak
trough
expansion contraction
Business cycle
trough
peak
trough
expansion contraction
Business cycle
McMahon (University of Warwick) Business Cycles 4 / 53

Features of Business Cycles I
1 Business cycles are NOT regular: They do not behave anything likesine waves. This is important because it tells us that they are not dueto some regular underlying component.
2 Expansions tend to be long and mild. They are measured in years.The 1990�s expansion and the most recent expansion = the longestever (my PhD).
3 Recessions tend to be short but more dramatic. They are measured inmonths.
4 However, in recessions the decline per period is relatively large.
McMahon (University of Warwick) Business Cycles 11 / 53

Features of Business Cycles II
Series St. Dev Rel. Dev Autocorrelation Corr. with GDPY 1.49 1.00 0.58 1.00C 1.59 1.06 0.73 0.68I 6.69 4.48 0.68 0.74G 1.50 1.00 0.63 0.15NX 0.90 0.60 0.51 �0.16Hours 1.60 1.07 0.70 0.58Employ 1.05 0.70 0.77 0.39
YE 1.43 0.95 0.34 0.40P 2.1 1.45 0.88 �0.57M1 3.11 2.05 0.74 0.33
McMahon (University of Warwick) Business Cycles 12 / 53

Business Cycle Dating Game
ProblemAnswer the following:
1 How would you identify periods of recession in the US economy since1940?
2 What criteria would you use to de�ne the periods?3 Apply this criteria to the data on US GDP and US GDP growth (andother important variables) using Excel.
McMahon (University of Warwick) Business Cycles 5 / 53

Should We Care About Business Cycles?
McMahon (University of Warwick) Business Cycles 13 / 53

Should We Care About Business Cycles?
Picture suggests that business cycles are minor blips and not worth muchattention. However:
1 What would level of GDP be without business cycles?
Some average of what we observe now?Or by eliminating recessions something that is on average higher?
2 Although GDP doesn�t do �much� in a recession, this doesn�t meansome �rms and individuals are not hurt (e.g. bankruptcies are verycyclical)
3 Business cycles could a¤ect growth rates
McMahon (University of Warwick) Business Cycles 14 / 53

Business Cycle v. Output GapsDe�nitionOutput gap - A measure of the di¤erence between actual activity andpotential activity.
Is the economy under-performing or over-performing?
The two concepts are related but conceptually distinct.
The economy could be in a statistical recession without thiscorresponding to an output gap - e.g. natural disaster.Likewise, the economy could be in a boom but still beunder-performing.Output gap may be more useful as a concept but it is much harder tomeasure - one way is the production function technique:
Yt = AtLαtK
1�αt
McMahon (University of Warwick) Business Cycles 15 / 53

Growth Accounting Framework
Using the production function:
Yt = AtLαtK
1�αt
Combined with data on inputs and income shares...
we can decompose GDP growth into its driving forces:
Contributions to Aggregate GrowthY TFP K L
1970s 1.55 0.56 0.89 0.111980s 2.58 1.77 0.76 0.071990s 2.39 1.56 0.74 0.092000s 2.41 1.42 0.84 0.15
McMahon (University of Warwick) Business Cycles 16 / 53

A Basic Business Cycle TheoryAS-AD Model
A simple diagrammatic exposition to examine the behaviour of outputand in�ation.
Contains 2 elements:1 Aggregate demand curve - captures the national income identity:
AD = C + I + G + X �M
2 Aggregate supply curve - captures the total quantity supplied at everyprice level.
The aim is to examine the interaction of these two relationships andto develop a framework to think about the causes of business cycles.
McMahon (University of Warwick) Business Cycles 17 / 53
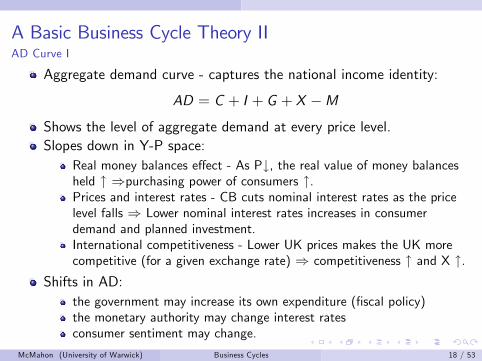
A Basic Business Cycle Theory IIAD Curve I
Aggregate demand curve - captures the national income identity:
AD = C + I + G + X �MShows the level of aggregate demand at every price level.Slopes down in Y-P space:
Real money balances e¤ect - As P#, the real value of money balancesheld " )purchasing power of consumers ".Prices and interest rates - CB cuts nominal interest rates as the pricelevel falls ) Lower nominal interest rates increases in consumerdemand and planned investment.International competitiveness - Lower UK prices makes the UK morecompetitive (for a given exchange rate) ) competitiveness " and X ".
Shifts in AD:the government may increase its own expenditure (�scal policy)the monetary authority may change interest ratesconsumer sentiment may change.
McMahon (University of Warwick) Business Cycles 18 / 53
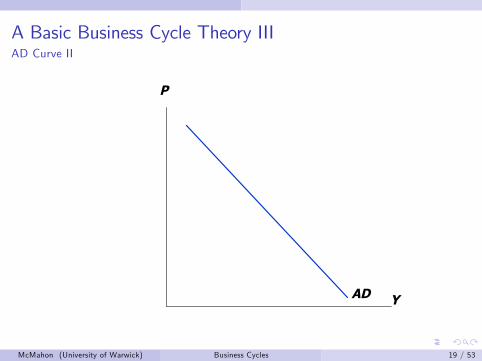
A Basic Business Cycle Theory IIIAD Curve II
Y
P
AD
McMahon (University of Warwick) Business Cycles 19 / 53

A Basic Business Cycle Theory IVAS Curve I
Aggregate supply is the total quantity of goods and services produced(supplied) at every price level.It re�ects productivity capacity of the economy and production costs.The curve shows the level of aggregate supply at every price level.In Y-P space, the AS curve is :
vertical in the long-run. The economy operates at its potential level inthe long-run and prices will adjust to ensureslopes up in the short-run. As prices increase, �rms are willing toincrease the amount that is supplied. This may be achieved byemploying overtime sta¤ or increasing utilization of machines.
Shifts in AS curve:changes in size & quality of the labour force or capital stocktechnological progress and the impact of innovationchanges in unit wage costs (incl. taxes and subsidies)changes in in�ation expectations
McMahon (University of Warwick) Business Cycles 20 / 53
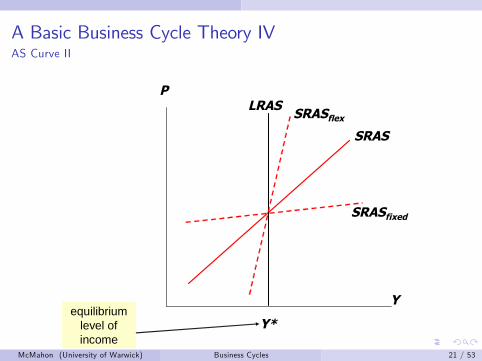
A Basic Business Cycle Theory IVAS Curve II
Y
P
SRAS
equilibriumlevel ofincome
LRAS
Y*
SRASflex
SRASfixed
McMahon (University of Warwick) Business Cycles 21 / 53

Price Adjustment is Key
Why don�t �rms adjust prices immediately - the Classical School (AScurve is vertical):
1 Most �rms seem to revise prices only occasionally (perhaps as rarelyas once a year). This means that some �rms will delay price revisionby as long as one year.
2 Firms are concerned with their market share: even those whose turn isto revise prices will do so slowly if they know many others are notrevising any time soon.
3 May be uncertain about nature of shock (is it only me or is iteveryone?) and reactions of competitors.
4 Wages are often �xed for long periods (annual contracts). Somarginal cost fairly stable. In competitive markets price cannot movetoo far from marginal cost.
McMahon (University of Warwick) Business Cycles 22 / 53

Frequency of Price Reviews
More than 12 512 34 2 1 00
5
10
15
20
25
30
35
40
McMahon (University of Warwick) Business Cycles 23 / 53
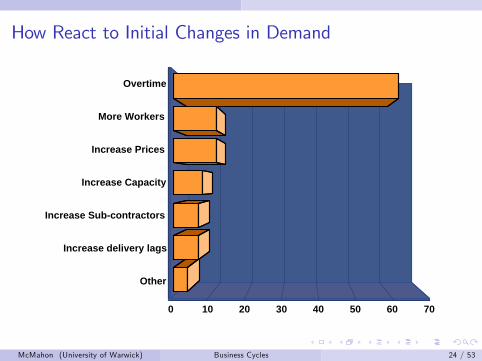
How React to Initial Changes in Demand
0 10 20 30 40 50 60 70
Overtime
More Workers
Increase Prices
Increase Capacity
Increase Subcontractors
Increase delivery lags
Other
McMahon (University of Warwick) Business Cycles 24 / 53
Price Adjustment is Key
But eventually:
More and more �rms get chance to revise prices, meaning thataggregate prices creep up
Workers get a chance to renegotiate wages, meaning that costs startincreasing, and �rms need to increase prices
Also, start running out of unemployed workers, which also pusheswages and hence prices upwards
McMahon (University of Warwick) Business Cycles 25 / 53

A Basic Business Cycle Theory VEquilibrium
Y
P
SRAS
ADequilibrium
level ofincome
LRAS
Y*
McMahon (University of Warwick) Business Cycles 26 / 53

What causes business cycles?
Economy humming along its long-run growth path but constantly bu¤etedby:
Demand Shocks: changes in demand for good and services;
Supply Shocks: essentially changes in �rms�costs of production;
Both demand and supply shocks can generate �uctuations.
McMahon (University of Warwick) Business Cycles 27 / 53

Demand Shock IShifts in the AD curve:
Consumption
Investment
Government spending
Exports
Changes in desired amounts of all these a¤ect the demand faced by �rms
1 Say initial shock pushes demand up;2 Firms�initial response is to leave prices unchanged, and accommodatethe surge in demand by producing more (GDP, investment,employment go up). This is the boom.
3 In a second stage �rms begin to increase prices and reduce output.GDP etc. return to their long-run trend.
And a recession is the same thing in reverse.McMahon (University of Warwick) Business Cycles 28 / 53
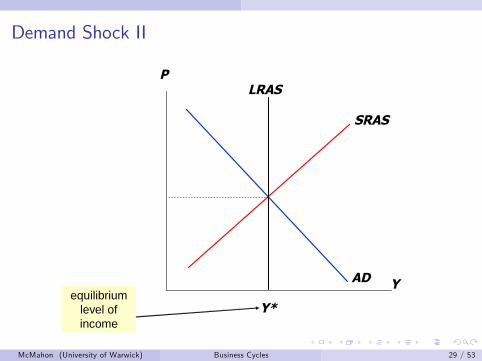
Demand Shock II
Y
P
SRAS
ADequilibrium
level ofincome
LRAS
Y*
McMahon (University of Warwick) Business Cycles 29 / 53

Demand Shock II
Y
P
SRAS
equilibriumlevel ofincome
LRAS
Y*
AD’
Y1
McMahon (University of Warwick) Business Cycles 29 / 53

Demand Shock II
Y
P
equilibriumlevel ofincome
LRAS
Y*
AD’
Y1
SRAS’’
McMahon (University of Warwick) Business Cycles 29 / 53
Supply Shock IAccelerations or decelerations in technical changeChanges in commodity pricesChanges in regulationAny other changes to the cost structure
The cycle?
Positive supply shock: because of lower costs, �rms can producemore, hire more, and lower pricesNegative supply shock: because of higher costs, �rms reduceproduction, hire less, and increase prices
But:
Often observe recessions with no clear supply side �culprit�;Booms seem to be accompanied by increasing - not falling - prices;Technological �regress� is implausible.
McMahon (University of Warwick) Business Cycles 30 / 53

Supply Shock II - Temporary
Y
P
SRAS
ADequilibrium
level ofincome
LRAS
Y*
McMahon (University of Warwick) Business Cycles 31 / 53

Supply Shock II - Temporary
Y
P
equilibriumlevel ofincome
LRAS
Y*
AD
Y1
SRAS’’
McMahon (University of Warwick) Business Cycles 31 / 53

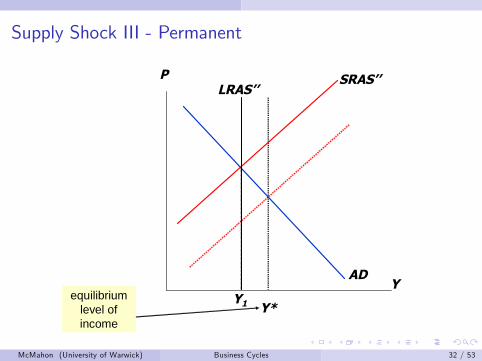
Supply Shock III - Permanent
Y
P
SRAS
ADequilibrium
level ofincome
LRAS
Y*
McMahon (University of Warwick) Business Cycles 32 / 53
Supply Shock III - Permanent
Y
P
equilibriumlevel ofincome
LRAS’’
Y*
AD
Y1
SRAS’’
McMahon (University of Warwick) Business Cycles 32 / 53

Propagation of Shocks - I
Above we have thought about business cycles in terms of demand andsupply shocks. This is informative but does not answer following question:
How do shocks to the economy become transmitted over time?
Remember that business cycles have a duration of 4-10 years, so the factthat the �uctuations are persistent is a key feature.
To think about this, it is useful to consider a distinction between the initialshock to the economy �the impulse �and the mechanism that transmitsshocks over time � the propagation mechanism.
McMahon (University of Warwick) Business Cycles 33 / 53

Propagation of Shocks - II
ImpulseImpulse PropagationMechanismPropagationMechanism
BusinessCycles
BusinessCycles
If there was no propagation mechanism, impulses would quickly dieout unless the impulses are repeated over time.
Propagation mechanisms are aspects that gives rise to persistente¤ects.
McMahon (University of Warwick) Business Cycles 34 / 53

Propagation of Shocks - III
Propagation mechanisms:
investment and capital accumulation. e.g. credit markets;
intertemporal substitution in consumption and labor supply
nominal rigidities
Neoclassical economists stress the �rst two.
Keynesian economists stress the last.
McMahon (University of Warwick) Business Cycles 35 / 53
Propagation of Shocks - IVImpulse Response Functions
Suppose that we are in equilibrium
Allow there to be a once-occurring shock (e.g. technology shock)
Impulse-response functions tell you how the variables of the modeladjust over time.
McMahon (University of Warwick) Business Cycles 36 / 53

Propagation of Shocks - V
2 0 2 4 6 8 10 12 14 16 18100
100.5
101
101.5Response of TFP (% of SS)
2 0 2 4 6 8 10 12 14 16 1898
100
102
104Response of GDP (% of SS)
2 0 2 4 6 8 10 12 14 16 1899
100
101Response of Consumption (% of SS)
2 0 2 4 6 8 10 12 14 16 1890
100
110Response of Investment (% of SS)
2 0 2 4 6 8 10 12 14 16 1899
100
101Response of Capital (% of SS)
2 0 2 4 6 8 10 12 14 16 1898
100
102Response of Hours (% of SS)
2 0 2 4 6 8 10 12 14 16 181
0
1Response of Inventory Investment ( ∆ from SS (% of GDP))
2 0 2 4 6 8 10 12 14 16 1895
100
105Response of Inventories (% of SS)
2 0 2 4 6 8 10 12 14 16 1880
100
120Response of ι (% of SS)
2 0 2 4 6 8 10 12 14 16 181
0
1Response of Storage (% of SS)
Model 0 (RBC)Model 2 (Baseline)
McMahon (University of Warwick) Business Cycles 37 / 53

The Timeline of Modern Macroeconomic Theory
The basic framework we have examined is useful as a framework to thinkabout macroeconomics, but modern macroeconomics is more complex.
It is also an ever evolving �eld:
Traditional Keynesian models (60�s)
RBC models (early 80�s onwards)
New-Keynesian Economics (mid/late 80�s onwards)
DSGE models (mid 90�s onwards)
McMahon (University of Warwick) Business Cycles 38 / 53

The DSGE Model IThe RBC model was the �rst of a class of models now known as DSGE:
D Dynamic - we look at variables over timeS Stochastic - the model is subject to random shocksGE General Equilibrium - everything e¤ects everything else (if
households work more, the wage rate is driven down)
The RBC model assumes:Perfect competitionno market imperfectionfully �exible nominal prices
Saving determines capital accumulationTechnology shocks and their propagation create �uctuations aroundthe equilibrium of all macro variablesThe model is fully microfoundedFluctuations re�ect optimal reactions to shocks
McMahon (University of Warwick) Business Cycles 39 / 53
The DSGE Model IIContributions of the basic RBC model:
Combines growth and business cycles
Uses a relatively simple model and can capture the key features ofbusiness cycles
Hugely important methodological contribution
Objections to the RBC model:
Ignores demand shocks which are known to contribute to output�uctuations
Needs very persistent exogenous shocks to generate reasonable output�uctuation persistence
Cannot generate the highly variable employment numbers, unless weassume very high elasticity of labour supply (not true)
Weak propagation mechanism
McMahon (University of Warwick) Business Cycles 40 / 53

The DSGE Model IIIBasic Equilibrium
Equilibrium in DSGE models is given by rational expectations.
Need to combine:
Optimality conditions for equilibrium consumption, savings and laboursupply from household�s maximisation problemOptimality conditions for equilibrium prices of production factors(rental and wage rate) from �rm�s maximisation problemMarket clearing conditions (GE)
Households derive utility from consumption and from leisure and so itfaces a trade-o¤:
Need to work (provide labour) to earn labour income for current andfuture consumptionNeed to have some leisure
Will have a set of equilibrium conditions which will determine theevolution of all variables over time
McMahon (University of Warwick) Business Cycles 41 / 53

The DSGE Model IVFrom RBC to alternative DSGE models I
1 Capital market imperfections / Credit Frictions2 Externalities, multiple equilibria and self-ful�lling expectations(Farmer)
3 Sticky information (Mankiw-Reis, Mackowiak-Wiederholt)4 Bounded rationality
McMahon (University of Warwick) Business Cycles 42 / 53

The DSGE Model IVFrom RBC to alternative DSGE models II
Capital market imperfections / Credit Frictions
RBC models assume perfect capital markets
But borrowers are better informed than lenders about the risk andreturns on their projects (information asymmetries)
Lenders guard themselves against this extra risk by:
requiring an external �nance premium that is negatively related to thevalue of the borrowers�collateral (Bernanke-Gertler-Gilchrist)limiting the amount of lending to a fraction of the value of thecollateral (Kiyotaki-Moore)
Both lead to a ��nancial accelerator�.
McMahon (University of Warwick) Business Cycles 43 / 53

The DSGE Model IVFrom RBC to alternative DSGE models III
Bounded rationality
=) expectations are not always and completely rational
Agents need to �nd out what is going on by learning (Evans &Honkapohja)
While learning, bounded rationality may amplify business cycle andgenerate asymmetric e¤ects (Giannitsarou)
While a reasonable assumption, non-rationality could be anything -too many ways to model bounded rationality
McMahon (University of Warwick) Business Cycles 44 / 53
The DSGE Model VIThe future?
Good modelling idea in principleBut these models get very complicated and di¢ cult to solve
Must resort to approximate solutions which are often computationallycomplicated
Assumption of rational expectations and representative agent is oftencriticised (see recent Economist article).
My View:Existing approaches are not perfect, and are certainly not de�nitivetheories of business cyclesHowever, we have gone a long way in explaining lots of things andshown that the methodology is �exible enough to deal with a lot ofthe current challenges:
though they will be hard from a computational point of view
A very exciting and challenging area of current research!McMahon (University of Warwick) Business Cycles 45 / 53

Macroeconomic Indicators
Di¤erent countries have a large (and varied) range of macroeconomicindicators apart from GDP statistics:
Industrial Production Indexes
Prices series
Money Aggregates
Interest Rates
Financial Variables
Demand Indicators (such as retail sales, auto sales, etc)
Surveys (Industrial, Construction, Consumer)
Trade Variables
Labour Market Series
Daily stock markets series
McMahon (University of Warwick) Business Cycles 46 / 53

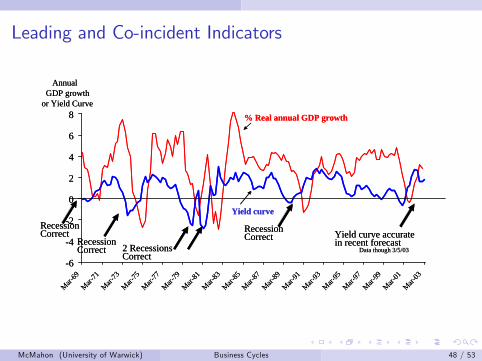
Leading and Co-incident IndicatorsIdentifying business cycles is important information for the public. But:High quality data become available only with a delay �nobody knowsexactly what current GDP is due both to revisions and to delay in datacollection.
For that reason leading and co-incident indicators are valuable:
Leading indicators: Indicators that have predictive power for businesscycle turning points and phases.
The spread between the yield on short and long bonds; New privatehousing starts; Un�lled orders in manufacturing; Number of people onpart-time work.
Co-incident indicators: Indicators that have predictive power forcurrent state of the economy.
Industrial production; Real personal sector income; Real manufacturingtrade and sales; Total non-agricultural payroll and hours
McMahon (University of Warwick) Business Cycles 47 / 53
Leading and Co-incident Indicators
6
4
2
0
2
4
6
8
Mar69
Mar71
Mar73
Mar75
Mar77
Mar79
Mar81
Mar83
Mar85
Mar87
Mar89
Mar91
Mar93
Mar95
Mar97
Mar99
Mar01
Mar03
% Real annual GDP growth
Yield curve
RecessionCorrect 2 Recessions
Correct
RecessionCorrect Yield curve accurate
in recent forecast
RecessionCorrect
AnnualGDP growth
or Yield Curve
Data though 3/5/03
6
4
2
0
2
4
6
8
Mar69
Mar71
Mar73
Mar75
Mar77
Mar79
Mar81
Mar83
Mar85
Mar87
Mar89
Mar91
Mar93
Mar95
Mar97
Mar99
Mar01
Mar03
% Real annual GDP growth
Yield curve
RecessionCorrect 2 Recessions
Correct
RecessionCorrect Yield curve accurate
in recent forecast
RecessionCorrect
AnnualGDP growth
or Yield Curve
Data though 3/5/03
McMahon (University of Warwick) Business Cycles 48 / 53
Surveys I
Many bodies (o¢ cial and uno¢ cial) conduct surveys in order to gatherinformation on the economy:
They are very timely - often can get them within the period of interest
Expectations of agents matter
But:
there is an issue of how to interpret them
we need to be careful
they can be volatile and may not be representative
sample size is important
McMahon (University of Warwick) Business Cycles 49 / 53

Surveys IIEuropean Surveys
All EU countries conduct a common survey of manufacturers, servicecompanies, construction �rms, retailers and consumer:
survey has both backward-looking and forward-looking components;
most questions asked monthly (some quarterly);
respondents choose from a menu of qualitative answers:,
�+ +�(most positive answer)�+�(positive answer)�=�(neutral answer)�-� (negative answer)�- -� (most negative answer)�Don�t know".
Some surveys are combined to give "Economic Sentiment Indicator"
McMahon (University of Warwick) Business Cycles 50 / 53

Surveys IIIEuropean Surveys
Example from consumer survey:
1 How do you expect the general economic situation in this country todevelop over the next 12 months? It will...
+ + get a lot better+ get a little better= stay the same- get a little worse- - get a lot worseN don�t know.
Answer is reported as a balance between positives and negativeswhere ++ is worth double +.
�Don�t knows�are discarded.
Often compare to long-term average.
McMahon (University of Warwick) Business Cycles 51 / 53

Final Comments on Indicators
When looking at macroeconomic indicators, two additional issues need tobe considered:
1 Seasonal adjustment2 Revisions to statistics
McMahon (University of Warwick) Business Cycles 52 / 53

END
McMahon (University of Warwick) Business Cycles 53 / 53

Session 3: Economic Diversi�cation
Michael McMahon
University of Warwick
McMahon (University of Warwick) Diversi�cation 1 / 18

To Cover
1 Di¤erent Economic Sectors2 How di¤erent sectors are a¤ected by the business cycle3 The bene�ts of diversi�cation
McMahon (University of Warwick) Diversi�cation 2 / 18

Di¤erent Economic Sectors
We have discussed how GDP can be split into di¤erent expenditurecomponents (C, I, etc...)
But we can also look at how di¤erent industries contribute to nominalGDP:
GDPt = Ind1t + Ind2t + Ind
3t ...+ Ind
Nt
where Ind jt is the contribution of industry j to nominal GDP (which"adds up").
We cannot just use industry output as the contribution - we must usea concept called "Gross Value Added (GVA)".
this avoids any double-counting of industry output
McMahon (University of Warwick) Diversi�cation 3 / 18
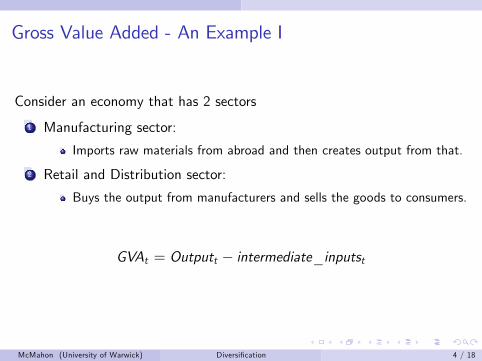
Gross Value Added - An Example I
Consider an economy that has 2 sectors
1 Manufacturing sector:
Imports raw materials from abroad and then creates output from that.
2 Retail and Distribution sector:
Buys the output from manufacturers and sells the goods to consumers.
GVAt = Outputt � intermediate_inputst
McMahon (University of Warwick) Diversi�cation 4 / 18

Gross Value Added - An Example IIIntermediate goods Output SalesDomestic Imported Intermed. Final
Manufacturing 0 50 100 100 0Retail & Dist. 100 0 150 0 150
1 Expenditure Approach
GDP(E ) = C + I + G + X �M= 150+ 0+ 0+ 0� 50= 100
2 GVA - must yield the same as expenditure approach
GDP(VA) = VAman + VAret
= (100� 50) + (150� 100)= 100
McMahon (University of Warwick) Diversi�cation 5 / 18

Adding Up Real GDP
It is not possible to simply "add up" real values
Real GDP is often simply reported as an index
Calculation of real GDP uses a method called "chain-weighting"
Following Jorgensen, we calculate real GDP (gYt ) growth as aTornqvist index of growth in each sector:
gYt = ∑i
vi ,t .gVAi ,t (1)
where vi ,t =12
�pi ,0.qi ,0
∑ipi ,0.qi ,0
+ pi ,t .qi ,t∑ipi ,t .qi ,t
�is the average nominal share of
sector i in periods t and t � 1.The main implication of this is that we cannot take real shares - wemust calculate nominal shares.
McMahon (University of Warwick) Diversi�cation 6 / 18

Overnight Problem
ProblemContinuing to look at the overnight problem - discussion of the issuesencountered and some time to work on the data with my help.
McMahon (University of Warwick) Diversi�cation 7 / 18

What is Diversi�cation?
De�nitionDiversi�cation is the process whereby an economy expands:
1 the range of sectors it produces in;2 the markets that are served; and/or3 its sources of income.
The objective is to create a stable and sustainable level of income at a(relatively) high level.
Economic diversi�cation is a structural transformation and is oftenaccompanied by economic development.
McMahon (University of Warwick) Diversi�cation 8 / 18

Why Diversi�cation?
There are well-known e¢ ciency bene�ts from specialization...
..but also risks of too little diversi�cation.
The reasons for diversi�cation typically discussed in the literature (seeZhang) are:
1 Trends in terms of trade2 Price instability in primary commodity markets3 Depletion of mineral resources4 Economies of scale and external economies especially associated withmanufacturing
5 Reduction of portfolio risk
McMahon (University of Warwick) Diversi�cation 9 / 18

How to Measure Diversi�cation? I
1 share of sector in nominal GDP2 share of sector in exports3 the % of the labour force employment in the sector
McMahon (University of Warwick) Diversi�cation 10 / 18

How to Measure Diversi�cation? II
1 UN Council on Trade and Development�s (UNCTAD) ExportConcentration Index (ECI):
A Her�ndahl-Hirschman Index
ECI =
K∑k=1
(sk )2 � 1
K
1� 1K
Ranges from1 (low level of economic diversi�cation) to 0 (high level ofdiversi�cation).The calculation takes into account 239 products.
2 UNCTAD�s Economic Vulnerability Index (EVI), a composite indexbased on the share of manufacturing in GDP, the share of labourforce in industry, annual per capita commercial energy consumptionand the ECI.
McMahon (University of Warwick) Diversi�cation 11 / 18

How do Countries Encourage Diversi�cation?
Foreign-direct investment
creating �nancial incentives for foreign investmentfavourable legislationsidenti�cation of investment opportunities and marketing theopportunities
privatization of industries
may lead to greater e¢ ciency and thus expansion of marketsAbu Dhabi utilities
liberalization of �nancial markets
use of subsidies
other industrialization policies
education and training capacities.
McMahon (University of Warwick) Diversi�cation 12 / 18

Diversi�cation in the GCC I
Many of the GCC economies stress the need for economicdiversi�cation
E¤ort has been made with:
downstream industries (such as petrochemicals, fertilizers and metals)agriculture (albeit at a high cost in subsidies)services (in the form of �nancial institutions and tourism).
There are problems associated with the diversi�cation process - e.g.the scarcity of water resources in agriculture
Success has followed with reliance on oil falling
McMahon (University of Warwick) Diversi�cation 13 / 18

Diversi�cation in the GCC II
Diversi�cation does not only mean new industries in the GCC:
GCC countries have natural advantages in solar, wind, geothermal,hydropower and biomass energies:
Existing infrastructure can be adapted for other energy purposes;training may be easier for existing energy workers
These sectors are less vulnerable than oil:
renewable�green�
Thus, measuring just energy sector share does not capture the fullextent of possible diversi�cation
McMahon (University of Warwick) Diversi�cation 14 / 18

Diversi�cation in the GCC III
But early e¤orts (1970s, 1980s) were not so successful:
development of heavy industries such as petrochemicals, aluminiumand steel such as SABIC and Dubai Aluminium.
Heavy cost in terms of subsidies and tax exemptionsCapital and labour (incl. management) were largely imported
Also, the speed of diversi�cation lead to issues of in�ation, esp. inreal estate - domestic labour force becoming rentier class
Public sector accounted for most employment of local population
McMahon (University of Warwick) Diversi�cation 15 / 18

Diversi�cation in the GCC IV
Now:
Additional focus on new services such as IT and tourism
diversi�cation within energy sector (lique�ed natural gas)
Creation of further free zones
Real estate ownership opening to nonresidents (e.g. Dubai)
Opening-up the economy to private sector FDI
Encouraging domestic enterprise
Structural and institutional reforms
McMahon (University of Warwick) Diversi�cation 16 / 18

Diversi�cation in the GCC VSuccess - Non-oil GDP in Nominal GDP (%)
McMahon (University of Warwick) Diversi�cation 17 / 18

END
McMahon (University of Warwick) Diversi�cation 18 / 18

Session 4: An Introduction to Forecasting
Michael McMahon
University of Warwick
McMahon (University of Warwick) Forecasting 1 / 22

To Cover
1 Basic Statistics and Regression2 Forecasting3 euro-coin indicator
McMahon (University of Warwick) Forecasting 2 / 22
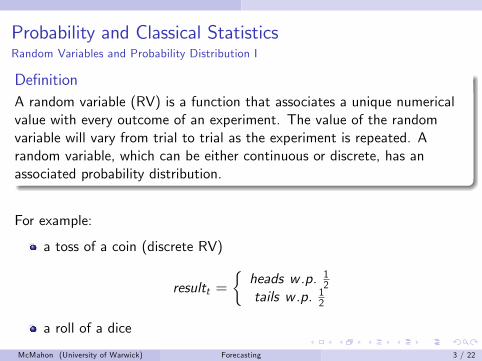
Probability and Classical StatisticsRandom Variables and Probability Distribution I
De�nitionA random variable (RV) is a function that associates a unique numericalvalue with every outcome of an experiment. The value of the randomvariable will vary from trial to trial as the experiment is repeated. Arandom variable, which can be either continuous or discrete, has anassociated probability distribution.
For example:
a toss of a coin (discrete RV)
resultt =�heads w .p. 12tails w .p. 12
a roll of a dice
McMahon (University of Warwick) Forecasting 3 / 22

Probability and Classical StatisticsRandom Variables and Probability Distribution II
A common probability distribution is the normal distribution:
Xvalues0
Probability
Try the repeated coin toss game.McMahon (University of Warwick) Forecasting 4 / 22

Probability and Classical StatisticsRandom Variables and Probability Distribution III
Any observation on a RV is the outcome of a statistical experiment:
Occasionally we know enough about the experiment to predict thefrequency of di¤erent outcomes.Usually, we observe a sample of outcomes, and try to infer the natureof the underlying experimental mechanism from this sample.In both cases we cannot predict the exact outcome of an individualexperiment.
We can imagine two types of economic experiments:1 using a set of characteristics (e.g. wage, education, experience, sex) foran individual unit (e.g. an employee) selected at random from a muchlarger population.
2 analysing an economic time series (e.g. GDP, or individual �rm sales)
McMahon (University of Warwick) Forecasting 5 / 22

Probability and Classical StatisticsRandom Variables and Probability Distribution IV
Economics is not like other science experiments:
We do not (usually) control any of the observed characteristics(unlike a physicist who might control the temperature of a reaction)
we need to adopt statistical methods which cope with situations wheremany characteristics vary simultaneously.
We cannot measure all the relevant characteristics precisely (e.g. wecannot directly observe risk aversion)
we have to assume that the e¤ects of the unobserved characteristicscan be represented by a random disturbance.Therefore, �averaging�over many observations will eliminate theire¤ects and allow us to make inferences about how the observedcharacteristics a¤ect individual behaviour.
McMahon (University of Warwick) Forecasting 6 / 22

Statistics and ProbabilityRegression - The Basics I
You want to model the e¤ect of X on Y where the true relationship is:
Yt = α+ βXt + εt (1)
Yt �! variable to explain (dependent variable)
α �! constant
β �! regression coe¢ cient
Xt �! explanatory variable
εt �! economic shocks in the relationship.
McMahon (University of Warwick) Forecasting 7 / 22

Statistics and ProbabilityRegression - The Basics II
But we don�t know the true relationship so we estimate it using the datathat we have:
Yt = α+ βXt + et (2)
Yt �! variable to explain (dependent variable)
α �! estimated constant
β �! estimated regression coe¢ cient
Xt �! explanatory variable
et �! estimated residuals in the relationship.
The aim of Least Squares regression is to make the line �t as best aspossible (minimise the square of the errors).
McMahon (University of Warwick) Forecasting 8 / 22
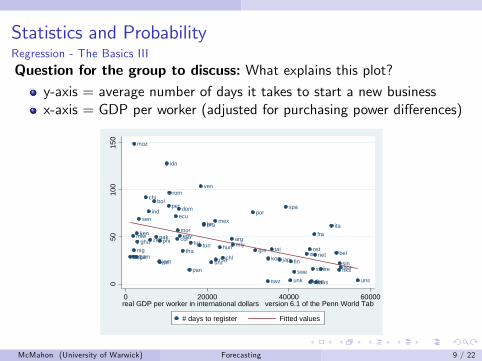
Statistics and ProbabilityRegression - The Basics III
Question for the group to discuss: What explains this plot?y-axis = average number of days it takes to start a new businessx-axis = GDP per worker (adjusted for purchasing power di¤erences)
arg
aus
bel
bol
bra
can
chi
chl
col
den
domecu
egy
fin
fragha
gre
hks
hun
idn
ind
ire
isr
ita
jam jap
jor
ken
kor
mex
mlwmly
mor
moz
netnig
nor
nwz
ost
pak
pan
per
phi
por
rom
rsa
sen
sin
spa
sri
swe swi
taitan
thatuntur
uga
unk uns
uru
ven
zam
zim
050
100
150
0 20000 40000 60000real GDP per worker in international dollars version 6.1 of the Penn World Tab
# days to register Fitted values
McMahon (University of Warwick) Forecasting 9 / 22
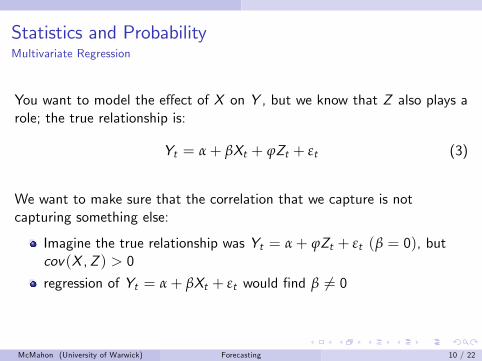
Statistics and ProbabilityMultivariate Regression
You want to model the e¤ect of X on Y , but we know that Z also plays arole; the true relationship is:
Yt = α+ βXt + ϕZt + εt (3)
We want to make sure that the correlation that we capture is notcapturing something else:
Imagine the true relationship was Yt = α+ ϕZt + εt (β = 0), butcov(X ,Z ) > 0
regression of Yt = α+ βXt + εt would �nd β 6= 0
McMahon (University of Warwick) Forecasting 10 / 22

Statistics and ProbabilityA Closer Look At Residuals
The residual term (et) captures everything not explained by X :Using equations (2), we get:
et = Yt � α� βXt
If the true relationship is (1):
et = α+ βXt + εt � α� βXt= εt + (α� α) +
�β� β
�Xt
which means that so long as our coe¢ cients are unbiased, then theestimated residuals match up with the economic shocks.But if the true relationship is (3):
et = α+ βXt + ϕZt + εt � α� βXt= εt + ϕZt + (α� α) +
�β� β
�Xt
which means that the omitted variable turns up in the residual.
McMahon (University of Warwick) Forecasting 11 / 22

Statistics and ProbabilityCare with Statistical Analysis
As already discussed, you must be careful with how you interpret simplestatistics:
Selection bias - see below
Omitted variable bias - wrongly attribute e¤ects to X rather than to Z
Measurement error
Speci�cation error - we have been talking about linear models, whatabout non-linear models?
McMahon (University of Warwick) Forecasting 12 / 22

Selection Bias
Consider again the regression hospitalization on health outcomes:
y = α+ βD + ε
Using 12,000 + German households in 1994, where health is a measurefrom 1 (ill�health) to 5 (best health), we get the following results:
health = 2.52 � 0.58 �Hospital(0.09) (0.03)
=) Hospital makes people sicker!
=) Need to Randomise our experiment.
McMahon (University of Warwick) Forecasting 13 / 22
Controls and Conditional Randomisation
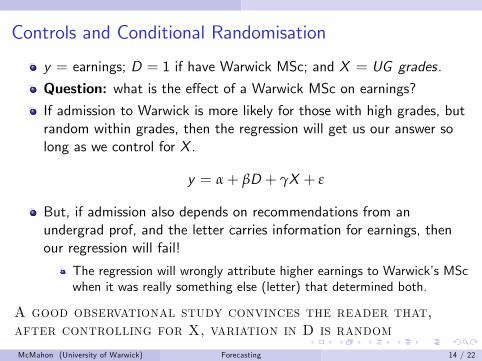
y = earnings; D = 1 if have Warwick MSc; and X = UG grades.
Question: what is the e¤ect of a Warwick MSc on earnings?If admission to Warwick is more likely for those with high grades, butrandom within grades, then the regression will get us our answer solong as we control for X .
y = α+ βD + γX + ε
But, if admission also depends on recommendations from anundergrad prof, and the letter carries information for earnings, thenour regression will fail!
The regression will wrongly attribute higher earnings to Warwick�s MScwhen it was really something else (letter) that determined both.
A good observational study convinces the reader that,after controlling for X, variation in D is random
McMahon (University of Warwick) Forecasting 14 / 22
Forecasting I
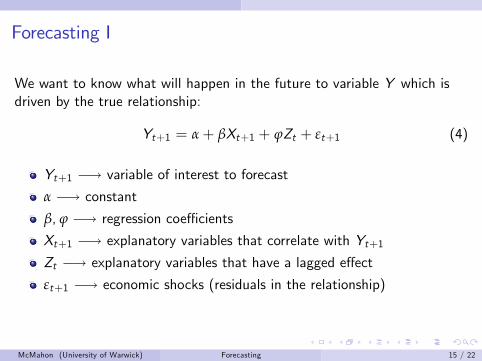
We want to know what will happen in the future to variable Y which isdriven by the true relationship:
Yt+1 = α+ βXt+1 + ϕZt + εt+1 (4)
Yt+1 �! variable of interest to forecast
α �! constant
β, ϕ �! regression coe¢ cients
Xt+1 �! explanatory variables that correlate with Yt+1Zt �! explanatory variables that have a lagged e¤ect
εt+1 �! economic shocks (residuals in the relationship)
McMahon (University of Warwick) Forecasting 15 / 22

Forecasting II
But we may have to use best guesses of Xt+1 and Zt , which we denoteXt+1(= Xt+1 + ηt+1) and Zt (= Zt + νt ), and an estimated equation:
E(Yt+1) = α+ βXt+1 + ϕZt + et+1 (5)
where E(Yt+1) denotes the best guess at time t of what value variable Ywill take at time t + 1 - �expectation�.
The key decisions for the forecaster to make are:
what value for Xt+1 (and Zt) to use?
what value of et+1 to use?
McMahon (University of Warwick) Forecasting 16 / 22
Forecasting III
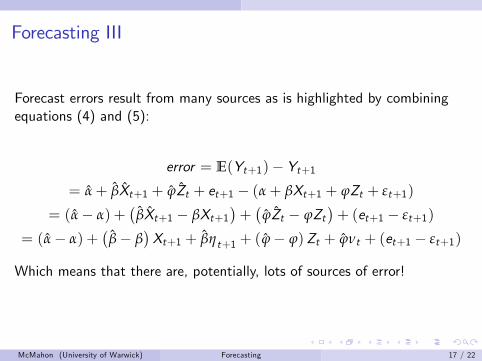
Forecast errors result from many sources as is highlighted by combiningequations (4) and (5):
error = E(Yt+1)� Yt+1= α+ βXt+1 + ϕZt + et+1 � (α+ βXt+1 + ϕZt + εt+1)
= (α� α) +�
βXt+1 � βXt+1�+�
ϕZt � ϕZt�+ (et+1 � εt+1)
= (α� α) +�
β� β�Xt+1 + βηt+1 + (ϕ� ϕ)Zt + ϕνt + (et+1 � εt+1)
Which means that there are, potentially, lots of sources of error!
McMahon (University of Warwick) Forecasting 17 / 22

Forecasting IV
4
3
2
1
0
1
2
3
4
5
6
1984 1986 1988 1990 1992 1994 1996 1998 2000 2002 2004
Per centResiduals from a US Business Investment Equation
4
3
2
1
0
1
2
3
4
5
6
1984 1986 1988 1990 1992 1994 1996 1998 2000 2002 2004
Per centResiduals from a US Business Investment Equation
What next?
McMahon (University of Warwick) Forecasting 18 / 22

Forecasting IV
4
3
2
1
0
1
2
3
4
5
6
1984 1986 1988 1990 1992 1994 1996 1998 2000 2002 2004
Per centResiduals from a US Business Investment Equation
4
3
2
1
0
1
2
3
4
5
6
1984 1986 1988 1990 1992 1994 1996 1998 2000 2002 2004
Per centResiduals from a US Business Investment Equation
4
3
2
1
0
1
2
3
4
5
6
1984 1986 1988 1990 1992 1994 1996 1998 2000 2002 2004
Per centResiduals from a US Business Investment Equation
Choices to make...
McMahon (University of Warwick) Forecasting 18 / 22

Eurocoin - A "Nowcasting" tool
De�nitione-coin is a real-time, monthly estimate of area-wide underlying GDPgrowth, computed each month by the sta¤ of the Banca d�Italia.It provides a single number summarizing the current economic outlook forthe Euro area.e-coin is obtained by collecting a large set of statistics (such as industrialproduction, surveys, stock market and �nancial data, demand indicators )and extracting from it the information that is relevant to forecast futureGDP trend.It tracks GDP growth anticipating o¢ cial GDP releases by several months.It is a �smooth version�of GDP growth...
McMahon (University of Warwick) Forecasting 19 / 22
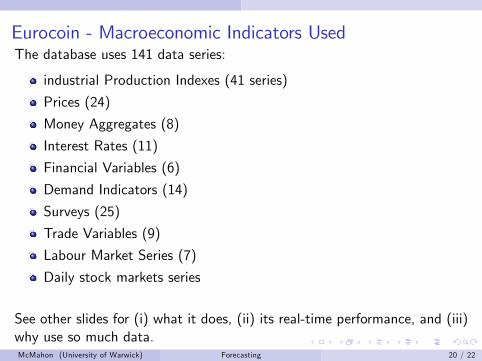
Eurocoin - Macroeconomic Indicators UsedThe database uses 141 data series:
industrial Production Indexes (41 series)
Prices (24)
Money Aggregates (8)
Interest Rates (11)
Financial Variables (6)
Demand Indicators (14)
Surveys (25)
Trade Variables (9)
Labour Market Series (7)
Daily stock markets series
See other slides for (i) what it does, (ii) its real-time performance, and (iii)why use so much data.McMahon (University of Warwick) Forecasting 20 / 22

Eurocoin - Recent Performance
McMahon (University of Warwick) Forecasting 21 / 22

END
McMahon (University of Warwick) Forecasting 22 / 22

Money, Banking, the Current Crisis and the PolicyResponse
Michael McMahon
McMahon () Current Crisis 1 / 116
Money, Banking, the Current Crisis and the PolicyResponse
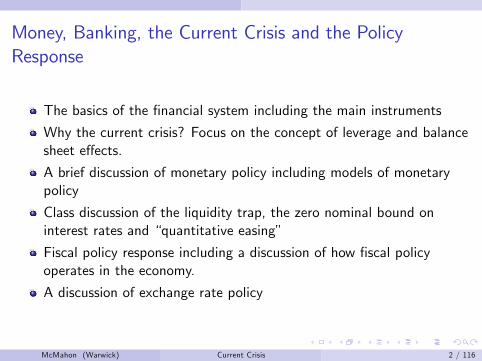
The basics of the �nancial system including the main instruments
Why the current crisis? Focus on the concept of leverage and balancesheet e¤ects.
A brief discussion of monetary policy including models of monetarypolicy
Class discussion of the liquidity trap, the zero nominal bound oninterest rates and �quantitative easing�
Fiscal policy response including a discussion of how �scal policyoperates in the economy.
A discussion of exchange rate policy
McMahon (Warwick) Current Crisis 2 / 116

The Basic Concept
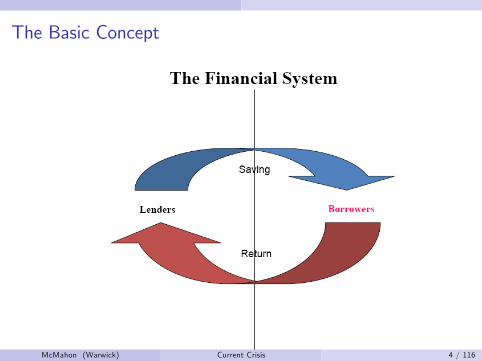
De�nitionA �nancial system is de�ned as a set of markets for �nancial instruments,and the individuals and institutions who trade in those markets, togetherwith the regulators and supervisors of the system.[Howells and Bain, 2003]
The basic function of the �nancial system is to transfer resources fromthose with excess funds for investment, to those who require more fundsfor investment.
McMahon (Warwick) Current Crisis 3 / 116
The Basic Concept
McMahon (Warwick) Current Crisis 4 / 116

The PeopleBorrowers
Firms
Households
The government
Foreigners - varies
McMahon (Warwick) Current Crisis 5 / 116

The PeopleLenders
Households
The government
Firms
Foreigners - varies
Same people - but usually in a di¤erent order.
McMahon (Warwick) Current Crisis 6 / 116

Why do Lenders Lend?
Lenders will worry about:
the return that they can get.
the risk surrounding this return:
default risk;income risk;capital risk;in�ation risk;
liquidity
If we wish to encourage more lending, one way is to increase the returnwhich we o¤er to lenders.
McMahon (Warwick) Current Crisis 7 / 116

What determines borrowers behaviour?
Borrowers will worry about:
the return that they must pay to get the funds;
the terms of this return;
for example, debt is not state-contingent while equity is.
the length and �exibility of the borrowing;
�rms will not wish to have debts which are too easily recalled.
McMahon (Warwick) Current Crisis 8 / 116

The Financial Account
Like in double-entry book-keeping, all de�cits (borrowing) must have ano¤setting surplus (lender)In the national accounts, it is possible to look at the �nancial accounts ofdi¤erent sectors over time.In Europe:
Private Non-Financial Corporations (PNFCs)
Monetary and Financial Institutions (MFIs)
Government
Households (and NPISH)
Foreigners - this is the current account
McMahon (Warwick) Current Crisis 9 / 116

The Financial Account
8.0
6.0
4.0
2.0
0.0
2.0
4.0
6.0
8.0
1999 2000 2001 2002 2003 2004 2005 2006
Households PNFCsMFI GovtNet with ROW
% of GDP
McMahon (Warwick) Current Crisis 10 / 116

How the Matches Occur
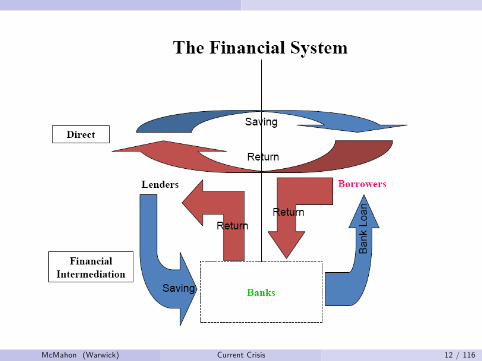
Lending can be:
1 Completely direct - lenders seeking out other agents who need toborrow.
2 Direct lending through a market.3 Through �nancial intermediation:
direct; orthrough a market.
McMahon (Warwick) Current Crisis 11 / 116
McMahon (Warwick) Current Crisis 12 / 116

The Di¤erent Types of Market
There are di¤erent �nancial markets for each di¤erent type of instrument
Primary versus secondary markets
OTC versus exchange markets
Dealers versus Brokers
Money-market versus capital market (maturity)
McMahon (Warwick) Current Crisis 13 / 116

Financial Intermediation
De�nitionInstitutions that borrow funds from people who have saved and in turnmake loans to others. [Mishkin, p.7]
So �nancial intermediates include banks, but will also include pensionfunds, insurance companies, etc...Why go through a �nancial intermediate:
Reduced transaction costs
Risk diversi�cation
Maturity transformation
Reduce Asymmetric Information
Adverse SelectionMoral Hazard
McMahon (Warwick) Current Crisis 14 / 116
Financial Intermediation
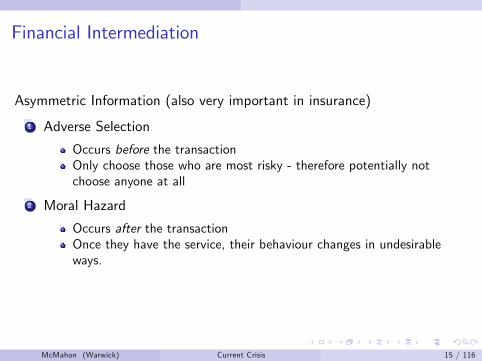
Asymmetric Information (also very important in insurance)
1 Adverse Selection
Occurs before the transactionOnly choose those who are most risky - therefore potentially notchoose anyone at all
2 Moral Hazard
Occurs after the transactionOnce they have the service, their behaviour changes in undesirableways.
McMahon (Warwick) Current Crisis 15 / 116

The Di¤erent Types of Instruments
The main two instruments to distinguish are:
Equity
May get an annual share of pro�ts as dividendOwns part of the company )voting rightPrice varies depending on supply and demand
Debt
Contractually �xed return
per period interestprincipal at maturity date
Preferential debtorNo voting right
McMahon (Warwick) Current Crisis 16 / 116

No Single Interest RateThere is NOT 1 single interest rate:
0
5
10
15
20
25
Apr71 Apr81 Apr91 Apr01
Fed funds Nominal 10yearAAA BAAState & local Mortgage
%
McMahon (Warwick) Current Crisis 17 / 116
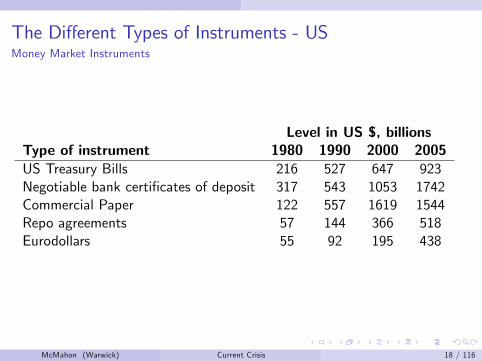
The Di¤erent Types of Instruments - USMoney Market Instruments
Level in US $, billionsType of instrument 1980 1990 2000 2005US Treasury Bills 216 527 647 923Negotiable bank certi�cates of deposit 317 543 1053 1742Commercial Paper 122 557 1619 1544Repo agreements 57 144 366 518Eurodollars 55 92 195 438
McMahon (Warwick) Current Crisis 18 / 116

The Di¤erent Types of Instruments - USMoney Market Instruments
Level (% of GDP)Type of instrument 1980 1990 2000 2005US Treasury Bills 8 9 7 7Negotiable bank certi�cates of deposit 11 9 11 14Commercial Paper 4 10 16 12Repo agreements 2 2 4 4Eurodollars 2 2 2 4
McMahon (Warwick) Current Crisis 19 / 116

The Di¤erent Types of Instruments - USCapital Market Instruments
Level (% of GDP)Type of instrument 1980 1990 2000 2005Corporate Stocks 57 71 180 144Residential Mortgages 40 50 56 76Commercial and Farm Mortgages 13 14 12 15Corporate Bonds 13 17 23 24Government Bonds 18 22 29 36Consumer Loans 13 14 12 15
McMahon (Warwick) Current Crisis 20 / 116

Regulation
Financial services are a highly regulated industry (and have been for a longtime). But why do we regulate �nancial services?
Banking relies on con�dence of public
fractional reserves systemliquidity mismatch between assets and liabilities
Contagion...
Consumer protection...not caveat emptor!
McMahon (Warwick) Current Crisis 21 / 116
Regulation
Problems because of regulation:
Moral hazard
Compliance costs
Costs of entry and exit are higher - more monopoly power!
McMahon (Warwick) Current Crisis 22 / 116

The Macroeconomic E¤ects of Financial Markets
ProblemWhy might the �nancial system have macroeconomic e¤ects?
McMahon (Warwick) Current Crisis 23 / 116

How Banking Works - The Bank Balance Sheet
McMahon (Warwick) Current Crisis 25 / 116

Bank Balance Sheets
Assets LiabilitiesReserves 4% Checkable Deposits 7%Securities 23% Time Deposits 59%Loans 66% Borrowings 26%Other assets (e.g. physical capital) 7% Bank Capital 8%
decreasing liquidity
Basic idea is to make more on the assets than you pay on the liabilities
) pro�ts
McMahon (Warwick) Current Crisis 26 / 116

Bank T-accounts
New account opened with cash (£ 100)
Assets LiabilitiesReserves +£ 100 Checkable Deposits +£ 100
If opened with a cheque from another bank, pretty much the same - cashin process of collection.
McMahon (Warwick) Current Crisis 27 / 116

Bank T-accounts
What if the new account holder then wrote a cheque for £ 50?
Assets LiabilitiesReserves -£ 50 Checkable Deposits -£ 50
.
McMahon (Warwick) Current Crisis 28 / 116
Bank T-accounts
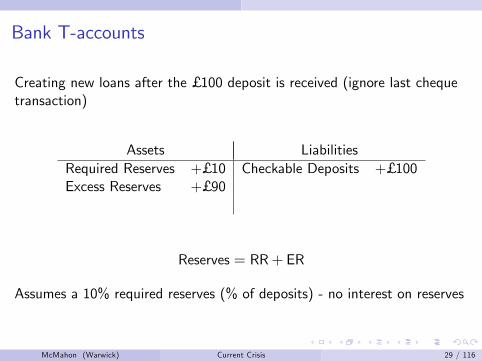
Creating new loans after the £ 100 deposit is received (ignore last chequetransaction)
Assets LiabilitiesRequired Reserves +£ 10 Checkable Deposits +£ 100Excess Reserves +£ 90
Reserves = RR+ ER
Assumes a 10% required reserves (% of deposits) - no interest on reserves
McMahon (Warwick) Current Crisis 29 / 116
Bank T-accounts
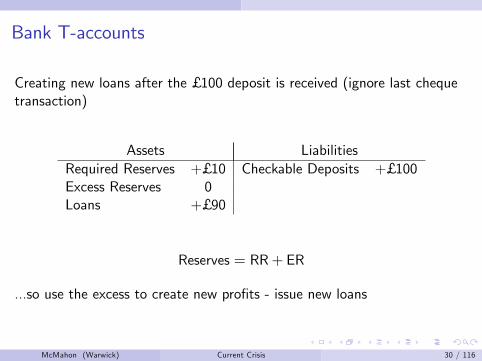
Creating new loans after the £ 100 deposit is received (ignore last chequetransaction)
Assets LiabilitiesRequired Reserves +£ 10 Checkable Deposits +£ 100Excess Reserves 0Loans +£ 90
Reserves = RR+ ER
...so use the excess to create new pro�ts - issue new loans
McMahon (Warwick) Current Crisis 30 / 116

Bank T-accounts
Creating new loans after the £ 100 deposit is received (ignore last chequetransaction)
Assets LiabilitiesRequired Reserves +£ 10 Checkable Deposits +£ 100Excess Reserves 0Loans 0Securities +£ 90
Reserves = RR+ ER
...so use the excess to create new pro�ts - issue new loans (or could buysecurities).
McMahon (Warwick) Current Crisis 31 / 116

Bank Management (brie�y)
1 Liquidity and Reserve management2 Asset and liability management3 Capital adequacy - trade-o¤
Capital prevents failures (cushion against drop in value of assets);Capital lowers return to shareholders;
4 Credit risk and interest rate risk
McMahon (Warwick) Current Crisis 32 / 116

Liquidity and Reserve management
Consider the Bank which created the £ 90 of extra loans and kept noexcess reserves (assume this is the whole balance sheet of the �rm):
Assets LiabilitiesRequired Reserves £ 10 Checkable Deposits £ 100Excess Reserves 0Loans £ 90
If there is a (relatively small) £ 10 withdrawal of deposits, deposits drop by£ 10 and reserves would be exhausted (-£ 10). The Bank is about to fail -they have a reserve shortage of £ 9...
McMahon (Warwick) Current Crisis 33 / 116

Liquidity and Reserve management
Consider the Bank which created the £ 90m of extra loans and kept noexcess reserves (assume this is the whole balance sheet of the �rm):
Assets LiabilitiesRequired Reserves £ 0 Checkable Deposits £ 90Excess Reserves 0Loans £ 90
They need to:
Borrow the required reserves, at a cost, from other banks (borrowingliabilities +£ 9, reserves +£ 9);Borrow the required reserves, at the discount rate, from the CB;Try to recall loans worth £ 9 and put the money into reserves;If they had other assets (securities or even physical capital), theycould also try to sell £ 9m of this.McMahon (Warwick) Current Crisis 34 / 116

Bank Management (brie�y)
1 Liquidity and Reserve management2 Asset and liability management3 Capital adequacy - trade-o¤
Capital prevents failures (cushion against drop in value of assets);Capital lowers return to shareholders;
4 Credit risk and interest rate risk
McMahon (Warwick) Current Crisis 35 / 116
Central Bank Balance Sheets
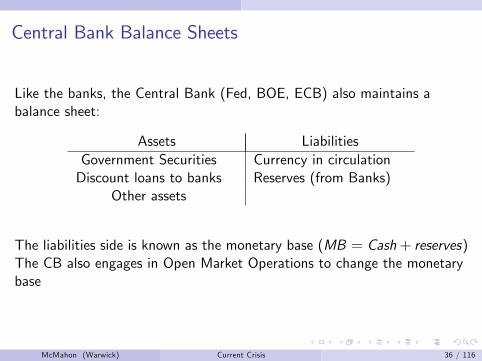
Like the banks, the Central Bank (Fed, BOE, ECB) also maintains abalance sheet:
Assets LiabilitiesGovernment Securities Currency in circulationDiscount loans to banks Reserves (from Banks)
Other assets
The liabilities side is known as the monetary base (MB = Cash+ reserves)The CB also engages in Open Market Operations to change the monetarybase
McMahon (Warwick) Current Crisis 36 / 116
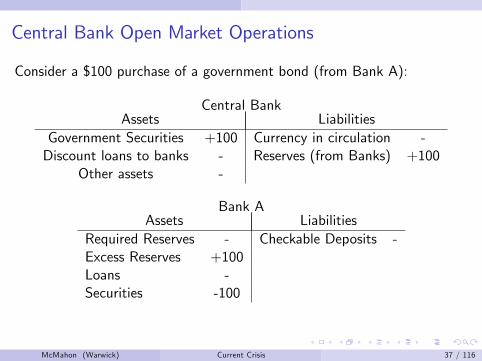
Central Bank Open Market Operations
Consider a $100 purchase of a government bond (from Bank A):
Central BankAssets Liabilities
Government Securities +100 Currency in circulation -Discount loans to banks - Reserves (from Banks) +100
Other assets -
Bank AAssets Liabilities
Required Reserves - Checkable Deposits -Excess Reserves +100Loans -Securities -100
McMahon (Warwick) Current Crisis 37 / 116

The Subprime and Financial Crisis
McMahon (Warwick) Current Crisis 38 / 116

The Subprime and Financial Crisis IUS House Prices Since 1890 (adjusted for in�ation)
Source: S&P, CaseShiller Index
McMahon (Warwick) Current Crisis 39 / 116

The Subprime and Financial Crisis IIUS House Prices and Equity Markets Have Fallen Sharply
McMahon (Warwick) Current Crisis 40 / 116

The Subprime and Financial Crisis IIIUS House Prices and Equity Markets Have Fallen Sharply
McMahon (Warwick) Current Crisis 41 / 116
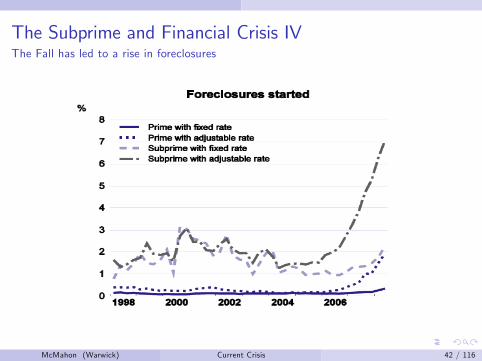
The Subprime and Financial Crisis IVThe Fall has led to a rise in foreclosures
McMahon (Warwick) Current Crisis 42 / 116

The Subprime and Financial Crisis V
But bank losses due to mortgages in this crisis are relatively small
approximately US$1,000 mnthis is equivalent to a 3% fall in the stock market (at end 2006 prices)In October 1987, the S&P 500 fell 20 % in a single month with almostno macroeconomic repercussions
Therefore, we need to understand how the shock got transmitted tobecome the large scale, global crisis that we have seen in the last 2years.
I will focus here on the idea of leverage.
McMahon (Warwick) Current Crisis 43 / 116

Leverage and the US Banking Crisis I
Leverage =assetscapital
Assets LiabilitiesReserves Checkable DepositsSecurities Time DepositsLoans BorrowingsOther assets (e.g. physical capital) Bank Capital
McMahon (Warwick) Current Crisis 44 / 116

Leverage and the US Banking Crisis II
Leverage =assetscapital
= 10
Assets LiabilitiesAssets 100 Debt 90
Bank Capital 10
McMahon (Warwick) Current Crisis 45 / 116

Leverage and the US Banking Crisis II
Leverage =assetscapital
= 9.18
Assets LiabilitiesAssets 101 Debt 90
Bank Capital 11
If debt constant, leverage is inversely proportional to asset values:
assets # ) leverage "
Holding debt constant ) counter-cyclical leverage
McMahon (Warwick) Current Crisis 46 / 116

Leverage and the US Banking Crisis IIIHouseholds
McMahon (Warwick) Current Crisis 47 / 116

Leverage and the US Banking Crisis IVPNFCs
McMahon (Warwick) Current Crisis 48 / 116

Leverage and the US Banking Crisis VBanks
McMahon (Warwick) Current Crisis 49 / 116
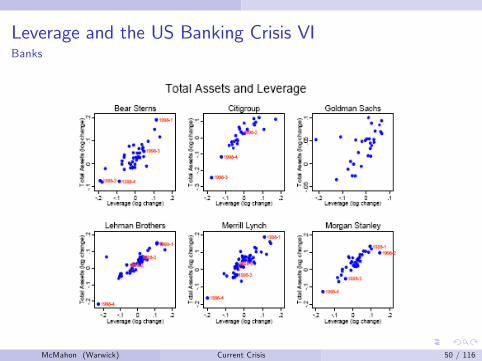
Leverage and the US Banking Crisis VIBanks
McMahon (Warwick) Current Crisis 50 / 116

Leverage and the US Banking Crisis VIIImplications of Asset Price Fall with Procyclical Leverage
Leverage =assetscapital
= 10 = TARGET
Assets LiabilitiesAssets 100 Debt 90
Bank Capital 10
Pro-cyclical leverage means that as asset prices go up, we increaseleverage by buying even more assets using debt.
But buying more assets pushes the value of assets " ) circular
When prices start to fall, we get a �resale of assets.
McMahon (Warwick) Current Crisis 51 / 116

Leverage and the US Banking Crisis VIIImplications of Asset Price Fall with Procyclical Leverage
Leverage =assetscapital
= 11
TARGET = 9 (falls)
Assets LiabilitiesAssets 99 Debt 90
Bank Capital 9
McMahon (Warwick) Current Crisis 51 / 116

Leverage and the US Banking Crisis VIIImplications of Asset Price Fall with Procyclical Leverage
Leverage =assetscapital
= 11
NEW TARGET = 9 (falls)
Assets LiabilitiesAssets 81 Debt 72
Bank Capital 9
To achieve new target the bank must sell o¤ assets and use theproceeds to pay down debt
1% fall in asset prices ) 18% sale of assets which puts furtherpressure on prices.
McMahon (Warwick) Current Crisis 51 / 116
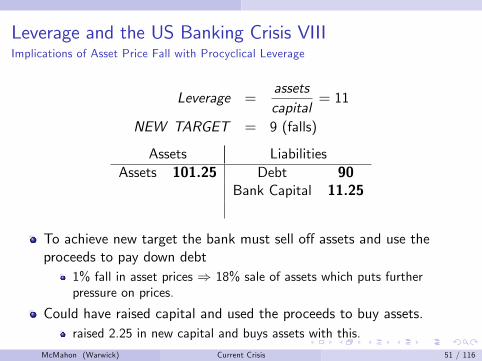
Leverage and the US Banking Crisis VIIIImplications of Asset Price Fall with Procyclical Leverage
Leverage =assetscapital
= 11
NEW TARGET = 9 (falls)
Assets LiabilitiesAssets 101.25 Debt 90
Bank Capital 11.25
To achieve new target the bank must sell o¤ assets and use theproceeds to pay down debt
1% fall in asset prices ) 18% sale of assets which puts furtherpressure on prices.
Could have raised capital and used the proceeds to buy assets.raised 2.25 in new capital and buys assets with this.
McMahon (Warwick) Current Crisis 51 / 116

Leverage and the US Banking Crisis IXA Game of Two Halves
In the beginning of the crisis (up until August 2008), banks tried to coverthe declines in the values of their assets (marked-to-market) and reducethe �resale activity by raising new capital:
Source: Bloomberg
($Bn)
CitigroupWachoviaMerril LynchWashington MutualBank of America
UBSIKB DeutscheCredit SuisseDeutsche BankCredit Agricole
HSBCRBSBarclaysHBOSLloyds TSB
Mizuho FGNomura HoldingsBank of ChinaMitsubishi UFJBank Hapoalim
333.3
170.4
62.824.2
235.4
118.6
58.122.2
0
50
100
150
200
250
300
350
North America Continental Europe UK Asia
Sum of Writedown & Loss Sum of Capital Raised
McMahon (Warwick) Current Crisis 52 / 116
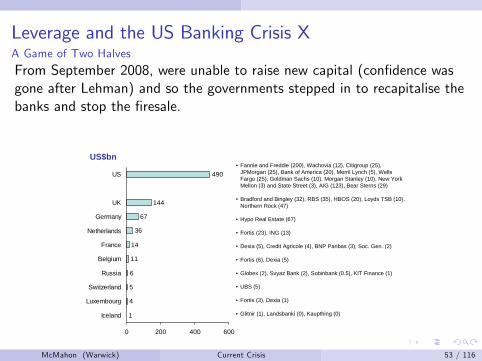
Leverage and the US Banking Crisis XA Game of Two Halves
From September 2008, were unable to raise new capital (con�dence wasgone after Lehman) and so the governments stepped in to recapitalise thebanks and stop the �resale.
1
4
5
6
11
14
36
67
144
490
0 200 400 600
Iceland
Luxembourg
Switzerland
Russia
Belgium
France
Netherlands
Germany
UK
US•Fannie and Freddie (200), Wachovia (12), Citigroup (25),
JPMorgan (25), Bank of America (20), Merril Lynch (5), WellsFargo (25), Goldman Sachs (10), Morgan Stanley (10), New YorkMellon (3) and State Street (3), AIG (123), Bear Sterns (29)
•Bradford and Bingley (32), RBS (35), HBOS (20), Loyds TSB (10),Northern Rock (47)
•Hypo Real Estate (67)
•Fortis (23), ING (13)
•Dexia (5), Credit Agricole (4), BNP Paribas (3), Soc. Gen. (2)
•Fortis (6), Dexia (5)
•Globex (2), Svyaz Bank (2), Sobinbank (0.5), KIT Finance (1)
•UBS (5)
•Fortis (3), Dexia (1)
•Glitnir (1), Landsbanki (0), Kaupthing (0)
US$bn
McMahon (Warwick) Current Crisis 53 / 116

Leverage and the US Banking Crisis XIA Game of Two Halves
Seems to be working.
Interest rate at which banks are willing to lend to each other
McMahon (Warwick) Current Crisis 54 / 116

Northern Rock - A slightly di¤erent problem
ProblemFrom the provided articles, can you develop an understanding of why theNorthern Rock crisis occurred? What were the primary failings of thebank? What was the policymakers response?
McMahon (Warwick) Current Crisis 55 / 116

Monetary and Fiscal Policy
McMahon (Warwick) Current Crisis 62 / 116

Monetary Policy
Interest rates are discussed everyday in the papers and in �nancialmarkets...Why?
Monetary policy is important because interest rates determine:
The interest rate is the cost of borrowing;
It a¤ects investment decisions by �rms;
It determines consumption decisions by families;=) it a¤ects aggregate demand.
In a recession. . . if aggregate demand is low, can stimulate economy bylowering interest rates.In a boom. . . booms driven by unusually high aggregate demand tend tolead to in�ation (overheating) and we can prevent this in�ation by reigningin aggregate demand through higher interest rates.
McMahon (Warwick) Current Crisis 63 / 116
Monetary Policy - contd
Ideal: Be �Tight� in booms and �Loose� in recessions
But:
�Long and variable lags� faced by Central Bankers;
Only get clear picture of where economy is after the fact (recognitionlag);
Takes time for interest rate changes to work their way into aggregatedemand and prices;
Very hard to tell if you are being �too loose,��too tight,� or �justright�at any particular moment;
Not always clear whether cycle is driven demand or supply shock
e.g. oils shocks of the 1970s lead to a �supply-side� recession;�stag�ation�.
McMahon (Warwick) Current Crisis 64 / 116

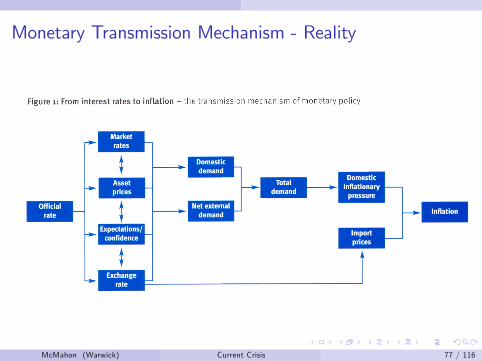
Monetary Transmission Mechanism
De�nitionThe monetary transmission mechanism describes how policy-inducedchanges...in the short-term nominal interest rate impact on real variablessuch as aggregate output and employment. Speci�c channels of monetarytransmission operate through the e¤ects that monetary policy has oninterest rates, exchange rates, equity and real estate prices, bank lending,and �rm balance sheets.
We do not know exactly what the size of each channel is (with anycertainty), but we do have good ideas about which are the main channels.
"Monetary Policy acts with long and variable lags" - MiltonFriedman
McMahon (Warwick) Current Crisis 65 / 116

Monetary Transmission Mechanism - Reality
McMahon (Warwick) Current Crisis 66 / 116
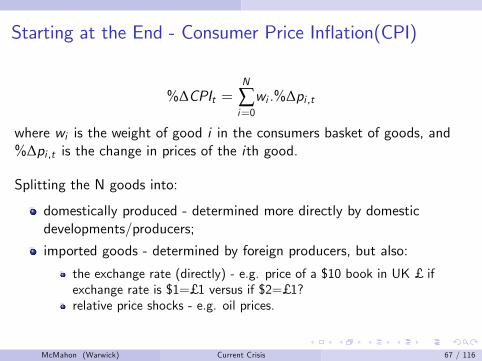
Starting at the End - Consumer Price In�ation(CPI)
%∆CPIt =N
∑i=0wi .%∆pi ,t
where wi is the weight of good i in the consumers basket of goods, and%∆pi ,t is the change in prices of the ith good.
Splitting the N goods into:
domestically produced - determined more directly by domesticdevelopments/producers;
imported goods - determined by foreign producers, but also:
the exchange rate (directly) - e.g. price of a $10 book in UK £ ifexchange rate is $1=£ 1 versus if $2=£ 1?relative price shocks - e.g. oil prices.
McMahon (Warwick) Current Crisis 67 / 116
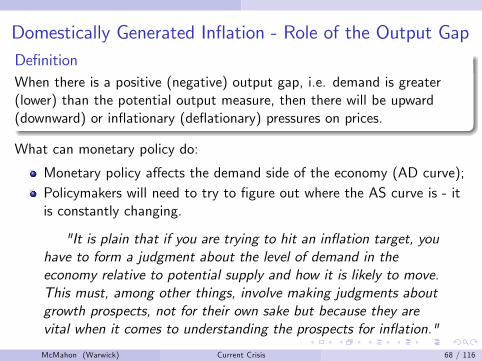
Domestically Generated In�ation - Role of the Output GapDe�nitionWhen there is a positive (negative) output gap, i.e. demand is greater(lower) than the potential output measure, then there will be upward(downward) or in�ationary (de�ationary) pressures on prices.
What can monetary policy do:
Monetary policy a¤ects the demand side of the economy (AD curve);Policymakers will need to try to �gure out where the AS curve is - itis constantly changing.
"It is plain that if you are trying to hit an in�ation target, youhave to form a judgment about the level of demand in theeconomy relative to potential supply and how it is likely to move.This must, among other things, involve making judgments aboutgrowth prospects, not for their own sake but because they arevital when it comes to understanding the prospects for in�ation."
McMahon (Warwick) Current Crisis 68 / 116

How Monetary policy a¤ects AD
AD = C + I + G + (X � Z )where C is �nal consumption by individuals and families mainly, I isinvestment in gross �xed capital (by �rms and households), G isgovernment spending, (X � Z ) is the trade balance (X is exports and Z isimports).We can broadly assume the G is not a¤ected too much by monetarypolicy- although there is some e¤ect from the business cycle on G .The other 3 will depend on how the interest rates a¤ect:
1 market interest rates;2 asset prices (equities, house prices, etc...);3 the exchange rate;
For all 3 e¤ects, expectations and how the move is interpreted plays a keyrole.
McMahon (Warwick) Current Crisis 69 / 116

How Monetary policy a¤ects ADMarket interest rates
As we already saw, the short rate will closely follow the policy rate andthen the longer term rates will depend on the expectations of futureinterest rates.
If the interest rate is increased, people might think:
interest rates in the future will be higher (better growth prospects);
lower future interest rates.
Therefore, it is necessary to understand how decisions will be interpretedand how expectations will change (see later).
McMahon (Warwick) Current Crisis 70 / 116

How Monetary policy a¤ects ADAsset Prices
If interest rates increase, and so bond yields also increase, bond prices willfall:=) this can generate a wealth e¤ect.=) this can also cause the cost of �rms investment and �nancing toincrease.
A similar thing may happen with equities - if the future is discounted witha higher interest rate, then equities decline with interest rate increases...but what if the policy is interpreted as signalling better growth prospects?
House prices, as a result of higher interest rates, may fall because lesspeople can a¤ord to take out large loans.
McMahon (Warwick) Current Crisis 71 / 116

How Monetary policy a¤ects ADExchange Rates
When the interest rate increases, then the exchange rate should, ceterisparibus, appreciate:
Foreigners will get a higher return on savings in the UK thanelsewhere - money �ows into the UK;
UK residents will rather save at home rather than abroad - less money�ows out;=) higher demand for the pound means that it will increase in valuerelative to other currencies.
The exchange rate is simply the price of one country�s money in terms ofanother country�s money.
McMahon (Warwick) Current Crisis 72 / 116

How Monetary policy a¤ects ADConsumption
The e¤ect on consumption comes through:
1 Market interest rates
depends on net position!depends on how quickly the interest rates are changed;depends on whether interest rates are �xed or �oating;depends on country of borrowing;
2 Asset prices and wealth e¤ects
Poorer people spend less.
McMahon (Warwick) Current Crisis 73 / 116

How Monetary policy a¤ects ADInvestment and Net Trade
The e¤ect on investment will come through:
1 the e¤ect on market interest and other �nancing costs;2 the e¤ects on demand.
The e¤ect on net trade is driven:
1 the exchange rate
appreciation lowers (X � Z ) as foreign goods seem cheaper (Z ") andforeigners will sell more of the home produced good (X #).
McMahon (Warwick) Current Crisis 74 / 116

Monetary Policy in Action
ProblemUsing the AS-AD framework developed yesterday, answer and explain eachof the following questions:
1 Can monetary policy can o¤set a reduction in consumption spending(perhaps related to uncertainty)?
2 How might monetary policy lead to �stag�ation�by wronglyresponding to an oil price increase?
McMahon (Warwick) Current Crisis 75 / 116
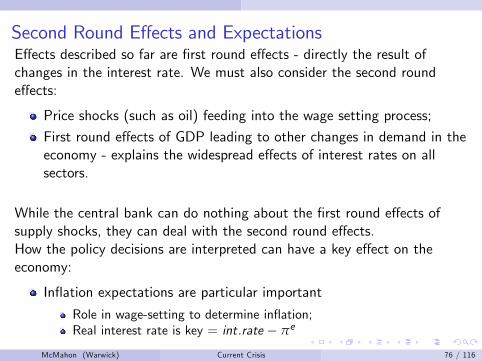
Second Round E¤ects and ExpectationsE¤ects described so far are �rst round e¤ects - directly the result ofchanges in the interest rate. We must also consider the second rounde¤ects:
Price shocks (such as oil) feeding into the wage setting process;
First round e¤ects of GDP leading to other changes in demand in theeconomy - explains the widespread e¤ects of interest rates on allsectors.
While the central bank can do nothing about the �rst round e¤ects ofsupply shocks, they can deal with the second round e¤ects.How the policy decisions are interpreted can have a key e¤ect on theeconomy:
In�ation expectations are particular important
Role in wage-setting to determine in�ation;Real interest rate is key = int.rate � πe
McMahon (Warwick) Current Crisis 76 / 116
Monetary Transmission Mechanism - Reality
McMahon (Warwick) Current Crisis 77 / 116

Long and Variable Lags
McMahon (Warwick) Current Crisis 78 / 116

Policy Response and Zero Nominal Bound on InterestRates I
Central Banks in the US and UK reacted to the current recession bycutting interest rates aggressively.One reason is that they are concerned about the liquidity trap.
McMahon (Warwick) Current Crisis 79 / 116
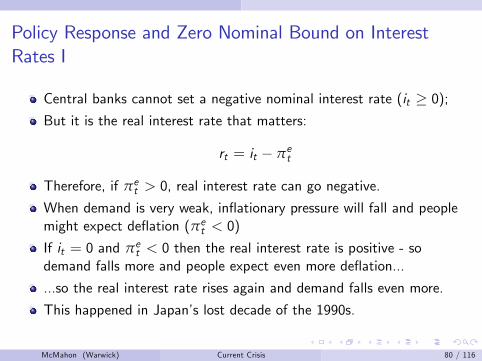
Policy Response and Zero Nominal Bound on InterestRates I
Central banks cannot set a negative nominal interest rate (it � 0);But it is the real interest rate that matters:
rt = it � πet
Therefore, if πet > 0, real interest rate can go negative.
When demand is very weak, in�ationary pressure will fall and peoplemight expect de�ation (πet < 0)
If it = 0 and πet < 0 then the real interest rate is positive - sodemand falls more and people expect even more de�ation...
...so the real interest rate rises again and demand falls even more.
This happened in Japan�s lost decade of the 1990s.
McMahon (Warwick) Current Crisis 80 / 116

Quantitative Easing as Alternative to Interest Rates
McMahon (Warwick) Current Crisis 81 / 116

Monetary Policy Independence
We will shortly discuss di¤erent monetary policy frameworks, but for nowthe relationship we are interested in is Central Bank Independence (CBI).
One of the great trends in monetary policy of the last twenty years (e.g.Gordon Brown�s �nest hour).
CBI independence means that the CB runs monetary policy independentlyof the executive.
BOE, FED, and ECB all quite independent
Various reasons for CB independence, but a clear one is to counteractthe in�ation bias that is inherent in democratic politics.
McMahon (Warwick) Current Crisis 82 / 116

How to de�ne independence
McMahon (Warwick) Current Crisis 83 / 116
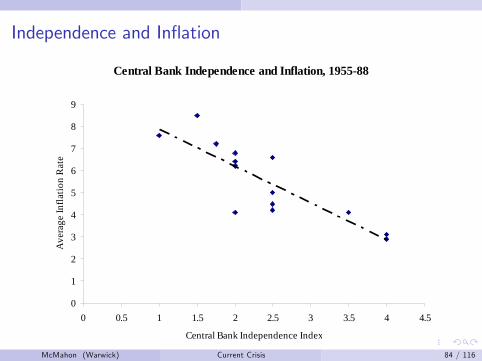
Independence and In�ation
Central Bank Independence and Inflation, 195588
0
1
2
3
4
5
6
7
8
9
0 0.5 1 1.5 2 2.5 3 3.5 4 4.5
Central Bank Independence Index
Ave
rage
Infla
tion
Rat
e
McMahon (Warwick) Current Crisis 84 / 116
Time Inconsistency and Rational Expectations
The key idea is:
1 When the govt is given an opportunity to cheat workers, they will;2 Knowing that they will be cheated, rational agents will build thisexpectation of being cheated into their plans;
3 This leads to a higher level of in�ation but with no gain in terms oflower unemployment.
=) Comes from the timing of the govt making its choice after the publichave to set their in�ation expectations - time inconsistency.
Time inconsistency problem - when the economic agents were rational,and where expectations in�uence the decision of government policy,discretionary policymaking made everyone worse o¤ compared with asituation in which the government could commit to a particular policypath - is actually due to Kydland and Prescott.
McMahon (Warwick) Current Crisis 85 / 116
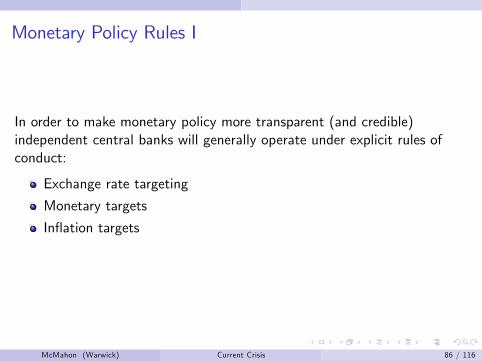
Monetary Policy Rules I
In order to make monetary policy more transparent (and credible)independent central banks will generally operate under explicit rules ofconduct:
Exchange rate targeting
Monetary targets
In�ation targets
McMahon (Warwick) Current Crisis 86 / 116
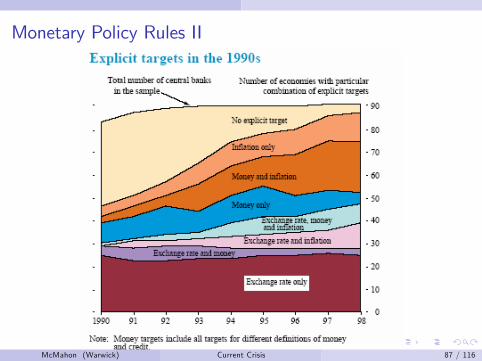
Monetary Policy Rules II
Currently most fashionable rule, in Western countries, is in�ationtargeting.Exchange rate targets are still very popular.
McMahon (Warwick) Current Crisis 87 / 116

In�ation Targeting I
De�nitionAn in�ation-targeting central bank is one that announces aonce-and-for-all policy of keeping the in�ation rate at or close to somelong-run target, e.g. 2 percent.
Various versions of in�ation targeting currently adopted by (amongothers): New Zealand (1990), Canada (1991), U.K (1992), Sweden(1993), Finland (1993), Australia (1994).
Very simple and easily understood rule.
Removes some uncertainty about direction of policy
It does not imply central bank will do nothing about recessions =) Ifdemand is down and prices start falling (or are forecast to fall) centralbank will react with lower rates to prevent in�ation falling belowtarget.
McMahon (Warwick) Current Crisis 88 / 116

In�ation Targeting II
Some issues:
What rate of in�ation? =) Low, stable and positive in�ation:
In�ation indices are biased (+1.1% in US - Boskin Commission Report);Downward rigidities in wages;Zero nominal bound on interest rates - liquidity trap.
Why not price level targeting?
With price level targets, we would have to reverse the surprise in�ationWith in�ation targets, we allow bygones be bygones.
McMahon (Warwick) Current Crisis 89 / 116

UK In�ation
0
5
10
15
20
25
30
1964 Q
1
1966 Q
1
1968 Q
1
1970 Q
1
1972 Q
1
1974 Q
1
1976 Q
1
1978 Q
1
1980 Q
1
1982 Q
1
1984 Q
1
1986 Q
1
1988 Q
1
1990 Q
1
1992 Q
1
1994 Q
1
1996 Q
1
1998 Q
1
2000 Q
1
2002 Q
1
2004 Q
1
2006 Q
1
McMahon (Warwick) Current Crisis 90 / 116

Taylor Rule
Rt = R + 1.5.(πt � π�) + 0.5.(y � y �)
The CB increases the interest rate when in�ation is high and whenoutput is high;Variations on this rule also work relatively well as descriptions ofmonetary policy in Europe although weights di¤er
- weight on in�ation higher (lower) in more (less) conservative countries
McMahon (Warwick) Current Crisis 91 / 116

Taylor Rule in the UK
Actual Base Rate Compared with Simple TaylorRule
05
1015202530354045
1973
Q1
1974
Q4
1976
Q3
1978
Q2
1980
Q1
1981
Q4
1983
Q3
1985
Q2
1987
Q1
1988
Q4
1990
Q3
1992
Q2
1994
Q1
1995
Q4
1997
Q3
1999
Q2
2001
Q1
2002
Q4
perc
ent i
nter
est r
ate
Base Rate Simple Taylor Rule
McMahon (Warwick) Current Crisis 92 / 116
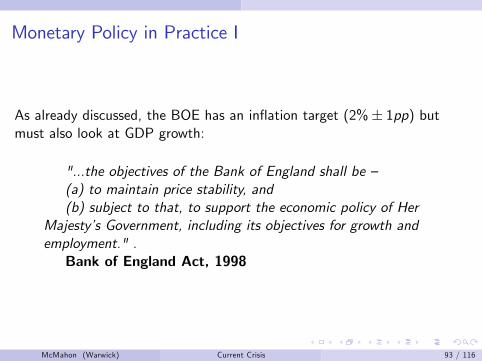
Monetary Policy in Practice I
As already discussed, the BOE has an in�ation target (2%� 1pp) butmust also look at GDP growth:
"...the objectives of the Bank of England shall be �(a) to maintain price stability, and(b) subject to that, to support the economic policy of Her
Majesty�s Government, including its objectives for growth andemployment." .Bank of England Act, 1998
McMahon (Warwick) Current Crisis 93 / 116

Monetary Policy in Practice II
The decisions are made by a 9-person committee called the MonetaryPolicy Committee (MPC):
Governor
2 x Deputy Governors
Chief Economist
Director for Financial Operations
4 x External experts appointed by HM Treasury.
MPC has operational independence but not goal independence (contrastwith ECB).
Decisions are made on a monthly basis - the �rst Thursday of everymonth, and the decision is taken by way of a majority vote (Governor hascasting vote in event of a 4-4 tie).
McMahon (Warwick) Current Crisis 94 / 116

Monetary Policy in Practice III
In reality, because of long lags from interest rate decisions to in�ationoutcomes, the Bank of England is really an in�ation-forecast targetingCentral Bank:
1 the MPC forms its best judgement about where in�ation is going (thehorizon is generally 18 months - 2 years);
2 if in�ation is too high at that horizon (above target) they will increaseinterest rates, whereas if in�ation is below target they should cutinterest rates;
3 They will also worry about the outlook for GDP (given (b) above andalso the e¤ect of demand on in�ation)
4 They aim to get a good chance of hitting the in�ation target(2%� 1pp) in the future.
The question is how they �gure out what in�ation is going to be like?
McMahon (Warwick) Current Crisis 95 / 116

MPC TimetableTiming EventThroughout the month Circulation of brie�ng material and analysis of
data releases and market developments by sta¤.Friday before policy meeting Half-day pre-MPC brie�ng meeting
Monday/Tuesday Sta¤ undertake follow-up work requestedby the Committee.
Wednesday Policy meeting commences early afternoon.Committee identi�es the key issues anddebates their implications for in�ation prospects.
Thursday Policy meeting concludes. MPC providetheir assessment of the appropriate policy stanceand vote on the level of interest rates.Policy announcement at noon, implementedimmediately
McMahon (Warwick) Current Crisis 96 / 116

Pre-MPC TimetableInternational environment Global oil and commodity price trends;
Developments in the US, euro area and Japan.
Monetary and �nancial UK money and credit aggregates; interest rates�nancial markets and exchange rates.
Demand and output UK GDP & demand components
Agents�overview Business contacts�perspective on latest economictrends. Special topic also presented.
Labour market Employment, hours worked, unemployment andinactivity; vacancies; skill shortages; earnings andsettlements; productivity and unit labour costs.
Prices UK energy, and other commodity prices;producer prices; retail prices; price de�ators.
McMahon (Warwick) Current Crisis 97 / 116

MPC Forecast
Every quarter (3 months), the MPC agrees on a forecast for in�ation andproduces "fancharts" for GDP growth and in�ation.
McMahon (Warwick) Current Crisis 98 / 116
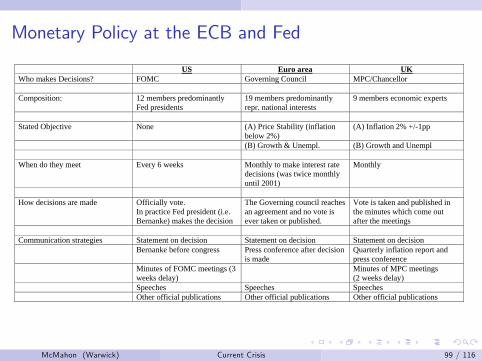
Monetary Policy at the ECB and Fed
US Euro area UKWho makes Decisions? FOMC Governing Council MPC/Chancellor
Composition: 12 members predominantlyFed presidents
19 members predominantlyrepr. national interests
9 members economic experts
Stated Objective None (A) Price Stability (inflationbelow 2%)
(A) Inflation 2% +/1pp
(B) Growth & Unempl. (B) Growth and Unempl
When do they meet Every 6 weeks Monthly to make interest ratedecisions (was twice monthlyuntil 2001)
Monthly
How decisions are made Officially vote.In practice Fed president (i.e.Bernanke) makes the decision
The Governing council reachesan agreement and no vote isever taken or published.
Vote is taken and published inthe minutes which come outafter the meetings
Communication strategies Statement on decision Statement on decision Statement on decisionBernanke before congress Press conference after decision
is madeQuarterly inflation report andpress conference
Minutes of FOMC meetings (3weeks delay)
Minutes of MPC meetings(2 weeks delay)
Speeches Speeches SpeechesOther official publications Other official publications Other official publications
McMahon (Warwick) Current Crisis 99 / 116

Fiscal Policy
Governments can boost AD by:
cutting taxes (which will boost C or I )spending more (which boosts G )
The e¤ects are the same as the e¤ects of monetary policy.
However, the use of �scal policy is subject to:
Recognition lag;Decision lag - hard with all the politics;Impact lag.
Thus, �scal policy not a good instrument for ��ne tuning�.
) Often just allow automatic stabilisers to operate.
McMahon (Warwick) Current Crisis 100 / 116

Fiscal Policy and The E¤ects of Taxation I
Highest Marginal Income Tax RateSource: Forbes Misery Index (2005)
High marginal tax rates distortionary and to be avoided –seen significant declines in taxes over last decade
0
10
20
30
40
50
60
70
France
DenmarkSwede
n
Belgium
Netherl
ands
Finland
Austria
Poland
Sloven
iaJap
anIsr
ael
USA + N
ew Y
ork st/cit
y
Austral
ia
Canada
(Onta
rio)Chin
aSpain
NorwayIta
ly
Germany
and B
erlin
GermanyIre
land
Greece
Portugal
United K
ingdo
m
Switz
erland
(Zuri
ch)
South Afri
ca
Taiwan
South Korea
Luxem
bourg
Hungar
y
USA +
Illinois
Thailan
d
Turkey
Argentin
aMalt
a
USA + Tex
as
Indon
esiaUSA
India
Lithuani
a
Czech R
epublic
MexicoCypru
s
Malaysi
aBraz
il
Latvia
USA an
d Refo
rmEsto
nia
Singap
ore
Slovakia
Romania
Hong K
ong
UkraineRussi
a
GeorgiaUAE
McMahon (Warwick) Current Crisis 101 / 116

Fiscal Policy and The E¤ects of Taxation II
Highest Employer Social Security Contribution RateSource: Forbes Misery Index (2005)
High marginal tax rates distortionary and to be avoided –seen significant declines in taxes over last decade
0
5
10
15
20
25
30
35
40
45
50
France
DenmarkSw
eden
Belgium
Netherl
ands
Finlan
d
Austria
Polan
d
SloveniaJap
anIsr
ael
USA + New
York st/
city
Austral
ia
Canada
(Onta
rio)ChinaSp
ain
NorwayIta
ly
Germany
and Berl
in
GermanyIre
land
Greece
Portu
gal
United K
ingdo
m
Switzerl
and (Z
urich)
South Afri
ca
Taiwan
South
Korea
Luxem
bourg
Hungar
y
USA + Ill
inois
Thailan
d
Turkey
Argentin
aMalt
a
USA + Tex
as
Indon
esiaUSA
India
Lithuani
a
Czech R
epublic
MexicoCypru
s
Malaysi
aBraz
il
Latvia
USA and R
eformEsto
nia
Singapore
Slovak
ia
Romania
Hong K
ong
UkraineRuss
ia
GeorgiaUAE
McMahon (Warwick) Current Crisis 102 / 116

Fiscal Policy and The E¤ects of Taxation III
Highest Employee Social Security Contribution RateSource: Forbes Misery Index (2005)
High marginal tax rates distortionary and to be avoided –seen significant declines in taxes over last decade
0
5
10
15
20
25
30
35
France
DenmarkSwede
n
Belgium
Netherl
ands
Finland
Austria
Poland
SloveniaJap
anIsr
ael
USA + New
York st/
city
Austral
ia
Canada
(Ontar
io)ChinaSpa
in
NorwayIta
ly
Germany
and Berl
in
GermanyIre
land
Greece
Portugal
United
Kingdo
m
Switz
erland
(Zuri
ch)
South
Africa
Taiwan
South
Korea
Luxem
bourg
Hungar
y
USA + Ill
inois
Thailan
d
Turkey
Argenti
naMalt
a
USA +
Texas
Indon
esiaUSA
India
Lithuani
a
Czech R
epublic
MexicoCypru
s
Malaysi
aBraz
il
Latvia
USA an
d Refo
rmEsto
nia
Singapore
Slovakia
Romania
Hong K
ong
UkraineRussi
a
GeorgiaUAE
McMahon (Warwick) Current Crisis 103 / 116
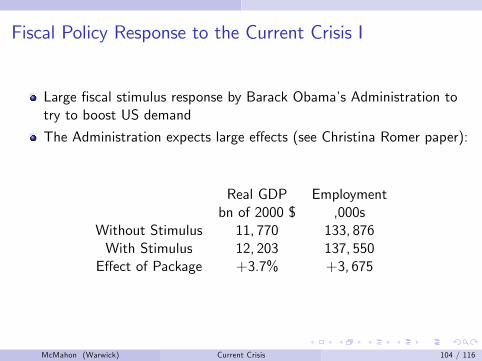
Fiscal Policy Response to the Current Crisis I
Large �scal stimulus response by Barack Obama�s Administration totry to boost US demand
The Administration expects large e¤ects (see Christina Romer paper):
Real GDP Employmentbn of 2000 $ ,000s
Without Stimulus 11, 770 133, 876With Stimulus 12, 203 137, 550E¤ect of Package +3.7% +3, 675
McMahon (Warwick) Current Crisis 104 / 116

Fiscal Policy Response to the Current Crisis II
McMahon (Warwick) Current Crisis 105 / 116

Fiscal Policy Response to the Current Crisis III
Source: Congressional Budget Office
McMahon (Warwick) Current Crisis 106 / 116
Fiscal Policy Response to the Current Crisis IV
ProblemRead the summary article in the course pack. Comment on the reasonsthat some economists believe that the Obama Administration is beingoptimistic.
McMahon (Warwick) Current Crisis 107 / 116

The Exchange Rate
McMahon (Warwick) Current Crisis 108 / 116

A Brief History of Exchange Rates
1 The Gold Standard - Up to World War II
UK adopted gold convertibility in 1717;US in 1873 (de facto), 1900 (de jure).Both World Wars interrupted it
2 Bretton Woods - 1944-1970s
Coordinated system of exchange rates with capital controls;Dollar was the anchor;Collapsed as dollar continually required devaluation (as a result ofin�ation after govt de�cits and Vietnam).
3 Floating systems4 Fixs and Dollarisation
ChinaERM
McMahon (Warwick) Current Crisis 109 / 116

The Impossible Trinity I
McMahon (Warwick) Current Crisis 110 / 116

The Impossible Trinity IIUncovered Interest Parity I
Invest in US Invest in EUEx. rate S$,etInvestment in $ $X $Xe amount e X
S $,etInterest rate r r f
Ex. rate (expected) S$,et+1Receive back $X .(1+ r) e
�XS $,et
�.(1+ r f )
$ amount $�
XS $,et
�.(1+ r f ).S$,et+1
McMahon (Warwick) Current Crisis 111 / 116

The Impossible Trinity IIIUncovered Interest Parity II
X
S$,et
!.(1+ r f ).S$,et+1 = X .(1+ r)
S$,et+1S$,et
!=
(1+ r)(1+ r f )
%∆�S£ ,e
�� r � r f
r = r f if �xed
McMahon (Warwick) Current Crisis 112 / 116
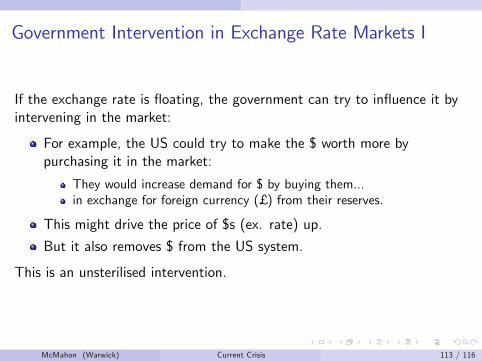
Government Intervention in Exchange Rate Markets I
If the exchange rate is �oating, the government can try to in�uence it byintervening in the market:
For example, the US could try to make the $ worth more bypurchasing it in the market:
They would increase demand for $ by buying them...in exchange for foreign currency (£ ) from their reserves.
This might drive the price of $s (ex. rate) up.
But it also removes $ from the US system.
This is an unsterilised intervention.
McMahon (Warwick) Current Crisis 113 / 116

Government Intervention in Exchange Rate Markets II
If the government did not want to a¤ect the money supply, they would:
Do as before:
They would increase demand for $ by buying them...in exchange for foreign currency (£ ) from their reserves.
And undertake an OMO to o¤set the removal of $:
In this case they buy government securities and so release $ into theUS system again.
This is a sterilised intervention - they have in e¤ect swapped foreignreserves for US government assets.
In either case, interventions do not have a very good track record ofworking:
No CB can o¤set the large �ows in the FOREX market each day.
McMahon (Warwick) Current Crisis 114 / 116
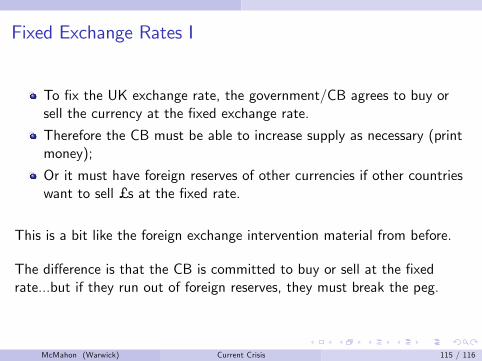
Fixed Exchange Rates I
To �x the UK exchange rate, the government/CB agrees to buy orsell the currency at the �xed exchange rate.
Therefore the CB must be able to increase supply as necessary (printmoney);
Or it must have foreign reserves of other currencies if other countrieswant to sell £ s at the �xed rate.
This is a bit like the foreign exchange intervention material from before.
The di¤erence is that the CB is committed to buy or sell at the �xedrate...but if they run out of foreign reserves, they must break the peg.
McMahon (Warwick) Current Crisis 115 / 116

Fixed Exchange Rates II - UK in ERM (see extra sheet)
In ERM, the UK was �xed at £ 1:DM2.95:
George Soros (LSE graduate!) thought that this rate was too high sohe attacked the currency.
Here are the main ideas (numbers just illustrative):1 He (and others) borrowed £ 10 bn, and swap it for DM at the �xed rate- thus getting DM29.5 bn;
2 Repeat this until the UK runs out of foreign reserves3 UK forced to "break the peg" - value of £ will fall (ex. rate falls to£ 1:DM2).
4 Soros can take the DM29.5bn and convert it back into £ at the newrate - £ 14.25 billion.
5 Pay back the borrowed £ 10 billion, with interest of say £ 1bn, and stillmake pro�ts of £ 3.25bn!
If UK did not break the peg - Soros loses the £ 1bn of interest.
Can always beat attack if raise interest rate above the level in Germany.
McMahon (Warwick) Current Crisis 116 / 116

Session 6: Labour Markets
Michael McMahon
University of Warwick
McMahon (University of Warwick) Labour 1 / 38

To Cover
Data and de�nitions
Labor demand, labor supply, and equilibrium employment
Frictional unemployment
Labor market policies: employment protection, unemploymentbene�ts, taxes
E¢ ciency wages
Unions
Monopoly and product market regulation
McMahon (University of Warwick) Labour 2 / 38

Role of the Labour Market
Labour is an important input to production �earns 65%-70% - of thetotal value added;
Labour income most important source of income for most people;
Ability of an economy to get people into jobs absolutely critical (thinkproduction function)...
...yet many economies with high structural unemployment and lowlabor-force participation.
The question to answer is why?
McMahon (University of Warwick) Labour 3 / 38

Labour Market De�nitions I
The Population ChartThe Population Chart
Population
People inthe workingage (16)
Young (and old)
Nonparticipants(education,institutionalised,sick, outsidelabour market)Participants;
Labour Force
Employed
Unemployed
Unemployment rate= Unemployed /Participants
Participation rate= participants /people in theworking age
Labour Force =participants = thoseable, willing &looking for work
McMahon (University of Warwick) Labour 4 / 38

Labour Market De�nitions II
Only around 50% population (297mn) contribute to output
August 2005; Source: Bureau of Labour Statistics
Unemployment rate = 5%
(100*7.5mn/(142mn+7.5mn)
Participation rate = 78%
(=100*(142mn+7.5mn)/(142mn+7.5mn+39.8mn))
142.1
7.539.8
36.8
107.7
Employed Unemployed Not participating <65 >65 <16, military, prison
McMahon (University of Warwick) Labour 5 / 38

Pre-Crisis Participation Rates
0
10
20
30
40
50
60
70
80
90
Wor
ld
Low
inco
me
Mid
dle
inco
me
Hig
h in
com
e
Fran
ce
Ger
man
y
Uni
ted
Kin
gdom
Uni
ted
Stat
es
Italy
Japa
n
McMahon (University of Warwick) Labour 6 / 38

Pre-Crisis Unemployment Across the OECD
0
2
4
6
8
10
12
14
16
18
20
Poland
Spain
France
Turkey
German
y
EURO 12 co
untrie
s
Finlan
d
Czech
Rep
ublic
Belgium Ita
ly
Canad
a
Portug
al
OECD Total
Hunga
ry
Austria
Australi
a
Denmark
United
States
Sweden
Netherl
ands
United
Kingdo
mJa
pan
Norway
Irelan
d
Luxembo
urg
New Zea
land
Switzerl
and
Repub
lic of
Kore
a
Icelan
d
McMahon (University of Warwick) Labour 7 / 38

Pre-Crisis Unemployment Across the non-OECD
0
5
10
15
20
25
Aze
rbai
jan
Gua
tem
ala
Cypr
us
Hon
dura
s
Mal
aysia
Chin
a
Sing
apor
e
Hun
gary
Slov
enia
El S
alva
dor
Costa
Ric
a
Mal
ta
Chile
Rom
ania
Russ
ian
Fede
ratio
n
Peru
Sri L
anka
Indo
nesia
Ecua
dor
Ukr
aine
Barb
ados
Isra
el
Mor
occo
Syria
n A
rab
Repu
blic
Geo
rgia
Iran
, Isl
amic
Rep
.
Puer
to R
ico
Croa
tia
Alb
ania
Ven
ezue
la, R
B
Bulg
aria
Slov
ak R
epub
lic
Uru
guay
Arg
entin
a
McMahon (University of Warwick) Labour 8 / 38
Other Factors Correlated with Unemployment Rates
The rates of unemployment do not just vary across country.
Within countries, many factors are important:
AgeEducationGender
McMahon (University of Warwick) Labour 9 / 38

Overnight Problem
ProblemContinuing to look at the overnight problem - discussion of the issuesencountered and some time to work on the data with my help.
McMahon (University of Warwick) Labour 10 / 38

Labour Demand ITo hire or not to hire
Depends on impact on pro�ts:
Hire additional worker to increase revenue:
Output increases = MPL (marginal product of labour)Output is sold at the price p) E¤ect on revenue is p �MPL
Increases costs:
wage (w) is paid
Decision:
If MPL > wp : then hire workers
If MPL = wp : do nothing
If MPL < wp �re workers
McMahon (University of Warwick) Labour 11 / 38
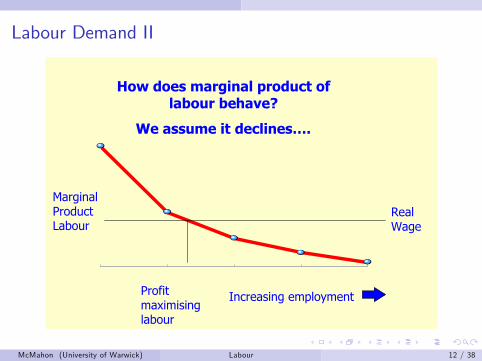
Labour Demand II
How does marginal product oflabour behave?
We assume it declines….
Increasing employment
MarginalProductLabour
RealWage
Profitmaximisinglabour
McMahon (University of Warwick) Labour 12 / 38

Labour Demand III
The Labour Demand Curve
RealWages
Increasing employment
From profit maximisingbehaviour get a negativerelationship betweenlabour demand and realwage
Labour Demand curve
McMahon (University of Warwick) Labour 13 / 38

Labour Supply I
Rising wages have two e¤ects on the amount that people are willing towork:
Income e¤ect:
Higher wage means people have more income and want to buy more ofall goods, including leisure.This e¤ect leads to lower employment
Substitution e¤ect:
Higher wage means price of leisure (lost income) is higher and soconsume less leisure.Tends to increase employment
End result depends on which of these dominates.
McMahon (University of Warwick) Labour 14 / 38

Labour Supply II
RealWage
Labour Supply
Substitution effectdominates andhigher wages meanincreased laboursupply...
Labour Supply
RealWage
Income effectdominates and laboursupply falls withhigher wages
RealWage
Labour SupplyIncome and substitution effect cancelout and labour supply constant
Three Examples...
McMahon (University of Warwick) Labour 15 / 38

Equilibrium
Employment
Labour Demand
Labour Supply
wage
rate
W*
E* Employment
Labour Demand
Labour Supply
wage
rate
W*
E*
So no unemployment?
McMahon (University of Warwick) Labour 16 / 38

Overnight Problem
ProblemContinuing to look at the overnight problem - discussion of the issuesencountered and some time to work on the data with my help.
McMahon (University of Warwick) Labour 17 / 38

Frictional Unemployment IOne answer is to note that the model actually does not say that thereis no unemploymentIt says the number of jobs available is equal to the number of willingworkers, but it does not say that jobs and workers have found eachotherThe labor market works by searching and matching and both take lotsof timeThere will always be some unemployment due to search and matchingfrictions
The original people associated with this idea are Mortensen andPissarides.We need to think about job �ows:
the rates at which workers lose their jobs (�ows into unemployment)the rates at which they �nd jobs (�ows out of unemployment)
McMahon (University of Warwick) Labour 18 / 38

Frictional Unemployment IIThe Flows
Flows from employment to unemployment (layo¤s):
Happens when companies scale down, close down, or when a particularemployee under-performs.To make things simple, we assume that it is a �xed fraction �d�of theemployed.d is known as the separation rate
)The �ow from employment to unemployment is d � E .
McMahon (University of Warwick) Labour 19 / 38
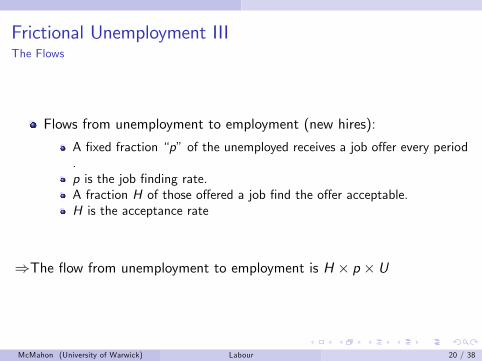
Frictional Unemployment IIIThe Flows
Flows from unemployment to employment (new hires):
A �xed fraction �p�of the unemployed receives a job o¤er every period.p is the job �nding rate.A fraction H of those o¤ered a job �nd the o¤er acceptable.H is the acceptance rate
)The �ow from unemployment to employment is H � p � U
McMahon (University of Warwick) Labour 20 / 38

Frictional Unemployment IV
UNEMPLOYED = U
EMPLOYED = E
Employedworkers thatloose theirjobs
Unemployedthat find newacceptablejobs
= d*E = H*p*U
McMahon (University of Warwick) Labour 21 / 38

Frictional Unemployment VSolving the Model
1 Rewrite the �ows into unemployment:
d � E = d � (F � U)
where F is the labor force.2 So now we have both �ows (in and out) in terms of U:
1 d � (F � U)2 H � p � U is �ow out . . .
3 We can plot these to �nd equilibrium (where �ows in = �ows out).
McMahon (University of Warwick) Labour 22 / 38

Frictional Unemployment VI
U
HpU (flow out)dFdU (flow in)dF
U=FU*U
HpU (flow out)dFdU (flow in)dF
U=FU*
McMahon (University of Warwick) Labour 23 / 38
Frictional Unemployment VII
U �F is sometimes called The Natural Rate of Unemployment:
it is the value of U�F at which the �ows in and out of employment
balance out in the frictional unemployment model
Frictional unemployment is:
increasing in the separation rate ddecreasing in the job-�nding rate pdecreasing in the acceptance rate H
McMahon (University of Warwick) Labour 24 / 38

Labour Market Regulation IEmployment Protection Legislation
This search and matching model is useful for thinking about employmentprotection legislation:
Two key determinants of unemployment: p and d .
Employment protection tries to reduce unemployment by lowering d -reducing separation rate
This will work so long as p does not change
But employment protection may also reduce p
�rms have to take account of expected �ring costs when they try andhire individualsthe larger the severance package, the less likely that �rms will hire newworkers
Therefore EPL should lower hire rate and the �ring rate but e¤ect onunemployment is unambiguous
McMahon (University of Warwick) Labour 25 / 38
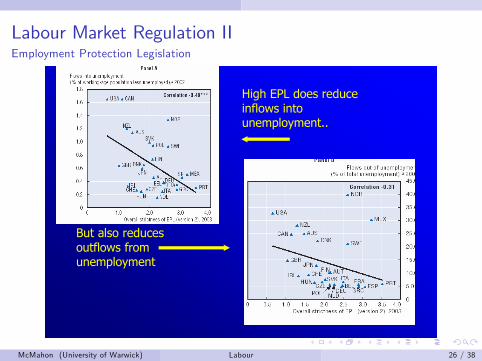
Labour Market Regulation IIEmployment Protection Legislation
High EPL does reduceinflows intounemployment..
But also reducesoutflows fromunemployment
McMahon (University of Warwick) Labour 26 / 38
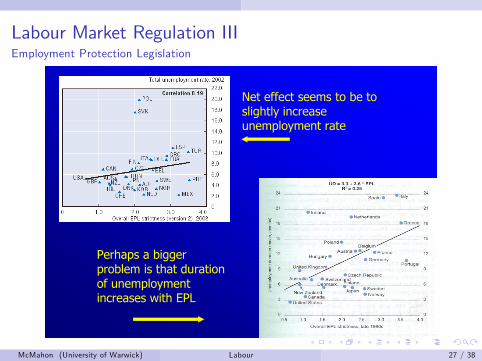
Labour Market Regulation IIIEmployment Protection Legislation
Net effect seems to be toslightly increaseunemployment rate
Perhaps a biggerproblem is that durationof unemploymentincreases with EPL
McMahon (University of Warwick) Labour 27 / 38

Labour Market Regulation IVEmployment Protection Legislation
The long unemployment spellsimply that many discouragedworkers abandon the labourforce altogether. This probablyexplain why we find strongerevidence that high EPL leads tolower employment rates (=employment / workingagepopulation)
McMahon (University of Warwick) Labour 28 / 38

Labour Market Regulation VEmployment Protection Legislation
Average job tenure increaseswith EPL
McMahon (University of Warwick) Labour 29 / 38
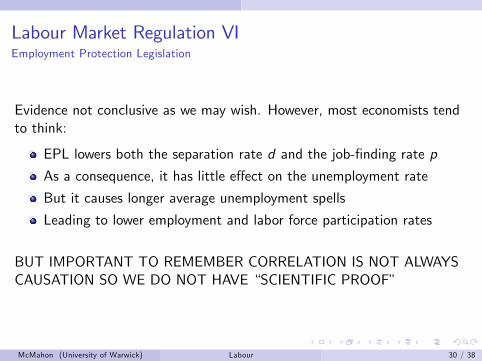
Labour Market Regulation VIEmployment Protection Legislation
Evidence not conclusive as we may wish. However, most economists tendto think:
EPL lowers both the separation rate d and the job-�nding rate p
As a consequence, it has little e¤ect on the unemployment rate
But it causes longer average unemployment spells
Leading to lower employment and labor force participation rates
BUT IMPORTANT TO REMEMBER CORRELATION IS NOT ALWAYSCAUSATION SO WE DO NOT HAVE �SCIENTIFIC PROOF�
McMahon (University of Warwick) Labour 30 / 38

E¢ ciency Wages IWe assumed workers are paid their marginal product
can only be done if employers can perfectly observe the marginalproduct of their employees.this is often not the case.
Furthermore, there are types of jobs in which �even if the marginalproduct was fully observable �employers might not wish to paycertain type of employees by their marginal products:
1 �Gift exchange� (the carrot):Employees that feel that their employers treat them well by payingthem a high salary will in exchange deliver high e¤ort and therefore beproductive.
2 �Shirking� (the stick):If e¤ort is hard to measure directly, paying a high salary is a way tomotivate the employees to put in high e¤ort: If you�re caught shirking,you will have to �nd another worse paid job.
) In such cases, it could be in employers best interest to pay employeesabove market clearing salaries.McMahon (University of Warwick) Labour 31 / 38

E¢ ciency Wages II
“Efficiency” Wages
Real salary
Effort
Effort Curve
Efficiency wage
S*Effort curve shows workers’ effort,initially increasing steeply with realwages; above a certain point, themotivational factor levels out.
The effort per dollar salary paid bythe firm is the slope of a line fromthe origin to any point on thecurve. At S*, the maximum effortper dollar paid is reached
McMahon (University of Warwick) Labour 32 / 38

E¢ ciency Wages IIIE¢ ciency wages can explain:
Why workers in jobs where e¤ort cannot continuously be monitoredstill supply e¤ort.
Why employers might be hesitant to lower wages even when demandfor their output diminishes
paying lower wages lowers e¤ort.it explains real wage rigidity.
Why there is involuntary unemployment:
Firms pay above market clearing wages.
What is important is that
1 salary is related to a motivational factor, an aspect that is clearlyrelevant in many types of jobs
2 pay is not directly performance related.
McMahon (University of Warwick) Labour 33 / 38

E¢ ciency Wages IV
Efficiency Wages and Involuntary Unemployment
Employment
Labour Demand
Labour Supply
Wage rate
E*
Wefficiencyunemployment
Efficiency wages lead toinvoluntary unemployment aslabour supply exceeds labourdemand at the efficiency wage
McMahon (University of Warwick) Labour 34 / 38

Labour Reform in GCC I
We already discussed the issue of labour markets as a motivation fordiversi�cation e¤ort.
The labour markets in the GCC still face a major challenge:
eliminate the segmentation of the labor force along skills, wages, andsector of employment lines, without impairing the economy�scompetitiveness, in particular of the private sector, which is expectedto create most of the new jobs in the coming years;
generate employment for nationals
increase the share of local workers in the private sector.
McMahon (University of Warwick) Labour 35 / 38

Labour Reform in GCC II
Current measures include a mix of administrative (quotas), market-based(fees and taxes for the use of expatriate labour) and supply-side(modernization of educational system) policies:
Improvement in vocational and training systems
Modernization of educational system
Creation of a national labor database to facilitate job search
Enforcement of quotas for nationals working in the private sector
Taxation of foreign workers (training tax)
McMahon (University of Warwick) Labour 36 / 38

Labour Reform in GCC III
UAE National Human Resource Development and EmploymentAuthority and a national labor market database.
Qatar No longer guarantees employment for Qatari graduates.Improved search and training available.
Saudi Arabia Human Resources Development Fund (HRDF) to train locallabour force (private sector partly funds it). Developed adatabase for matching and placement of local workers withprivate �rms.
McMahon (University of Warwick) Labour 37 / 38

END
McMahon (University of Warwick) Labour 38 / 38
Session 7: The Economics of Oil
Michael McMahon
University of Warwick
McMahon (University of Warwick) Oil 1 / 10

To Cover
1 The basics of the economics of oil2 The impact of oil prices on oil-importing countries - AS-AD model3 Oil and the need for diversi�cation
McMahon (University of Warwick) Oil 2 / 10

The Basic Economics of Oil
ProblemOil, like any commodity, good or service, can be thought of in terms ofsimple supply and demand. Using a supply and demand framework,consider the following issues:
1 Is there anything di¤erent the oil supply curve? What happens to thesupply curve over time?
2 What happens to the price of oil when:
1 supplies are disrupted2 a newly industrializing country (like China) emerges demand changes
McMahon (University of Warwick) Oil 3 / 10

An AS-AD Analysis Of The E¤ects of Oil Shocks I
Y
P
SRAS
ADequilibrium
level ofincome
LRAS
Y*
McMahon (University of Warwick) Oil 4 / 10

An AS-AD Analysis Of The E¤ects of Oil Shocks I
Y
P
equilibriumlevel ofincome
LRAS
Y*
AD
Y1
SRAS’’
McMahon (University of Warwick) Oil 4 / 10
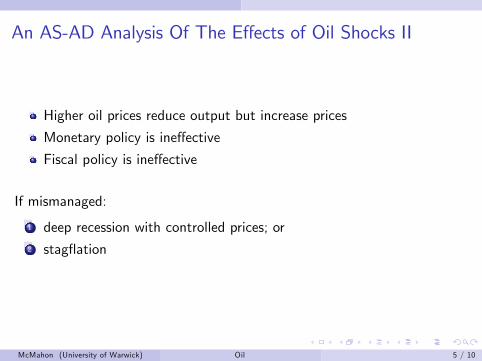
An AS-AD Analysis Of The E¤ects of Oil Shocks II
Higher oil prices reduce output but increase prices
Monetary policy is ine¤ective
Fiscal policy is ine¤ective
If mismanaged:
1 deep recession with controlled prices; or2 stag�ation
McMahon (University of Warwick) Oil 5 / 10
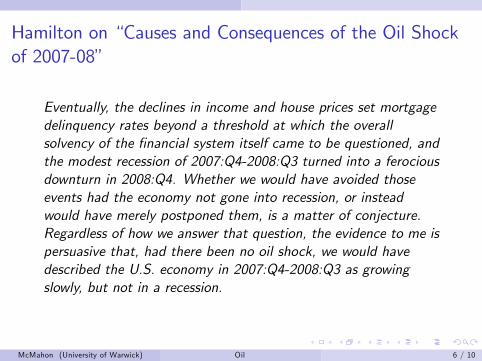
Hamilton on �Causes and Consequences of the Oil Shockof 2007-08�
Eventually, the declines in income and house prices set mortgagedelinquency rates beyond a threshold at which the overallsolvency of the �nancial system itself came to be questioned, andthe modest recession of 2007:Q4-2008:Q3 turned into a ferociousdownturn in 2008:Q4. Whether we would have avoided thoseevents had the economy not gone into recession, or insteadwould have merely postponed them, is a matter of conjecture.Regardless of how we answer that question, the evidence to me ispersuasive that, had there been no oil shock, we would havedescribed the U.S. economy in 2007:Q4-2008:Q3 as growingslowly, but not in a recession.
McMahon (University of Warwick) Oil 6 / 10

Oil Taxation in Western Economies
McMahon (University of Warwick) Oil 7 / 10

Oil Taxation in Western Economies II
The "Pigou club" want to see higher US oil taxes
ProblemDiscuss the issues raised in the manifesto of the Pigou club:http: // gregmankiw. blogspot. com/ 2006/ 10/pigou-club-manifesto. html
McMahon (University of Warwick) Oil 8 / 10

Link from oil markets to the need for diversi�cation in theGCC
1 Volatile export commodity2 Finite natural resource3 Kyoto implementation
McMahon (University of Warwick) Oil 9 / 10

Impact of Kyoto Protocol Implementation on Oil-Producers
Costs depend on the exact way that proposals are implemented
OWEM model of OPEC Secretariat predicts cumulative losses over2002-2010:
No trade, weak price = �$56bnNo trade, reference price = �$19.1bnGlobal trade, reference price = �$9.4bn
The global movement toward cleaner fuels is likely to gather momentumand therefore oil-producing countries need to diversify while they havesome revenue still coming in.
McMahon (University of Warwick) Oil 10 / 10

Session 8: Customs and Currency Unions
Michael McMahon
University of Warwick
McMahon (University of Warwick) Unions 1 / 22

Economic Unions I
There are a large number of economic unions around the world including:
European Union (EU)
South African Development Community (SADC)
South African Customs Union (SACU)
Arab-African Union (AAU)
Arab Cooperation Council (ACC)
Gulf Cooperation Council (GCC)North American Free Trade Area (NAFTA)
Organisation for Petroleum Exporting Countries (OPEC)
McMahon (University of Warwick) Unions 2 / 22

Economic Unions II
These unions di¤er in their level of integration.
Even the EU has only gradually become more integrated:
Level of integration Main features PeriodFree trade area Free trade among members 1958 to the early 1960sCustoms union Free trade with a common external tari¤ 1958 until 1993Common market Free mobility of factors across members 1993-1999Economic union Harmonization of economic policy 1993, 1999Monetary Union Common currency 1999; Notes in 2002Economic integration Completely uni�ed economic policy Not yet achieved
McMahon (University of Warwick) Unions 3 / 22

The Bene�ts of Economic Unions
Stop wars!
Better use of existing resources (allocation e¤ects)
Specialisation (comparative advantage)Price e¤ects (intensi�ed competition)Quantity e¤ects �IRTS
Better spatial distribution of existing resources (location e¤ects)
Accumulate more resources (growth e¤ects)
Strategic e¤ects
Greater negotiating power (WTO)Better Terms of Trade
Monetary Unions later.
McMahon (University of Warwick) Unions 4 / 22

Preferential Trade Agreements(PTA) Welfare Analysis
Assumptions
Small country in a small customs union (i.e. �at world supply curve);
P0 is the price in home (H) when no trade takes place.
Pp is the supply price of the partner country (P).
Pw is the supply price of the world.
H and P form a customs union with common external tari¤ t.
P0 � Pp � Pwt � (P0� Pw) () Pp � Pw and t cannot exceed P0� Pw).
McMahon (University of Warwick) Unions 5 / 22

Preferential Trade Agreements(PTA) Welfare Analysis
1 Before the customs union, the price that the good is sold at in thehome market is always:
P0 �!for goods produced at HomePp + t �!for goods produced in the Partner countryPw + t �!for goods produced in the rest of the world
2 After the customs union, the equivalent prices that the good is sold atin the home market is:
P0Pp (since the tari¤ no longer applies to goods from the partnercountry)Pw + t (the tari¤ still applies to these goods).
McMahon (University of Warwick) Unions 6 / 22
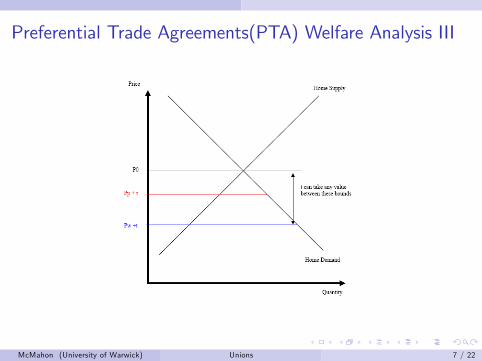
Preferential Trade Agreements(PTA) Welfare Analysis III
McMahon (University of Warwick) Unions 7 / 22

Preferential Trade Agreements(PTA) Welfare Analysis IVt < Pp � Pw )tari¤ does not close the e¢ ciency gap between Partner(P) and rest of world (W).
McMahon (University of Warwick) Unions 8 / 22

Preferential Trade Agreements(PTA) Welfare Analysis IVt > Pp � Pw )trade creation and trade diversion.
McMahon (University of Warwick) Unions 9 / 22

Preferential Trade Agreements(PTA) Welfare Analysis V
Preferential trade arrangements tend to lower domestic prices andraise imports
Discrimination produces supply switching
Welfare impact ambiguous for members of PTA if removing rentcreating barriers (the EU until mid 1970s)
Welfare impact positive for members when removing frictional barriers(recent EU)
Impact on excluded nations?
Very important to understand enlargement dynamic
McMahon (University of Warwick) Unions 10 / 22

E¤ects on Competition I
Trade reduces monopoly power:
International trade in goods
)increased competition in local marketsSmall domestic market supports few �rms in IRTS sectors
Small number of �rms un-competitive and charge higher prices
Competition from imports restrains monopoly power
McMahon (University of Warwick) Unions 11 / 22

E¤ects on Competition II
Integration intensi�es competition:
Reduces �rms monopoly power
They cut prices (just seen this)
Some �rms exit so that lower prices are o¤set by larger scale ofproduction
A pro-competitive e¤ect lowers prices
An economy of scale e¤ect reduces resource costs
Bottom line: Increased competition and restructuring could lead to bigwelfare gains, but two big policy issues arise:
1 How to ensure big �rms compete instead of collude2 Do states prevent the necessary adjustments?
McMahon (University of Warwick) Unions 12 / 22

E¤ects of State Aid and Collusion I
Pro�t losing �rms should leave the industry:
Bought outMergedBankrupt
Involves adjustments of �rms and workers
Government may give subsidies to loss making �rms to preventadjustment
EU calls these subsidies state aids
To protect the gains to the EU project, 1957 treaty of Rome bans StateAids that give unfair advantage.European Commission is in sole charge of enforcing prohibition (so nopolitics).
McMahon (University of Warwick) Unions 13 / 22

E¤ects of State Aid and Collusion II
Other justi�cations for state aid:
Protect mature industries (why?)
Promote sectors strategic for growth (e.g. high tech)
Special characteristics of disadvantaged sectors (e.g. agriculture)
Protect sectors important for national security and defence
To protect employment
Retaliation against other countries policies
Strategic pro�t-maximizing policies
McMahon (University of Warwick) Unions 14 / 22

E¤ects of State Aid and Collusion III
A similar argument applies to collusion:
If �rms don�t compete, then prices don�t come down
gains are lost.
European Commission polices competition between �rms too.
Both have an important supranational element
McMahon (University of Warwick) Unions 15 / 22

Location E¤ects
Economic geography concerns the geographic concentration ofeconomic activity.
In EU, people located in the core enjoy higher incomes and lowerunemployment rates
Industry less geographically concentrated in the EU than in US:
EU: 4 members have 50% man emp, 21% surface and 45% populationUS: 15 states have 50% man emp, 11% surface and 21% population
Income disparities across EU15 member states are much wider thanacross US states:
EU15: 25% pop in objective one regions (GRPpc<75% EU average)US: 2% pop in states with (GSPpc<75% US average)
McMahon (University of Warwick) Unions 16 / 22

Location E¤ects II
Economic geography concerns the geographic concentration ofeconomic activity.
In EU, people located in the core enjoy higher incomes and lowerunemployment rates
Industry less geographically concentrated in the EU than in US:
EU: 4 members have 50% man emp, 21% surface and 45% populationUS: 15 states have 50% man emp, 11% surface and 21% population
Income disparities across EU15 member states are much wider thanacross US states:
EU15: 25% pop in objective one regions (GRPpc<75% EU average)US: 2% pop in states with (GSPpc<75% US average)
McMahon (University of Warwick) Unions 17 / 22

Location E¤ects III
Traditional explanations
Specialisation patterns can be explained by countries having . . .
Di¤erent technologiesDi¤erent endowmentsDi¤erent geographies
. . . and thinking through the allocation e¤ects we have already talkedabout [These characteristics were implicit reason why costs and pricedi¤er across countries for allocation e¤ects]
McMahon (University of Warwick) Unions 18 / 22

Location E¤ects IIIAgglomeration models allow for factor mobility and can generateclustering of particular sectors or overall activities;New Economic Geography, one of the reasons Paul Krugman won theNobel Prize this year, focus on the role of �rm level scale economiesand transaction costs:
With IRS, prefer to build one plant;Bene�ts of locating in large market:
Cost linkagesDemand linkagese.g. from selling to consumers [Krugman] or input-output linkages[Venables]
Costs of locating in large marketProduct market competitionFactor market competition
Changing transport costs can change the balance of agglomeration anddispersion forces
product market competition from the other market increases astransport costs fall and so dispersion force less strong
McMahon (University of Warwick) Unions 19 / 22

Bene�ts Of A Common Currency
The main bene�ts of joining the single currency are:
1 the reduction in transactions cost of changing currency;2 the reduction of exchange risk leading to greater trade and foreigninvestment with the rest of Europe;
3 lower risk premium embodied in the cost of raising capital;4 increased transparency in price comparison;5 Monetary policy credibility gains for some countries.
McMahon (University of Warwick) Unions 20 / 22
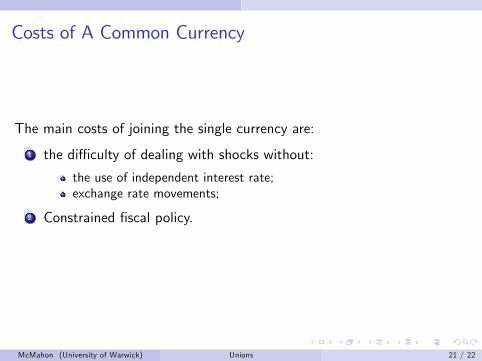
Costs of A Common Currency
The main costs of joining the single currency are:
1 the di¢ culty of dealing with shocks without:
the use of independent interest rate;exchange rate movements;
2 Constrained �scal policy.
McMahon (University of Warwick) Unions 21 / 22

END
McMahon (University of Warwick) Unions 22 / 22