session 4: six sigma - ihi home · pdf filesession 4: six sigma ... central valley area and as...
TRANSCRIPT
11/6/2012
1
Session 4: Six Sigma
Dennis DeasSenior Director Clinical and Operational Improvement Implementation Team,
The Center for Health System Performance, Care Management Institute, Kaiser Permanente
Ryan StanleyDirector of Performance Excellence for the Kaiser Permanente Fresno Service Area
Celia RyanArea Quality Leader for the Fresno Kaiser Permanente Hospital and Health Plan
Tuesday, November 6, 2012
Today’s presenters have nothing to disclose
WebEx Quick Reference
• Welcome to today’s session!
• Please use Chat to “All
Participants” for questions
• For technology issues only,
please Chat to “Host”
• WebEx Technical Support:
866-569-3239
• Dial-in Info: Communicate /
Join Teleconference (in menu)
Raise your hand
Select Chat recipient
Enter Text

11/6/2012
2
When Chatting…
Please send your message to
All Participants
If you’re joining with colleagues, please type the organization you represent & the number of
people joining from your organization.
Example: Midwest Health Alliance – 3
Please type your name and the organization you represent in the chat box!
Example: Chris Jones, Midwest Health Alliance

11/6/2012
3
IHI Expedition Team
Kayla DeVincentis
Project Coordinator, IHI
Jill Duncan, RN, MS, MPH
Director, IHI
Today’s Faculty
Dennis Deas is a Senior Director for Kaiser Permanente’s Department of Care and Service Quality, responsible for leading the Performance
Improvement implementation throughout the company. He has over 25 years of diversified
experience in performance, process improvement and business transformation. He’s been with KP for 7 years. He has worked as a Senior Manager, Principal, and Director for several large external consulting firms including Cap Gemini, Ernst &
Young, Gemini Consulting, and Accenture. Dennis served in the US Air Force as a Management Engineer for 20 years. He has a MBA in Business Administration, Master Black Belt in Lean Six Sigma, and is Accelerated Implementation
Methodology (AIM) certified.
11/6/2012
4
Today’s Faculty
Ryan Stanley is the Director of Performance Excellence for the Kaiser Permanente Fresno Service Area and is responsible for facilitating the development, management, and implementation of the medical centers performance improvement strategy. His previous healthcare experience is as the Director of Performance Excellence for the Kaiser Permanente Central Valley Area and as a Lean Six Sigma Master Black Belt for both the Providence Healthcare System in Los Angeles and the Adventist Healthcare System Central Valley Network. He holds a B.A. from the University of California, Los Angeles and an M.B.A. from Pepperdine University. He is a certified Lean Six Sigma Master Black Belt whose aspiration is to become an influential leader by motivating others in performance improvement work to promote quality, patient safety, and satisfaction.
Today’s Faculty
Celia Ryan has been the Area Quality Leader for the Fresno Kaiser Permanente Hospital and Health Plan for the past two years. In this position she has responsibility for strategic planning and oversight of quality; patient safety and risk management; and accreditation, regulation, and licensing for the Fresno Service Area, which includes a l69 bed hospital and several medical offices. During this time, she has taken a lead role in improving the safety culture at the medical center. She has partnered with The Permanente Medical Group in implementing a program to evaluate and address the causes and outcomes of disruptive behavior. She has also been instrumental in creating a Patient Safety Advisory Committee to incorporate the voice of the patient in discussions related to the design of safe care.
She is a Registered Nurse who started her career in critical care. She assisted in the creation of a hospital based home health company, which included home care, hospice, infusion, and DME. She has held management and leadership positions in acute care for the past 31 years.

11/6/2012
5
Agenda
• Welcome
• Session 3 ‘Homework’ Review
─ Jill Duncan, Director, IHI
• Six Sigma
─ Dennis Deas, Senior Director Clinical and Operational Improvement
Implementation Team, The Center for Health System Performance,
Care Management Institute, Kaiser Permanente
• Safe Culture─ Ryan Stanley, Director of Performance Excellence
─ Celia Ryan, Area Quality Leader
• Resources & Next Steps
─ Jill Duncan, Director, IHI
Expedition ObjectivesParticipants will be able to . . .
• Describe the similarities and differences among Lean, Six Sigma (which includes DMAIC) and the Model for
Improvement.
• Determine which approach(es) are most appropriate for their organization.
• Initiate a plan to build an integrated quality improvement strategy.
• Define a customized approach for crafting projects and
hardwiring discipline into improvement processes across participant’s organization.
• Plan small tests of change they can test throughout the
Expedition.
11/6/2012
6
Session 3 Homework Review
Assess the behaviors in your organization
‘Tweet’ and share the most surprising thing you learn from the self-assessment exercise
Send ‘Tweet-like’ summary of 140 characters or less to Jill at
[email protected] by Friday, November 2nd
Homework Example

11/6/2012
7
There were no “surprises”, but this is another excellent tool to guide the organization toward a culture of
continual improvement. This tool provides more detail on the types of behaviors we are seeking for our
managers and leaders. It will be a very useful self-assessment for our staff, helping them rethink their role
in the organization and what types of behaviors we are seeking. The close alignment of this tool with the
Caldwell Butler consulting approach introduced into our organization approximately 5 months ago will make
this a useful tool for us. While in many areas we are organizationally in our infancy, we are heading in the right
direction.
Wendy Manners
I love this tool! Connecting behavioral indicators with outcome measures is a great way to get a richer
picture of an organizations opportunities for improvement. For my organization, there were not a lot of
surprises as we are a very young organization as far as a systematic approach to improvement.
Christianna B. Orvis
Director of Education
Gulf Coast Medical Center
I like the ideas and points this assessment tool brings forward however there are a few barriers to some of
the points. For example, one point was that “improvement ideas are processed quickly (within 2 weeks)”. I
am all for this however, when a system puts an expectation on the leadership to take on multiple quality
improvement projects (3-5) at once, it’s very difficult to focus on one and thoroughly see it through within a
reasonable time. This point also challenges the point that “Leaders and managers follow standard work and
are routinely seen out of the offices and in the work areas”. I love doing this but It’s difficult to position
yourself within the workflow when you are saturated with meetings so that the quality improvement projects
get accomplished.
I guess the key is for upper management to recognize this and set reasonable goals and timelines so
that mid-management isn’t so saturated. Another help is to run efficient meetings since our time is so
valuable.
Nicole Eddins, PharmD
Director of Pharmacy
Mason General Hospital
Shelton, WA
An opportunity to rethink
the way work is being done

11/6/2012
8
Poll Questions
1. Have you had previous training related to
Six Sigma?
2. Do you have colleagues on your team(s)
that bring Six Sigma expertise to your
current improvement strategy?
Go to Poll
Six Sigma
Dennis Deas

11/6/2012
9
History of Six Sigma & Lean
Bill Smith (1986)
Motorola
Mikel Harry (1988)
Motorola- MAIC
Forrest Breyfogle 111
(1992)- Integration
Michael George
(1991)- Integration
F.Taylor-The Principles
of Scientific
Management (1911)
Toyoda Family Taiichi Ohno 1950-1980
Toyota Production System
Womack & Jones
Reference: Wortman 2001
Manufacturing Companies!
18

11/6/2012
10
19
Process Map
Baseline Data
Cause & Effect
5 Whys
Voice of the Customer
Standardize & Simplify
Reduce Waste
6S
Apply evidence based practice
Training
Policy & Procedures
Spread Plan
KP’s Blended PI Model for Care Delivery
Developed by Associates In Process Improvement
Just Do It IDEO
Innovation
Or
DFSS
Six sigma
N
N N
N
N
Y
YYY
N
N
Y
Y
Y
Is the Solution Known
?
Is Root Cause Known
?
Is it a New
Product or
Process ?
Is Cycle time
Reduction the
Objective ?
Is the Bottleneck Defect Driven
?
Does a Process
Management System
Exist ?
Recognize a Problem
N
Obvious root cause,obvious solution
Rapid Improvement EventObvious root
cause, non-data driven solution
Lean
Performance Improvement Methodology
Assignment
Process Management

11/6/2012
11
We try to start all Improvement Initiatives with a Strategic Driver Diagram to see the System
Then determine which initiatives will be JDI, MFI, Lean, & Six Sigma
Strategy for Six Sigma (DMAIC)
•Relentless focus on the customer
•The idea is not just to make improvements, but to ensure the improvements address critical quality issues—as seen by the customer—and are linked to our business goals. This is done in two ways:
•First, determine what the customer wants (VOC-voice of the customer), the motivation behind it, and how we might satisfy their needs. This is harder than it
may sound because the customer's needs/desires may evolve over time.
•Second, prioritize and quantify improvement opportunities by linking them with the
business priorities (organizational goals).
•And to take it a step further, if we quantify the financial impact on our business strategy, we will make better decisions about how we will expend our limited time and resource in proper prioritization to address the efforts with the most impact first.
11/6/2012
12
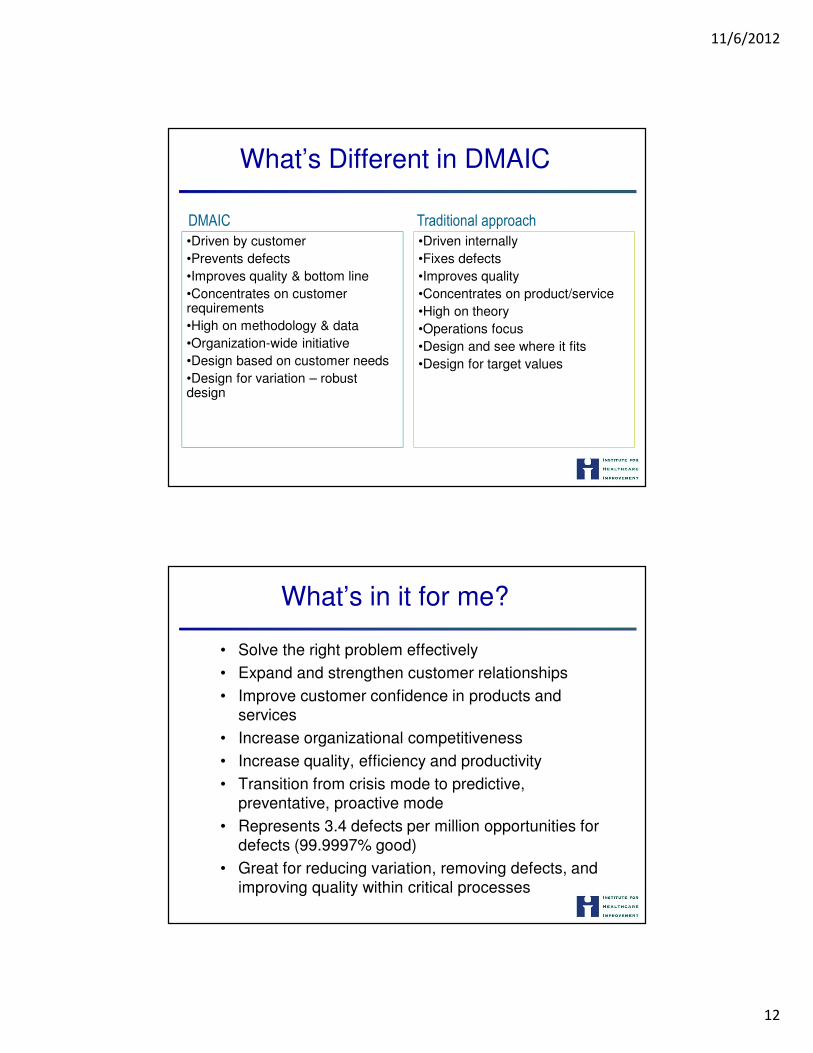
What’s Different in DMAIC
•Driven by customer
•Prevents defects
•Improves quality & bottom line
•Concentrates on customer requirements
•High on methodology & data
•Organization-wide initiative
•Design based on customer needs
•Design for variation – robust design
•Driven internally
•Fixes defects
•Improves quality
•Concentrates on product/service
•High on theory
•Operations focus
•Design and see where it fits
•Design for target values
DMAIC Traditional approach
What’s in it for me?
• Solve the right problem effectively
• Expand and strengthen customer relationships
• Improve customer confidence in products and services
• Increase organizational competitiveness
• Increase quality, efficiency and productivity
• Transition from crisis mode to predictive, preventative, proactive mode
• Represents 3.4 defects per million opportunities for defects (99.9997% good)
• Great for reducing variation, removing defects, and
improving quality within critical processes

11/6/2012
13
What Should be Done First
• What are we trying to accomplish?
─ A succinct description of the project goal and
objectives
• How will we know if a change is an improvement?
─ Identification of outcome, process and
balancing measures
26
DMAIC Roadmap
─ DMAIC focuses on a product or process that is in existence but is not meeting customer specification or is not performing adequately.
─ Define
─Measure
─ Analyze
─ Improve
─ Control

11/6/2012
14
Process Improvement Steps
Hospital Composite of Pneumonia Treatments: 2005 - 2006
Hospital Composite of Surgery Infection Control: 2005 - 2006
“When I was speaking to the National Governors Association, I shared these exact charts with them and they interrupted me with applause.
They applauded because in each case, we obviously identified a problem, measured
the problem, focused on the sources of the problem, and then took steps together as a
team of caregivers to fix the problem. Data was an essential first step in that process”.
George Halvorson, Sept., 07
Define –What are we trying to accomplish?
• Define Customers and Requirements (VOC,CTQs)
• Develop the problem/opportunity statement, scope (in/out of frame), Goals (SMART), objectives and Benefits, timeline (Charter)
• Stakeholder management • Identify Champion, Process Owner and Team
• Define Resources • Evaluate Key Organizational Support
• Develop Project Plan and Milestones • Develop SIPOC (High Level Process Map)• Process mapping
• Affinity diagrams • Kano Model
• CTQ tree

11/6/2012
15
Measure –
How will we know a change is an improvement?
• Define Defect, Opportunity, Unit and Metrics
• Detailed Process Map (Value Stream Map) of Appropriate Areas
• Develop Measurement Plan (Operational definitions, Stratification, sampling, data collection frequency, duration, realistic)
• Balance score carding, link to big goals
• Validate the Measurement System
• Collect the Data
• Remember RIM measures?
Analyze
• Determine Process Capability
• Define Performance Objectives
• Identify Value/Non-Value Added Process Steps
• Identify Sources of Variation (Run chart, Control chart )
• Determine Root Causes (critical X’s)
• Cause and effect/Fishbone/Ishikawa diagram
• Scatter plots
• Hypothesis tests (t-test, paired t-test, ANOVA)
• Chi square, Regression analysis, DOE

11/6/2012
16
Improve
• Develop Potential Solutions
• Define Operating Tolerances of Potential System
• Value stream mapping
• Waste identification
• Critical thinking
• Select solution
• Failure Modes and Effects Analysis (FMEA) of Potential Solutions
• Validate Potential Improvement by Pilot Studies (pilot plan)
• Correct/Re-Evaluate Potential Solution
• Test via PDSA’s
• Cost/benefit analysis
• Cycle time efficiency
• Collect data- input information (number of suppliers, delivery schedules, lead times)
• Collect customer data (number of customers, demand rate, cycle time expectation, cycle efficiency, quality and output expectations)
• Implement improvement plan
Control
• Mistake proof the solution
• Define and Validate Monitoring and Control System
• Standardize Process
• Implement Statistical Process Control
• Determine Process Capability
• Develop Transfer Plan, Handoff to Process Owner
• Verify Benefits, Cost Savings/Avoidance, Profit Growth
• Close Project, Finalize Documentation
• Communicate to Business, Celebrate

11/6/2012
17
Questions?
© C
opyri
ght,
The J
oin
t C
om
mis
sion
Improve Phase Report Out:
Safety Culture
October 3rd, 2012
Ryan Stanley, MBADirector of Performance ExcellenceCelia Ryan, RNArea Quality Leader

11/6/2012
18
© C
opyri
ght,
The J
oin
t C
om
mis
sion
Define Recap (1)
� Goals:
–Metric 1: Closed loop-50% decrease in the deficit
between baseline rate and 100%
–Metric 2: Quality of loop-Decrease/Eliminate %
problematic response (1, 2, 3)
–Metric 3: SOS-Decrease/Eliminate % problematic
response (1, 2, 3, 4)
� Unit of Improvement: Unsafe conditions/behaviors
� Defect: Unsafe conditions/behaviors that are not addressed
prior to reaching patients/staff.
© C
opyri
ght,
The J
oin
t C
om
mis
sion

11/6/2012
19
© C
opyri
ght,
The J
oin
t C
om
mis
sion
VOC: Teamwork Climate-Perinatal
© C
opyri
ght,
The J
oin
t C
om
mis
sion
VOC: Safety Climate-Perinatal

11/6/2012
20
© C
opyri
ght,
The J
oin
t C
om
mis
sion
Measure Recap (1)
Metric #1: Closed Loop Baseline
© C
opyri
ght,
The J
oin
t C
om
mis
sion
Measure Recap (2)Metric 2: Quality of Loop % Problematic Responses
68%
68%
68%
0% 10% 20% 30% 40% 50% 60% 70% 80%
1
2
3
% Problematic Responses
% Problematic Responses

11/6/2012
21
© C
opyri
ght,
The J
oin
t C
om
mis
sion
Measure Recap (3)
Metric 3: SOS % Problematic Responses
21%
41%
47%
13%
28%
47%
36%
35%
53%
0% 10% 20% 30% 40% 50% 60%
1
2
3
4
5
6
7
8
9
% Problematic Responses
% Problematic Responses
© C
opyri
ght,
The J
oin
t C
om
mis
sion
Metric #1 Baseline Capability Analysis

11/6/2012
22
© C
opyri
ght,
The J
oin
t C
om
mis
sion
Ongoing Data Collection Plan
Measure Operational
Definition(How is the measure calculated?)
Type (output, input)
Data Collection Plan (How will
you collect data & how frequently)RRF Closed Feedback Loop (%) # of RRF Closed / Total # of RRF Reported Output MIDAS / Monthly Quality of Closed Loop (%) Problematic Response Survey Design (3 Questions)1) Action will prevent future harm2) Action is taken to address event3) Degree issue was heard Output Survey attached to each RRF eventSOS Tool(%) Problematic Response
Survey Design (9 Questions) Output Annual SurveyAnonymous Reporting # of events reported
anonymously / Total # of RRF reported
Input MIDAS / Collected with each RRF event reported
© C
opyri
ght,
The J
oin
t C
om
mis
sion
Ongoing Data Collection Plan (cont.)
Measure Operational
Definition(How is the measure calculated?)
Type (output, input)
Data Collection Plan (How will
you collect data & how frequently)
Perception reporting is an RN function
# of RRF reported by RN / total # of RRF reported Input MIDAS / Collected with each RRF reportedMD Notification # of MD notified of reported RRF / Total # of RRF reported requiring MD notification Input MIDAS / Collected with each RRF reportedLack of follow through on action plan
# of RRF Investigations completed <14 days
Management Investigation to RRF closure
Input MIDAS / Collected with each RRF reportedDisagreements are resolved appropriately / Lack of confidence in resolution
# of positive responses / total # of responses
Input SAQ SurveyStaff Fear Total # of people reporting / Total
# of opportunity
Input MIDAS / Collected with each RRF reported

11/6/2012
23
© C
opyri
ght,
The J
oin
t C
om
mis
sion
108 92 92 88 70 5421.4%39.7%
57.9%75.4%
89.3%
0.0%10.0%20.0%30.0%40.0%50.0%60.0%70.0%80.0%90.0%100.0%
0100200300400500
Sco
re
Categories
Score
Data Analysis & Collection Plan
Process Map
C&E Matrix
Statistically Validated
Factors:1. Lack of follow through
on action plan (p=0.000)
2. Anonymous Reporting
(p=0.914)
3. MD Notification (p =
0.567)
1. Communication(C&E Matrix: 88)
2. Staff Fear (C&E Matrix: 70)
3. Lack of confidence in resolution
(C&E Matrix: 92)
Key factors to focus:1. Lack of follow through on
action plan2. Communication3. Staff Fear4. Lack of confidence in
resolution
Key Process Inputs
Pareto Chart Ranking of Key Process Inputs
© C
opyri
ght,
The J
oin
t C
om
mis
sion
46
Detailed Root Cause Validation
Input
Variable (x)
Null Hypothesis Analysis result: p-value &
conclusions
Anonymous
reporting
Lack of follow
through on
action plan
MD Notification
1. Anonymous reporting has no
effect on loop closure
2. Lack of follow through on
action plan has no effect on
loop closure
3. MD notification has no effect on
loop closure
Chi-Square (p=0.914) FAIL TO REJECT NULL
HYPOTHESIS
Anonymous reporting is not statistically
significant to closed loop
2 Proportions Test (p=0.000) REJECT NULL
HYPOTHESIS
Lack of follow through on action plan is
statistically significant to loop closure
Chi-Square (p=0.567) FAIL TO REJECT NULL
HYPOTHESIS
MD notification is not statistically significant to
closed loop
11/6/2012
24
© C
opyri
ght,
The J
oin
t C
om
mis
sion
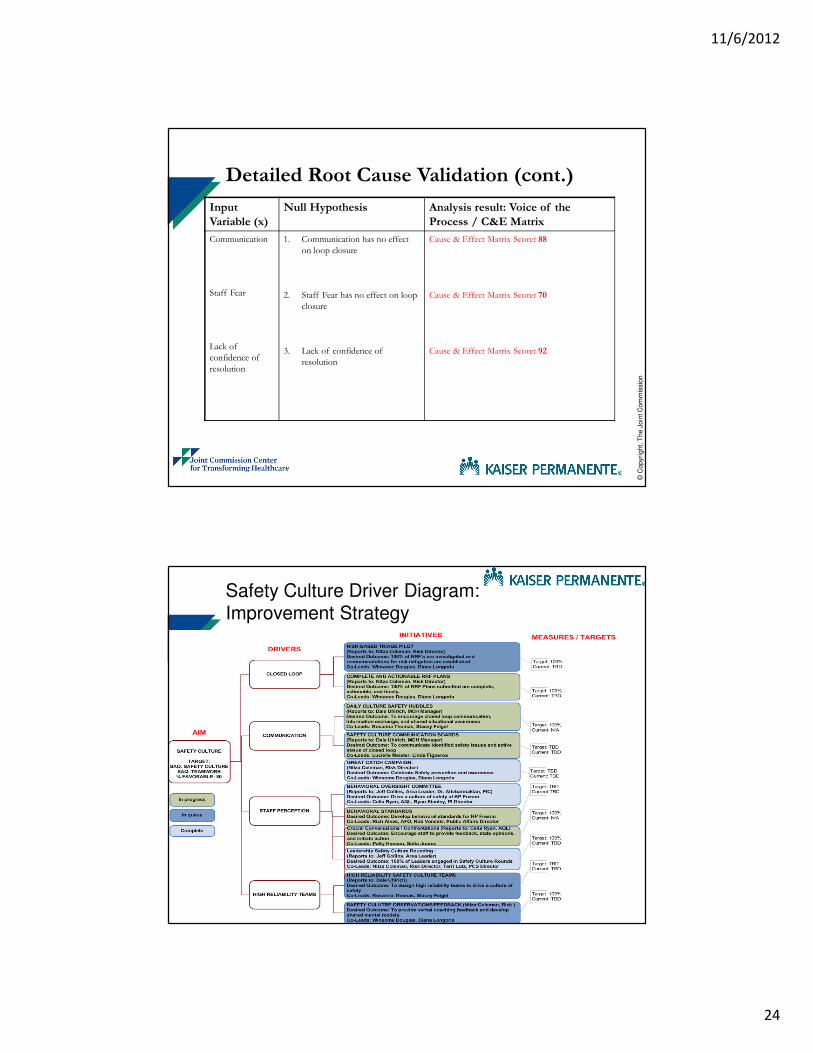
Input
Variable (x)
Null Hypothesis Analysis result: Voice of the
Process / C&E Matrix
Communication
Staff Fear
Lack of
confidence of
resolution
1. Communication has no effect
on loop closure
2. Staff Fear has no effect on loop
closure
3. Lack of confidence of
resolution
Cause & Effect Matrix Score: 88
Cause & Effect Matrix Score: 70
Cause & Effect Matrix Score: 92
Detailed Root Cause Validation (cont.)
© C
opyri
ght,
The J
oin
t C
om
mis
sion
Safety Culture Driver Diagram:Improvement Strategy

11/6/2012
25
© C
opyri
ght,
The J
oin
t C
om
mis
sion
High Reliability Value #1: Sensitivity to operations
� Team’s ability to
exchange information
clearly and
acknowledge receipt of
information
� Speak clearly and
exchange information
effectively
� Apply task strategies and anticipate future situations
Kaiser Permanente implemented Nurse Knowledge Exchange Plus (NKE+) to improve information exchange and closed loop communication
Source: Promoting health care safety through training high reliability: K A Wilson, CS Burke, H A Priest, E Salas
© C
opyri
ght,
The J
oin
t C
om
mis
sion
�Provide verbal feedback and coaching
�Monitor performance and provide feedback
�Share compatible knowledge of team roles for effective team interaction
High Reliability Value #2: Commitment to resilience
Kaiser Permanente developed a Coaching for Excellence Model to provide feedback on performance behaviors and support the development of shared mental models
Source: Promoting health care safety through training high reliability: K A Wilson, CS Burke, H A Priest, E Salas

11/6/2012
26
© C
opyri
ght,
The J
oin
t C
om
mis
sion
High Reliability Value #3: Deference to expertise
�Allow team members to provide feedback, state opinions, and initiate action
�Encourage collective teamwork
�Value all team members expertise
Kaiser Permanente has added Crucial Conversations/Confrontations as a STAR Leadership training to encourage Team feedback and opinions
Source: Promoting health care safety through training high reliability: K A Wilson, CS Burke, H A Priest, E Salas
© C
opyri
ght,
The J
oin
t C
om
mis
sion
High Reliability Value #4: Reluctance to simplify
�Respond to environmental factors and adjust team strategies
�Plan by setting goals, assigning roles, and identifying barriers
Kaiser Permanente has added daily huddles with a communication board to identify potential opportunities, prioritize tasks, and to strengthen the communication of the feedback loop
Source: Promoting health care safety through training high reliability: K A Wilson, CS Burke, H A Priest, E Salas
11/6/2012
27
© C
opyri
ght,
The J
oin
t C
om
mis
sion
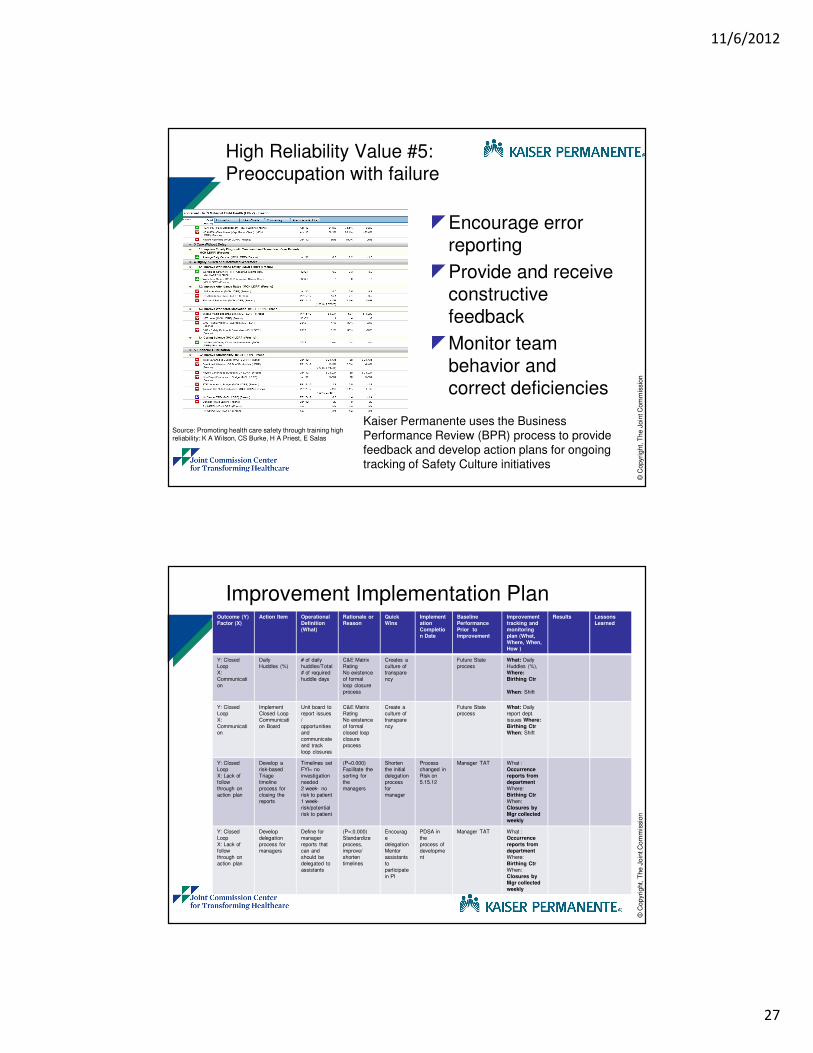
High Reliability Value #5: Preoccupation with failure
�Encourage error reporting
�Provide and receive constructive feedback
�Monitor team behavior and correct deficiencies
Kaiser Permanente uses the Business Performance Review (BPR) process to provide feedback and develop action plans for ongoing tracking of Safety Culture initiatives
Source: Promoting health care safety through training high reliability: K A Wilson, CS Burke, H A Priest, E Salas
© C
opyri
ght,
The J
oin
t C
om
mis
sion
Improvement Implementation PlanOutcome (Y)
Factor (X)
Action Item Operational
Definition
(What)
Rationale or
Reason
Quick
Wins
Implement
ation
Completio
n Date
Baseline
Performance
Prior to
Improvement
Improvement
tracking and
monitoring
plan (What,
Where, When,
How )
Results Lessons
Learned
Y: Closed
Loop
X:
Communicati
on
Daily
Huddles (%)
# of daily
huddles/Total
# of required
huddle days
C&E Matrix
Rating
No existence
of formal
loop closure
process
Creates a
culture of
transpare
ncy
Future State
process
What: Daily
Huddles (%),
Where:
Birthing Ctr
When: Shift
Y: Closed
Loop
X:
Communicati
on
Implement
Closed Loop
Communicati
on Board
Unit board to
report issues
/
opportunities
and
communicate
and track
loop closures
C&E Matrix
Rating
No existence
of formal
closed loop
closure
process
Create a
culture of
transpare
ncy
Future State
process
What: Daily
report dept.
issues Where:
Birthing Ctr
When: Shift
Y: Closed
Loop
X: Lack of
follow
through on
action plan
Develop a
risk-based
Triage
timeline
process for
closing the
reports
Timelines set
FYI= no
investigation
needed
2 week- no
risk to patient
1 week-
risk/potential
risk to patient
(P=0.000)
Facilitate the
sorting for
the
managers
Shorten
the initial
delegation
process
for
manager
Process
changed in
Risk on
5.15.12
Manager TAT What :
Occurrence
reports from
department
Where:
Birthing Ctr
When:
Closures by
Mgr collected
weekly
Y: Closed
Loop
X: Lack of
follow
through on
action plan
Develop
delegation
process for
managers
Define for
manager
reports that
can and
should be
delegated to
assistants
(P=:0.000)
Standardize
process,
improve/
shorten
timelines
Encourag
e
delegation
Mentor
assistants
to
participate
in PI
PDSA in
the
process of
developme
nt
Manager TAT What :
Occurrence
reports from
department
Where:
Birthing Ctr
When:
Closures by
Mgr collected
weekly

11/6/2012
28
© C
opyri
ght,
The J
oin
t C
om
mis
sion
Outcome (Y)
Factor (X)
Action Item Operational
Definition
(What)
Rationale or
Reason
Quick
Wins
Implement
ation
Completio
n Date
Baseline
Performance
Prior to
Improvement
Improvement
tracking and
monitoring
plan (What,
Where, When,
How )
Results Lessons
Learned
Y: Closed
Loop
X:
Communicati
on
Implement
Nurse
Knowledge
Exchange
Plus
behaviors
HCAHPS:
RN
Communicati
on
C&E Matrix
Score: 88
Info.
exchange
Closed
loop
comm.
12/31/2012 77.1%
ASE / Monthly
Y: Closed
Loop
X:
Communicati
on
Implement
Coaching for
Excellence
# of trainings
completed / #
of required
training
C&E Matrix
Score: 88
Strengthe
n back up
behavior
and
shared
mental
models
On going
STAR
Leadership
Training
N/A STAR /
Monthly
Y: Closed
Loop
X: Staff Fear
Crucial
Conversation
s/Confrontati
ons trainings
# of trainings
completed / #
of required
training
C&E Matrix
Score: 70
Strengthe
n
Assertiven
ess
On going
STAR
Leadership
Training
N/A STAR /
Monthly
Y: Closed
Loop
X:
Communicati
on
Business
Performance
Reviews
# of BPR /
total # of
required BPR
C&E Matrix
Score: 88
Error Mgt
Team Self
Correction
Feedback
12/31/2012 N/A BPR / Monthly
Improvement Implementation Plan
© C
opyri
ght,
The J
oin
t C
om
mis
sion
Change Management Strategies:
Mobilizing Commitment Improve Phase
STAKEHOLDER ANALYSIS
Level of Commitment People or Group
Leadership Physicians Management Team Members Quality / Risk
Enthusiastic X O X O X
Helpful O X OX O X
Compliant X X X
Hesitant X
Indifferent
Uncooperative
Opposed
Hostile
Key:
O - Level Necessary for Success
X - Level at the start of project
X - Current Level

11/6/2012
29
© C
opyri
ght,
The J
oin
t C
om
mis
sion
Change Management Strategies: Monitoring Progress / Balanced Scorecard
© C
opyri
ght,
The J
oin
t C
om
mis
sion
58
Challenges encountered
� Lessons learned
– Enable champions to encourage staff to complete
closed loop questions
– Create a shared need as you implement solutions
� Unresolved questions
– Continuing measurement strategy around correlation
between SAQ and SOS surveys
� Foreseeable and experienced challenges
– Response rate for Quality of the Loop Survey
– Maintain consistency with huddle process
� Issues/ concerns
– Organizational Survey Fatigue

11/6/2012
30
© C
opyri
ght,
The J
oin
t C
om
mis
sion
59
Next Steps
What Who When
Creation of Risk Based Triage Pilot Nitza 12/31/2012
Implement Behavioral Standards Hendrix, Alves, Veneski 12/31/2012
Complete analysis to validate improvements to closed loop
Ryan 12/31/2012
© C
opyri
ght,
The J
oin
t C
om
mis
sion
60
Thank You!
Questions

11/6/2012
31
Questions?
Raise your hand
Use the Chat
Resources for Self-study
• Smith B. Lean and Six Sigma: A one-two punch. Quality Progress. 2003;36(4):37-41.
• Going Lean in Health Care. IHI Innovation Series white paper. Cambridge, MA: Institute for Healthcare Improvement; 2005. Available on www.IHI.org
• ASQ: http://asq.org/sixsigma/
11/6/2012
32
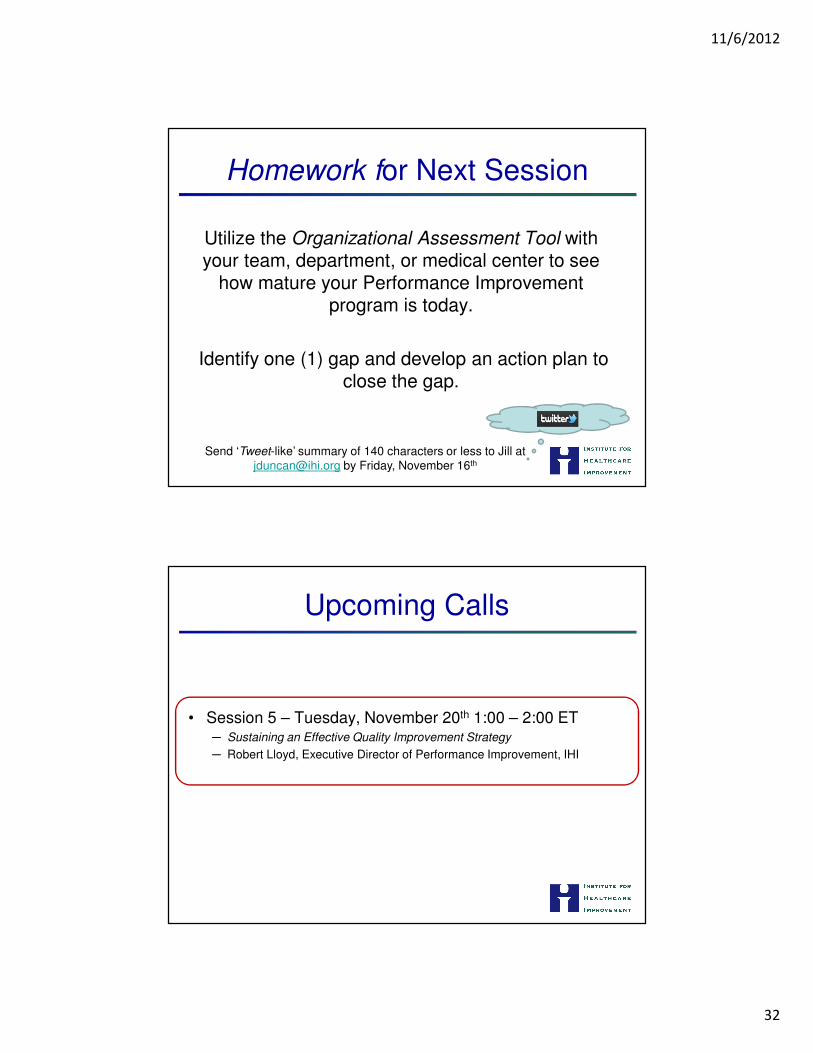
Homework for Next Session
Utilize the Organizational Assessment Tool with your team, department, or medical center to see
how mature your Performance Improvement program is today.
Identify one (1) gap and develop an action plan to close the gap.
Send ‘Tweet-like’ summary of 140 characters or less to Jill at
[email protected] by Friday, November 16th
Upcoming Calls
• Session 5 – Tuesday, November 20th 1:00 – 2:00 ET─ Sustaining an Effective Quality Improvement Strategy
─ Robert Lloyd, Executive Director of Performance Improvement, IHI

11/6/2012
33
Thank You
Please let us know if you have any questions or feedback following today’s Expedition webinar
Jill Duncan
Dennis [email protected]