sexual and reproductive health and sexual violence among new … · 2018-09-24 · 2 title:...
TRANSCRIPT
[Type here]
Youth2000 Survey Series
Sexual and reproductive health and sexual
violence among New Zealand secondary
school students
Findings from the Youth’12 national youth health and
wellbeing survey
2016
Adolescent Health Research Group

2
Title: Youth’12 The Health and Wellbeing of Secondary School Students in New Zealand: Sexual and reproductive health and sexual violence.
ISBN (paperback) 978-0-473-34685-0
ISBN (electronic) 978-0-473-34686-7
To be referenced as:
Clark, T.C., Moselen, E., Dixon, R., The Adolescent Health Research Group, & Lewycka, S. (2015). Sexual and Reproductive Health & Sexual
Violence among New Zealand secondary school students: Findings from the Youth’12 national youth health and wellbeing survey. Auckland, New
Zealand: The University of Auckland.
The Adolescent Health Research Group* (AHRG) investigators on the Youth’12 project were:
Terryann Clark (Principal Investigator), School of Nursing
Theresa (Terry) Fleming, Department of Paediatrics: Child and Youth Health and Department of Psychological Medicine
Pat Bullen and Ben Dyson, Faculty of Education
Simon Denny, Department of Paediatrics: Child and Youth Health
Sarah Fortune, Department of Psychological Medicine
Roshini Peiris-John and Jennifer Utter, Section of Epidemiology and Biostatistics, School of Population Health
Elizabeth Robinson, Sue Crengle, Auckland UniServices Limited
Fiona Rossen, Social and Community Health
Janie Sheridan, Centre for Addiction Research, and School of Pharmacy
Tasileta Teevale, Pacific Health, School of Population Health
Mathijs Lucassen, Department of Psychological Medicine
Emma Moselen, School of Nursing
Arier Chi Lun Lee, Section of Epidemiology and Biostatistics, School of Population Health
*The AHRG membership has changed over the three surveys. The AHRG investigators are all based at the University of Auckland in New Zealand
Acknowledgements
A big thank you to:
The students and staff who participated in the survey. Without their help the Youth’12 survey would not have been possible
The Youth’12 project manager, Sarah Masson and administrator, Toni Jardine
The research team members who implemented the survey in participating schools
The Youth’07 team, led by Simon Denny, and the Youth2000 (2001) team, led by Peter Watson
Data analysis provided by Sonia Lewycka
Data checking provided by Tessa Morgan
Oversight provided by Terryann Clark and the AHRG
All the photographs in this report are used with the permission of the young people involved.
The Youth’12 project was funded by the ministries of Youth Development, Social Development, Health, Education and Justice, the Department of
Labour, the Families Commission and the Health Promotion Agency (formerly ALAC). We would also like to acknowledge the support of Toshiba
(Australia) Pty Limited.
This report was contracted by ACC and the Ministry of Health.
Contact details:
Terryann Clark (Youth’12 Principal Investigator)
Adolescent Health Research Group
School of Nursing
The University of Auckland
Private Bag 92019, Victoria Street West, Auckland, 1142
Email: [email protected]
Further publications by the AHRG are available at www.youthresearch.auckland.ac.nz

3
Contents
Executive summary ................................................................................................................................................. 4
Introduction ............................................................................................................................................................. 8
The Adolescent Health Research Group ............................................................................................................ 9
How to use the information in this report .......................................................................................................... 11
The results ............................................................................................................................................................ 14
The participants ................................................................................................................................................ 14
PART ONE ............................................................................................................................................................ 18
1. Unwanted sexual experience ........................................................................................................................ 18
2. Trends over time in reported unwanted sexual experience among students ................................................ 28
3. Associations with experiencing unwanted sexual contact ............................................................................ 28
PART TWO ........................................................................................................................................................... 48
4. Sexual and reproductive health .................................................................................................................... 48
5. Trends in sexual and reproductive health ..................................................................................................... 63
6. Associations with consistent condom and contraception use ....................................................................... 64
PART THREE ....................................................................................................................................................... 81
7. Viewing and receiving sexually explicit material ........................................................................................... 81
PART FOUR ......................................................................................................................................................... 90
8. Māori and Pacific students ............................................................................................................................ 90
Summary and conclusions .................................................................................................................................. 102
Links and resources ............................................................................................................................................ 106
References .......................................................................................................................................................... 108

4
Executive summary This report presents findings from Youth’12, the third national health and wellbeing survey of secondary school
students in New Zealand. This is New Zealand’s largest and most comprehensive survey of the health and
wellbeing of New Zealand’s young people in secondary schools. Included in the survey are a range of factors
that impact on the healthy development of young people, including family/whānau, community, education and
social environments. This report focuses on reporting the sexual violence experiences and the sexual and
reproductive health of students in secondary schools.
The information in this report was provided by a representative sample of 8,500 students from secondary schools
throughout New Zealand in 2012. There are three parts to this report: (1) Experience of unwanted sexual
contact, (2) Sexual and reproductive health and (3) Ethnic specific information for Māori and Pacific students.
Also reported are selected time trends from the 2001, 2007 and 2012 surveys.
Experience of unwanted sexual contact
How many students experience unwanted sexual contact?
Fifteen percent of New Zealand secondary school students report an experience of unwanted sexual contact.
Females were more than twice as likely to report unwanted sexual contact than males. Most commonly, it was a
boyfriend/girlfriend or a friend who forced an unwanted sexual experience on the student. Over half (55%) of the
students who reported unwanted sexual contact reported that it happened when they were 14 years or younger.
Nearly three-quarters of males and just over half of the females never told anyone about it. Those who do
disclose unwanted sexual contact most commonly tell a friend. Between 2001 and 2012, the rate of reported
unwanted sexual contact decreased by 8%.
How does this affect young people?
Young people who experienced unwanted sexual contact have a range of poorer outcomes compared to those
who had not had such an experience. For instance they more frequently reported: poorer mental health; poorer
sexual and reproductive health; higher rates of substance use; witnessing family and interpersonal violence;
poorer family relationships; not feeling safe at school; seeing a health professional for emotional health concerns;
having limited access to the healthcare that they needed (especially contraception and pregnancy care); living in
overcrowded homes; and, moving home more frequently. Unwanted sexual contact does not appear to impact on
students’ aspirations to do well at school.
How many students have forced someone to do sexual things they didn’t want to do?
A small proportion (3%) of students reported forcing someone to do sexual things that they did not want to do,
males were twice as likely to report this than females. Between 2001 and 2012, the proportion of young people
who reported forcing someone to do sexual things decreased from 6% to 3%.
How does this affect young people?
Young people who report forcing someone to do sexual things that they did not want to do have a range of
poorer outcomes compared to those who had not. They more frequently reported: poor family relationships;
feeling less safe at school; poor sexual health; high rates of substance use; poor mental health; and, less
aspiration to achieve at school. They also had difficulty accessing help for emotional health concerns and alcohol
use. Students who reported forcing someone to do sexual things were more likely to report being victims of

5
violence including experiencing unwanted sexual contact, witnessing family violence, and being in a serious
physical fight within the previous year.
Sexual and reproductive health
How many secondary school students are sexually active?
Twenty-four percent of New Zealand secondary school students have ever had sex (i.e. have had sexual
intercourse or ‘going all the way’ at least once and this does not include sexual abuse) and 19% report being
currently sexually active (have had sex within the last three months). As would be expected, older students are
more likely to be sexually active than younger students. In 2012, 12% fewer students reported ever having sex,
and 7% fewer students reported being currently sexually active than in 2007. Of those sexually active students,
55% reported one sexual partner within the previous three months.
How many sexually active students use condoms and contraception?
Forty-five percent of sexually active students report always using condoms. Over two-thirds (68%) of young
people reported using a condom the ‘last time they had sex’. Males, older students, and students living in rural
communities more frequently reported using a condom the ‘last time they had sex’. Between 2001 and 2012,
there has been a reduction in students who report always using condoms.
Fifty-eight percent of students always used contraception. Of those sexually active students, 80% reported that
condoms were the most common source of contraception utilised, followed by the contraceptive pill (45%). Over
three-quarters of students (77%) reported using contraception the ‘last time they had sex’. Students from poorer
communities, low decile schools and rural students were less likely to use contraception the ‘last time they had
sex’. There have been no improvements in contraception use over the 2001-2012 period.
Initiating discussions with sexual partner about contraception and sexually transmitted infection (STI) prevention
Thirty-six percent of students reported talking about preventing pregnancy with their partner and 42% reported
talking with their partner about preventing sexually transmitted infections. Females were more likely to initiate
discussions about prevention of pregnancy and sexually transmitted infections.
What factors were associated with consistent condom use and contraception?
Sexually active students who always used condoms more frequently reported having family meals together at
least five times per week and that their parents wanted to know where they were and who they are with,
compared to students who do not use condoms consistently. Students who always use condoms less frequently
reported family violence, fighting, poor mental health, experiencing a pregnancy or sexually transmitted infection,
smoking cigarettes, and experiencing unwanted sexual contact compared to those who do not use condoms.
Sexually active students who always used contraception more frequently reported having an adult who cares
about them a lot, that they get on with their teachers, had part time employment, attended a place of worship and
aspired to attend tertiary education after they leave school. They were less likely to report living in overcrowded
housing, have neither parent working, and not sleep in a room that is not a bedroom (e.g. a lounge or garage).
They less frequently reported poor mental health, a pregnancy or sexually transmitted infection, smoking
cigarettes or using marijuana. Students who always report using contraception were able to access healthcare
with less difficulty, and were more likely to report a family doctor/GP as their usual place to access healthcare.
6
Viewing and receiving sexually explicit material
Seeking pornography or sex sites on the Internet
Eleven percent of students used the Internet to seek pornography or sex sites, with males (21%) more likely to
do so compared to females (2%). Seven percent fewer students in 2012 compared to 2007 used the Internet to
seek pornography or sex sites. Students who access the Internet to seek pornography or sex sites were more
likely to be older (16-18 years) and more frequently reported they had ‘ever had sex’ or were sexually active.
Students who viewed pornography and sexually explicit material were more likely to report unwanted sexual
contact.
Being sent unwanted sexually explicit material (SEM)
Fifteen percent of students had been sent unwanted sexually explicit material (SEM) in the last 12 months. Māori
students, Pacific students, same/both-sex attracted students, and students from high deprivation (lower socio-
economic) neighbourhoods were more likely to be sent unwanted SEM. Unwanted SEM was mostly sent via
mobile phone (8%) or the Internet (6%). Asian students more frequently reported being sent unwanted SEM via
the Internet. There has been no change between 2007 and 2012 in the proportion of students reporting
unwanted SEM. Students who were sent unwanted SEM were three times more likely to report unwanted sexual
contact and four times more likely to report forcing someone else to do sexual things that they did not want to do.
Students who were sent unwanted SEM were more likely to report ‘ever having sex’ and being sexually active.
Māori and Pacific Students
Māori Students
Eighteen percent of Māori students reported they had been forced to do sexual things that they did not want to
do and 39% had not told anyone about the abuse. Twenty-six percent of Māori secondary school students report
being currently sexually active. About half of sexually active Māori students always used contraception (49%)
and condoms (44%) every time they had sex. Two-thirds (67.1%) of Māori students reported using condoms the
‘last time they had sex’. Māori students who lived in wealthier areas more frequently reported using contraception
‘the last time they had sex’, compared to students living in poorer areas. Thirty-one percent reported talking
about contraception and 40% reported talking to about STI prevention with their partner/s. Twenty-two percent of
Māori students reported difficulty accessing healthcare when they needed it, and 7% reported difficulty accessing
sexual health or pregnancy care.
Pacific Students
Twenty-two percent of Pacific students reported they had been forced to do sexual things that they did not want
to do and 39% had not told anyone about the abuse. Twenty percent of Pacific secondary school students report
being sexually active. Of sexually active Pacific students, 42% always use contraception and 35% always use
condoms. Over two-thirds (70%) report using condoms the ‘last time they had sex’, and 62% report using
contraception the ‘last time they had sex’. Thirty-six percent of Pacific students always talked about pregnancy
prevention with their partner and approximately half (49%) report talking to their partner about STI prevention.
Twenty-four percent of Pacific students reported difficulty accessing healthcare if they needed it, and 6% report
difficulty accessing sexual health and pregnancy care.
7
Summary
This report summarises the findings for unwanted sexual contact and sexual and reproductive health of New
Zealand’s young people attending secondary schools. There have been improvements, with fewer young people
reporting unwanted sexual contact in 2012 compared to 2001. However, 15% of all students reporting unwanted
sexual contact, is unacceptably high. Accessible healthcare remains a problem, particularly for Māori and Pacific
students, or students from poor and rural communities. Access to appropriate care for those who have forced
unwanted sexual contact on others, is also required. The effects of unwanted sexual contact can have lasting
impacts on young people, their whānau and communities. Exposure to unwanted sexually explicit material via
the internet or a cell phone is associated with a greater odds of being sexually active and unwanted sexual
contact. Strategies that effectively address the behaviour of those who force unwanted sexual experiences and
sexually explicit material onto others, that promote and teach students about positive relationships and good
communication, and addresses the larger social norms, policies and practices that contribute to violence are
required.
Almost a quarter of students in secondary schools are sexually active, with trends towards fewer students ‘ever
having sex’ or being sexually active between 2001 and 2012. In addition, fewer students also reported seeking
pornography via the internet between 2007 and 2012. However, for sexually active students, condom use has
reduced over the past decade and contraception use has remained stable with no improvements. For those who
are sexually active, accessible and non-judgemental contraceptive care/primary care remains a problem,
particularly for Māori and Pacific students and those from poorer neighbourhoods, low decile schools and rural
communities. It is clear from our findings that keeping our young people safe and sexually healthy requires a
whole person approach, it requires: safe communities and schools; quality housing; sound public health policies;
supportive whānau/family; quality information and education; accessible and affordable healthcare; culturally
competent and finally, opportunities for youth development - our young people need opportunities to thrive.

8
IntroductionThis report is the first report focussed on the sexual
health and sexual violence among secondary
school students in Aotearoa, New Zealand from the
Youth2000 survey series. The Youth2000 survey
series has been conducted by the Adolescent
Health Research Group (AHRG) at the University of
Auckland. This group has carried out nationally
representative surveys of New Zealand secondary
school students in 2001, 2007, and 2012.
This report presents findings from the Youth’12
survey of students who reported sexual activity and
those who experienced unwanted sexual contact.
The report also provides some information about
students who reported to force an unwanted sexual
experience on someone else. The report compares
findings across time (between 2001, 2007 and
2012). We also highlight specific sexual health and
sexual violence information for Māori and Pacific
young people. This report follows on from other
reports that reported information about violence
(including sexual violence) in 2001 (Fleming et al,
2007) and 2007 (Clark et al, 2009). Issues for same
and both-sex attracted youth can be found in the
2001 (Le Brun et al, 2004), 2007 (Rossen et al,
2009) and 2012 (Lucassen, et al, 2014) ‘Young
People Attracted to the Same or Both Sexes’
reports.
We also have a range of peer reviewed papers that
address the issues of sexual and reproductive
health of various groups of young people:
Clark T.C, Lucassen M.F.G, Fleming T, et al. Changes in the sexual health behaviours of New Zealand secondary school students, 2001-2012: Findings from a nationally representative cross sectional survey series. Australian & New Zealand Journal of Public Health (in press)
Denny, S., Robinson, E., Lawler, C., Bagshaw, S., Farrant, B., Bell, F., Dawson, D., Nicholson, D., Hart, M., Fleming, T., Ameratunga, S., Clark, T.C., Kekus, M., Utter, J. (2012) Association between Availability and Quality of Health Services in Schools and Reproductive Health Outcomes
Among Students: A Multilevel Observational Study. American Journal of Public Health, Online http://ajph.aphapublications.org/doi/abs/10.2105/AJPH.2012.300775
Clark, T. C., Crengle, S., Sheridan, J. L., Rowe, D., & Robinson, E. (2013). Factors associated with consistent contraception and condom use among Māori secondary school students in New Zealand. Journal of Paediatrics and Child Health, online doi:10.1111/jpc.12450
Larson, B.K., Clark, T.C., Robinson, E.M., & Utter, J. (2012) Body satisfaction and sexual health behaviors among New Zealand secondary school students. Sex Education. 12(2), 187-98 https://researchspace.auckland.ac.nz/handle/2292/8421
Copland, R.J., Denny, S.J., Robinson, E.M., Crengle, S., Ameratunga, S., Dixon, R. (2011) Self‐ Reported Pregnancy and Access to Primary Healthcare Among Sexually Experienced New Zealand High School Students. Journal of Adolescent Health 49(5), 518-524 http://www.jahonline.org/article/S1054-139X(11)00118-2/abstract
Clark, T.C., Robinson, E., Crengle, S. & Watson, P. (2006) Contraceptive use by Māori youth: associated risk and protective factors. New Zealand Medical Journal. 119(1228), U1816 http://journal.nzma.org.nz/journal/119-1228/1816/
Other Youth’12 reports are available on our website
(www.youthresearch.auckland.ac.nz) including the
Youth’12 Overview (Clark et al., 2013a) and
Youth’12 Prevalence Tables report (Clark et al.,
2013b), which provide further details on methods
and national findings.
9
The Adolescent Health Research
Group (AHRG)
The Adolescent Health Research Group (AHRG) is
a multidisciplinary team of researchers that is
supported by youth, cultural, and stakeholder
advisors. The purpose of the AHRG is to promote
the healthy development and wellbeing of all New
Zealand youth through scientific research that
delivers high-quality useable data to stakeholders.
The group was first established in 1997. Over the
years the membership of the AHRG has changed,
but the vision and commitment remains. The AHRG
works closely with many other researchers and
groups. We welcome applications from other
researchers and groups to use the Youth2000
Survey Series data. A protocol for potential
collaborations can be found on our website:
www.youthresearch.auckland.ac.nz
Youth2000 Survey Series
The AHRG has carried out comprehensive national
surveys of secondary school students in 2001
(Adolescent Health Research Group, 2003), 2007
(Adolescent Health Research Group, 2008) and
now in 2012 (Clark, Fleming, Bullen, Denny, et al.,
2013). The 2001 (Youth’01) and 2007 (Youth’07)
surveys are similar to the 2012 (Youth’12) survey
and selected comparisons of findings from these
surveys are made in this report.
The group has also surveyed students in alternative
education in 2000 (Adolescent Health Research
Group, 2002; Denny, Clark & Watson, 2004) and
2009 (Clark et al., 2010). In 2007, the AHRG also
surveyed students in Teen Parent Units (Johnson &
Denny, 2007). The Youth’07 and Youth’12 surveys
1 New Zealand registered composite and secondary
schools with 50 or more students in Year 9 or
higher.
of secondary school students were supplemented
by surveys with school staff members about school
characteristics. All of these surveys together make
up the Youth2000 Survey Series.
The results of the Youth2000 Survey Series have
been presented internationally and are listed on our
website: www.youthresearch.auckland.ac.nz
How we did the 2012 survey
The Youth2000 Survey Series is designed to
provide information about the health and wellbeing
of New Zealand secondary school students. In 2012
we randomly selected 125 composite and
secondary schools in New Zealand which met the
inclusion criteria1 and invited them to participate in
the survey. For schools which had a roll of more
than 150 Year 9-13 students, we randomly selected
20% of this roll and invited these students to take
part in the survey. For participating schools with
less than 150 Year 9 or higher students, 30
students were randomly selected and invited to take
part. For more detailed information on the school
selection process, please refer to the Youth’12
Prevalence Tables report which can be found on
our website: www.youthresearch.auckland.ac.nz
Of the 125 schools invited, 91 took part in the
survey (73%). The majority of participating schools
were state funded, co-educational and large schools
(at least 350 Year 9 or higher students). Of the 34
invited schools that did not participate, 26 declined,
a further two initially agreed to participate but
withdrew during 2012, and six did not respond to
the invitation to participate.
School participation was lowest for state-integrated
schools (59%), boys’ schools (40%), Decile 6 (50%)
10
and Decile 7 (64%) schools, rural schools (60%),
and schools in Wellington (50%), Nelson
Marlborough, Tasman and West Coast (60%) and
Otago or Southland (54%).
Within the 125 participating schools, 12,503
students were invited to take part in the survey and
8,500 participated (68%). This represents 3% of the
2012 New Zealand secondary school roll. The most
common reasons why students did not participate
were not being at school on the day of the survey,
not wanting to take part, and being unavailable
during the time the survey was conducted.
Ethical issues
The Youth’12 survey built on the procedures used in
the previous Youth2000 Survey Series. Like the
previous surveys, Youth’12 was completely
voluntary (students did not have to participate and
could choose to not answer questions or to leave at
any time) and anonymous (no personal
identification details were collected). The survey
had a ‘branching’ design so that students were not
asked detailed questions about things that did not
apply to them. For example, if students reported
that they had not had sex, they did not get asked
any further questions about sexual activity.
The AHRG and a wide range of advisors reviewed
the survey content and methods. Ethical approval
was obtained from the University of Auckland
Human Participants Ethics Committee (ref
2011/206).
School principals gave consent for their own school
to take part. A few weeks before the survey,
information was given to each school for distribution
to parents and students. Parents were able to have
their child excluded from the survey. On the day of
the survey, an explanation was given to selected
students and each student personally consented to
participate. The survey was available in English and
Te Reo Māori.
Survey delivery and content
The survey was delivered using handheld digital
tablets. The survey questions were displayed on the
tablet and were also available by voiceover via
headphones. Students answered the questions by
touching the appropriate checkbox on the tablet
screen.
The Youth’12 survey covered important areas of
health and wellbeing for young people as well as
risk and protective factors. The questionnaire
contained a total of 608 questions, but students
answered fewer than this number of questions due
to the branching design. The complete list of survey
questions and full wording for each question is
available on our website:
http://www.youthresearch.auckland.ac.nz
Most of the questions and measurements were the
same as those used in previous Youth 2000
surveys. However, for this report there was one
important change. The ‘ever had sex’ question
changed in 2012. We wanted to make sure that
those students who reported being sexually active -
excluded those who had had forced sexual contact
or abuse. This means that the ‘ever had sex’
question is measured over time using a combination
of two questions. In 2001 and 2007 we utilised the
question “About how old were you when you had
your first experience of sex? (by this we mean
sexual intercourse or going all the way)”.
Responses: all ages excluding ‘never’ were coded
as having ‘ever had sex’. In 2012 we kept the above
question, but in addition, prior to being asked about
age of sexual intercourse we asked a new question
“Have you ever had sex? (by this we mean sexual
intercourse). Do not include sexual abuse”.
Responses: ‘Yes’ were coded as ‘ever having sex’.
This question allows us to be sure that the sexual
behaviour was consensual not coercive/abusive.
Therefore, this particular time trend should be
treated with caution. Reassuringly the ‘currently
sexually active’ question showed a similar trend to
declining over time.
Students were also asked to provide their usual
home address. We used this to ascertain their
census meshblock (grouping of approximately 100
households) so that neighbourhood characteristics
such as deprivation levels and urban or rural setting
11
could be ascertained. After the meshblock was
identified the student’s address was deleted.
School decile
School decile is a school-level measure of socio-
economic position relative to the school students
community or neighbourhood (Ministry of Education,
2016). The measure takes into account; household
income, parental occupation, household crowding,
parental educational qualifications and
income/benefit support of the school community.
Decile 1 refers to the 10% of schools who have the
lowest socio-economic resources in their community
and Decile 10 refers to the 10% of schools with the
highest socio-economic resources in their
community.
In this report, students are grouped into three
categories: low (decile 1-3), medium (decile 4-7), or
high (decile 8-10) decile schools.
NZ Deprivation Index
In this report, students are grouped into high,
medium, or low deprivation neighbourhoods based
on the New Zealand Deprivation Index (NZDI) for
their geographical area or neighbourhood
(meshblock) (Salmond, Crampton, & Atkinson,
2007). In 2006, the NZDI used eight dimensions of
deprivation (including household income,
employment, access to a telephone, access to a
car, single parent families, qualifications,
overcrowding, and home ownership) to calculate a
deprivation score for each meshblock in New
Zealand. It is important to remember that this score
is an indicator of neighbourhood (rather than
personal or family) deprivation, and some
households might contend with quite different levels
of hardship than is suggested by their meshblock.
Household deprivation was measured using nine
socioeconomic indicators: family ownership of a car,
telephone and a computer/laptop; residential
mobility; parental employment; perceptions of level
of family worry about not having enough money to
buy food; having family holidays; living room or
garage used as a bedroom; and living in an over-
crowded home. Students who reported two or more
indicators of household deprivation were classified
in the household deprivation group (Denny,
Lewycka, Bullen, et al., 2014). It is important to note
that indicators of deprivation may vary by cultural
context.
Funding
The Youth2000 Survey Series has had a different
set of funding bodies in 2001, 2007, and 2012.
Without the support of these organisations it would
not be possible to undertake the youth health and
wellbeing surveys nationally or to analyse and
publish the results. Without this research,
organisations responsible for New Zealand youth
would not be able to advocate for appropriate and
accessible services, programmes and policy on
behalf of young people.
In 2012, the survey was funded by the ministries of
Youth Development, Social Development, Health,
Education and Justice, the Department of Labour,
the Families Commission, and the Health Promotion
Agency (formerly ALAC). The AHRG thanks these
organisations for their support to improve the health
and wellbeing of New Zealand youth.
This report was contracted by ACC and the Ministry
of Health.
How to use the information in this
report
The Youth2000 Survey Series is the largest dataset
on the health and wellbeing of young people in New
Zealand and is of considerable importance for the
purposes of planning and programme development
for communities, schools and policy makers.
However, caution needs to be taken when
interpreting the results, especially in relation to
whether the findings reflect the wider youth
population, and in interpreting differences between
groups of students. The sample of students
surveyed does not include young people who were
absent from school on the day of the survey, those
who have left school, or those in alternative
education settings; hence findings are likely to
represent a slightly more positive view of the health
of students who attend secondary schools.
12
How reliable are these findings?
We have taken steps to ensure we can be confident
the information is correct. Our large sample size
and rigorous methods for randomly selecting
schools and students ensure these findings
represent secondary schools and their students
throughout New Zealand. The AHRG has
undertaken extensive quality checks to ensure data
coding and analyses are correct.
Interpreting the results
When we report statistics in this document a
number of parameters are provided. In the tables,
for each question/item from the survey, we report
‘N’ which refers to the number of students who
answered that particular question/item. The ‘N’ will
vary by question as students could choose not to
answer questions, and they were not asked detailed
questions which did not apply to them. For example,
only students who said that they had smoked a
whole cigarette were asked how often they smoke
cigarettes now.
The ‘n’ refers to the number of students who chose
the particular response of interest for a
question/item. For example, in the question where
students who had experienced unwanted sexual
contact were asked about the age at which this first
happened, the number of students who reported
that this happened was 790 (N), and 266 (n) of
these students reported that the contact happened
when the they were between 11 and 13 years old.
The percentage (%) refers to the proportion of the
students who reported that particular response or
behaviour for a question/item. This can be regarded
as an estimate of the true proportion of the
population. For tables that display demographic
details, each percentage refers to the proportion of
students with that specific demographic
characteristic who responded positively to the
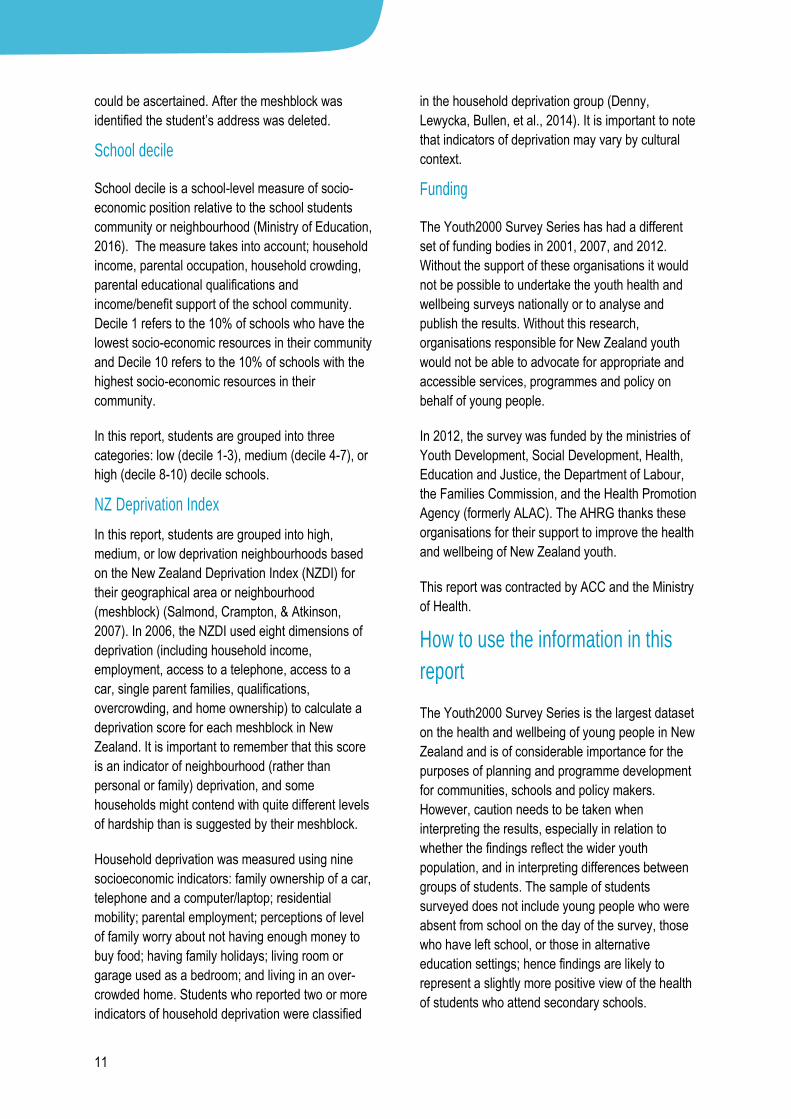
question. For example, 24.9% of male students and
24.5% of female students reported to have ever had
sex.
For tables that do not display demographic details,
each percentage refers to the proportion of students
who have the characteristic of the column heading
who responded positively to the question. For
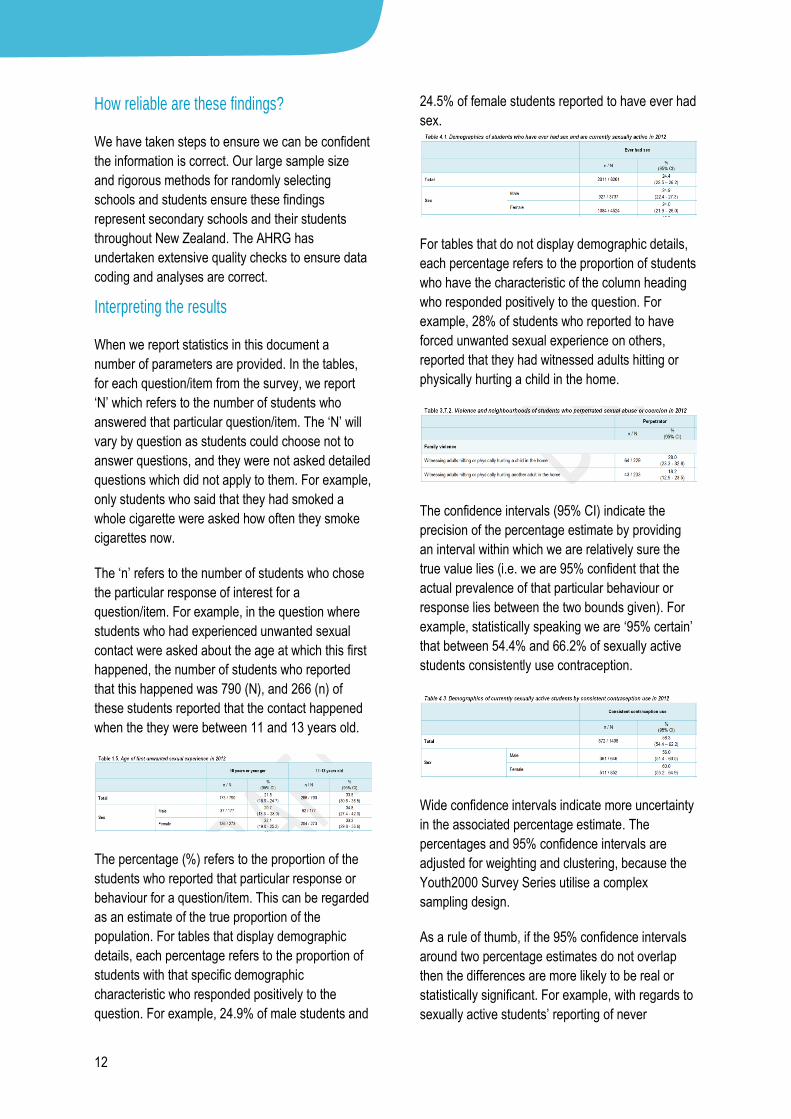
example, 28% of students who reported to have
forced unwanted sexual experience on others,
reported that they had witnessed adults hitting or
physically hurting a child in the home.
The confidence intervals (95% CI) indicate the
precision of the percentage estimate by providing
an interval within which we are relatively sure the
true value lies (i.e. we are 95% confident that the
actual prevalence of that particular behaviour or
response lies between the two bounds given). For
example, statistically speaking we are ‘95% certain’
that between 54.4% and 66.2% of sexually active
students consistently use contraception.
Wide confidence intervals indicate more uncertainty
in the associated percentage estimate. The
percentages and 95% confidence intervals are
adjusted for weighting and clustering, because the
Youth2000 Survey Series utilise a complex
sampling design.
As a rule of thumb, if the 95% confidence intervals
around two percentage estimates do not overlap
then the differences are more likely to be real or
statistically significant. For example, with regards to
sexually active students’ reporting of never
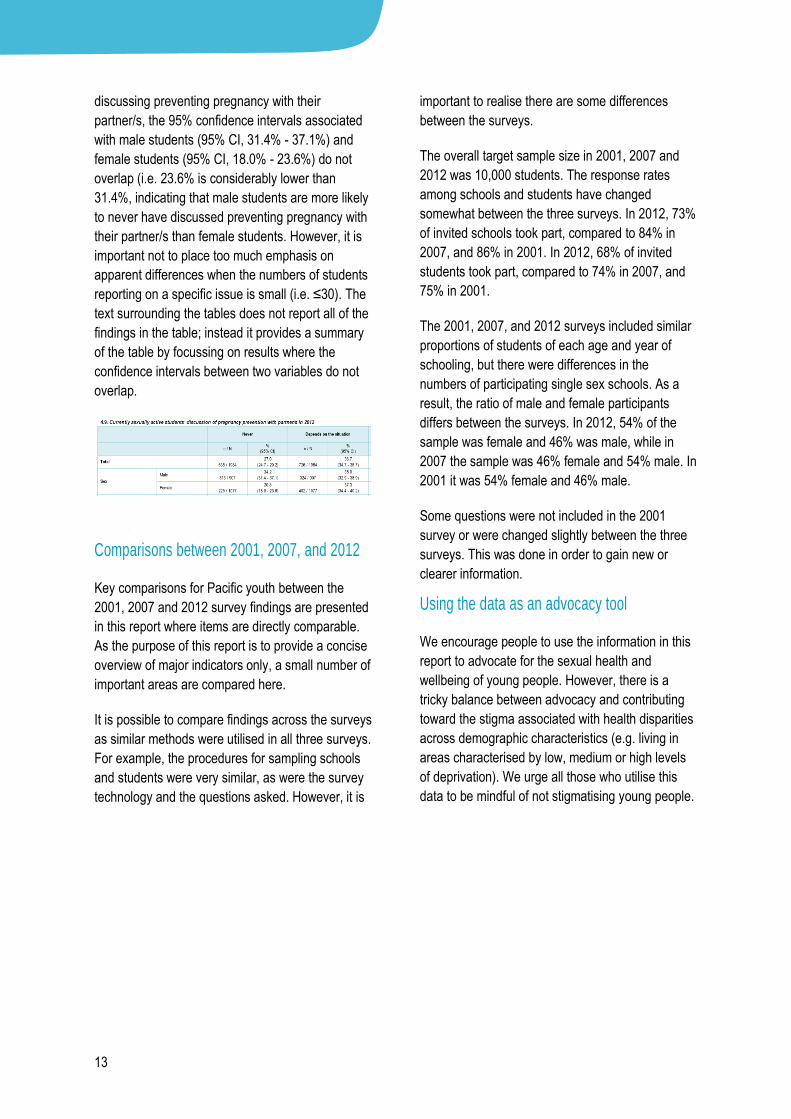
13
discussing preventing pregnancy with their
partner/s, the 95% confidence intervals associated
with male students (95% CI, 31.4% - 37.1%) and
female students (95% CI, 18.0% - 23.6%) do not
overlap (i.e. 23.6% is considerably lower than
31.4%, indicating that male students are more likely
to never have discussed preventing pregnancy with
their partner/s than female students. However, it is
important not to place too much emphasis on
apparent differences when the numbers of students
reporting on a specific issue is small (i.e. ≤30). The
text surrounding the tables does not report all of the
findings in the table; instead it provides a summary
of the table by focussing on results where the
confidence intervals between two variables do not
overlap.
Comparisons between 2001, 2007, and 2012
Key comparisons for Pacific youth between the
2001, 2007 and 2012 survey findings are presented
in this report where items are directly comparable.
As the purpose of this report is to provide a concise
overview of major indicators only, a small number of
important areas are compared here.
It is possible to compare findings across the surveys
as similar methods were utilised in all three surveys.
For example, the procedures for sampling schools
and students were very similar, as were the survey
technology and the questions asked. However, it is
important to realise there are some differences
between the surveys.
The overall target sample size in 2001, 2007 and
2012 was 10,000 students. The response rates
among schools and students have changed
somewhat between the three surveys. In 2012, 73%
of invited schools took part, compared to 84% in
2007, and 86% in 2001. In 2012, 68% of invited
students took part, compared to 74% in 2007, and
75% in 2001.
The 2001, 2007, and 2012 surveys included similar
proportions of students of each age and year of
schooling, but there were differences in the
numbers of participating single sex schools. As a
result, the ratio of male and female participants
differs between the surveys. In 2012, 54% of the
sample was female and 46% was male, while in
2007 the sample was 46% female and 54% male. In
2001 it was 54% female and 46% male.
Some questions were not included in the 2001
survey or were changed slightly between the three
surveys. This was done in order to gain new or
clearer information.
Using the data as an advocacy tool
We encourage people to use the information in this
report to advocate for the sexual health and
wellbeing of young people. However, there is a
tricky balance between advocacy and contributing
toward the stigma associated with health disparities
across demographic characteristics (e.g. living in
areas characterised by low, medium or high levels
of deprivation). We urge all those who utilise this
data to be mindful of not stigmatising young people.

14
The results The participants
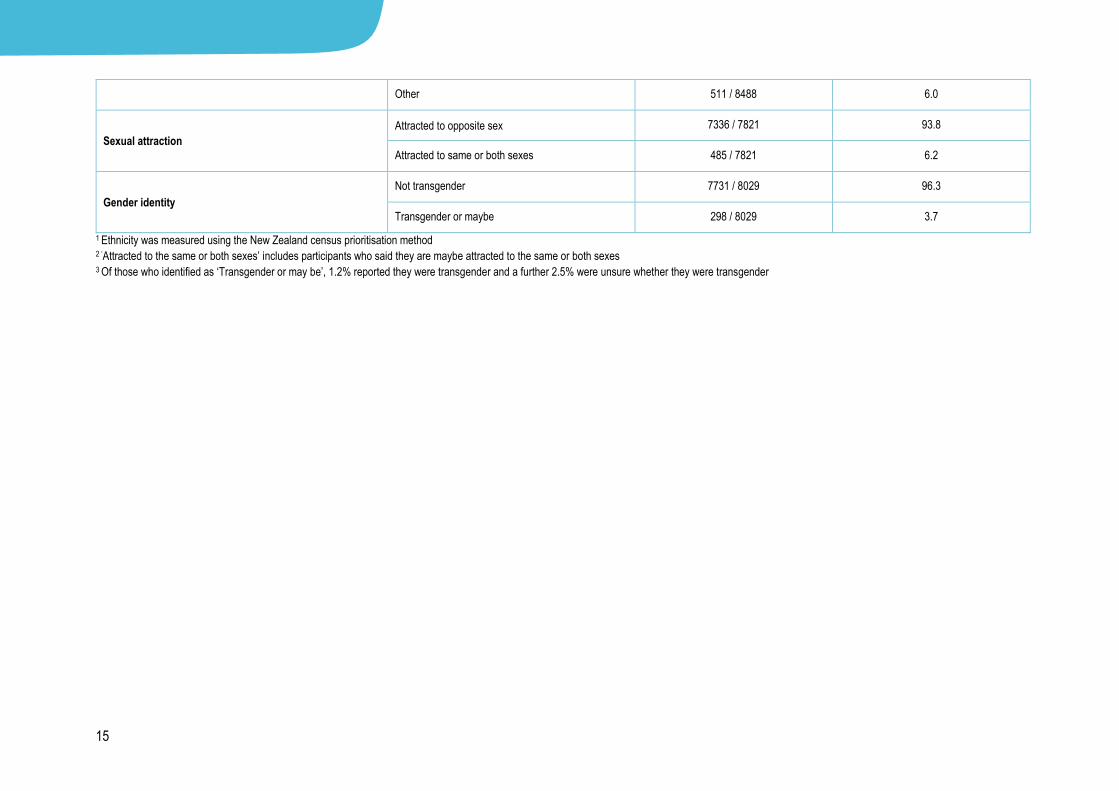
Demographics In 2012, more than half of the 8,500 participants in the Youth’12 survey were female and 15 years old or younger. Close to half of the participants identified as NZ European,
20% as Māori, 14% as Pacific and 12% as Asian. Youth who identified as same or both-sex attracted made up 6.2% of the secondary school population and 3.7% of
participants identified themselves as transgender or that they were unsure if they were transgender.
Table A. Participant demographic characteristics of students in 2012
n / N %
Sex
Male 3874 / 8497 45.6
Female 4623 / 8497 54.4
Age
13 or under 1838 / 8489 21.7
14 1896 / 8489 22.3
15 1755 / 8489 20.7
16 1578 / 8489 18.6
17 or over 1422 / 8489 16.8
Ethnicity
Māori 1701 / 8488 20.0
Pacific 1201 / 8488 14.1
Asian 1051 / 8488 12.4
NZ European 4024 / 8488 47.4
15
Other 511 / 8488 6.0
Sexual attraction
Attracted to opposite sex 7336 / 7821 93.8
Attracted to same or both sexes 485 / 7821 6.2
Gender identity
Not transgender 7731 / 8029 96.3
Transgender or maybe 298 / 8029 3.7
1 Ethnicity was measured using the New Zealand census prioritisation method 2 ‘Attracted to the same or both sexes’ includes participants who said they are maybe attracted to the same or both sexes 3 Of those who identified as ‘Transgender or may be’, 1.2% reported they were transgender and a further 2.5% were unsure whether they were transgender
16
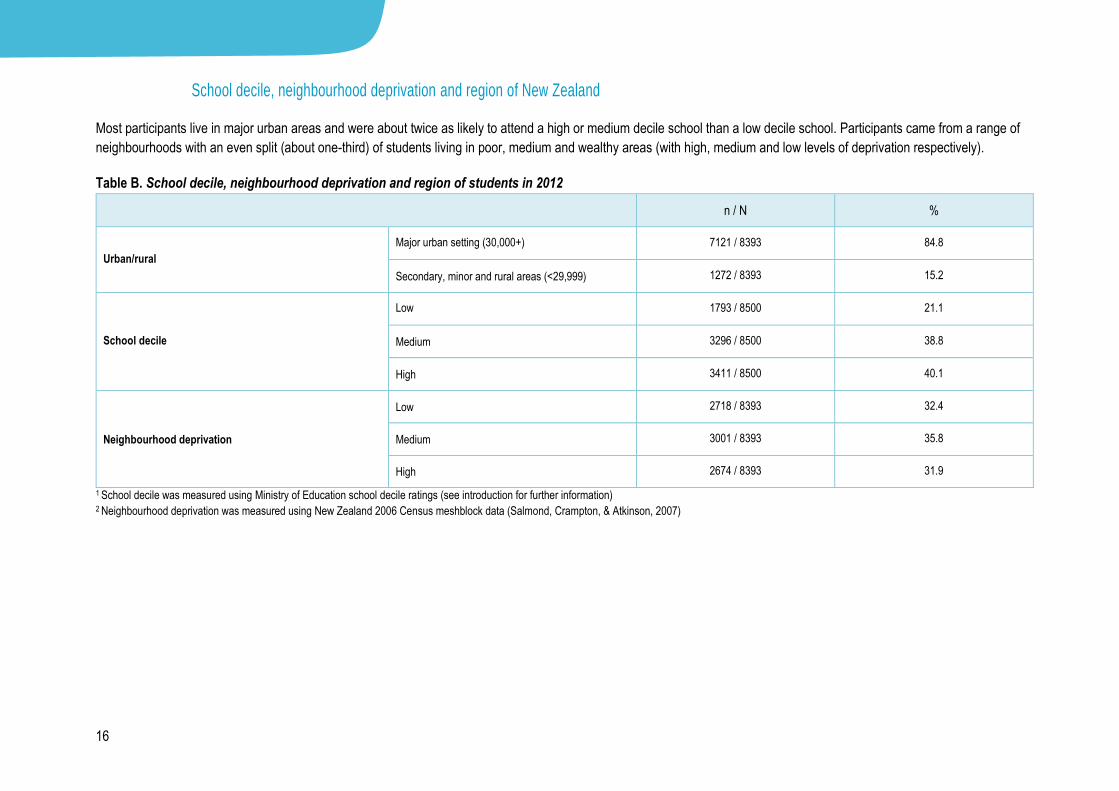
School decile, neighbourhood deprivation and region of New Zealand
Most participants live in major urban areas and were about twice as likely to attend a high or medium decile school than a low decile school. Participants came from a range of
neighbourhoods with an even split (about one-third) of students living in poor, medium and wealthy areas (with high, medium and low levels of deprivation respectively).
Table B. School decile, neighbourhood deprivation and region of students in 2012
n / N %
Urban/rural
Major urban setting (30,000+) 7121 / 8393 84.8
Secondary, minor and rural areas (<29,999) 1272 / 8393 15.2
School decile
Low 1793 / 8500 21.1
Medium 3296 / 8500 38.8
High 3411 / 8500 40.1
Neighbourhood deprivation
Low 2718 / 8393 32.4
Medium 3001 / 8393 35.8
High 2674 / 8393 31.9
1 School decile was measured using Ministry of Education school decile ratings (see introduction for further information) 2 Neighbourhood deprivation was measured using New Zealand 2006 Census meshblock data (Salmond, Crampton, & Atkinson, 2007)

17
Regions where participants lived
Over 80% of participants reported living in the North Island, with 40% of participants living in the Auckland region. This is generally what you would expect given the population
structure of New Zealand.
Table C. Regions where participants lived in 2012
n / N %
Northland 666 / 8393 7.9
Auckland 3269 / 8393 38.9
Waikato 601 / 8393 7.2
Bay of Plenty 308 / 8393 3.7
Gisborne 141 / 8393 1.7
Hawkes Bay 462 / 8393 5.5
Taranaki 152 / 8393 1.8
Manawatu-Wanganui 716 / 8393 8.5
Wellington 567 / 8393 6.8
Nelson/Tasman/ Marlborough 88 / 8393 1.1
West Coast 29 / 8393 0.3
Canterbury 929 / 8393 11.1
Otago 150 / 8393 1.8
Southland 315 / 8393 3.8
18
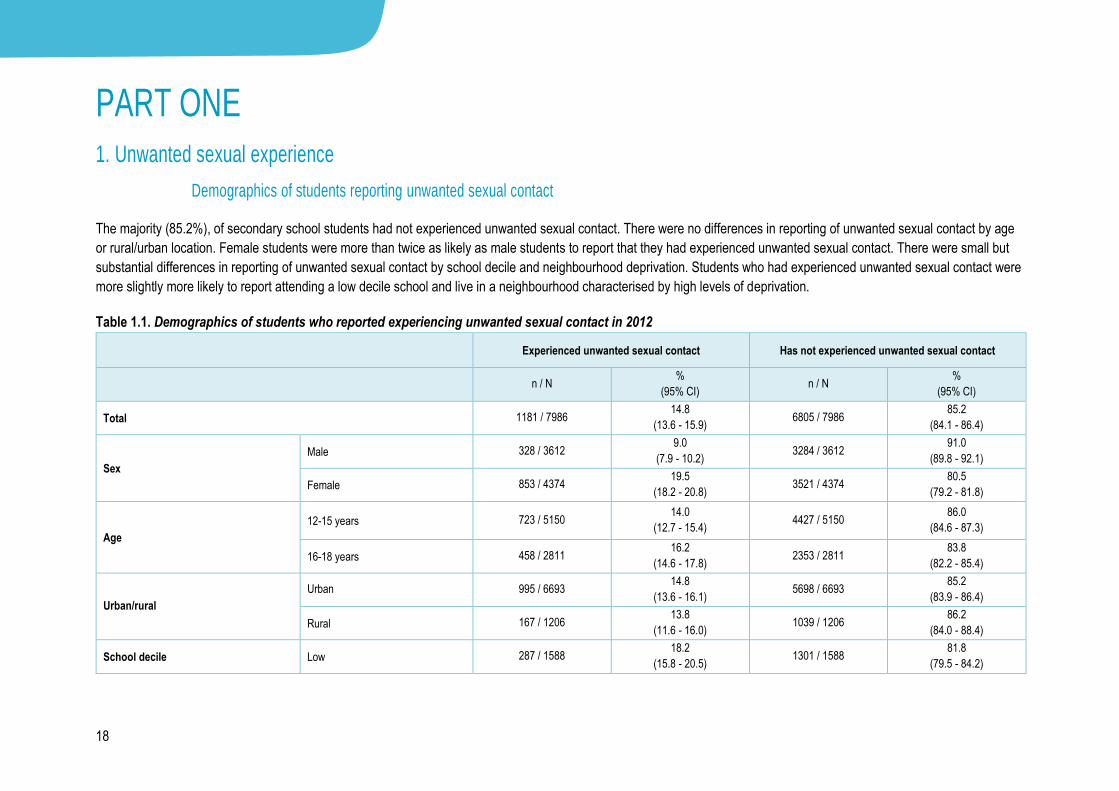
PART ONE 1. Unwanted sexual experience
Demographics of students reporting unwanted sexual contact
The majority (85.2%), of secondary school students had not experienced unwanted sexual contact. There were no differences in reporting of unwanted sexual contact by age
or rural/urban location. Female students were more than twice as likely as male students to report that they had experienced unwanted sexual contact. There were small but
substantial differences in reporting of unwanted sexual contact by school decile and neighbourhood deprivation. Students who had experienced unwanted sexual contact were
more slightly more likely to report attending a low decile school and live in a neighbourhood characterised by high levels of deprivation.
Table 1.1. Demographics of students who reported experiencing unwanted sexual contact in 2012
Experienced unwanted sexual contact Has not experienced unwanted sexual contact
n / N %
(95% CI) n / N
%
(95% CI)
Total 1181 / 7986 14.8
(13.6 - 15.9) 6805 / 7986
85.2
(84.1 - 86.4)
Sex
Male 328 / 3612 9.0
(7.9 - 10.2) 3284 / 3612
91.0
(89.8 - 92.1)
Female 853 / 4374 19.5
(18.2 - 20.8) 3521 / 4374
80.5
(79.2 - 81.8)
Age
12-15 years 723 / 5150 14.0
(12.7 - 15.4) 4427 / 5150
86.0
(84.6 - 87.3)
16-18 years 458 / 2811 16.2
(14.6 - 17.8) 2353 / 2811
83.8
(82.2 - 85.4)
Urban/rural
Urban 995 / 6693 14.8
(13.6 - 16.1) 5698 / 6693
85.2
(83.9 - 86.4)
Rural 167 / 1206 13.8
(11.6 - 16.0) 1039 / 1206
86.2
(84.0 - 88.4)
School decile Low 287 / 1588 18.2
(15.8 - 20.5) 1301 / 1588
81.8
(79.5 - 84.2)

19
Medium 455 / 3116 14.5
(12.7 - 16.4) 2661 / 3116
85.5
(83.6 - 87.3)
High 441 / 3284 13.4
(12.1 - 14.6) 2843 / 3284
86.6
(85.4 - 87.9)
Neighbourhood deprivation
Low 339 / 2631 12.8
(11.3 - 14.2) 2292 / 2631
87.3
(85.8 - 88.7)
Medium 375 / 2846 13.2
(11.8 - 14.5) 2471 / 2846
86.8
(85.5 - 88.2)
High 448 / 2422 18.6
(16.6 - 20.6) 1974 / 2422
81.4
(79.4 - 83.4)
20
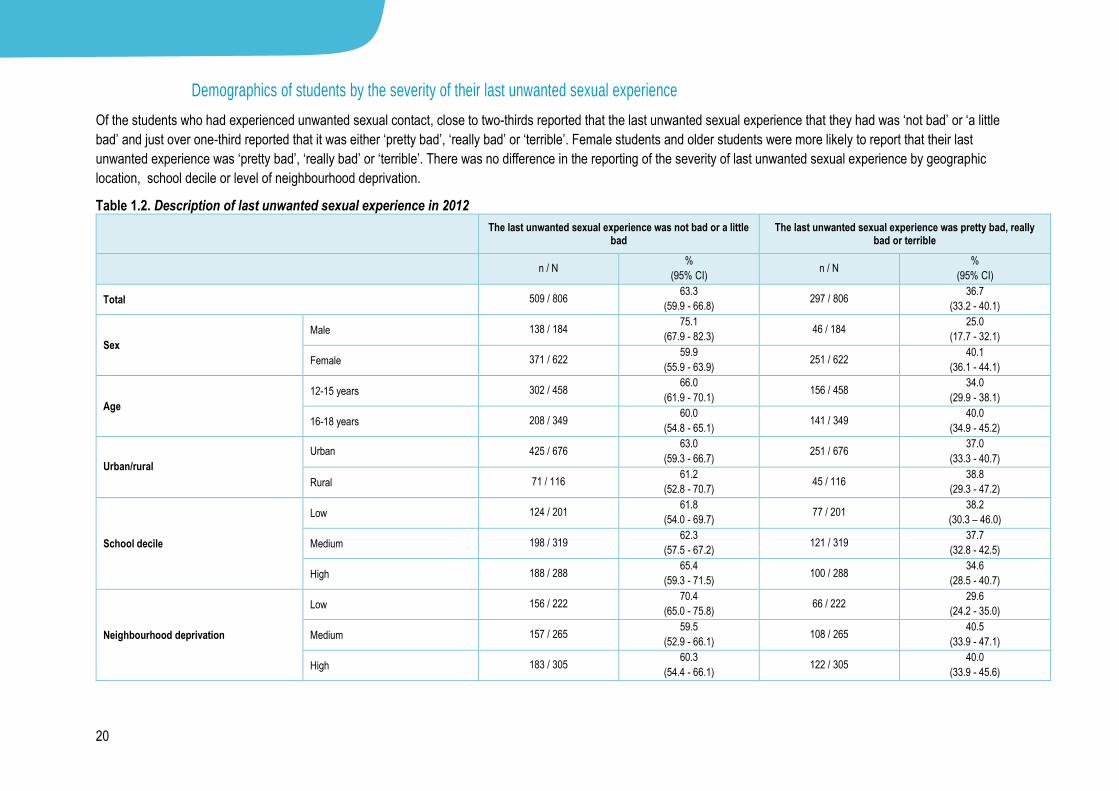
Demographics of students by the severity of their last unwanted sexual experience
Of the students who had experienced unwanted sexual contact, close to two-thirds reported that the last unwanted sexual experience that they had was ‘not bad’ or ‘a little
bad’ and just over one-third reported that it was either ‘pretty bad’, ‘really bad’ or ‘terrible’. Female students and older students were more likely to report that their last
unwanted experience was ‘pretty bad’, ‘really bad’ or ‘terrible’. There was no difference in the reporting of the severity of last unwanted sexual experience by geographic
location, school decile or level of neighbourhood deprivation.
Table 1.2. Description of last unwanted sexual experience in 2012
The last unwanted sexual experience was not bad or a little bad
The last unwanted sexual experience was pretty bad, really bad or terrible
n / N %
(95% CI) n / N
%
(95% CI)
Total 509 / 806 63.3
(59.9 - 66.8) 297 / 806
36.7
(33.2 - 40.1)
Sex
Male 138 / 184 75.1
(67.9 - 82.3) 46 / 184
25.0
(17.7 - 32.1)
Female 371 / 622 59.9
(55.9 - 63.9) 251 / 622
40.1
(36.1 - 44.1)
Age
12-15 years 302 / 458 66.0
(61.9 - 70.1) 156 / 458
34.0
(29.9 - 38.1)
16-18 years 208 / 349 60.0
(54.8 - 65.1) 141 / 349
40.0
(34.9 - 45.2)
Urban/rural
Urban 425 / 676 63.0
(59.3 - 66.7) 251 / 676
37.0
(33.3 - 40.7)
Rural 71 / 116 61.2
(52.8 - 70.7) 45 / 116
38.8
(29.3 - 47.2)
School decile
Low 124 / 201 61.8
(54.0 - 69.7) 77 / 201
38.2
(30.3 – 46.0)
Medium 198 / 319 62.3
(57.5 - 67.2) 121 / 319
37.7
(32.8 - 42.5)
High 188 / 288 65.4
(59.3 - 71.5) 100 / 288
34.6
(28.5 - 40.7)
Neighbourhood deprivation
Low 156 / 222 70.4
(65.0 - 75.8) 66 / 222
29.6
(24.2 - 35.0)
Medium 157 / 265 59.5
(52.9 - 66.1) 108 / 265
40.5
(33.9 - 47.1)
High 183 / 305 60.3
(54.4 - 66.1) 122 / 305
40.0
(33.9 - 45.6)

21
Relationship to person who has forced an unwanted sexual experience on someone else
Students who had experienced unwanted sexual contact most commonly reported that it was either a boyfriend/girlfriend (40%) or a friend (30%) who touched them or made
them do things they did not want to do. Similar proportions of both males and females reported experiencing unwanted sexual contact from friends (about 30%), and a greater
proportion of females (15%) than males (9%) from a relative or an adult they knew. There were no major differences in the students’ relationship to the person forcing the
sexual experience by age, geographic location, school decile or neighbourhood deprivation.
Table 1.3. Relationship to person who had touched student in a sexual way or made them do things that they did not want to do in 2012
Boyfriend or girlfriend Friend Relative Parent
n / N %
(95% CI) n / N
%
(95% CI) n / N
%
(95% CI) n / N
%
(95% CI)
Total 315 / 789 40.1
(36.9 - 43.3) 235 / 789
29.8
(26.8 - 32.8) 107 / 789
13.6
(8.5 - 14.7) 22 / 789
2.8
(1.6 - 3.9)
Sex
Male 92 / 179
51.8
(45.5 - 58.2) 57 / 179
31.5
(24.8 - 38.2) 16 / 179
9.1
(4.4 - 13.7) 6 / 179
3.1
(0.3 - 5.9)
Female 223 / 610
36.6
(32.9 - 40.4) 178 / 610
29.3
(26.1 - 32.6) 91 / 610
15.0
(11.2 - 18.8) 16 / 610
2.6
(1.4 - 3.9)
Age
12-15 years 184 / 448
41.2
(37.2 - 45.3) 153 / 448
34.2
(30.5 - 37.8) 64 / 448
14.5
(10.1 - 18.9) 15 / 448
3.3
(1.7 - 4.9)
16-18 years 131 / 342
38.5
(33.6 - 43.3) 83 / 342
24.4
(19.2 - 29.6) 43 / 342
12.5
(8.9 - 16.1) 7 / 342
2.1
(0.6 - 3.6)
Urban/rural
Urban 261 / 659
39.7
(36.2 - 43.1) 196 / 659
29.7
(26.2 - 33.1) 92 / 659
14.0
(10.5 - 17.6) 19 / 659
2.9
(1.6 - 4.2)
Rural 45 / 116
39.5
(32.8 - 46.1) 36 / 116
31.6
(25.8 - 37.5) 14 / 116
12.2
(6.6 - 17.8) 3 / 116
2.2
(0 - 4.8)
School decile
Low 69 / 196
35.1
(30.0 - 40.2) 61 / 196
31.7
(25.3 - 38.2) 40 / 196
20.5
(11.5 - 29.5) 5 / 196
2.6
(0.8 - 4.4)
Medium 126 / 313
40.6
(35.8 - 45.3) 88 / 313
28.2
(23.2 - 33.1) 36 / 313
11.7
(7.7 - 15.7) 12 / 313
3.7
(1.4 – 6.0)
High 120 / 282
42.7
(37.1 - 48.3) 87 / 282
30.5
(26.2 - 34.9) 31 / 282
11.0
(7.5 - 14.5) 5 / 282
1.8
(0.4 - 3.2)
Neighbourhood deprivation
Low 99 / 218
45.8
(40.3 - 51.4) 71 / 218
32.0
(26.4 - 37.6) 19 / 218
8.7
(5.3 – 12.0) 6 / 218
2.8
(0.6 – 5.0)
Medium 95 / 258
36.9
(31.1 - 42.6) 80 / 258
31.3
(25.5 – 37.0) 33 / 258
13.1
(9.1 - 17.1) 8 / 258
2.9
(0.7 - 5.2)
High 112 / 299
37.5
(32.3 - 42.7) 81 / 299
27.3
(22.1 - 32.5) 54 / 299
18.0
(11.5 - 24.6) 8 / 299
2.7
(0.9 - 4.5)

22
Table 1.3. Relationship to person who had touched student in a sexual way or made them do things that they did not want to do in 2012, continued
An adult that you know A young person that you know A stranger
n / N %
(95% CI) n / N
%
(95% CI) n / N
%
(95% CI)
Total 94 / 789 11.6
(9.7 - 13.5) 112 / 789
14.3
(11.8 – 16.8) 109 / 789
13.8
(11.2 – 16.4)
Sex
Male 10 / 179
5.4
(2.3 - 8.6) 22 / 179
12.4
(7.5 - 17.2) 24 / 179
13.2
(8.1 - 18.3)
Female 84 / 610
13.4
(11.3 - 15.6) 90 / 610
14.9
(12.1 - 17.7) 85 / 610
14.0
(10.9 - 17.1)
Age
12-15 years 44 / 448
9.6
(6.5 - 12.6) 62 / 448
13.9
(10.2 - 17.6) 50 / 448
11.1
(7.9 - 14.4)
16-18 years 50 / 342
14.2
(11.0 - 17.5) 49 / 342
14.5
(10.9 - 18.0) 60 / 342
17.5
(13.5 - 21.6)
Urban/rural
Urban 82 / 659
12.3
(10.2 - 14.4) 97 / 659
14.8
(11.7 - 17.9) 95 / 659
14.4
(11.5 - 17.2)
Rural 10 / 116
7.8
(3.5 - 12.1) 13 / 116
11.6
(5.5 - 17.6) 15 / 116
13.1
(6.2 – 20.0)
School decile
Low 23 / 196
11.4
(7.9 - 14.9) 22 / 196
11.4
(5.9 – 17.0) 28 / 196
14.1
(7.7 - 20.5)
Medium 38 / 313
11.8
(9.0 - 14.6) 44 / 313
14.1
(10.8 - 17.4) 47 / 313
15.1
(11.6 - 18.7)
High 33 / 282
11.5
(8.1 - 14.9) 46 / 282
16.5
(12.3 - 20.6) 35 / 282
12.3
(8.0 - 16.7)
Neighbourhood deprivation
Low 22 / 218
9.8
(6.4 - 13.2) 35 / 218
16.2
(11.6 - 20.8) 20 / 218
9.1
(4.3 - 13.9)
Medium 33 / 258
12.4
(8.4 - 16.3) 42 / 258
16.4
(12.7 - 20.2) 43 / 258
16.8
(12.4 - 21.3)
High 37 / 299
12.3
(9.5 - 15.1) 33 / 299
11.1
(7.2 - 15.0) 47 / 299
15.5
(11.7 - 19.3)
1 A boyfriend or girlfriend includes someone you were going out with or went on a date with 2 Students could select as many options as needed and so the percentages do not necessarily add to 100

23
Age of first unwanted sexual experience Over half (55%) of both females and males reported their first unwanted sexual experience occurred before they were 14 years old.
Table 1.4. Age of first unwanted sexual experience in 2012
10 years or younger 11-13 years old 14 years or older
n / N %
(95% CI) n / N
%
(95% CI) n / N
%
(95% CI)
Total 173 / 790 21.8
(18.9 - 24.7) 266 / 790
33.5
(30.6 - 36.5) 351 / 790
44.6
(41.1 - 48.2)
Sex
Male 37 / 177 20.7
(13.3 - 28.0) 62 / 177
34.8
(27.4 - 42.3) 78 / 177
44.5
(37.2 - 51.8)
Female 136 / 273 22.1
(19.0 - 25.3) 204 / 273
33.2
(29.8 - 36.6) 273 / 613
44.7
(40.8 - 48.5)
Urban/rural
Urban 152 / 661 22.9
(19.9 - 25.9) 217 / 661
32.8
(29.5 -36.0) 292 / 661
44.4
(40.4 - 48.3)
Rural 20 / 115 17.5
(11.0 - 24.1) 46 / 115
39.6
(29.3 - 49.9) 49 / 115
42.8
(33.7 - 51.9)
School decile
Low 52 / 197 26.3
(20.6 – 32.0) 56 / 197
28.5
(22.7 - 34.2) 89 / 197
45.2
(38.0 - 52.4)
Medium 72 / 313 22.9
(18.3 - 27.6) 114 / 313
36.2
(31.5 - 40.9) 127 / 313
40.9
(35.6 - 46.2)
High 50 / 282 17.6
(12.9 - 22.3) 97 / 282
34.2
(29.6 - 38.9) 135 / 282
48.1
(42.3 - 54.0)
Neighbourhood deprivation
Low 37 / 218 16.5
(11.8 - 21.2) 80 / 218
36.7
(30.3 - 43.1) 101 / 218
46.8
(40.0 - 53.6)
Medium 65 / 259 25.3
(20.0 - 30.5) 87 / 259
33.3
(28.7 - 37.9) 107 / 259
41.4
(36.3 - 46.6)
High 70 / 299 23.4
(19.1 - 27.8) 96 / 299
32.0
(27.5 - 36.6) 133 / 299
44.5
(38.7 - 50.4) 1 The proportion of students who reported to have had their first unwanted sexual experience at 10 years or younger and 11-13 years is likely to be slightly inflated in comparison to the proportion of students who
reported to have their first unwanted sexual experience at 14 or older. This is because both older and younger students are able to respond to the age categories of first having an unwanted sexual experience at a
younger age, but younger students who at the time of the survey will not have had not had such an experience, but went on to have their first unwanted sexual experience at 14 or older have been excluded from
this table. For this same reason the proportion of students who reported to have their first unwanted sexual experience at 14 or older is likely to underrepresent the general student population. Further a bigger
proportion of younger students (12-15 years) than older students (16-18 years) completed the survey. 2 The Age demographic has been removed from the table as the breakdown of the data for each column has been done by age groups.
24
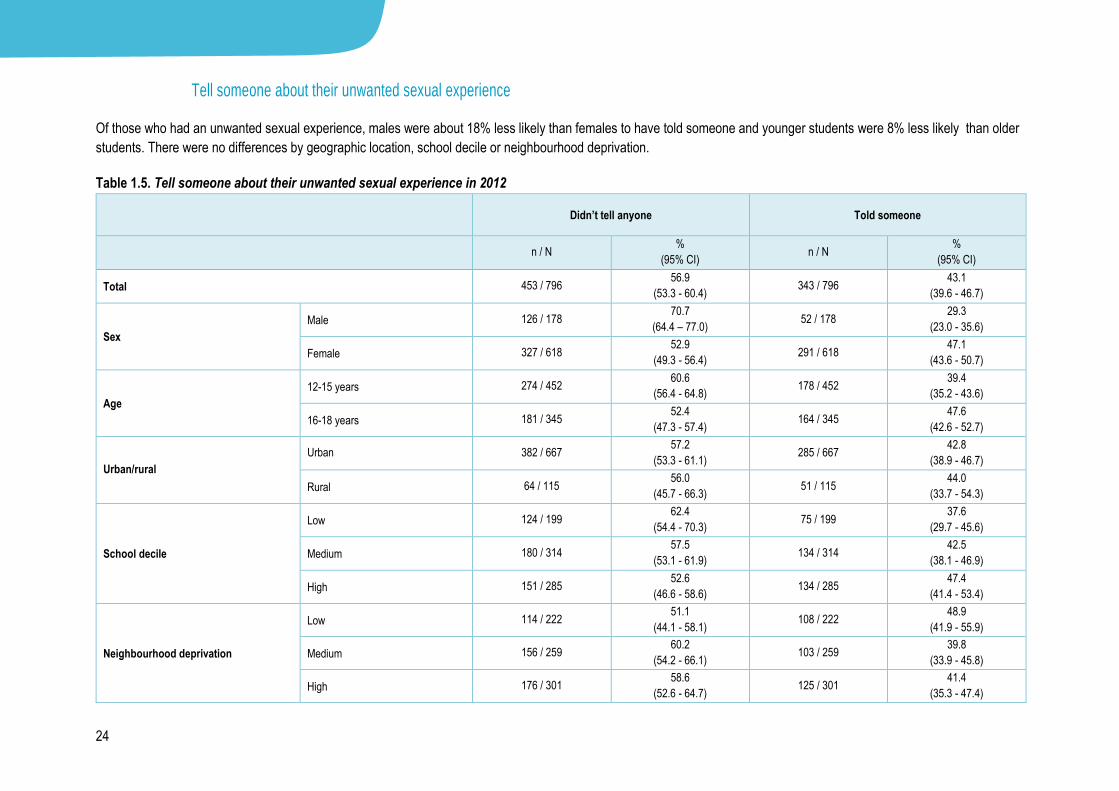
Tell someone about their unwanted sexual experience
Of those who had an unwanted sexual experience, males were about 18% less likely than females to have told someone and younger students were 8% less likely than older
students. There were no differences by geographic location, school decile or neighbourhood deprivation.
Table 1.5. Tell someone about their unwanted sexual experience in 2012
Didn’t tell anyone Told someone
n / N %
(95% CI) n / N
%
(95% CI)
Total 453 / 796 56.9
(53.3 - 60.4) 343 / 796
43.1
(39.6 - 46.7)
Sex
Male 126 / 178 70.7
(64.4 – 77.0) 52 / 178
29.3
(23.0 - 35.6)
Female 327 / 618 52.9
(49.3 - 56.4) 291 / 618
47.1
(43.6 - 50.7)
Age
12-15 years 274 / 452 60.6
(56.4 - 64.8) 178 / 452
39.4
(35.2 - 43.6)
16-18 years 181 / 345 52.4
(47.3 - 57.4) 164 / 345
47.6
(42.6 - 52.7)
Urban/rural
Urban 382 / 667 57.2
(53.3 - 61.1) 285 / 667
42.8
(38.9 - 46.7)
Rural 64 / 115 56.0
(45.7 - 66.3) 51 / 115
44.0
(33.7 - 54.3)
School decile
Low 124 / 199 62.4
(54.4 - 70.3) 75 / 199
37.6
(29.7 - 45.6)
Medium 180 / 314 57.5
(53.1 - 61.9) 134 / 314
42.5
(38.1 - 46.9)
High 151 / 285 52.6
(46.6 - 58.6) 134 / 285
47.4
(41.4 - 53.4)
Neighbourhood deprivation
Low 114 / 222 51.1
(44.1 - 58.1) 108 / 222
48.9
(41.9 - 55.9)
Medium 156 / 259 60.2
(54.2 - 66.1) 103 / 259
39.8
(33.9 - 45.8)
High 176 / 301 58.6
(52.6 - 64.7) 125 / 301
41.4
(35.3 - 47.4)

25
Relationship to person who they told about their unwanted sexual experience
Of the students who told someone a both their unwanted sexual experience, the majority (69%) had told a friend while just over one-third (38%) had told a parent. In addition
students in high deprivation neighbourhoods are more likely to have talked to another family member about their experience.
Table 1.6. Relationship to person who they told about their unwanted sexual experience in 2012
Parent Other family member School counsellor Teacher Friend
n / N %
(95% CI) n / N
%
(95% CI) n / N
%
(95% CI) n / N
%
(95% CI) n / N
%
(95% CI)
Total 130 / 341 37.9
(32.7 - 43.0) 57 / 341
16.7
(12.7 - 20.7) 49 / 341
14.4
(10.4 - 18.5) 25 / 341
7.2
(4.5 - 9.9) 234 / 341
69.0
(64.5 - 73.4)
Sex
Male 23 / 50 44.9
(33.2 - 56.7) 4 / 50
7.8
(0.5 - 15.1) 6 / 50
12.1
(3.0 - 21.3) 4 / 50
8.1
(0.6 - 15.5) 30 / 50
60.8
(46.7 - 74.9)
Female 107 / 291 36.7
(30.9 - 42.5) 53 / 291
18.2
(13.8 - 22.7) 43 / 291
14.8
(10.4 - 19.3) 21 / 291
7.0
(4.2 - 9.9) 204 / 291
70.4
(65.0 - 75.7)
Age
12-15 years 67 / 177 37.8
(31.4 - 44.2) 38 / 177
21.7
(15.6 - 27.8) 23 / 177
13.1
(7.9 - 18.2) 14 / 177
7.6
(3.9 - 11.4) 124 / 177
70.3
(65.1 - 75.5)
16-18 years 62 / 163 37.6
(29.2 – 46.0) 19 / 163
11.4
(6.6 - 16.2) 26 / 163
16.0
(10.8 - 21.3) 11 / 163
6.8
(2.9 - 10.6) 109 / 163
67.3
(60.2 - 74.5)
Urban/rural
Urban 111 / 284 38.9
(33.5 - 44.2) 50 / 284
17.4
(12.8 - 22.1) 41 / 284
14.5
(10.1 - 18.9) 18 / 284
6.4
(3.6 - 9.1) 192 / 284
67.8
(62.9 - 72.7)
Rural 17 / 51 32.8
(16.7 - 48.9) 6 / 51
12.3
(3.8 - 20.7) 7 / 51
13.9
(4.9 - 22.8) 6 / 51
10.8
(3.1 - 18.6) 38 / 51
76.1
(64.4 - 87.7)
School decile
Low 28 / 75 36.8
(24.4 - 49.2) 18 / 75
23.2
(14.6 - 31.9) 9 / 75
12.2
(3.8 - 20.6) 5 / 75
6.8
(1.1 - 12.4) 48 / 75
64.7
(56.4 – 73.0)
Medium 56 / 133 41.7
(34.7 - 48.7) 27 / 133
20.7
(15.4 – 26.0) 23 / 133
17.3
(9.6 - 25.1) 10 / 133
7.1
(2.6 - 11.5) 90 / 133
68.3
(60.4 - 76.1)
High 46 / 133 34.8
(26.2 - 43.3) 12 / 133
9.0
(4.3 - 13.7) 17 / 133
12.8
(7.9 - 17.8) 10 / 133
7.5
(3.3 - 11.7) 96 / 133
72.0
(65.6 - 78.5)
Neighbourhood deprivation
Low 35 / 107 32.6
(24.9 - 40.2) 11 / 107
10.4
(4.6 - 16.2) 14 / 107
13.2
(7.8 - 18.6) 7 / 107
6.1
(1.0 - 11.3) 81 / 107
75.9
(68.0 - 83.9)
Medium 44 / 103 42.4
(33.4 - 51.4) 14 / 103
13.9
(6.9 - 20.9) 15 / 103
14.5
(7.2 - 21.8) 8 / 103
7.7
(2.5 - 12.8) 65 / 103
63.5
(53.0 – 74.0)
High 49 / 125 39.0
(29.9 - 48.0) 31 / 125
24.4
(17.5 - 31.2) 19 / 125
15.4
(8.8 - 21.9) 9 / 125
7.3
(2.7 - 11.8) 84 / 125
67.6
(60.2 - 75.0)

26
Table 1.6. Relationship to person who they told about their unwanted sexual experience in 2012 continued
Friend’s parent Doctor or nurse Someone from my church Another adult Other
n / N %
(95% CI) n / N
%
(95% CI) n / N
%
(95% CI) n / N
%
(95% CI) n / N
%
(95% CI)
Total 12 / 341
3.6
(1.6 - 5.7) 14 / 341
4.1
(2.2 - 6.1) 5 / 341
1.5
(0.2 - 2.8) 15 / 341
4.4
(2.1 - 6.7) 35 / 341
10.3
(7.2 - 13.4)
Sex
Male 2 / 50
4.5
(0 - 10.1) 0 / 50 - 0 / 50 - 0 / 50 - 7 / 50
14.6
(5.2 - 24.1)
Female 10 / 291
3.5
(1.3 - 5.6) 14 / 291
4.9
(2.6 - 7.1) 5 / 291
1.7
(0.2 - 3.2) 15 / 291
5.2
(2.5 - 7.9) 28 / 291
9.5
(6.0 -13.0)
Age
12-15 years 8 / 177
4.7
(1.3 - 8.1) 5 / 177
2.9
(0.4 - 5.3) 1 / 283
0.4
(0 - 1.1) 9 / 177
5.2
(2.0 - 8.3) 21 / 177
11.9
(7.3 - 16.4)
16-18 years 4 / 163
2.5
(0.1 - 4.9) 9 / 163
5.6
(2.3 - 8.8) 3 / 44
6.9
(0 - 14.3) 6 / 163
3.7
(0.5 - 6.9) 14 / 163
8.6
(4.6 - 12.7)
Urban/rural
Urban 10 / 284
3.6
(1.3 - 5.9) 10 / 284
3.5
(1.5 - 5.6) 5 / 284
1.8
(0.3 - 3.3) 13 / 284
4.6
(2.2 – 7.0) 31 / 284
11.1
(7.6 - 14.5)
Rural 1 / 51
2.0
(0.0 - 5.9) 3 / 51
6.1
(0 - 12.5) 0 / 51 -
2 / 51
4.1
(0.0 - 9.4) 4 / 51
7.1
(0 - 14.4)
School decile
Low 1 / 75
1.4
(0.0 - 3.9) 3 / 75
4.1
(0 - 8.5) 2 / 75
2.7
(0 - 6.7) 3 / 75
4.1
(0.0 - 8.2) 13 / 75
16.9
(10.1 - 23.8)
Medium 7 / 133
5.5
(1.3 - 9.7) 5 / 133
3.8
(0.7 - 6.9) 1 / 133
0.8
(0 - 2.2) 5 / 133
3.8
(1.0 - 6.6) 7 / 133
5.5
(0.8 - 10.1)
High 4 / 133
3.0
(0.3 - 5.8) 6 / 133
4.5
(1.7 - 7.4) 2 / 133
1.5
(0 - 3.5) 7 / 133
5.3
(0.7 - 9.9) 15 / 133
11.3
(6.4 - 16.2)
Neighbourhood deprivation
Low 3 / 107
2.8
(0.0 - 5.9) 5 / 107
4.7
(0.9 - 8.5) 1 / 107
0.9
(0.0 - 2.8) 5 / 107
4.7
(0.7 - 8.8) 8 / 107
7.6
(2.1 - 13)
Medium 3 / 103
3.1
(0.0 - 6.5) 3 / 103
2.9
(0.0 - 6.2) 0.0 / 103 - 5 / 103
4.9
(0.9 - 8.9) 11 / 103
11.0
(3.8 - 18.2)
High 5 / 125
4.1
(0.6 - 7.5) 5 / 125
4.0
(0.5 - 7.6) 4 / 125
3.2
(0.1 - 6.4) 5 / 125
4.0
(0.8 - 7.3) 16 / 125
12.5
(7.5 - 17.6)

27
Demographics of students who reported forcing someone to do sexual things that they did not want to do
In 2012, less than 3% of students reported forcing someone to do sexual things that they did not want to. Males were about twice as likely as females to have reported doing
this.
Table 1.7. Students who reported that they had forced someone else to do sexual things that they did not want to do in 2012
Forced unwanted sexual experience Has not forced unwanted sexual experience
n / N %
(95% CI) n / N
%
(95% CI)
Total 245 / 8431 2.9
(2.5 – 3.4) 8186 / 8431
97.1
(96.6 – 97.5)
Sex
Male 157 / 3839 4.1
(3.5 - 4.8) 3682 / 3839
95.9
(95.2 - 96.5)
Female 88 / 4592 1.9
(1.5 - 2.3) 4504 / 4592
98.1
(97.7 - 98.5)
Age
12-15 years 151 / 5442 2.8
(2.3 - 3.3) 5291 / 5442
97.2
(96.7 - 97.7)
16-18 years 90 / 2954 3.1
(2.4 - 3.8) 2864 / 2954
96.9
(96.2 - 97.6)
Urban/rural
Urban 203 / 7071 2.9
(2.4 - 3.3) 6868 / 7071
97.1
(96.7 - 97.6)
Rural 36 / 1265 2.9
(1.6 - 4.3) 1229 / 1265
97.1
(95.7 - 98.4)
School decile
Low 50 / 1762 2.8
(2.0 - 3.7) 1712 / 1762
97.2
(96.3 - 98)
Medium 97 / 3271 3.0
(2.2 - 3.8) 3174 / 3271
97.0
(96.2 - 97.8)
High 98 / 3400 2.9
(2.2 - 3.6) 3302 / 3400
97.1
(96.4 - 97.8)
Neighbourhood deprivation
Low 78 / 2712 2.9
(2.3 - 3.5) 2634 / 2712
97.1
(96.5 - 97.7)
Medium 91 / 2984 3.1
(2.3 - 3.9) 2893 / 2984
96.9
(96.1 - 97.7)
High 70 / 2640 2.6
(2.0 - 3.2) 2570 / 2640
97.4
(96.8 - 98.0)
28
2. Trends over time in reported unwanted sexual experience among students
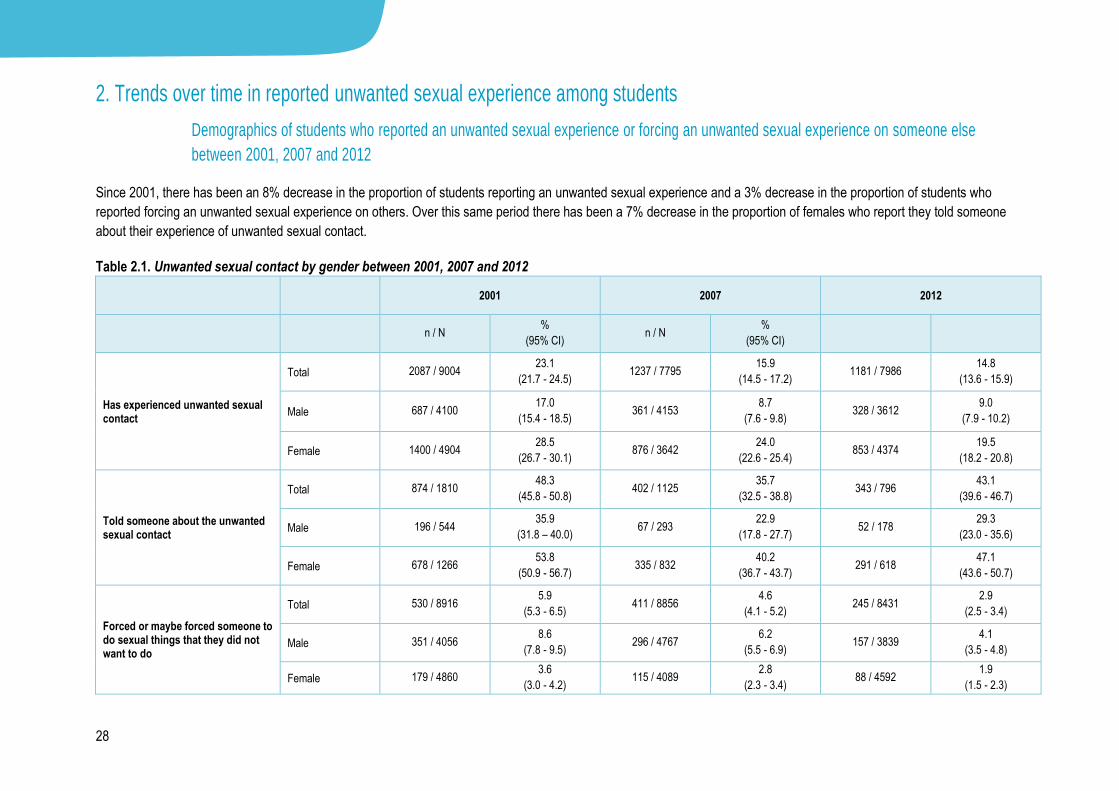
Demographics of students who reported an unwanted sexual experience or forcing an unwanted sexual experience on someone else
between 2001, 2007 and 2012
Since 2001, there has been an 8% decrease in the proportion of students reporting an unwanted sexual experience and a 3% decrease in the proportion of students who
reported forcing an unwanted sexual experience on others. Over this same period there has been a 7% decrease in the proportion of females who report they told someone
about their experience of unwanted sexual contact.
Table 2.1. Unwanted sexual contact by gender between 2001, 2007 and 2012 2001 2007 2012
n / N %
(95% CI) n / N
%
(95% CI)
Has experienced unwanted sexual contact
Total 2087 / 9004 23.1
(21.7 - 24.5) 1237 / 7795
15.9
(14.5 - 17.2) 1181 / 7986
14.8
(13.6 - 15.9)
Male 687 / 4100 17.0
(15.4 - 18.5) 361 / 4153
8.7
(7.6 - 9.8) 328 / 3612
9.0
(7.9 - 10.2)
Female 1400 / 4904 28.5
(26.7 - 30.1) 876 / 3642
24.0
(22.6 - 25.4) 853 / 4374
19.5
(18.2 - 20.8)
Told someone about the unwanted sexual contact
Total 874 / 1810 48.3
(45.8 - 50.8) 402 / 1125
35.7
(32.5 - 38.8) 343 / 796
43.1
(39.6 - 46.7)
Male 196 / 544 35.9
(31.8 – 40.0) 67 / 293
22.9
(17.8 - 27.7) 52 / 178
29.3
(23.0 - 35.6)
Female 678 / 1266 53.8
(50.9 - 56.7) 335 / 832
40.2
(36.7 - 43.7) 291 / 618
47.1
(43.6 - 50.7)
Forced or maybe forced someone to do sexual things that they did not want to do
Total 530 / 8916 5.9
(5.3 - 6.5) 411 / 8856
4.6
(4.1 - 5.2) 245 / 8431
2.9
(2.5 - 3.4)
Male 351 / 4056 8.6
(7.8 - 9.5) 296 / 4767
6.2
(5.5 - 6.9) 157 / 3839
4.1
(3.5 - 4.8)
Female 179 / 4860 3.6
(3.0 - 4.2) 115 / 4089
2.8
(2.3 - 3.4) 88 / 4592
1.9
(1.5 - 2.3)
29
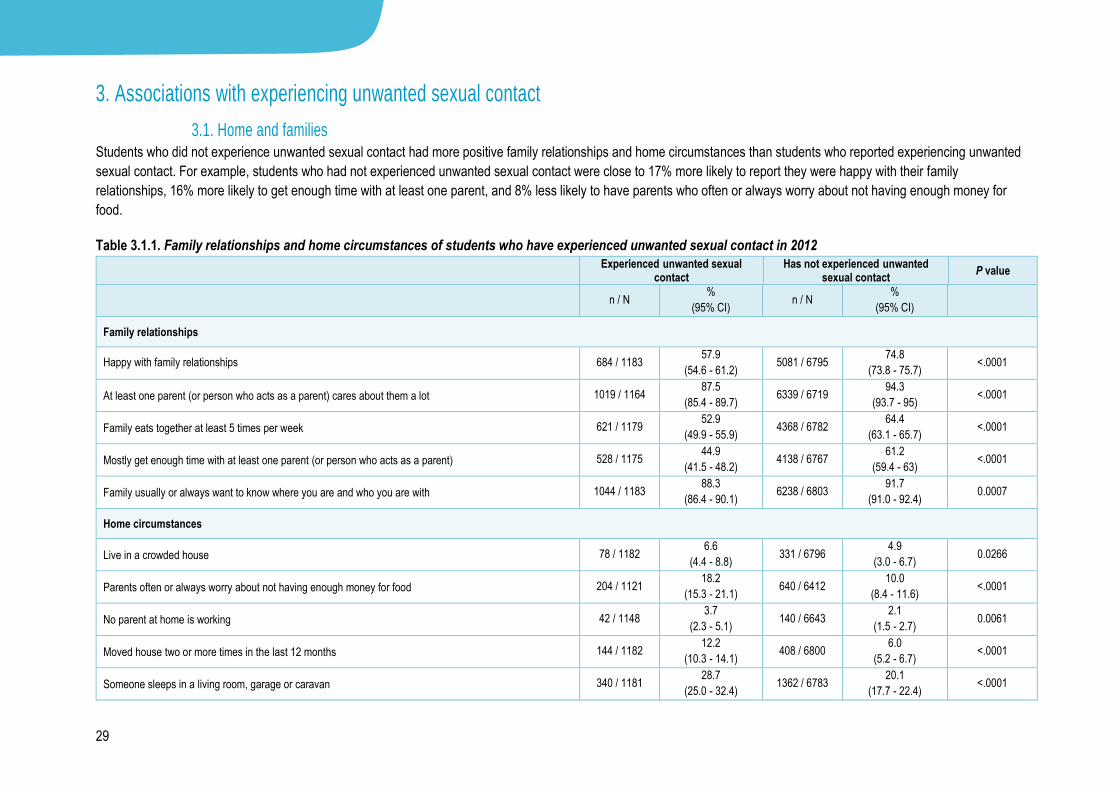
3. Associations with experiencing unwanted sexual contact
3.1. Home and families Students who did not experience unwanted sexual contact had more positive family relationships and home circumstances than students who reported experiencing unwanted
sexual contact. For example, students who had not experienced unwanted sexual contact were close to 17% more likely to report they were happy with their family
relationships, 16% more likely to get enough time with at least one parent, and 8% less likely to have parents who often or always worry about not having enough money for
food.
Table 3.1.1. Family relationships and home circumstances of students who have experienced unwanted sexual contact in 2012
Experienced unwanted sexual
contact Has not experienced unwanted
sexual contact P value
n / N
%
(95% CI) n / N
%
(95% CI)
Family relationships
Happy with family relationships 684 / 1183 57.9
(54.6 - 61.2) 5081 / 6795
74.8
(73.8 - 75.7) <.0001
At least one parent (or person who acts as a parent) cares about them a lot 1019 / 1164 87.5
(85.4 - 89.7) 6339 / 6719
94.3
(93.7 - 95) <.0001
Family eats together at least 5 times per week 621 / 1179 52.9
(49.9 - 55.9) 4368 / 6782
64.4
(63.1 - 65.7) <.0001
Mostly get enough time with at least one parent (or person who acts as a parent) 528 / 1175 44.9
(41.5 - 48.2) 4138 / 6767
61.2
(59.4 - 63) <.0001
Family usually or always want to know where you are and who you are with 1044 / 1183 88.3
(86.4 - 90.1) 6238 / 6803
91.7
(91.0 - 92.4) 0.0007
Home circumstances
Live in a crowded house 78 / 1182 6.6
(4.4 - 8.8) 331 / 6796
4.9
(3.0 - 6.7) 0.0266
Parents often or always worry about not having enough money for food 204 / 1121 18.2
(15.3 - 21.1) 640 / 6412
10.0
(8.4 - 11.6) <.0001
No parent at home is working 42 / 1148 3.7
(2.3 - 5.1) 140 / 6643
2.1
(1.5 - 2.7) 0.0061
Moved house two or more times in the last 12 months 144 / 1182 12.2
(10.3 - 14.1) 408 / 6800
6.0
(5.2 - 6.7) <.0001
Someone sleeps in a living room, garage or caravan 340 / 1181 28.7
(25.0 - 32.4) 1362 / 6783
20.1
(17.7 - 22.4) <.0001
30
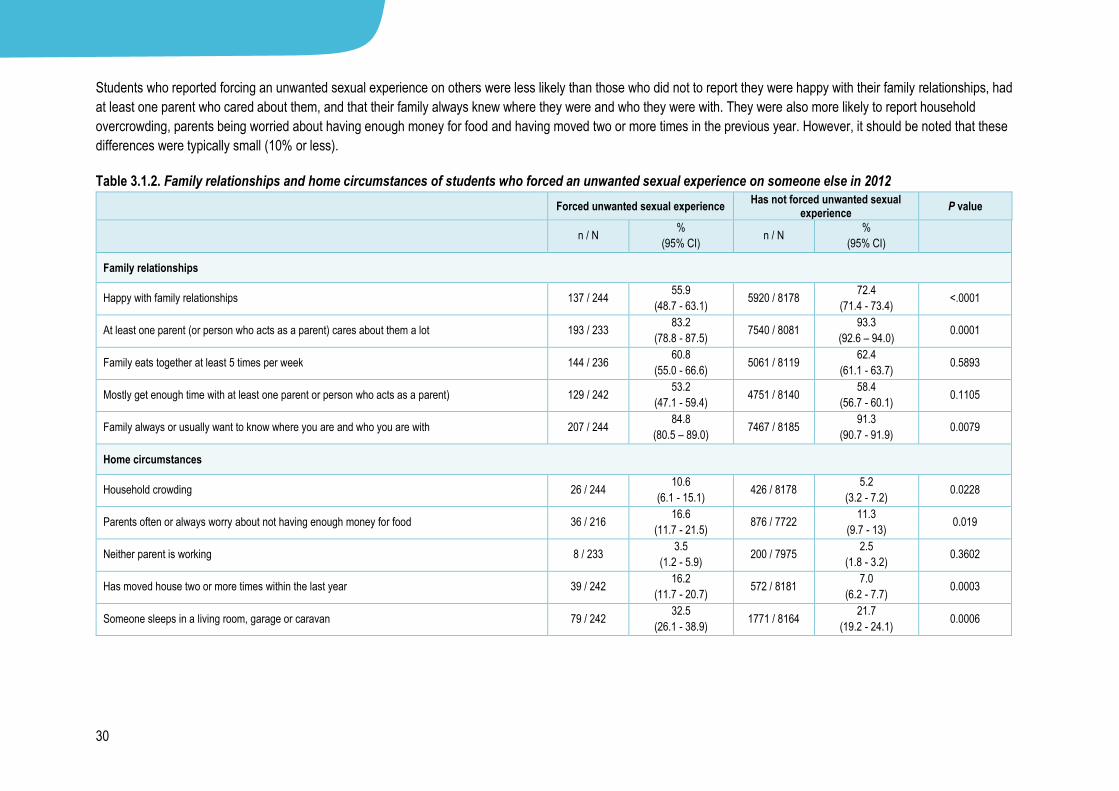
Students who reported forcing an unwanted sexual experience on others were less likely than those who did not to report they were happy with their family relationships, had
at least one parent who cared about them, and that their family always knew where they were and who they were with. They were also more likely to report household
overcrowding, parents being worried about having enough money for food and having moved two or more times in the previous year. However, it should be noted that these
differences were typically small (10% or less).
Table 3.1.2. Family relationships and home circumstances of students who forced an unwanted sexual experience on someone else in 2012
Forced unwanted sexual experience Has not forced unwanted sexual
experience P value
n / N
%
(95% CI) n / N
%
(95% CI)
Family relationships
Happy with family relationships 137 / 244 55.9
(48.7 - 63.1) 5920 / 8178
72.4
(71.4 - 73.4) <.0001
At least one parent (or person who acts as a parent) cares about them a lot 193 / 233 83.2
(78.8 - 87.5) 7540 / 8081
93.3
(92.6 – 94.0) 0.0001
Family eats together at least 5 times per week 144 / 236 60.8
(55.0 - 66.6) 5061 / 8119
62.4
(61.1 - 63.7) 0.5893
Mostly get enough time with at least one parent or person who acts as a parent) 129 / 242 53.2
(47.1 - 59.4) 4751 / 8140
58.4
(56.7 - 60.1) 0.1105
Family always or usually want to know where you are and who you are with 207 / 244 84.8
(80.5 – 89.0) 7467 / 8185
91.3
(90.7 - 91.9) 0.0079
Home circumstances
Household crowding 26 / 244 10.6
(6.1 - 15.1) 426 / 8178
5.2
(3.2 - 7.2) 0.0228
Parents often or always worry about not having enough money for food 36 / 216 16.6
(11.7 - 21.5) 876 / 7722
11.3
(9.7 - 13) 0.019
Neither parent is working 8 / 233 3.5
(1.2 - 5.9) 200 / 7975
2.5
(1.8 - 3.2) 0.3602
Has moved house two or more times within the last year 39 / 242 16.2
(11.7 - 20.7) 572 / 8181
7.0
(6.2 - 7.7) 0.0003
Someone sleeps in a living room, garage or caravan 79 / 242 32.5
(26.1 - 38.9) 1771 / 8164
21.7
(19.2 - 24.1) 0.0006

31
3.2. School environments and aspirations
Students who had experienced unwanted sexual contact were about 10% less likely to report feeling safe at their school and that they get along with their teachers than those
who had not had such an experience. They were also close to 5% less likely to plan to complete secondary school.
Table 3.2.1. School environments and aspirations of students who have experienced unwanted sexual contact in 2012
Experienced unwanted sexual
contact
Has not experienced unwanted
sexual contact P value
n / N
%
(95% CI) n / N
%
(95% CI)
School safety
Feel safe at school 930 / 1182 78.6
(75.0 - 82.1) 6026 / 6799
88.6
(87.1 - 90) <.0001
Bullied at school weekly or more often 137 / 1177 11.6
(9.3 - 13.8) 351 / 6783
5.2
(4.5 - 5.8) <.0001
Get along with teachers 647 / 1182 54.6
(51.6 - 57.6) 4401 / 6801
64.7
(62.8 - 66.6) <.0001
Aspirations and achievement
Student plans to complete school (i.e. finish to year 13) 988 / 1180 83.8
(81.3 - 86.3) 5997 / 6790
88.4
(87.1 - 89.8) 0.0007
Student plans to go to work after finishing school 276 / 1182 23.3
(20.3 - 26.3) 1639 / 6794
24.0
(21.8 - 26.3) 0.5892
Student plans to go to further education after finishing school 750 / 1182 63.5
(60.0 - 66.9) 4443 / 6794
65.5
(63.2 - 67.8) 0.2159
32
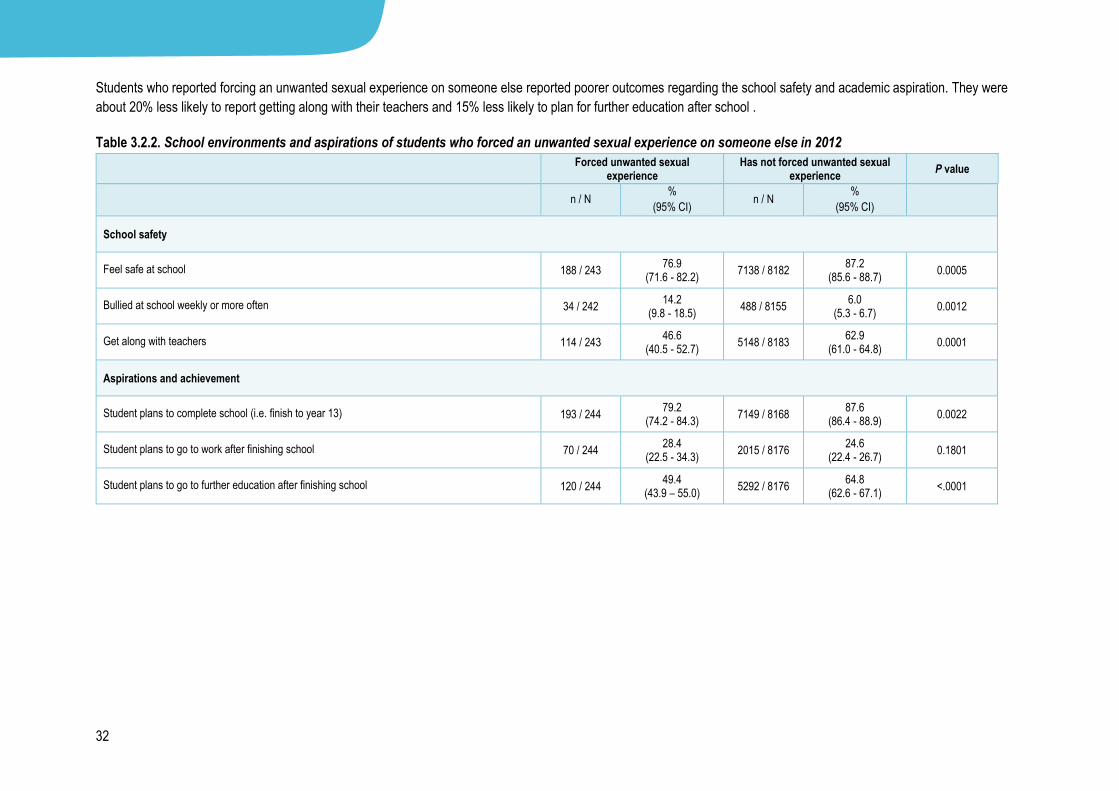
Students who reported forcing an unwanted sexual experience on someone else reported poorer outcomes regarding the school safety and academic aspiration. They were
about 20% less likely to report getting along with their teachers and 15% less likely to plan for further education after school .
Table 3.2.2. School environments and aspirations of students who forced an unwanted sexual experience on someone else in 2012
Forced unwanted sexual
experience
Has not forced unwanted sexual experience
P value
n / N
%
(95% CI) n / N
%
(95% CI)
School safety
Feel safe at school 188 / 243 76.9
(71.6 - 82.2) 7138 / 8182
87.2 (85.6 - 88.7)
0.0005
Bullied at school weekly or more often 34 / 242 14.2
(9.8 - 18.5) 488 / 8155
6.0 (5.3 - 6.7)
0.0012
Get along with teachers 114 / 243 46.6
(40.5 - 52.7) 5148 / 8183
62.9 (61.0 - 64.8)
0.0001
Aspirations and achievement
Student plans to complete school (i.e. finish to year 13) 193 / 244 79.2
(74.2 - 84.3) 7149 / 8168
87.6 (86.4 - 88.9)
0.0022
Student plans to go to work after finishing school 70 / 244 28.4
(22.5 - 34.3) 2015 / 8176
24.6 (22.4 - 26.7)
0.1801
Student plans to go to further education after finishing school 120 / 244 49.4
(43.9 – 55.0) 5292 / 8176
64.8 (62.6 - 67.1)
<.0001
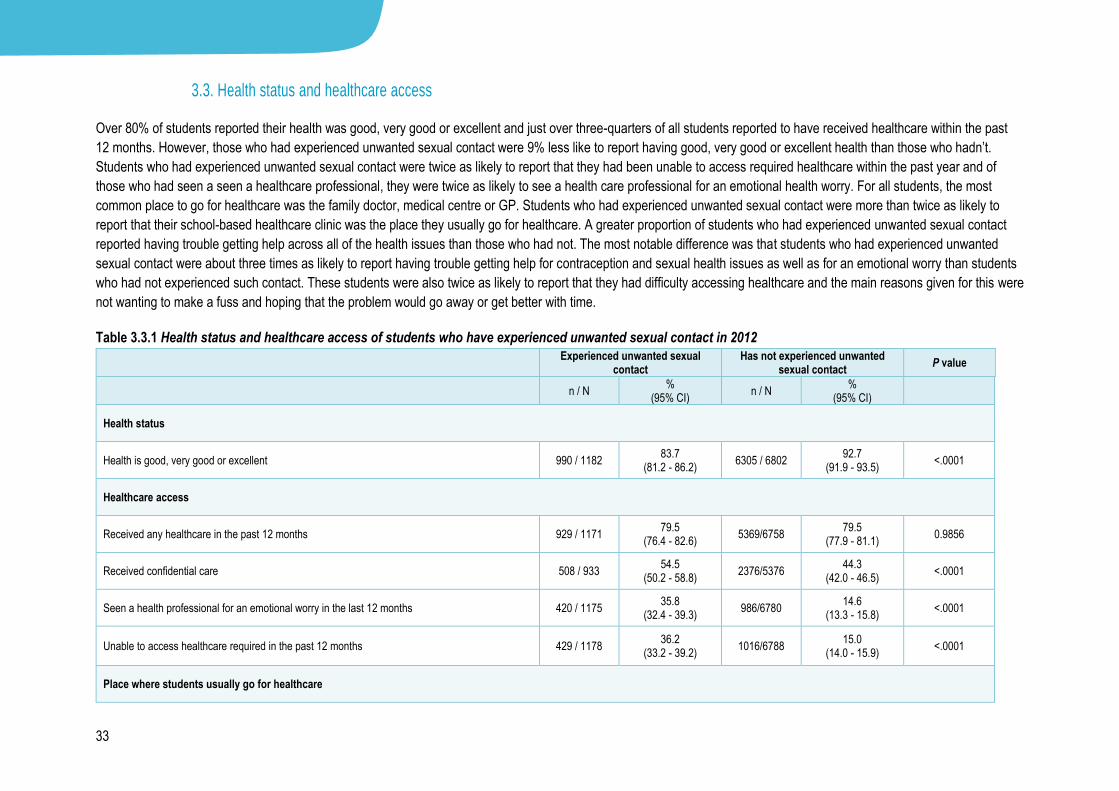
33
3.3. Health status and healthcare access
Over 80% of students reported their health was good, very good or excellent and just over three-quarters of all students reported to have received healthcare within the past
12 months. However, those who had experienced unwanted sexual contact were 9% less like to report having good, very good or excellent health than those who hadn’t.
Students who had experienced unwanted sexual contact were twice as likely to report that they had been unable to access required healthcare within the past year and of
those who had seen a seen a healthcare professional, they were twice as likely to see a health care professional for an emotional health worry. For all students, the most
common place to go for healthcare was the family doctor, medical centre or GP. Students who had experienced unwanted sexual contact were more than twice as likely to
report that their school-based healthcare clinic was the place they usually go for healthcare. A greater proportion of students who had experienced unwanted sexual contact
reported having trouble getting help across all of the health issues than those who had not. The most notable difference was that students who had experienced unwanted
sexual contact were about three times as likely to report having trouble getting help for contraception and sexual health issues as well as for an emotional worry than students
who had not experienced such contact. These students were also twice as likely to report that they had difficulty accessing healthcare and the main reasons given for this were
not wanting to make a fuss and hoping that the problem would go away or get better with time.
Table 3.3.1 Health status and healthcare access of students who have experienced unwanted sexual contact in 2012
Experienced unwanted sexual
contact
Has not experienced unwanted sexual contact
P value
n / N %
(95% CI) n / N
% (95% CI)
Health status
Health is good, very good or excellent 990 / 1182 83.7
(81.2 - 86.2) 6305 / 6802
92.7 (91.9 - 93.5)
<.0001
Healthcare access
Received any healthcare in the past 12 months 929 / 1171 79.5
(76.4 - 82.6) 5369/6758
79.5 (77.9 - 81.1)
0.9856
Received confidential care 508 / 933 54.5
(50.2 - 58.8) 2376/5376
44.3 (42.0 - 46.5)
<.0001
Seen a health professional for an emotional worry in the last 12 months 420 / 1175 35.8
(32.4 - 39.3) 986/6780
14.6 (13.3 - 15.8)
<.0001
Unable to access healthcare required in the past 12 months 429 / 1178 36.2
(33.2 - 39.2) 1016/6788
15.0 (14.0 - 15.9)
<.0001
Place where students usually go for healthcare

34
Family doctor, medical centre or GP 963 / 1177 81.9
(79.5 - 84.2) 5882 / 6786
86.7 (85.6 - 87.9)
0.0067
School health clinic 62 / 1177 5.3
(3.4 - 7.3) 153 / 6786
2.3 (1.7 - 2.8)
After hours A&E or 24 hour-A&M 24 / 1177 2.0
(1.1 - 2.9) 133 / 6786
2.0 (1.4 - 2.5)
Hospital A&E 37 / 1177 3.1
(2.0 - 4.2) 263 / 6786
3.8 (3.1 - 4.5)
I don’t go anywhere for healthcare 50 / 1177 4.2
(3.0 - 5.4) 201 / 6786
2.9 (2.5 - 3.4)
Other 41 / 1177 4.2
(3.0 – 5.4) 154 / 6786
2.3 (2.0 – 2.6)
Type of health issue that student had difficulty getting help for
An injury 169 / 1128 15.0
(12.8 - 17.2) 691 / 6490
10.7 (9.3 - 12.1)
0.0005
Help with stopping smoking 59 / 1128 5.2
(3.9 - 6.5) 85 / 6490
1.3 (1.0 - 1.7)
<.0001
Help with drug or alcohol use 57 / 1128 5.1
(3.7 - 6.5) 73 / 6490
1.1 (0.8 - 1.4)
<.0001
A long-term health condition 47 / 1128 4.2
(2.9 - 5.5) 111 / 6490
1.7 (1.3 - 2.1)
0.0017
A condition that does not last long (e.g. a cold) 122 / 1128 10.9
(9.2 - 12.6) 422 / 6490
6.5 (5.8 - 7.2)
<.0001
Contraception/sexual health 121 / 1128 10.7
(8.8 - 12.6) 160 / 6490
2.5 (2.0 - 2.9)
<.0001
An emotional worry 261 / 1128 23.2
(20.3 - 26.1) 555 / 6490
8.5 (7.6 - 9.5)
<.0001
Pregnancy or pregnancy test 94 / 1128 8.3
(6.7 - 9.9) 83 / 6490
1.3 (0.9 - 1.6)
<.0001
Something else 122/1128 10.8
(8.8 - 12.8) 338/6490
5.2 (4.5 - 5.9)
<.0001
Reasons for being unable to access healthcare services

35
Have had difficulty accessing healthcare 570/1128 50.5
(47.1 - 53.9) 1825/6490
28.2 (26.3 – 30.0)
<.0001
I didn’t know how to 125/419 29.8
(25.0 - 34.6) 184/977
19.0 (16.2 - 21.8)
0.0005
No transport 146/419 34.9
(30.5 - 39.2) 241/977
24.6 (21.6 - 27.5)
0.0009
Couldn’t get an appointment 82/419 19.6
(16.0 - 23.2) 163/977
16.8 (14.0 - 19.7)
0.2318
I couldn’t get in touch with a health professional or person I usually see 61/419 14.6
(11.0 - 18.3) 112/977
11.5 (9.4 - 13.6)
0.1654
I didn’t want to make a fuss 215/419 51.4
(46.7 – 56.0) 447/977
45.6 (42.1 - 49)
0.0472
I couldn’t be bothered 125/419 30.1
(25.7 - 34.5) 254/977
26.0 (23.3 - 28.7)
0.1378
I didn’t feel comfortable with the person 97/419 23.3
(19.0 - 27.6) 121/977
12.4 (10.1 - 14.8)
0.0001
The staff were unfriendly 28/419 6.6
(4.0 - 9.3) 15/977
1.6 (0.7 - 2.5)
0.0025
I was too scared 148/419 35.3
(29.6 - 41.1) 210/977
21.5 (18.7 - 24.3)
0.0004
I was too embarrassed 164/419 39.2
(33.7 - 44.6) 245/977
25.2 (22.3 - 28.1)
<.0001
I was hoping the problem would go away or get better with time 226/419 53.9
(49.8 - 57.9) 494/977
50.5 (46.7 - 54.2)
0.144
I was worried it wouldn’t be kept private 107/419 25.5
(20.7 - 30.3) 125/977
12.9 (10.8 - 14.9)
0.0001
I had no one to go with 104/419 24.6
(20.2 – 29.0) 130/977
13.4 (10.9 - 15.9)
0.0006
1 For the question Place where students usually go for healthcare, students could only choose one response option so the p-value has been done to measure for significant difference between all of the options.

36
The health status and ability to access healthcare was largely similar between those who had forced an unwanted sexual experience on someone else and those who had not.
However, students who had forced unwanted sexual contact were more likely to report having difficulty getting access to help for an emotional worry and drug and alcohol use.
They were 1.5 times more likely to report they were unable to access the healthcare they needed in the last 12 months and more than eight times as likely to report they
currently do not go anywhere for healthcare. The major reasons for not accessing healthcare were not feeling comfortable with the person treating them or that the staff were
unfriendly.
Table 3.3.2. Health status and healthcare access of students who have forced unwanted sexual experience on others in 2012
Forced unwanted sexual
experience
Has not forced unwanted sexual
experience P value
n / N
%
(95% CI) n / N
%
(95% CI)
Health status
Health is good, very good or excellent 215 / 243 88.5
(84.4 - 92.6) 7467 / 8182
91.3 (90.4 - 92.2)
0.1721
Healthcare access
Received any healthcare in the past 12 months 174 / 239 72.8
(66.4 - 79.2) 6432 / 8118
79.3 (77.7 - 80.9)
0.0326
Received confidential care 88 / 175 50.5
(42.1 - 58.9) 2948 / 6441
45.8 (43.5 - 48.2)
0.2494
Seen a health professional for an emotional worry in the last 12 months 64 / 241 26.6
(20.1 - 33.2) 1474 / 8145
18.1 (16.8 - 19.5)
0.014
Unable to access healthcare when required in the past 12 months 70 / 241 29.3
(23.6 - 34.9) 1489 / 8154
18.2 (17.1 - 19.3)
0.0015
Place where students usually go for healthcare
Family doctor, medical centre or GP 175 / 240 72.9
(66.8 - 79.1) 7014 / 8159
86.0 (84.9 - 87.1)
0.0071
School health clinic 6 / 240 2.6
(0.7 - 4.5) 233 / 8159
2.9 (2.2 - 3.6)
After hours A&E or 24 hour-A&M 10 / 240 4.2
(1.5 - 6.8) 157 / 8159
1.9 (1.4 - 2.4)
Hospital A&E 12 / 240 4.9
(2.3 - 7.6) 306 / 8159
3.7 (3.0 - 4.4)
I don’t go anywhere for healthcare 22 / 240 9.1
(6.0 - 12.1) 92 / 8159
1.1 (0.9 - 1.3)
Other 15 / 240 6.3
(3.1 – 9.6) 195 / 8159
2.4 (2.1 – 2.7)
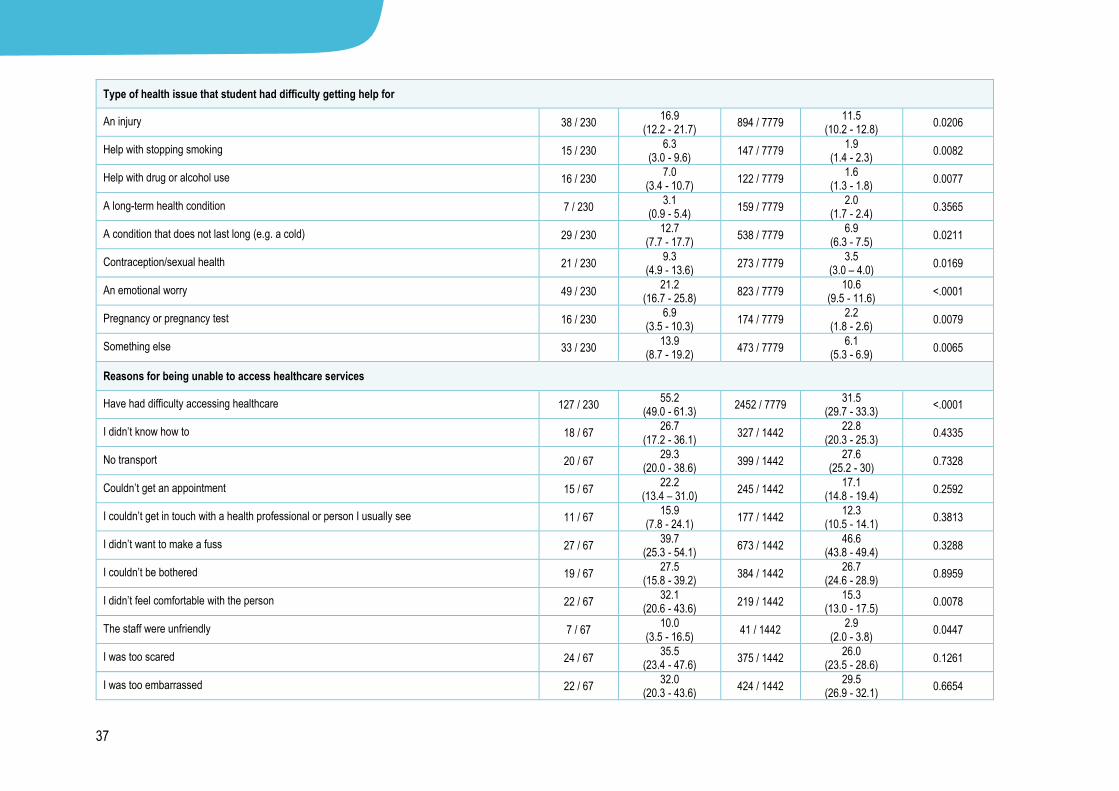
37
Type of health issue that student had difficulty getting help for
An injury 38 / 230 16.9
(12.2 - 21.7) 894 / 7779
11.5 (10.2 - 12.8)
0.0206
Help with stopping smoking 15 / 230 6.3
(3.0 - 9.6) 147 / 7779
1.9 (1.4 - 2.3)
0.0082
Help with drug or alcohol use 16 / 230 7.0
(3.4 - 10.7) 122 / 7779
1.6 (1.3 - 1.8)
0.0077
A long-term health condition 7 / 230 3.1
(0.9 - 5.4) 159 / 7779
2.0 (1.7 - 2.4)
0.3565
A condition that does not last long (e.g. a cold) 29 / 230 12.7
(7.7 - 17.7) 538 / 7779
6.9 (6.3 - 7.5)
0.0211
Contraception/sexual health 21 / 230 9.3
(4.9 - 13.6) 273 / 7779
3.5 (3.0 – 4.0)
0.0169
An emotional worry 49 / 230 21.2
(16.7 - 25.8) 823 / 7779
10.6 (9.5 - 11.6)
<.0001
Pregnancy or pregnancy test 16 / 230 6.9
(3.5 - 10.3) 174 / 7779
2.2 (1.8 - 2.6)
0.0079
Something else 33 / 230 13.9
(8.7 - 19.2) 473 / 7779
6.1 (5.3 - 6.9)
0.0065
Reasons for being unable to access healthcare services
Have had difficulty accessing healthcare 127 / 230 55.2
(49.0 - 61.3) 2452 / 7779
31.5 (29.7 - 33.3)
<.0001
I didn’t know how to 18 / 67 26.7
(17.2 - 36.1) 327 / 1442
22.8 (20.3 - 25.3)
0.4335
No transport 20 / 67 29.3
(20.0 - 38.6) 399 / 1442
27.6 (25.2 - 30)
0.7328
Couldn’t get an appointment 15 / 67 22.2
(13.4 – 31.0) 245 / 1442
17.1 (14.8 - 19.4)
0.2592
I couldn’t get in touch with a health professional or person I usually see 11 / 67 15.9
(7.8 - 24.1) 177 / 1442
12.3 (10.5 - 14.1)
0.3813
I didn’t want to make a fuss 27 / 67 39.7
(25.3 - 54.1) 673 / 1442
46.6 (43.8 - 49.4)
0.3288
I couldn’t be bothered 19 / 67 27.5
(15.8 - 39.2) 384 / 1442
26.7 (24.6 - 28.9)
0.8959
I didn’t feel comfortable with the person 22 / 67 32.1
(20.6 - 43.6) 219 / 1442
15.3 (13.0 - 17.5)
0.0078
The staff were unfriendly 7 / 67 10.0
(3.5 - 16.5) 41 / 1442
2.9 (2.0 - 3.8)
0.0447
I was too scared 24 / 67 35.5
(23.4 - 47.6) 375 / 1442
26.0 (23.5 - 28.6)
0.1261
I was too embarrassed 22 / 67 32.0
(20.3 - 43.6) 424 / 1442
29.5 (26.9 - 32.1)
0.6654
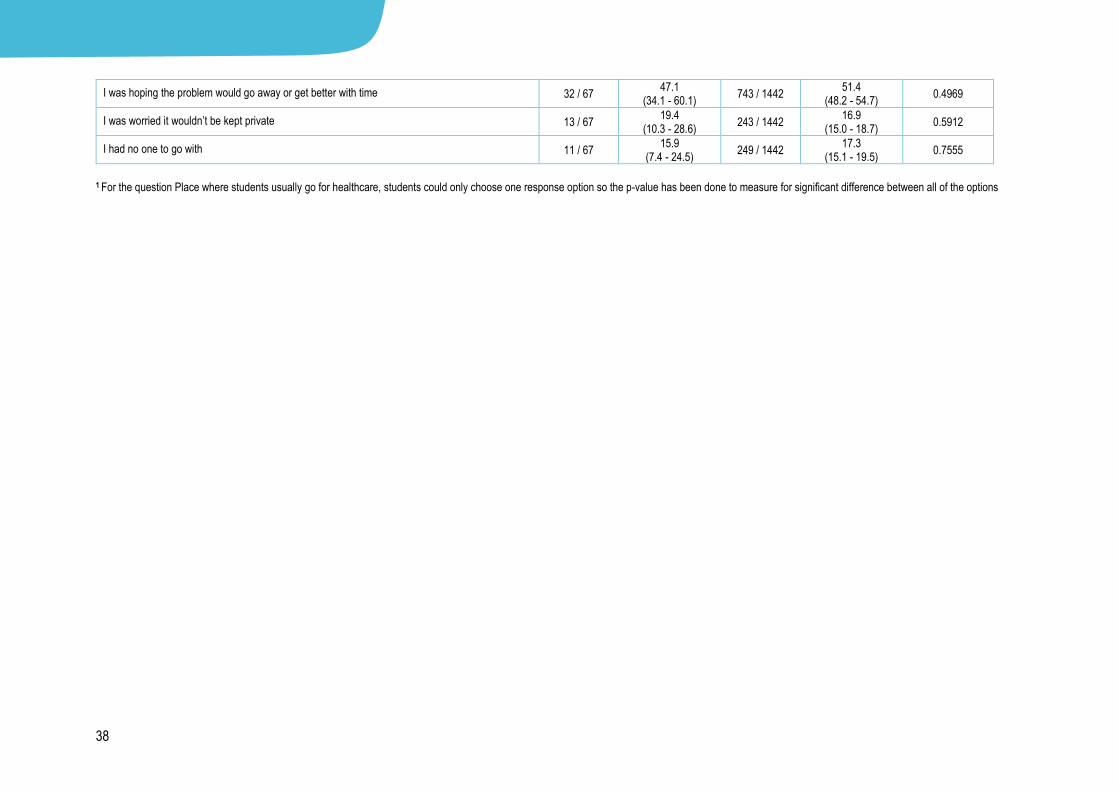
38
I was hoping the problem would go away or get better with time 32 / 67 47.1
(34.1 - 60.1) 743 / 1442
51.4 (48.2 - 54.7)
0.4969
I was worried it wouldn’t be kept private 13 / 67 19.4
(10.3 - 28.6) 243 / 1442
16.9 (15.0 - 18.7)
0.5912
I had no one to go with 11 / 67 15.9
(7.4 - 24.5) 249 / 1442
17.3 (15.1 - 19.5)
0.7555
1 For the question Place where students usually go for healthcare, students could only choose one response option so the p-value has been done to measure for significant difference between all of the options

39
3.4. Emotional and mental wellbeing
Students who had experienced unwanted sexual contact have comparatively poorer emotional and mental health outcomes. Compared to students who had not experienced
unwanted sexual contact, students who had experienced unwanted sexual contact were 20% less likely to report having good emotional wellbeing and close to three times as
likely to reporting having had serious depressive symptoms as well as serious suicidal thoughts at least once within the past year.
Table 3.4.1. Emotional and mental wellbeing of students who have experienced unwanted sexual contact in 2012
Experienced unwanted sexual contact
Has not experienced unwanted sexual contact
P value
n / N
%
(95% CI) n / N
%
(95% CI)
Emotional health
Good emotional wellbeing (WHO-5) 695 / 1168 59.5
(55.6 - 63.3) 5333 / 6708
79.5 (78.1 - 80.8)
<.0001
Aspirations and achievement
Clinically significant depressive symptoms (RADS) 326 / 1133 28.7
(25.0 - 32.4) 638 / 6668
9.6 (8.7 - 10.5)
<.0001
Serious thoughts of suicide with the past 12 months 414 / 1163 35.6
(32.1 – 39.0) 812 / 6764
12.0 (11.0 – 13.0)
<.0001

40
Students who had forced unwanted sexual experience on others were close to 15% less likely to report having good emotional wellbeing and around two times as likely to
reporting having had clinically depressive symptoms as well as serious suicidal thoughts than those who had not.
Table 3.4.2. Emotional and mental wellbeing of students who have forced unwanted sexual experience on others in 2012
Forced unwanted sexual experience
Has not forced unwanted sexual experience
P value
n / N
% (95% CI)
n / N %
(95% CI)
Emotional health
Good emotional wellbeing (WHO-5) 149 / 236 62.7
(57.3 – 68.0) 6156 / 8039
76.6 (75.2 – 78.0)
0.0001
Aspirations and achievement
Clinically significant depressive symptoms (RADS) 56 / 212 26.6
(20.4 - 32.8) 986 / 7959
12.4 (11.3 - 13.5)
0.0002
Serious thoughts of suicide in the last 12 months 62 / 234 26.3
(20.1 - 32.5) 1247 / 8078
15.4 (14.2 - 16.7)
0.0011

41
3.5. Sexual health outcomes
Students who had experienced unwanted sexual contact were about five times more likely to have had a sexually transmitted infection (STI) and close to three times more
likely to have been pregnant or have gotten someone pregnant than students who had not experienced unwanted sexual contact. There was no difference between students
who had experienced unwanted sexual contact and those who had not with regards to talking with their partner about preventing STIs and pregnancy.
Table 3.5.1. Sexual health outcomes of students who experienced unwanted sexual contact in 2012
Experienced unwanted sexual contact
Has not experienced unwanted sexual contact
P value
n / N
% (95% CI)
n / N %
(95% CI)
Ever had a sexually transmitted infection
Yes 52 / 460 11.2
(8.1 - 14.3) 31 / 1436
2.2 (1.5 - 2.9)
<.0001 No 368 / 460 80.0
(76.1 – 84.0) 1344 / 1436
93.6 (92.4 - 94.8)
Not sure 40 / 460 8.7
(5.5 - 11.9) 61 / 1436
4.2 (3.3 - 5.2)
Ever been pregnant or got someone pregnant
Yes 79 / 443 17.8
(13.9 - 21.7) 84 / 1372
6.2 (4.7 - 7.6)
<.0001 No 334 / 443 75.5
(70.9 - 80.1) 1226 / 1372
89.3 (87.3 - 91.3)
Not sure 30 / 443 6.7
(4.3 - 9.1) 62 / 1372
4.5 (3.4 - 5.7)
Ever talked about preventing pregnancy with partner
Never 124 / 465 26.5
(22.6 - 30.4) 378 / 1434
26.2 (23.9 - 28.6)
0.6704 Depends on the situation 180 / 465 38.5
(34.3 - 42.8) 523 / 1434
36.6 (34.2 - 39.1)
Always 161 / 465 35.0
(30.5 - 39.4) 533 / 1434
37.1 (34.3 - 40.0)
Ever talked about preventing STIs with a partner
Yes 263 / 465 56.5
(51.8 - 61.2) 833 / 1430
58.3 (55.2 - 61.4)
0.4506
No 202 / 465 43.5
(38.8 - 48.2) 597 / 1430
41.7 (38.6 - 44.8)
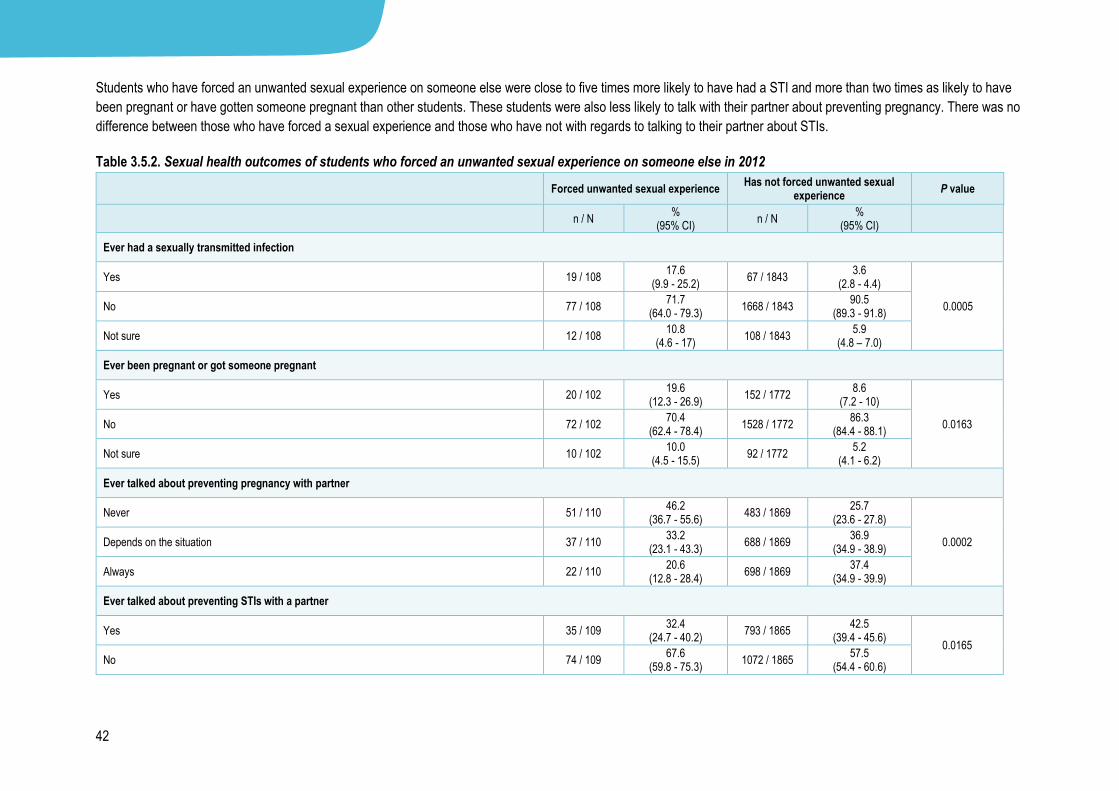
42
Students who have forced an unwanted sexual experience on someone else were close to five times more likely to have had a STI and more than two times as likely to have
been pregnant or have gotten someone pregnant than other students. These students were also less likely to talk with their partner about preventing pregnancy. There was no
difference between those who have forced a sexual experience and those who have not with regards to talking to their partner about STIs.
Table 3.5.2. Sexual health outcomes of students who forced an unwanted sexual experience on someone else in 2012
Forced unwanted sexual experience Has not forced unwanted sexual experience
P value
n / N
% (95% CI)
n / N %
(95% CI)
Ever had a sexually transmitted infection
Yes 19 / 108 17.6
(9.9 - 25.2) 67 / 1843
3.6 (2.8 - 4.4)
0.0005 No 77 / 108 71.7
(64.0 - 79.3) 1668 / 1843
90.5 (89.3 - 91.8)
Not sure 12 / 108 10.8
(4.6 - 17) 108 / 1843
5.9 (4.8 – 7.0)
Ever been pregnant or got someone pregnant
Yes 20 / 102 19.6
(12.3 - 26.9) 152 / 1772
8.6 (7.2 - 10)
0.0163 No 72 / 102 70.4
(62.4 - 78.4) 1528 / 1772
86.3 (84.4 - 88.1)
Not sure 10 / 102 10.0
(4.5 - 15.5) 92 / 1772
5.2 (4.1 - 6.2)
Ever talked about preventing pregnancy with partner
Never 51 / 110 46.2
(36.7 - 55.6) 483 / 1869
25.7 (23.6 - 27.8)
0.0002 Depends on the situation 37 / 110 33.2
(23.1 - 43.3) 688 / 1869
36.9 (34.9 - 38.9)
Always 22 / 110 20.6
(12.8 - 28.4) 698 / 1869
37.4 (34.9 - 39.9)
Ever talked about preventing STIs with a partner
Yes 35 / 109 32.4
(24.7 - 40.2) 793 / 1865
42.5 (39.4 - 45.6)
0.0165
No 74 / 109 67.6
(59.8 - 75.3) 1072 / 1865
57.5 (54.4 - 60.6)

43
3.6. Substance use
Students who experienced unwanted sexual contact were significantly more likely than other students to report weekly use of cigarettes, alcohol and marijuana as well as
binge drinking within the last month. While these results are statistically significant, it is important to note that the differences between the two groups of students is small, at
less than 6%, except for the 11% difference in reported binge drinking in the last four weeks between students who had experienced unwanted sexual contact reporting binge
drinking within the last month than students who have not experienced unwanted sexual contact.
Table 3.6.1. Substance use of students who experienced unwanted sexual contact in 2012
Experienced unwanted sexual contact
Has not experienced unwanted sexual contact
P value
n / N
% (95% CI)
n / N %
(95% CI)
Substance use
Smoke cigarettes weekly or more often 114 / 1167 9.6
(7.8 - 11.5) 240 / 6763
3.5 (2.9 - 4.1)
<.0001
Use alcohol weekly or more often 143 / 1161 12.3
(10.0 - 14.6) 517 / 6753
7.7 (6.6 - 8.8)
0.0002
Binge drinking in the last four weeks 377 / 1160 32.4
(29.1 - 35.7) 1418 / 6744
21.0 (18.8 - 23.2)
<.0001
Weekly marijuana use 62 / 1149 5.2
(3.7 - 6.7) 183 / 6713
2.7 (2.2 - 3.3)
0.0014
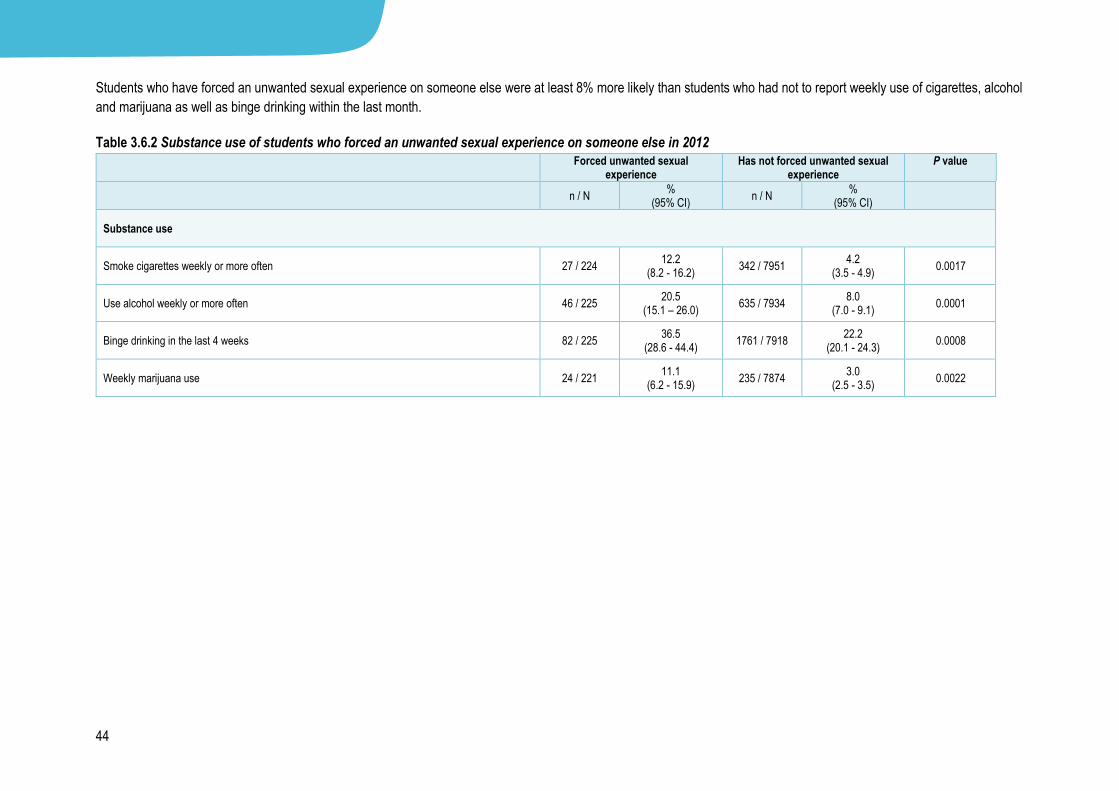
44
Students who have forced an unwanted sexual experience on someone else were at least 8% more likely than students who had not to report weekly use of cigarettes, alcohol
and marijuana as well as binge drinking within the last month.
Table 3.6.2 Substance use of students who forced an unwanted sexual experience on someone else in 2012
Forced unwanted sexual experience
Has not forced unwanted sexual experience
P value
n / N
% (95% CI)
n / N %
(95% CI)
Substance use
Smoke cigarettes weekly or more often 27 / 224 12.2
(8.2 - 16.2) 342 / 7951
4.2 (3.5 - 4.9)
0.0017
Use alcohol weekly or more often 46 / 225 20.5
(15.1 – 26.0) 635 / 7934
8.0 (7.0 - 9.1)
0.0001
Binge drinking in the last 4 weeks 82 / 225 36.5
(28.6 - 44.4) 1761 / 7918
22.2 (20.1 - 24.3)
0.0008
Weekly marijuana use 24 / 221 11.1
(6.2 - 15.9) 235 / 7874
3.0 (2.5 - 3.5)
0.0022

45
3.7. Violence and neighbourhoods
Students who experienced unwanted sexual contact were about twice as likely to report witnessing violence within their home, being hit or harmed on purpose and engaging in
a physical fight within the last year. Over 95% of all students reported having a friend who looks out for them and close to 60% reported having an adult outside their family
they would feel ok talking to about a serious problem. Students who had experienced unwanted sexual contact were close to 8% more likely to report that their spiritual beliefs
are important to them and 10% more likely to have attend a place of worship at least once a week.
Table 3.7.1 Violence and neighbourhoods of students who experienced unwanted sexual contact in 2012
Experienced unwanted sexual contact
Has not experienced unwanted sexual contact
P value
n / N
% (95% CI)
n / N %
(95% CI)
Family violence
Witnessing adults hitting or physically hurting a child in the home 290 / 1134 25.6
(22.0 - 29.1) 751 / 6613
11.4 (10.1 - 12.6)
<.0001
Witnessing adults hitting or physically hurting another adult in the home 185 / 1139 16.2
(13.4 – 19.0) 369 / 6626
5.6 (4.8 - 6.3)
<.0001
Violence
Been hit or harmed on purpose one or more times in the last 12 months 504 / 1176 42.9
(39.8 - 46) 1775 / 6786
26.1 (24.0 - 28.3)
<.0001
Been in a serious physical fight in the last 12 months 272 / 1171 23.1
(19.9 - 26.2) 815 / 6778
12.0 (10.6 - 13.5)
<.0001
Has forced an unwanted sexual experience 96 / 1181 8.2
(6.3 - 10.1) 108 / 6798
1.6 (1.3 - 1.9)
<.0001
Caring people outside of the family
Have a friend who helps and looks out for them some or all of the time 1092 / 1143 95.6
(94.3 - 96.9) 6466 / 6668
97.0 (96.5 - 97.4)
0.0642
Have an adult outside their family who they would feel okay talking to about a serious problem 677 / 1151 58.9
(56.0 - 61.8) 3948 / 6670
59.2 (57.5 - 60.9)
0.8247
Neighbourhood
Feel safe in their neighbourhood 495 / 1110 44.5
(41.4 - 47.7) 3697 / 6567
56.3 (54.4 - 58.1)
<.0001
Things to do within walking distance from students home 972 / 1183 82.2
(79.7 - 84.7) 5820 / 6805
85.6 (83.4 - 87.7)
0.0035
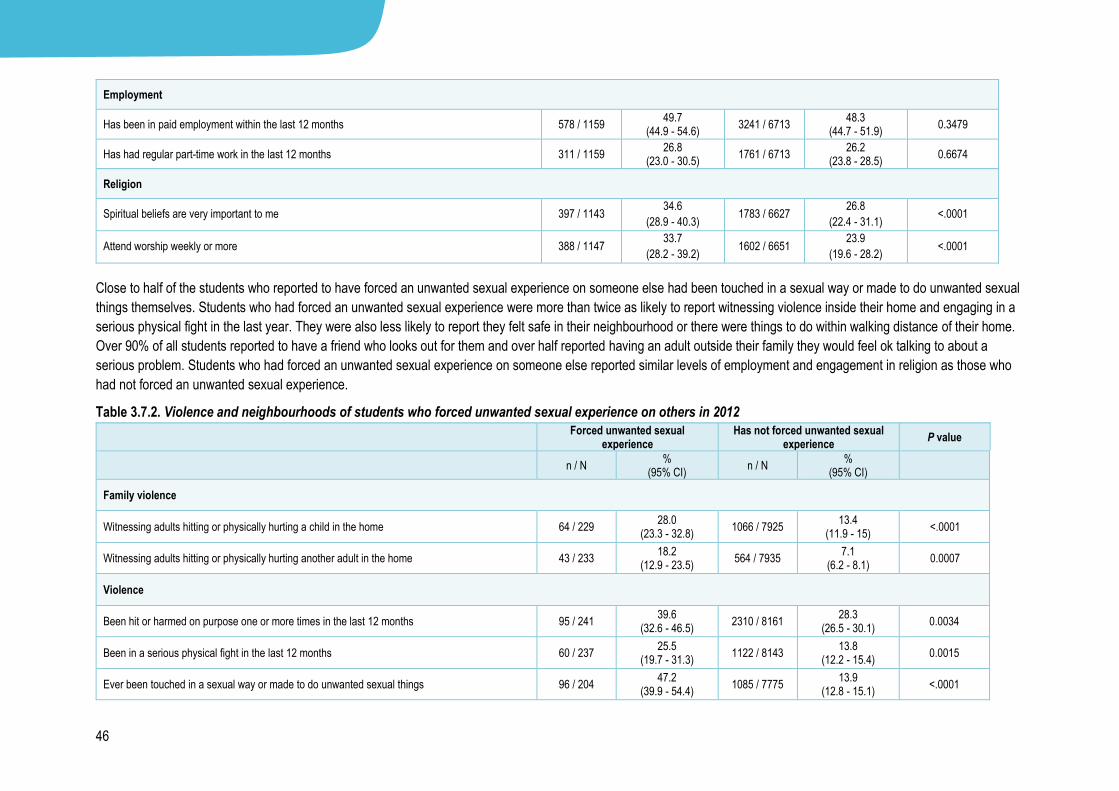
46
Employment
Has been in paid employment within the last 12 months 578 / 1159 49.7
(44.9 - 54.6) 3241 / 6713
48.3 (44.7 - 51.9)
0.3479
Has had regular part-time work in the last 12 months 311 / 1159 26.8
(23.0 - 30.5) 1761 / 6713
26.2 (23.8 - 28.5)
0.6674
Religion
Spiritual beliefs are very important to me 397 / 1143 34.6
(28.9 - 40.3) 1783 / 6627
26.8
(22.4 - 31.1) <.0001
Attend worship weekly or more 388 / 1147 33.7
(28.2 - 39.2) 1602 / 6651
23.9
(19.6 - 28.2) <.0001
Close to half of the students who reported to have forced an unwanted sexual experience on someone else had been touched in a sexual way or made to do unwanted sexual
things themselves. Students who had forced an unwanted sexual experience were more than twice as likely to report witnessing violence inside their home and engaging in a
serious physical fight in the last year. They were also less likely to report they felt safe in their neighbourhood or there were things to do within walking distance of their home.
Over 90% of all students reported to have a friend who looks out for them and over half reported having an adult outside their family they would feel ok talking to about a
serious problem. Students who had forced an unwanted sexual experience on someone else reported similar levels of employment and engagement in religion as those who
had not forced an unwanted sexual experience.
Table 3.7.2. Violence and neighbourhoods of students who forced unwanted sexual experience on others in 2012
Forced unwanted sexual experience
Has not forced unwanted sexual experience
P value
n / N
% (95% CI)
n / N %
(95% CI)
Family violence
Witnessing adults hitting or physically hurting a child in the home 64 / 229 28.0
(23.3 - 32.8) 1066 / 7925
13.4 (11.9 - 15)
<.0001
Witnessing adults hitting or physically hurting another adult in the home 43 / 233 18.2
(12.9 - 23.5) 564 / 7935
7.1 (6.2 - 8.1)
0.0007
Violence
Been hit or harmed on purpose one or more times in the last 12 months 95 / 241 39.6
(32.6 - 46.5) 2310 / 8161
28.3 (26.5 - 30.1)
0.0034
Been in a serious physical fight in the last 12 months 60 / 237 25.5
(19.7 - 31.3) 1122 / 8143
13.8 (12.2 - 15.4)
0.0015
Ever been touched in a sexual way or made to do unwanted sexual things 96 / 204 47.2
(39.9 - 54.4) 1085 / 7775
13.9 (12.8 - 15.1)
<.0001

47
Caring people outside of the family
Have a friend who helps and looks out for them some or all of the time 199 / 216 92.2
(88.6 - 95.7) 7585 / 7832
96.8 (96.5 - 97.2)
0.0145
Have an adult outside their family who they would feel okay talking to about a serious problem 111 / 217 51.2
(44.7 - 57.7) 4630 / 7839
59.1 (57.5 - 60.7)
0.0168
Neighbourhood
Feel safe in their neighbourhood 86 / 211 40.5
(33.8 - 47.2) 4198 / 7688
54.6 (52.8 - 56.4)
0.0005
Things to do within walking distance from student’s home 180 / 245 73.9
(69.5 - 78.3) 6805 / 8188
83.1 (81.1 - 85.2)
0.0006
Employment
Has been in paid employment within the last 12 months 121 / 226 53.6
(46.9 - 60.3) 3815 / 7918
48.2 (44.5 - 51.8)
0.076
Has had regular part-time work in the last 12 months 65 / 226 28.6
(22.9 - 34.3) 2074 / 7918
26.1 (23.7 - 28.5)
0.3264
Religion
Spiritual beliefs are very important to me 57 / 215 26.3
(20.0 - 32.6) 2198 / 7783
28.1 (23.5 - 32.7)
0.5336
Attend worship weekly or more 62 / 217 28.3
(21.4 - 35.1) 2022 / 7820
25.7 (21.2 - 30.2)
0.3884
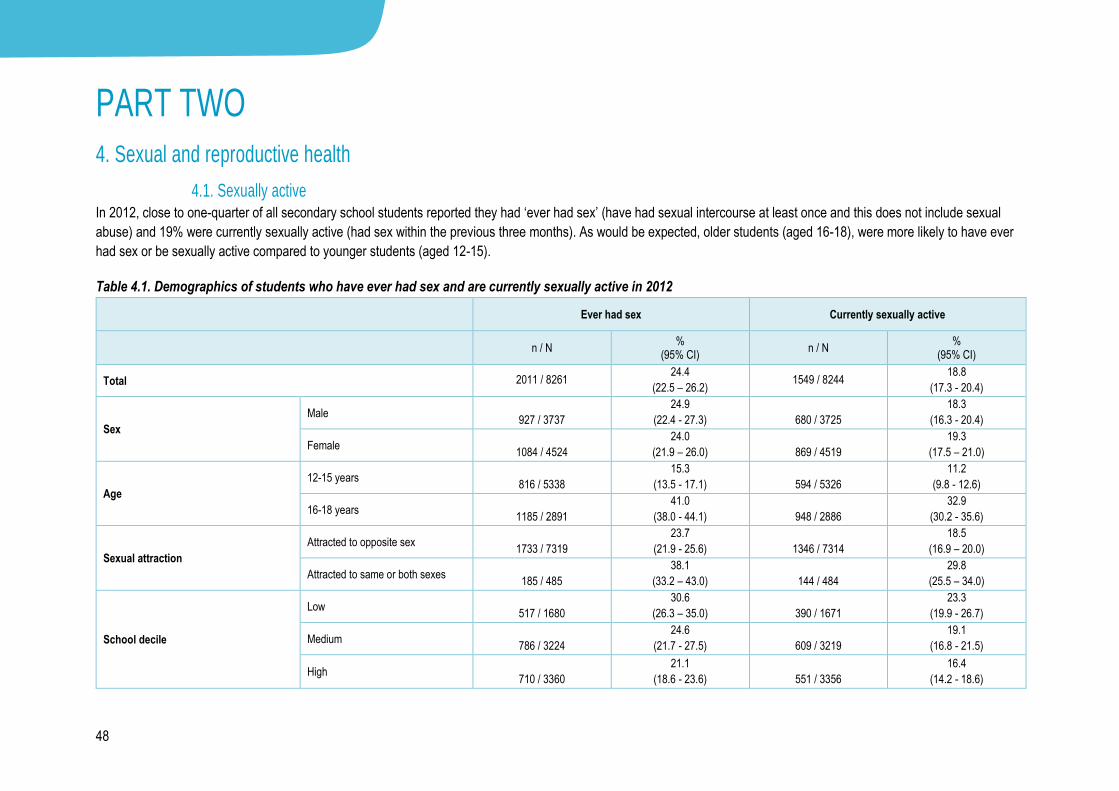
48
PART TWO 4. Sexual and reproductive health
4.1. Sexually active In 2012, close to one-quarter of all secondary school students reported they had ‘ever had sex’ (have had sexual intercourse at least once and this does not include sexual
abuse) and 19% were currently sexually active (had sex within the previous three months). As would be expected, older students (aged 16-18), were more likely to have ever
had sex or be sexually active compared to younger students (aged 12-15).
Table 4.1. Demographics of students who have ever had sex and are currently sexually active in 2012
Ever had sex Currently sexually active
n / N %
(95% CI) n / N
% (95% CI)
Total 2011 / 8261 24.4
(22.5 – 26.2) 1549 / 8244
18.8
(17.3 - 20.4)
Sex
Male 927 / 3737
24.9
(22.4 - 27.3) 680 / 3725
18.3
(16.3 - 20.4)
Female 1084 / 4524
24.0
(21.9 – 26.0) 869 / 4519
19.3
(17.5 – 21.0)
Age
12-15 years 816 / 5338
15.3
(13.5 - 17.1) 594 / 5326
11.2
(9.8 - 12.6)
16-18 years 1185 / 2891
41.0
(38.0 - 44.1) 948 / 2886
32.9
(30.2 - 35.6)
Sexual attraction
Attracted to opposite sex 1733 / 7319
23.7
(21.9 - 25.6) 1346 / 7314
18.5
(16.9 – 20.0)
Attracted to same or both sexes 185 / 485
38.1
(33.2 – 43.0) 144 / 484
29.8
(25.5 – 34.0)
School decile
Low 517 / 1680
30.6
(26.3 – 35.0) 390 / 1671
23.3
(19.9 - 26.7)
Medium 786 / 3224
24.6
(21.7 - 27.5) 609 / 3219
19.1
(16.8 - 21.5)
High 710 / 3360
21.1
(18.6 - 23.6) 551 / 3356
16.4
(14.2 - 18.6)
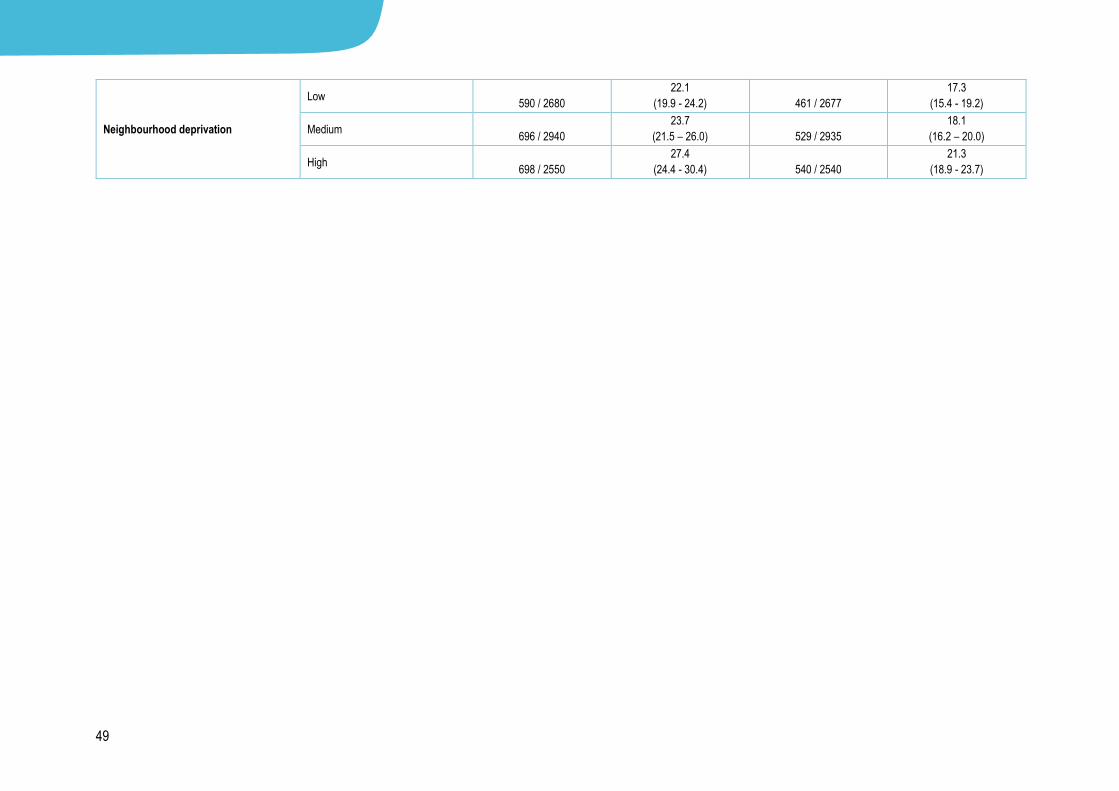
49
Neighbourhood deprivation
Low 590 / 2680
22.1
(19.9 - 24.2) 461 / 2677
17.3
(15.4 - 19.2)
Medium 696 / 2940
23.7
(21.5 – 26.0) 529 / 2935
18.1
(16.2 – 20.0)
High 698 / 2550
27.4
(24.4 - 30.4) 540 / 2540
21.3
(18.9 - 23.7)
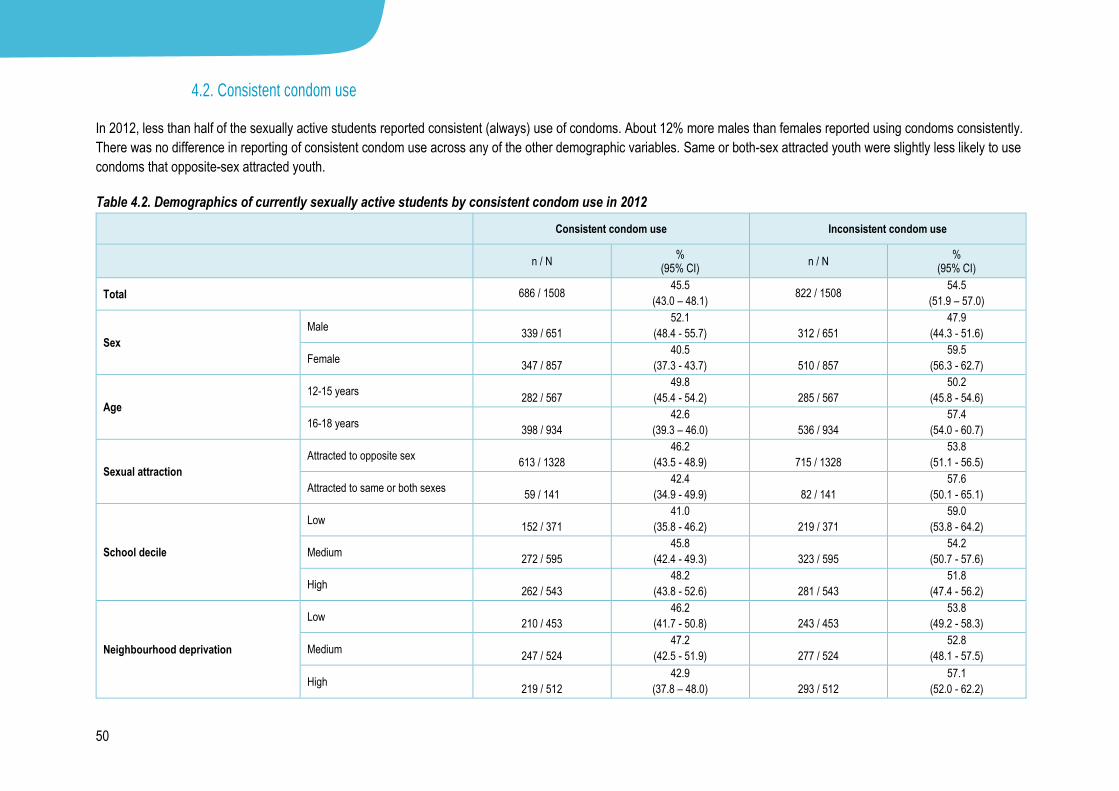
50
4.2. Consistent condom use
In 2012, less than half of the sexually active students reported consistent (always) use of condoms. About 12% more males than females reported using condoms consistently.
There was no difference in reporting of consistent condom use across any of the other demographic variables. Same or both-sex attracted youth were slightly less likely to use
condoms that opposite-sex attracted youth.
Table 4.2. Demographics of currently sexually active students by consistent condom use in 2012
Consistent condom use Inconsistent condom use
n / N %
(95% CI) n / N
% (95% CI)
Total 686 / 1508 45.5
(43.0 – 48.1) 822 / 1508
54.5
(51.9 – 57.0)
Sex
Male 339 / 651
52.1
(48.4 - 55.7) 312 / 651
47.9
(44.3 - 51.6)
Female 347 / 857
40.5
(37.3 - 43.7) 510 / 857
59.5
(56.3 - 62.7)
Age
12-15 years 282 / 567
49.8
(45.4 - 54.2) 285 / 567
50.2
(45.8 - 54.6)
16-18 years 398 / 934
42.6
(39.3 – 46.0) 536 / 934
57.4
(54.0 - 60.7)
Sexual attraction
Attracted to opposite sex 613 / 1328
46.2
(43.5 - 48.9) 715 / 1328
53.8
(51.1 - 56.5)
Attracted to same or both sexes 59 / 141
42.4
(34.9 - 49.9) 82 / 141
57.6
(50.1 - 65.1)
School decile
Low 152 / 371
41.0
(35.8 - 46.2) 219 / 371
59.0
(53.8 - 64.2)
Medium 272 / 595
45.8
(42.4 - 49.3) 323 / 595
54.2
(50.7 - 57.6)
High 262 / 543
48.2
(43.8 - 52.6) 281 / 543
51.8
(47.4 - 56.2)
Neighbourhood deprivation
Low 210 / 453
46.2
(41.7 - 50.8) 243 / 453
53.8
(49.2 - 58.3)
Medium 247 / 524
47.2
(42.5 - 51.9) 277 / 524
52.8
(48.1 - 57.5)
High 219 / 512
42.9
(37.8 – 48.0) 293 / 512
57.1
(52.0 - 62.2)
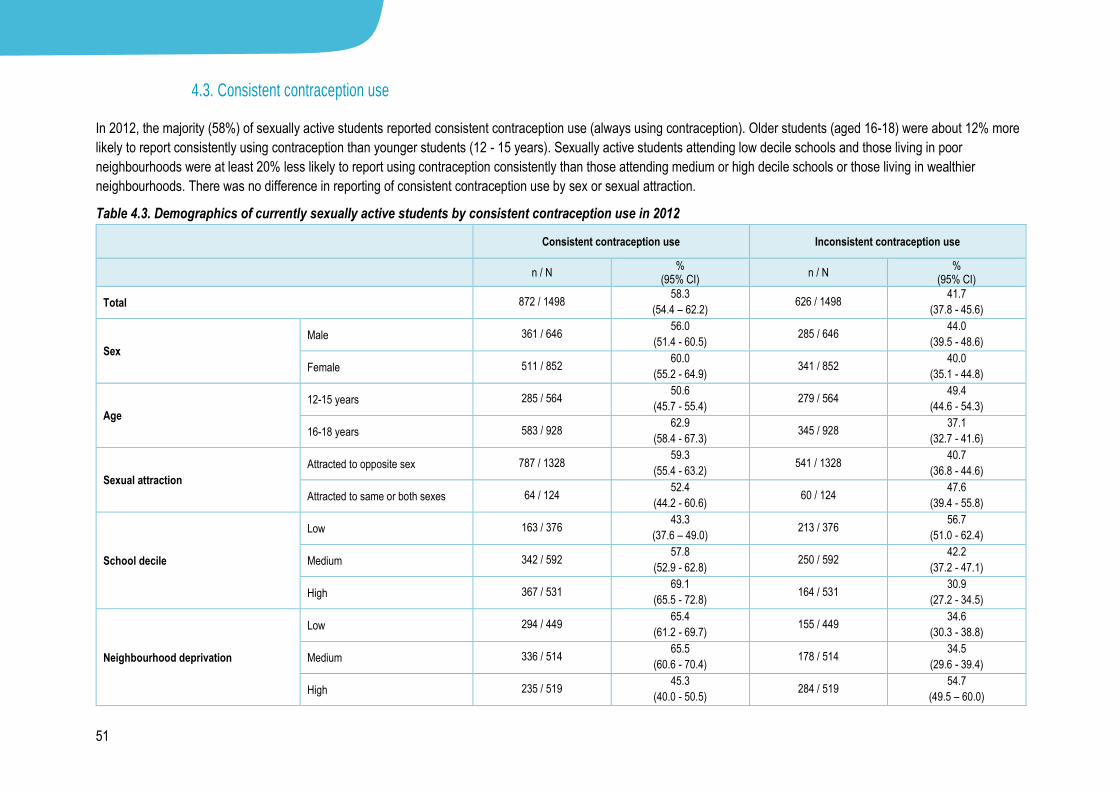
51
4.3. Consistent contraception use
In 2012, the majority (58%) of sexually active students reported consistent contraception use (always using contraception). Older students (aged 16-18) were about 12% more
likely to report consistently using contraception than younger students (12 - 15 years). Sexually active students attending low decile schools and those living in poor
neighbourhoods were at least 20% less likely to report using contraception consistently than those attending medium or high decile schools or those living in wealthier
neighbourhoods. There was no difference in reporting of consistent contraception use by sex or sexual attraction.
Table 4.3. Demographics of currently sexually active students by consistent contraception use in 2012
Consistent contraception use Inconsistent contraception use
n / N %
(95% CI) n / N
% (95% CI)
Total 872 / 1498 58.3
(54.4 – 62.2) 626 / 1498
41.7
(37.8 - 45.6)
Sex
Male 361 / 646 56.0
(51.4 - 60.5) 285 / 646
44.0
(39.5 - 48.6)
Female 511 / 852 60.0
(55.2 - 64.9) 341 / 852
40.0
(35.1 - 44.8)
Age
12-15 years 285 / 564 50.6
(45.7 - 55.4) 279 / 564
49.4
(44.6 - 54.3)
16-18 years 583 / 928 62.9
(58.4 - 67.3) 345 / 928
37.1
(32.7 - 41.6)
Sexual attraction
Attracted to opposite sex 787 / 1328 59.3
(55.4 - 63.2) 541 / 1328
40.7
(36.8 - 44.6)
Attracted to same or both sexes 64 / 124 52.4
(44.2 - 60.6) 60 / 124
47.6
(39.4 - 55.8)
School decile
Low 163 / 376 43.3
(37.6 – 49.0) 213 / 376
56.7
(51.0 - 62.4)
Medium 342 / 592 57.8
(52.9 - 62.8) 250 / 592
42.2
(37.2 - 47.1)
High 367 / 531 69.1
(65.5 - 72.8) 164 / 531
30.9
(27.2 - 34.5)
Neighbourhood deprivation
Low 294 / 449 65.4
(61.2 - 69.7) 155 / 449
34.6
(30.3 - 38.8)
Medium 336 / 514 65.5
(60.6 - 70.4) 178 / 514
34.5
(29.6 - 39.4)
High 235 / 519 45.3
(40.0 - 50.5) 284 / 519
54.7
(49.5 – 60.0)

52
4.4. Age of first sexual intercourse
The majority (93%)of New Zealand secondary school students reported never having sex. The most common age for students to report first having had sex was 15 or 16
years; between 8% and 16% of students who were 15 years or older when they answered the question, said that this was when they first had sex. Less than 5% of all
students reported to having sex for the first time when they were 13 or younger.
4.4.1. Age of first sexual intercourse in 2012
Age of student when they were responding to the question
13 or under 14 15 16 17 or older
n / N %
(95% CI) n / N
% (95% CI)
n / N %
(95% CI) n / N
% (95% CI)
n / N %
(95% CI)
Age at which students reported having sex for the first time
Never had sex 1656 / 1790 92.5
(90.9 - 94.2) 1593 / 1852
86.1
(84.1 - 88.1) 1292 / 1694
76.2
(73.1 - 79.3) 972 / 1529
63.6
(60.3 - 66.9) 746 / 1373
54.2
(50.6 - 57.9)
Under 11 18 / 1790 1.0
(0.6 - 1.4) 24 / 1852
1.3
(0.6 - 1.9) 15 / 1694
0.9
(0.4 - 1.4) 7 / 1529
0.5
(0.1 - 0.8) 7 / 1373
0.5
(0.2 - 0.9)
11 10 / 1790 0.5
(0.2 - 0.9) 5 / 1852
0.3
(0.0 - 0.5) 7 / 1694
0.4
(0.1 - 0.7) 5 / 1529
0.3
(0.0 - 0.7) 2 / 1373
0.1
(0.0 - 0.4)
12 29 / 1790 1.6
(0.8 - 2.4) 31 / 1852
1.6
(1.0 - 2.2) 21 / 1694
1.2
(0.6 - 1.9) 15 / 1529
1.0
(0.5 - 1.4) 9 / 1373
0.7
(0.2 - 1.1)
13 73 / 1790 4.1
(3.0 - 5.2) 75 / 1852
4.0
(3.0 – 5.0) 58 / 1694
3.4
(2.4 - 4.4) 46 / 1529
3.0
(2.1 - 3.8) 34 / 1373
2.4
(1.6 - 3.3)
14 120 / 1852 6.5
(5.4 - 7.6) 145 / 1694
8.7
(7.1 - 10.2) 103 / 1529
6.8
(5.4 - 8.1) 77 / 1373
5.6
(4.4 - 6.8)
15 151 / 1694 8.9
(7.4 - 10.4) 187 / 1529
12.3
(10.4 - 14.1) 149 / 1373
11.0
(9.0 - 12.9)
16 193 / 1529 12.6
(10.9 - 14.2) 209 / 1373
15.2
(13.0 - 17.4)
17 130 / 1373 9.6
(7.8 - 11.3)
18 or older 10 / 1373 0.7
(0.2 - 1.3) 1 This table refers to answers from the question About how old were you when you first had an experience of sex? (by this we mean sexual intercourse or going all the way). Do not include sexual abuse 2 The proportion of students who reported having their first sexual intercourse at ages 13 or under, 14 or 15 is likely to be slightly inflated in comparison to the proportion of students who reported having their first
sexual intercourse at the age of 16 or 17 or older. This is because both older and younger students are able to respond to the age categories of first having sex at a younger age, but younger students who at the
time of the survey had not had sex, but went on to have their first sexual intercourse at 16 or 17 or older have been excluded from this table. For this same reason the proportion of students who reported to have
their first sexual intercourse at the age of 16 or 17 or older is likely to underrepresent the general student population.

53
In 2012, three-quarters of all students reported to have never had sex. Students aged 12-15 years were more likely to report they had never had sex than students aged 16-18
years. There was no difference in reporting of age of first sex by gender or by geographic location, except for a small but notable difference indicating that rural students were
slightly (2%) more likely to report that they were 16 years old when they first had sex. Students who lived in poor neighbourhoods, attend low decile schools or were same or
both-sex attracted were more likely to report having first had sex at 14 or younger than students who live in wealthy areas, attend high decile schools or were opposite-sex
attracted.
4.4.2. Age of first sexual intercourse in 2012
Age at which students reported to have first had sex
Never had sex 13 or under 14 15 16 17 or older
n / N %
(95% CI) n / N
% (95% CI)
n / N %
(95% CI) n / N
% (95% CI)
n / N %
(95% CI)
Total 6265 / 8246
75.9
(74.1 - 77.8) 490 / 8246
5.9
(5.0 - 6.9) 448 / 8246
5.5
(4.9 – 6.0) 490 / 8246
6.0
(5.3 - 6.6) 409 / 8246
5.0
(4.4 - 5.5) 144 / 8246
1.8
(1.4 - 2.1)
Sex
Male 2819 / 3729 75.5
(73.1 - 78) 265 / 3729
7.0
(5.6 - 8.5) 197 / 3729
5.3
(4.6 - 6.1) 207 / 3729
5.6
(4.6 - 6.5) 167 / 3729
4.5
(3.7 - 5.3) 74 / 3729
2.0
(1.4 - 2.6)
Female 3446 / 4517 76.3
(74.2 - 78.4) 225 / 4517
5.0
(4.0 - 5.9) 251 / 4517
5.6
(4.7 - 6.4) 283 / 4517
6.3
(5.5 - 7.1) 242 / 4517
5.3
(4.5 - 6.1) 70 / 4517
1.6
(1.2 - 1.9)
Age
12-15 years 4535 / 5330 85.1
(83.3 - 86.9) 366 / 5330
6.8
(5.6 – 8.0) 267 / 5330
5.1
(4.4 - 5.7) 154 / 5330
2.9
(2.4 - 3.4) - - - -
16-18 years 1708 / 2884 59.2
(56.2 - 62.2) 124 / 2884
4.3
(3.4 - 5.2) 179 / 2884
6.2
(5.3 - 7.1) 334 / 2884
11.6
(10.1 - 13.1) 401 / 2884
13.9
(12.4 -
15.3)
138 / 2884 4.8
(3.9 - 5.7)
Sexual attraction
Attracted to opposite sex
5598 / 7310 76.5
(74.7 - 78.4) 394 / 7310
5.4
(4.5 - 6.3) 377 / 7310
5.2
(4.6 - 5.7) 445 / 7310
6.1
(5.4 - 6.8) 364 / 7310
5.0
(4.4 - 5.6) 132 / 7310
1.8
(1.5 - 2.2)
Attracted to same or both sexes
301 / 484 62.2
(57.3 - 67.1) 61 / 484
12.5
(9.4 - 15.6) 46 / 484
9.6
(6.8 - 12.4) 35 / 484
7.3
(5.2 - 9.5) 37 / 484
7.6
(4.9 -
10.2)
4 / 484 0.8
(0.0 - 1.6)
Urban/rural
Urban 5309 / 6915 76.7
(74.8 - 78.7) 401 / 6915
5.8
(4.8 - 6.8) 371 / 6915
5.4
(4.8 – 6.0) 398 / 6915
5.8
(5.1 - 6.4) 315 / 6915
4.6
(4.0 - 5.1) 121 / 6915
1.8
(1.4 - 2.2)
Rural 891 / 1240 71.9
(68.3 - 75.4) 81 / 1240
6.3
(4.6 - 7.9) 72 / 1240
5.9
(4.6 - 7.2) 89 / 1240
7.3
(5.6 – 9.0) 86 / 1240
7.0
(5.3 - 8.7) 21 / 1240
1.7
(1.0 - 2.4)
School decile
Low 1167 / 1678 69.7
(65.5 - 73.9) 197 / 1678
11.6
(9.1 – 14.0) 124 / 1678
7.5
(6.1 - 8.8) 108 / 1678
6.4
(5.3 - 7.6) 66 / 1678
3.9
(3.0 - 4.8) 16 / 1678
1.0
(0.4 - 1.5)
Medium 2442 / 3215 75.7
(72.8 - 78.6) 185 / 3215
5.8
(4.8 - 6.8) 180 / 3215
5.6
(4.7 - 6.6) 195 / 3215
6.2
(4.9 - 7.5) 162 / 3215
5.1
(4.1 – 6.0) 51 / 3215
1.6
(1.1 - 2.1)

54
High 2657 / 3355 79.2
(76.8 - 81.7) 109 / 3355
3.2
(2.3 - 4.2) 144 / 3355
4.3
(3.5 - 5.1) 187 / 3355
5.6
(4.8 - 6.3) 181 / 3355
5.4
(4.4 - 6.3) 77 / 3355
2.3
(1.7 - 2.9)
Neighbourhood deprivation
Low 2095 / 2674 78.3
(76.1 - 80.4) 104 / 2674
3.9
(3.0 - 4.7) 106 / 2674
4.0
(3.3 - 4.7) 159 / 2674
6.0
(5.0 – 7.0) 155 / 2674
5.8
(4.7 - 6.9) 55 / 2674
2.1
(1.3 - 2.8)
Medium 2249 / 2935 76.6
(74.3 - 78.8) 145 / 2935
5.0
(3.9 – 6.0) 164 / 2935
5.6
(4.6 - 6.5) 172 / 2935
5.9
(5.0 - 6.8) 148 / 2935
5.1
(4.3 - 5.8) 57 / 2935
2.0
(1.5 - 2.4)
High 1856 / 2546 72.9
(70.0 - 75.8) 233 / 2546
9.0
(7.3 - 10.8) 173 / 2546
6.9
(5.7 - 8.1) 156 / 2546
6.2
(5.2 - 7.2) 98 / 2546
3.8
(2.9 - 4.7) 30 / 2546
1.2
(0.7 - 1.7)
1 This table refers to answers from the question About how old were you when you first had an experience of sex? (by this we mean sexual intercourse or going all the way). Do not include sexual abuse 2 The proportion of students who reported having their first sexual intercourse at ages 13 or under, 14 or 15 is likely to be slightly inflated in comparison to the proportion of students who reported having their first
sexual intercourse at the age of 16 or 17 or older. This is because both older and younger students are able to respond to the age categories of first having sex at a younger age, but younger students who at the
time of the survey had not had sex, but went on to have their first sexual intercourse at 16 or 17 or older have been excluded from this table. For this same reason the proportion of students who reported to have
their first sexual intercourse at the age of 16 or 17 or older is likely to underrepresent the general student population.
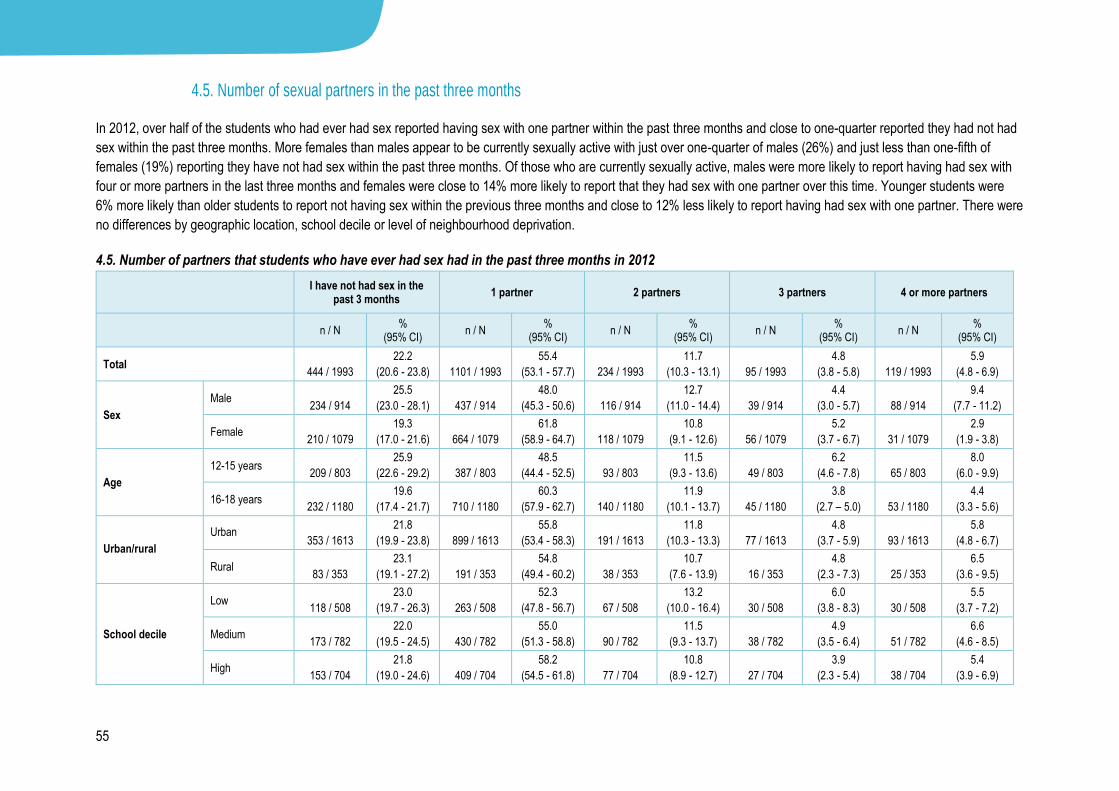
55
4.5. Number of sexual partners in the past three months
In 2012, over half of the students who had ever had sex reported having sex with one partner within the past three months and close to one-quarter reported they had not had
sex within the past three months. More females than males appear to be currently sexually active with just over one-quarter of males (26%) and just less than one-fifth of
females (19%) reporting they have not had sex within the past three months. Of those who are currently sexually active, males were more likely to report having had sex with
four or more partners in the last three months and females were close to 14% more likely to report that they had sex with one partner over this time. Younger students were
6% more likely than older students to report not having sex within the previous three months and close to 12% less likely to report having had sex with one partner. There were
no differences by geographic location, school decile or level of neighbourhood deprivation.
4.5. Number of partners that students who have ever had sex had in the past three months in 2012
I have not had sex in the past 3 months
1 partner 2 partners 3 partners 4 or more partners
n / N %
(95% CI) n / N
% (95% CI)
n / N %
(95% CI) n / N
% (95% CI)
n / N %
(95% CI)
Total 444 / 1993
22.2
(20.6 - 23.8) 1101 / 1993
55.4
(53.1 - 57.7) 234 / 1993
11.7
(10.3 - 13.1) 95 / 1993
4.8
(3.8 - 5.8) 119 / 1993
5.9
(4.8 - 6.9)
Sex
Male 234 / 914
25.5
(23.0 - 28.1) 437 / 914
48.0
(45.3 - 50.6) 116 / 914
12.7
(11.0 - 14.4) 39 / 914
4.4
(3.0 - 5.7) 88 / 914
9.4
(7.7 - 11.2)
Female 210 / 1079
19.3
(17.0 - 21.6) 664 / 1079
61.8
(58.9 - 64.7) 118 / 1079
10.8
(9.1 - 12.6) 56 / 1079
5.2
(3.7 - 6.7) 31 / 1079
2.9
(1.9 - 3.8)
Age
12-15 years 209 / 803
25.9
(22.6 - 29.2) 387 / 803
48.5
(44.4 - 52.5) 93 / 803
11.5
(9.3 - 13.6) 49 / 803
6.2
(4.6 - 7.8) 65 / 803
8.0
(6.0 - 9.9)
16-18 years 232 / 1180
19.6
(17.4 - 21.7) 710 / 1180
60.3
(57.9 - 62.7) 140 / 1180
11.9
(10.1 - 13.7) 45 / 1180
3.8
(2.7 – 5.0) 53 / 1180
4.4
(3.3 - 5.6)
Urban/rural
Urban 353 / 1613
21.8
(19.9 - 23.8) 899 / 1613
55.8
(53.4 - 58.3) 191 / 1613
11.8
(10.3 - 13.3) 77 / 1613
4.8
(3.7 - 5.9) 93 / 1613
5.8
(4.8 - 6.7)
Rural 83 / 353
23.1
(19.1 - 27.2) 191 / 353
54.8
(49.4 - 60.2) 38 / 353
10.7
(7.6 - 13.9) 16 / 353
4.8
(2.3 - 7.3) 25 / 353
6.5
(3.6 - 9.5)
School decile
Low 118 / 508
23.0
(19.7 - 26.3) 263 / 508
52.3
(47.8 - 56.7) 67 / 508
13.2
(10.0 - 16.4) 30 / 508
6.0
(3.8 - 8.3) 30 / 508
5.5
(3.7 - 7.2)
Medium 173 / 782
22.0
(19.5 - 24.5) 430 / 782
55.0
(51.3 - 58.8) 90 / 782
11.5
(9.3 - 13.7) 38 / 782
4.9
(3.5 - 6.4) 51 / 782
6.6
(4.6 - 8.5)
High 153 / 704
21.8
(19.0 - 24.6) 409 / 704
58.2
(54.5 - 61.8) 77 / 704
10.8
(8.9 - 12.7) 27 / 704
3.9
(2.3 - 5.4) 38 / 704
5.4
(3.9 - 6.9)

56
Neighbourhood deprivation
Low 126 / 587
21.3
(18.4 - 24.3) 354 / 587
60.6
(56.1 – 65.0) 62 / 587
10.5
(8.0 – 13.0) 21 / 587
3.6
(2.1 – 5.0) 24 / 587
4.0
(2.5 - 5.6)
Medium 162 / 691
23.3
(20.4 - 26.3) 371 / 691
53.7
(50 - 57.5) 80 / 691
11.5
(9.4 - 13.6) 29 / 691
4.3
(2.8 - 5.7) 49 / 691
7.2
(5.2 - 9.1)
High 148 / 688
21.4
(18.0 - 24.8) 365 / 688
53.4
(49.6 - 57.1) 87 / 688
12.6
(10.3 - 14.9) 43 / 688
6.4
(4.4 - 8.4) 45 / 688
6.2
(4.7 - 7.7)
4.6. Contraception students are currently using
In 2012, when asked what contraception they are currently using, 80% of currently sexually active student reported using condoms and less than half reported using the pill
(45%). About 10% of students reported using the withdrawal method and the morning after pill. Less than 7% of sexually active students reported using a Depo provera
injection, the contraceptive implant, the rhythm method, other methods or no contraception. The vast majority of younger students (12-15 years) reported using condoms
(84%) and about 35% reported using the pill. In contrast, over half of the older students (16-18 years old) reported using the pill and a comparatively lower proportion reported
to use condoms (78%). Students who came from poorer neighbourhoods were more likely to report using condoms than the pill, whereas the gap between condom and pill use
was much smaller for students who live in wealthy neighbourhoods. This question does not ask about reliability or frequency of contraceptive use.
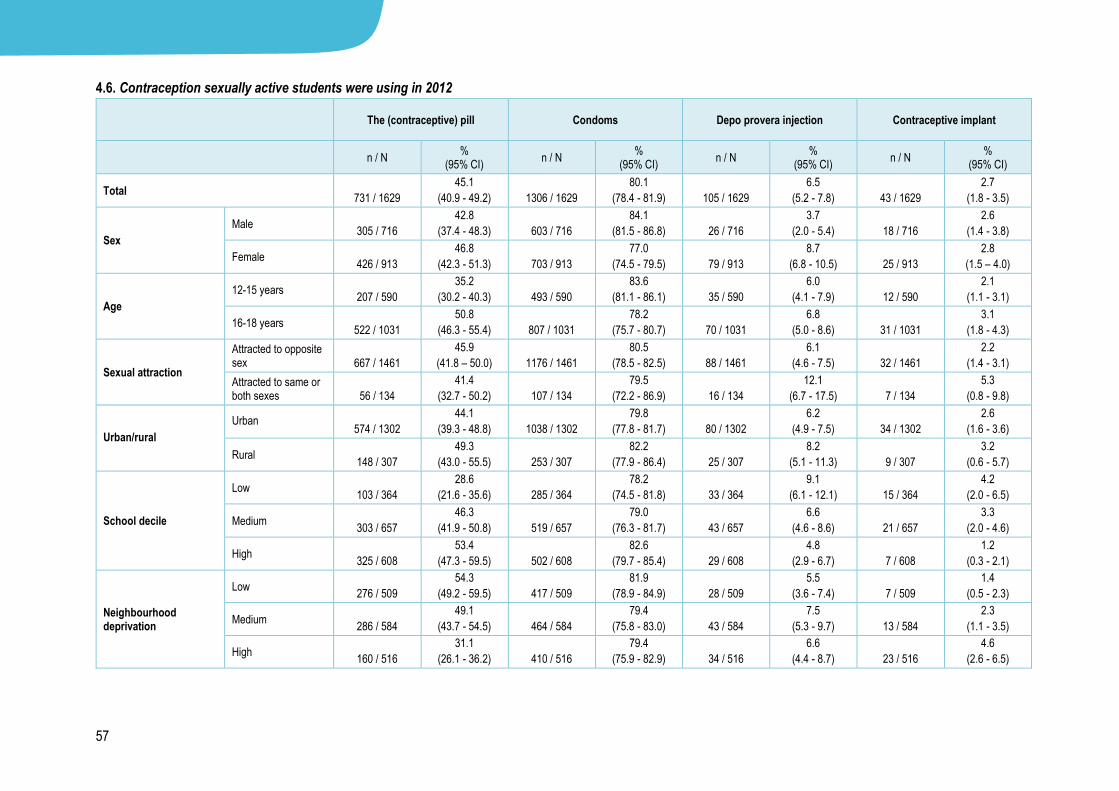
57
4.6. Contraception sexually active students were using in 2012
The (contraceptive) pill Condoms Depo provera injection Contraceptive implant
n / N %
(95% CI) n / N
% (95% CI)
n / N %
(95% CI) n / N
% (95% CI)
Total 731 / 1629
45.1
(40.9 - 49.2) 1306 / 1629
80.1
(78.4 - 81.9) 105 / 1629
6.5
(5.2 - 7.8) 43 / 1629
2.7
(1.8 - 3.5)
Sex
Male 305 / 716
42.8
(37.4 - 48.3) 603 / 716
84.1
(81.5 - 86.8) 26 / 716
3.7
(2.0 - 5.4) 18 / 716
2.6
(1.4 - 3.8)
Female 426 / 913
46.8
(42.3 - 51.3) 703 / 913
77.0
(74.5 - 79.5) 79 / 913
8.7
(6.8 - 10.5) 25 / 913
2.8
(1.5 – 4.0)
Age
12-15 years 207 / 590
35.2
(30.2 - 40.3) 493 / 590
83.6
(81.1 - 86.1) 35 / 590
6.0
(4.1 - 7.9) 12 / 590
2.1
(1.1 - 3.1)
16-18 years 522 / 1031
50.8
(46.3 - 55.4) 807 / 1031
78.2
(75.7 - 80.7) 70 / 1031
6.8
(5.0 - 8.6) 31 / 1031
3.1
(1.8 - 4.3)
Sexual attraction
Attracted to opposite sex 667 / 1461
45.9
(41.8 – 50.0) 1176 / 1461
80.5
(78.5 - 82.5) 88 / 1461
6.1
(4.6 - 7.5) 32 / 1461
2.2
(1.4 - 3.1)
Attracted to same or both sexes 56 / 134
41.4
(32.7 - 50.2) 107 / 134
79.5
(72.2 - 86.9) 16 / 134
12.1
(6.7 - 17.5) 7 / 134
5.3
(0.8 - 9.8)
Urban/rural
Urban 574 / 1302
44.1
(39.3 - 48.8) 1038 / 1302
79.8
(77.8 - 81.7) 80 / 1302
6.2
(4.9 - 7.5) 34 / 1302
2.6
(1.6 - 3.6)
Rural 148 / 307
49.3
(43.0 - 55.5) 253 / 307
82.2
(77.9 - 86.4) 25 / 307
8.2
(5.1 - 11.3) 9 / 307
3.2
(0.6 - 5.7)
School decile
Low 103 / 364
28.6
(21.6 - 35.6) 285 / 364
78.2
(74.5 - 81.8) 33 / 364
9.1
(6.1 - 12.1) 15 / 364
4.2
(2.0 - 6.5)
Medium 303 / 657
46.3
(41.9 - 50.8) 519 / 657
79.0
(76.3 - 81.7) 43 / 657
6.6
(4.6 - 8.6) 21 / 657
3.3
(2.0 - 4.6)
High 325 / 608
53.4
(47.3 - 59.5) 502 / 608
82.6
(79.7 - 85.4) 29 / 608
4.8
(2.9 - 6.7) 7 / 608
1.2
(0.3 - 2.1)
Neighbourhood deprivation
Low 276 / 509
54.3
(49.2 - 59.5) 417 / 509
81.9
(78.9 - 84.9) 28 / 509
5.5
(3.6 - 7.4) 7 / 509
1.4
(0.5 - 2.3)
Medium 286 / 584
49.1
(43.7 - 54.5) 464 / 584
79.4
(75.8 - 83.0) 43 / 584
7.5
(5.3 - 9.7) 13 / 584
2.3
(1.1 - 3.5)
High 160 / 516
31.1
(26.1 - 36.2) 410 / 516
79.4
(75.9 - 82.9) 34 / 516
6.6
(4.4 - 8.7) 23 / 516
4.6
(2.6 - 6.5)
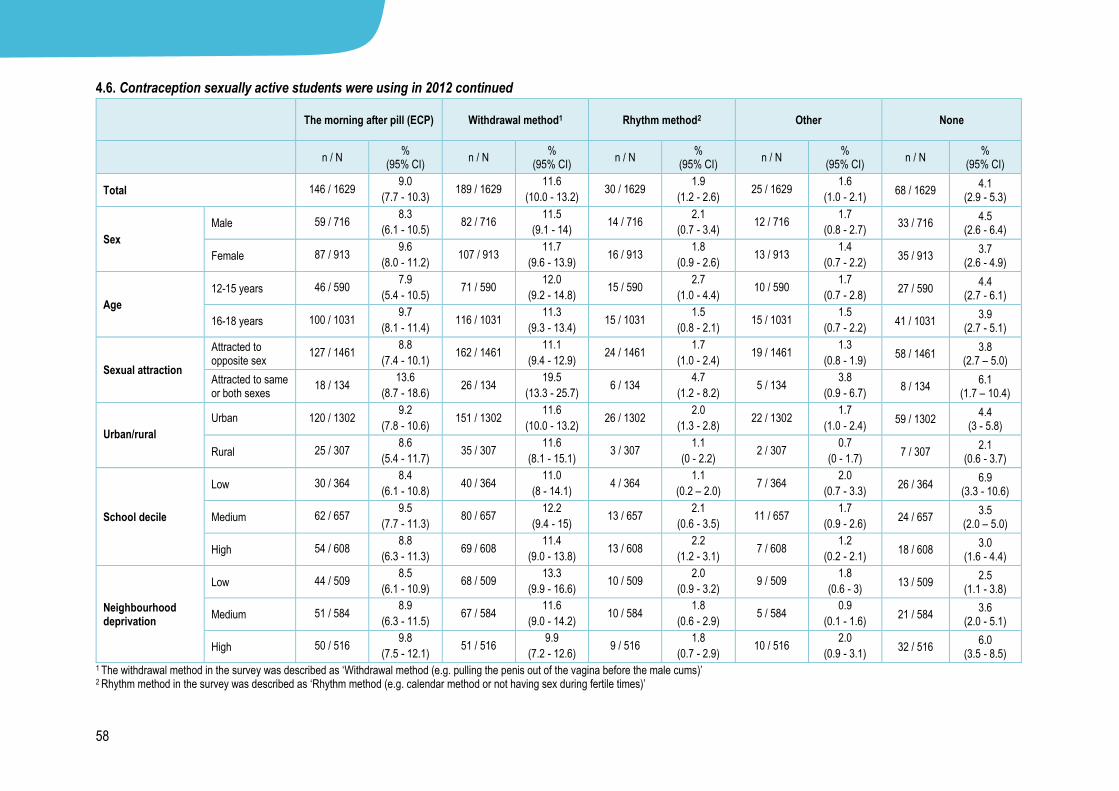
58
4.6. Contraception sexually active students were using in 2012 continued
The morning after pill (ECP) Withdrawal method1 Rhythm method2 Other None
n / N %
(95% CI) n / N
% (95% CI)
n / N %
(95% CI) n / N
% (95% CI)
n / N %
(95% CI)
Total 146 / 1629 9.0
(7.7 - 10.3) 189 / 1629
11.6
(10.0 - 13.2) 30 / 1629
1.9
(1.2 - 2.6) 25 / 1629
1.6
(1.0 - 2.1) 68 / 1629
4.1 (2.9 - 5.3)
Sex
Male 59 / 716 8.3
(6.1 - 10.5) 82 / 716
11.5
(9.1 - 14) 14 / 716
2.1
(0.7 - 3.4) 12 / 716
1.7
(0.8 - 2.7) 33 / 716
4.5 (2.6 - 6.4)
Female 87 / 913 9.6
(8.0 - 11.2) 107 / 913
11.7
(9.6 - 13.9) 16 / 913
1.8
(0.9 - 2.6) 13 / 913
1.4
(0.7 - 2.2) 35 / 913
3.7 (2.6 - 4.9)
Age
12-15 years 46 / 590 7.9
(5.4 - 10.5) 71 / 590
12.0
(9.2 - 14.8) 15 / 590
2.7
(1.0 - 4.4) 10 / 590
1.7
(0.7 - 2.8) 27 / 590
4.4 (2.7 - 6.1)
16-18 years 100 / 1031 9.7
(8.1 - 11.4) 116 / 1031
11.3
(9.3 - 13.4) 15 / 1031
1.5
(0.8 - 2.1) 15 / 1031
1.5
(0.7 - 2.2) 41 / 1031
3.9 (2.7 - 5.1)
Sexual attraction
Attracted to opposite sex
127 / 1461 8.8
(7.4 - 10.1) 162 / 1461
11.1
(9.4 - 12.9) 24 / 1461
1.7
(1.0 - 2.4) 19 / 1461
1.3
(0.8 - 1.9) 58 / 1461
3.8 (2.7 – 5.0)
Attracted to same or both sexes
18 / 134 13.6
(8.7 - 18.6) 26 / 134
19.5
(13.3 - 25.7) 6 / 134
4.7
(1.2 - 8.2) 5 / 134
3.8
(0.9 - 6.7) 8 / 134
6.1 (1.7 – 10.4)
Urban/rural
Urban 120 / 1302 9.2
(7.8 - 10.6) 151 / 1302
11.6
(10.0 - 13.2) 26 / 1302
2.0
(1.3 - 2.8) 22 / 1302
1.7
(1.0 - 2.4) 59 / 1302
4.4 (3 - 5.8)
Rural 25 / 307 8.6
(5.4 - 11.7) 35 / 307
11.6
(8.1 - 15.1) 3 / 307
1.1
(0 - 2.2) 2 / 307
0.7
(0 - 1.7) 7 / 307
2.1 (0.6 - 3.7)
School decile
Low 30 / 364 8.4
(6.1 - 10.8) 40 / 364
11.0
(8 - 14.1) 4 / 364
1.1
(0.2 – 2.0) 7 / 364
2.0
(0.7 - 3.3) 26 / 364
6.9 (3.3 - 10.6)
Medium 62 / 657 9.5
(7.7 - 11.3) 80 / 657
12.2
(9.4 - 15) 13 / 657
2.1
(0.6 - 3.5) 11 / 657
1.7
(0.9 - 2.6) 24 / 657
3.5 (2.0 – 5.0)
High 54 / 608 8.8
(6.3 - 11.3) 69 / 608
11.4
(9.0 - 13.8) 13 / 608
2.2
(1.2 - 3.1) 7 / 608
1.2
(0.2 - 2.1) 18 / 608
3.0 (1.6 - 4.4)
Neighbourhood deprivation
Low 44 / 509 8.5
(6.1 - 10.9) 68 / 509
13.3
(9.9 - 16.6) 10 / 509
2.0
(0.9 - 3.2) 9 / 509
1.8
(0.6 - 3) 13 / 509
2.5 (1.1 - 3.8)
Medium 51 / 584 8.9
(6.3 - 11.5) 67 / 584
11.6
(9.0 - 14.2) 10 / 584
1.8
(0.6 - 2.9) 5 / 584
0.9
(0.1 - 1.6) 21 / 584
3.6 (2.0 - 5.1)
High 50 / 516 9.8
(7.5 - 12.1) 51 / 516
9.9
(7.2 - 12.6) 9 / 516
1.8
(0.7 - 2.9) 10 / 516
2.0
(0.9 - 3.1) 32 / 516
6.0 (3.5 - 8.5)
1 The withdrawal method in the survey was described as ‘Withdrawal method (e.g. pulling the penis out of the vagina before the male cums)’ 2 Rhythm method in the survey was described as ‘Rhythm method (e.g. calendar method or not having sex during fertile times)’
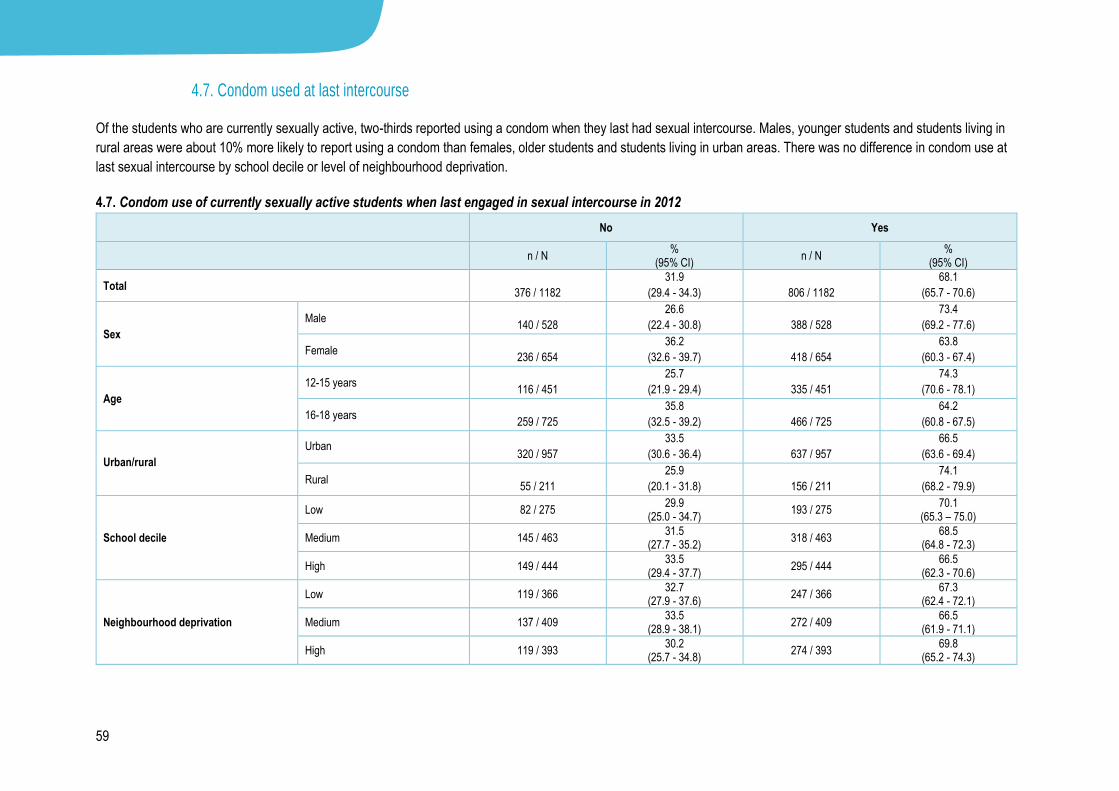
59
4.7. Condom used at last intercourse
Of the students who are currently sexually active, two-thirds reported using a condom when they last had sexual intercourse. Males, younger students and students living in
rural areas were about 10% more likely to report using a condom than females, older students and students living in urban areas. There was no difference in condom use at
last sexual intercourse by school decile or level of neighbourhood deprivation.
4.7. Condom use of currently sexually active students when last engaged in sexual intercourse in 2012
No Yes
n / N %
(95% CI) n / N
% (95% CI)
Total 376 / 1182
31.9
(29.4 - 34.3) 806 / 1182
68.1
(65.7 - 70.6)
Sex
Male 140 / 528
26.6
(22.4 - 30.8) 388 / 528
73.4
(69.2 - 77.6)
Female 236 / 654
36.2
(32.6 - 39.7) 418 / 654
63.8
(60.3 - 67.4)
Age
12-15 years 116 / 451
25.7
(21.9 - 29.4) 335 / 451
74.3
(70.6 - 78.1)
16-18 years 259 / 725
35.8
(32.5 - 39.2) 466 / 725
64.2
(60.8 - 67.5)
Urban/rural
Urban 320 / 957
33.5
(30.6 - 36.4) 637 / 957
66.5
(63.6 - 69.4)
Rural 55 / 211
25.9
(20.1 - 31.8) 156 / 211
74.1
(68.2 - 79.9)
School decile
Low 82 / 275 29.9
(25.0 - 34.7) 193 / 275
70.1 (65.3 – 75.0)
Medium 145 / 463 31.5
(27.7 - 35.2) 318 / 463
68.5 (64.8 - 72.3)
High 149 / 444 33.5
(29.4 - 37.7) 295 / 444
66.5 (62.3 - 70.6)
Neighbourhood deprivation
Low 119 / 366 32.7
(27.9 - 37.6) 247 / 366
67.3 (62.4 - 72.1)
Medium 137 / 409 33.5
(28.9 - 38.1) 272 / 409
66.5 (61.9 - 71.1)
High 119 / 393 30.2
(25.7 - 34.8) 274 / 393
69.8 (65.2 - 74.3)

60
4.8. Contraception used at last intercourse
Of the students who are currently sexually active, over three-quarters reported using some form of contraception when they last engaged in sexual intercourse. Students who
live in rural areas were about 10% less likely to report using contraception at their last sexual intercourse than students living in urban areas. Students who attended low decile
schools and who lived in poor neighbourhoods were about two times less likely to report using contraception the last time they had sexual intercourse. There was no difference
in use of contraception at last sexual intercourse by sex or age.
4.8. Contraception use of currently sexually active students when last engaged in sexual intercourse in 2012
No Yes
n / N %
(95% CI) n / N
% (95% CI)
Total 296 / 1309 22.5
(19.4 - 25.6) 1013 / 1309
77.5
(74.4 - 80.6)
Sex
Male 141 / 559 25.1
(21.6 - 28.6) 418 / 559
74.9
(71.4 - 78.4)
Female 155 / 750 20.6
(16.3 - 24.9) 595 / 750
79.4
(75.1 - 83.7)
Age
12-15 years 124 / 463 26.6
(21.8 - 31.4) 339 / 463
73.4
(68.6 - 78.2)
16-18 years 170 / 840 20.2
(16.6 - 23.8) 670 / 840
79.8
(76.2 - 83.4)
Urban/rural
Urban 257 / 1051 24.5
(21 - 28) 794 / 1051
75.5
(72.0 – 79.0)
Rural 35 / 240 13.9
(9.9 – 18.0) 205 / 240
86.1
(82.0 - 90.1)
School decile
Low 109 / 290 37.2
(30.8 - 43.7) 181 / 290
62.8 (56.3 - 69.2)
Medium 109 / 528 20.7
(16.3 - 25.1) 419 / 528
79.3 (74.9 - 83.7)
High 78 / 491 15.9
(13.3 - 18.6) 413 / 491
84.1 (81.4 - 86.7)
Neighbourhood deprivation
Low 73 / 414 17.9
(13.5 - 22.4) 341 / 414
82.1 (77.6 - 86.5)
Medium 77 / 469 16.4
(12.7 - 20.1) 392 / 469
83.6 (79.9 - 87.3)
High 142 / 408 34.5
(29.2 - 39.7) 266 / 408
65.5 (60.3 - 70.8)

61
4.9. Discussed preventing pregnancy with partner/s
Of the students who were sexually active, just over one-third reported always discussing preventing pregnancy with their partner/s. Just over one-quarter report they never
discuss preventing pregnancy with their partner/s. Female students and students who are older were more likely than their male and younger counterparts to report always
discussing pregnancy prevention with their partner/s.
4.9. Currently sexually active students’ discussion of pregnancy prevention with partner/s in 2012
Never Depends on the situation Always
n / N %
(95% CI) n / N
% (95% CI)
n / N %
(95% CI)
Total 538 / 1984 27.0
(24.7 - 29.2) 726 / 1984
36.7
(34.7 - 38.7) 720 / 1984
36.4
(34 - 38.8)
Sex
Male 313 / 907 34.2
(31.4 - 37.1) 324 / 907
35.9
(32.9 - 38.9) 270 / 907
29.9
(26.7 – 33.0)
Female 225 / 1077 20.8
(18.0 - 23.6) 402 / 1077
37.3
(34.4 - 40.2) 450 / 1077
41.9
(38.7 - 45.1)
Age
12-15 years 304 / 796 38.1
(34.3 - 41.9) 264 / 796
33.2
(30.2 - 36.1) 228 / 796
28.8
(25.2 - 32.4)
16-18 years 232 / 1179 19.5
(17.1 - 21.9) 459 / 1179
39.0
(36.5 - 41.6) 488 / 1179
41.4
(38.7 - 44.2)
Urban/rural
Urban 421 / 1607 26.2
(24.0 - 28.4) 594 / 1607
36.9
(34.7 - 39.2) 592 / 1607
36.9
(34.4 - 39.4)
Rural 103 / 350 28.4
(23.6 - 33.2) 126 / 350
36.6
(31.3 - 41.9) 121 / 350
34.9
(29.1 - 40.8)
School decile
Low 174 / 505 33.8
(30 - 37.7) 167 / 505
33.4 (29.6 - 37.2)
164 / 505 32.7
(28.6 - 36.9)
Medium 186 / 775 24.1
(20.5 - 27.7) 312 / 775
40.2 (37.4 – 43.0)
277 / 775 35.7
(32.7 - 38.7)
High 178 / 705 25.3
(22.4 - 28.1) 248 / 705
35.1 (31.6 - 38.5)
279 / 705 39.6
(35.2 - 44.1)
Neighbourhood deprivation
Low 144 / 583 24.7
(22.0 - 27.3) 220 / 583
37.6
(33.2 - 41.9) 219 / 583
37.8
(33.6 - 41.9)
Medium 164 / 688 23.8
(20.2 - 27.4) 255 / 688
37.2
(33.9 - 40.4) 269 / 688
39.0
(35.4 - 42.7)
High 216 / 686 31.0
(27.5 - 34.6) 245 / 686
35.9
(32.4 - 39.5) 225 / 686
33.0
(29.4 - 36.6)

62
4.10. Discussed preventing sexually transmitted infections with partner/s
Just over half (58%) of sexually active students reported they had not discussed STI (including HIV) prevention with their partner/s. Females and students living in
comparatively wealthy neighbourhoods were slightly more likely to discuss this with their partners. There were no differences in discussing STI prevention by age, sexual
attraction or school decile.
4.10. Currently sexually active students’ discussion of STI prevention with partner/s in 2012
No Yes
n / N %
(95% CI) n / N
% (95% CI)
Total 1150 / 1978 58.1
(55.2 - 61.1) 828 / 1978
41.9
(38.9 - 44.8)
Sex
Male 551 / 900 61.2
(57.5 - 64.9) 349 / 900
38.8
(35.1 - 42.5)
Female 599 / 1078 55.6
(51.6 - 59.5) 479 / 1078
44.4
(40.5 - 48.4)
Age
12-15 years 470 / 793 59.3
(55.4 - 63.1) 323 / 793
40.7
(36.9 - 44.6)
16-18 years 676 / 1177 57.5
(54.0 - 60.9) 501 / 1177
42.5
(39.1 – 46.0)
Urban/rural
Urban 921 / 1599 57.7
(54.5 - 60.9) 678 / 1599
42.3
(39.1 - 45.5)
Rural 209 / 351 59.0
(53.5 - 64.5) 142 / 351
41.0
(35.5 - 46.5)
Decile
Low 276 / 502 54.7
(48.1 - 61.3) 226 / 502
45.3
(38.7 - 51.9)
Medium 450 / 772 58.4
(53.7 - 63.2) 322 / 772
41.6
(36.8 - 46.3)
High 424 / 705 60.2
(56.2 - 64.1) 281 / 705
39.8
(35.9 - 43.8)
Neighbourhood deprivation
Low 368 / 583 63.3
(59.3 - 67.4) 215 / 583
36.7
(32.6 - 40.7)
Medium 396 / 687 57.5
(53.9 – 61.0) 291 / 687
42.5
(39.0 - 46.1)
High 366 / 680 53.7
(48.7 - 58.8) 314 / 680
46.3
(41.2 - 51.3)
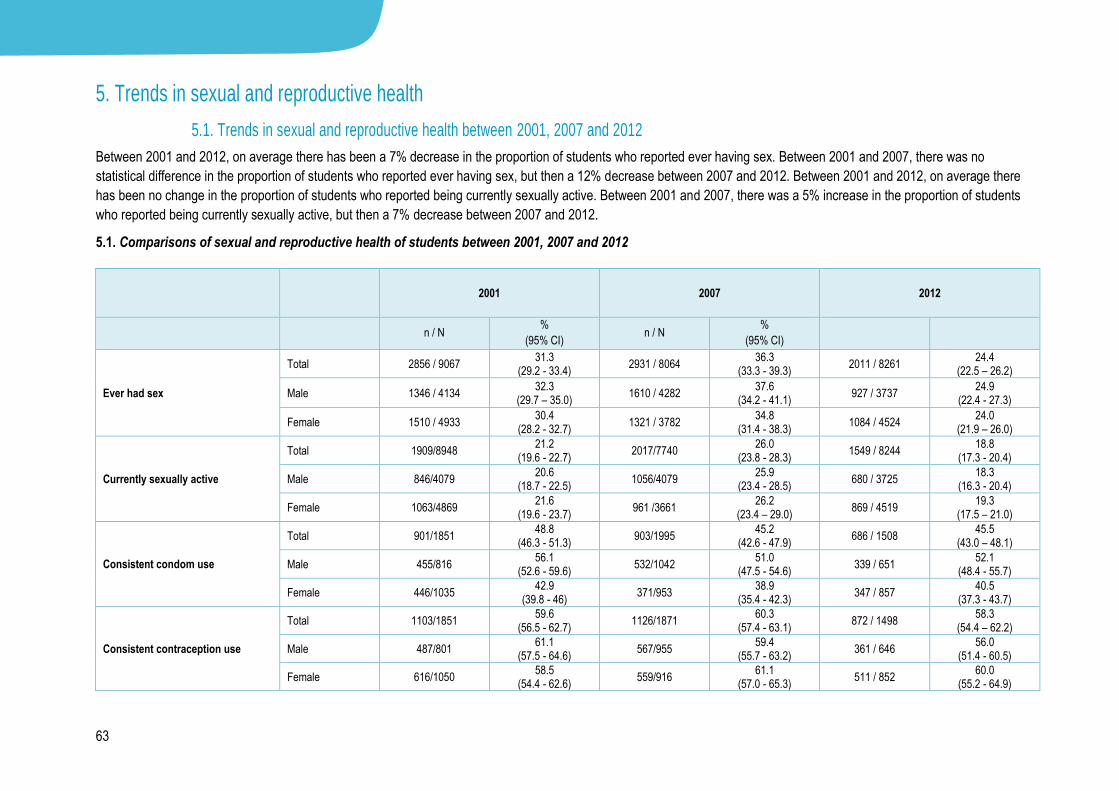
63
5. Trends in sexual and reproductive health
5.1. Trends in sexual and reproductive health between 2001, 2007 and 2012
Between 2001 and 2012, on average there has been a 7% decrease in the proportion of students who reported ever having sex. Between 2001 and 2007, there was no
statistical difference in the proportion of students who reported ever having sex, but then a 12% decrease between 2007 and 2012. Between 2001 and 2012, on average there
has been no change in the proportion of students who reported being currently sexually active. Between 2001 and 2007, there was a 5% increase in the proportion of students
who reported being currently sexually active, but then a 7% decrease between 2007 and 2012.
5.1. Comparisons of sexual and reproductive health of students between 2001, 2007 and 2012
2001 2007 2012
n / N %
(95% CI) n / N
%
(95% CI)
Ever had sex
Total 2856 / 9067 31.3
(29.2 - 33.4) 2931 / 8064
36.3 (33.3 - 39.3)
2011 / 8261 24.4
(22.5 – 26.2)
Male 1346 / 4134 32.3
(29.7 – 35.0) 1610 / 4282
37.6 (34.2 - 41.1)
927 / 3737 24.9
(22.4 - 27.3)
Female 1510 / 4933 30.4
(28.2 - 32.7) 1321 / 3782
34.8 (31.4 - 38.3)
1084 / 4524 24.0
(21.9 – 26.0)
Currently sexually active
Total 1909/8948 21.2
(19.6 - 22.7) 2017/7740
26.0 (23.8 - 28.3)
1549 / 8244 18.8
(17.3 - 20.4)
Male 846/4079 20.6
(18.7 - 22.5) 1056/4079
25.9 (23.4 - 28.5)
680 / 3725 18.3
(16.3 - 20.4)
Female 1063/4869 21.6
(19.6 - 23.7) 961 /3661
26.2 (23.4 – 29.0)
869 / 4519 19.3
(17.5 – 21.0)
Consistent condom use
Total 901/1851 48.8
(46.3 - 51.3) 903/1995
45.2 (42.6 - 47.9)
686 / 1508 45.5
(43.0 – 48.1)
Male 455/816 56.1
(52.6 - 59.6) 532/1042
51.0 (47.5 - 54.6)
339 / 651 52.1
(48.4 - 55.7)
Female 446/1035 42.9
(39.8 - 46) 371/953
38.9 (35.4 - 42.3)
347 / 857 40.5
(37.3 - 43.7)
Consistent contraception use
Total 1103/1851 59.6
(56.5 - 62.7) 1126/1871
60.3 (57.4 - 63.1)
872 / 1498 58.3
(54.4 – 62.2)
Male 487/801 61.1
(57.5 - 64.6) 567/955
59.4 (55.7 - 63.2)
361 / 646 56.0
(51.4 - 60.5)
Female 616/1050 58.5
(54.4 - 62.6) 559/916
61.1 (57.0 - 65.3)
511 / 852 60.0
(55.2 - 64.9)
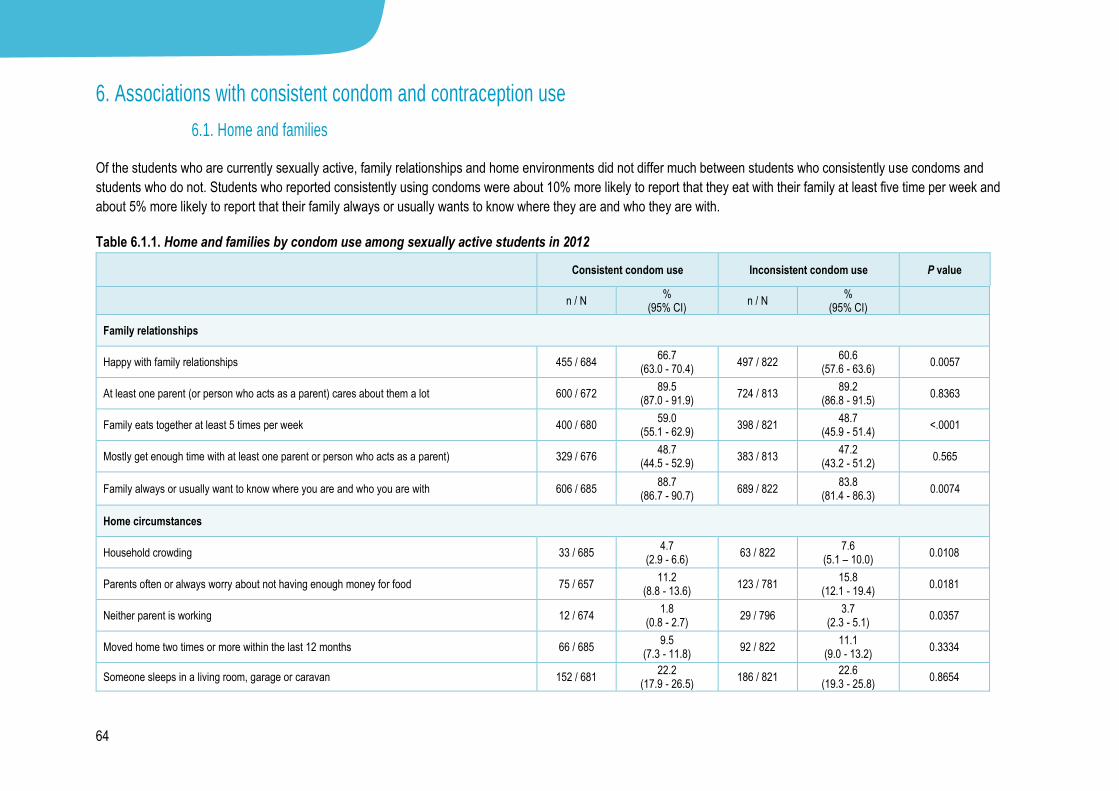
64
6. Associations with consistent condom and contraception use
6.1. Home and families
Of the students who are currently sexually active, family relationships and home environments did not differ much between students who consistently use condoms and
students who do not. Students who reported consistently using condoms were about 10% more likely to report that they eat with their family at least five time per week and
about 5% more likely to report that their family always or usually wants to know where they are and who they are with.
Table 6.1.1. Home and families by condom use among sexually active students in 2012
Consistent condom use Inconsistent condom use P value
n / N
% (95% CI)
n / N %
(95% CI)
Family relationships
Happy with family relationships 455 / 684 66.7
(63.0 - 70.4) 497 / 822
60.6 (57.6 - 63.6)
0.0057
At least one parent (or person who acts as a parent) cares about them a lot 600 / 672 89.5
(87.0 - 91.9) 724 / 813
89.2 (86.8 - 91.5)
0.8363
Family eats together at least 5 times per week 400 / 680 59.0
(55.1 - 62.9) 398 / 821
48.7 (45.9 - 51.4)
<.0001
Mostly get enough time with at least one parent or person who acts as a parent) 329 / 676 48.7
(44.5 - 52.9) 383 / 813
47.2 (43.2 - 51.2)
0.565
Family always or usually want to know where you are and who you are with 606 / 685 88.7
(86.7 - 90.7) 689 / 822
83.8 (81.4 - 86.3)
0.0074
Home circumstances
Household crowding 33 / 685 4.7
(2.9 - 6.6) 63 / 822
7.6 (5.1 – 10.0)
0.0108
Parents often or always worry about not having enough money for food 75 / 657 11.2
(8.8 - 13.6) 123 / 781
15.8 (12.1 - 19.4)
0.0181
Neither parent is working 12 / 674 1.8
(0.8 - 2.7) 29 / 796
3.7 (2.3 - 5.1)
0.0357
Moved home two times or more within the last 12 months 66 / 685 9.5
(7.3 - 11.8) 92 / 822
11.1 (9.0 - 13.2)
0.3334
Someone sleeps in a living room, garage or caravan 152 / 681 22.2
(17.9 - 26.5) 186 / 821
22.6 (19.3 - 25.8)
0.8654

65
The family relationships of students who are currently sexually active and who consistently use contraception are fairly similar to those of students who are inconsistent users
of contraception. Of the family relationship variables measured, the only difference was students who reported consistently use contraception were about 7% more likely to
report that at least one parent cares about them a lot. There was greater disparity between the home environments of the two groups, but the differences reported were small.
Students who reported to consistently use contraception were less likely to report living in crowded housing (6% less), that neither parent works (3% less) and that someone
sleeps in a room that is not a bedroom (9% less).
Table 6.1.2. Home and families by contraception use among sexually active students in 2012
Consistent contraception use Inconsistent contraception use P value
n / N
% (95% CI)
n / N %
(95% CI)
Family relationships
Happy with family relationships 563 / 869 64.9
(61.9 - 67.9) 382 / 627
61.1 (56.6 - 65.7)
0.1704
At least one parent (or person who acts as a parent) cares about them a lot 796 / 861 92.6
(90.7 - 94.4) 526 / 615
85.7 (82.7 - 88.7)
0.0002
Family eats together at least 5 times per week 481 / 869 55.5
(51.9 – 59.0) 308 / 623
49.6 (46.2 - 53.1)
0.0328
Mostly get enough time with at least one parent or person who acts as a parent) 422 / 859 49.2
(45.2 - 53.3) 280 / 619
45.3 (41.4 - 49.1)
0.1232
Family always or usually want to know where you are and who you are with 761 / 870 87.6
(85.1 – 90.0) 532 / 627
85.0 (82.1 - 87.9)
0.2169
Home circumstances
Household crowding 34 / 870 3.9
(2.4 - 5.3) 61 / 627
9.6 (6.4 - 12.7)
0.0003
Parents often or always worry about not having enough money for food 99 / 836 11.8
(9.1 - 14.4) 95 / 595
15.9 (11.7 - 20.0)
0.0838
Neither parent is working 13 / 851 1.6
(0.7 - 2.4) 27 / 607
4.4 (3.0 - 5.8)
0.0007
Moved home two times or more within the last 12 months 81 / 872 9.3
(7.2 - 11.4) 72 / 625
11.4 (8.9 - 13.9)
0.2425
Someone sleeps in a living room, garage or caravan 159 / 868 18.2
(15.0 - 21.5) 170 / 625
27.0 (23.2 - 30.8)
<.0001
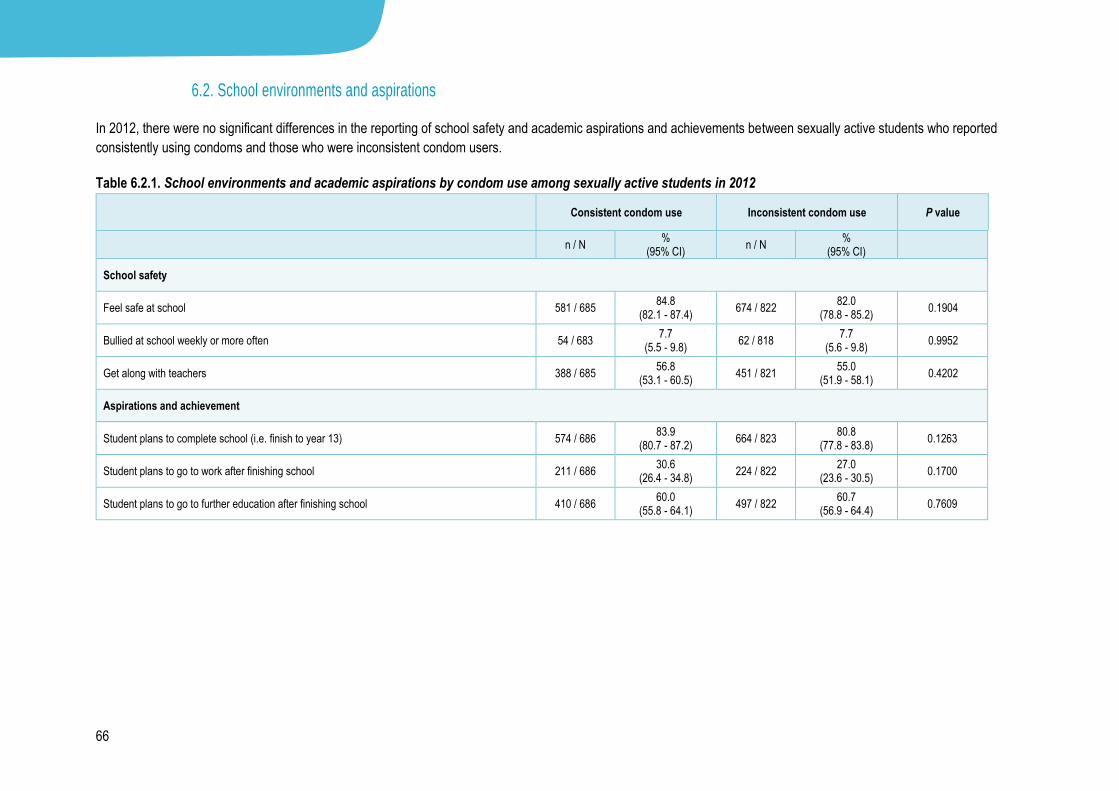
66
6.2. School environments and aspirations
In 2012, there were no significant differences in the reporting of school safety and academic aspirations and achievements between sexually active students who reported
consistently using condoms and those who were inconsistent condom users.
Table 6.2.1. School environments and academic aspirations by condom use among sexually active students in 2012
Consistent condom use Inconsistent condom use P value
n / N
% (95% CI)
n / N %
(95% CI)
School safety
Feel safe at school 581 / 685 84.8
(82.1 - 87.4) 674 / 822
82.0 (78.8 - 85.2)
0.1904
Bullied at school weekly or more often 54 / 683 7.7
(5.5 - 9.8) 62 / 818
7.7 (5.6 - 9.8)
0.9952
Get along with teachers 388 / 685 56.8
(53.1 - 60.5) 451 / 821
55.0 (51.9 - 58.1)
0.4202
Aspirations and achievement
Student plans to complete school (i.e. finish to year 13) 574 / 686 83.9
(80.7 - 87.2) 664 / 823
80.8 (77.8 - 83.8)
0.1263
Student plans to go to work after finishing school 211 / 686 30.6
(26.4 - 34.8) 224 / 822
27.0 (23.6 - 30.5)
0.1700
Student plans to go to further education after finishing school 410 / 686 60.0
(55.8 - 64.1) 497 / 822
60.7 (56.9 - 64.4)
0.7609
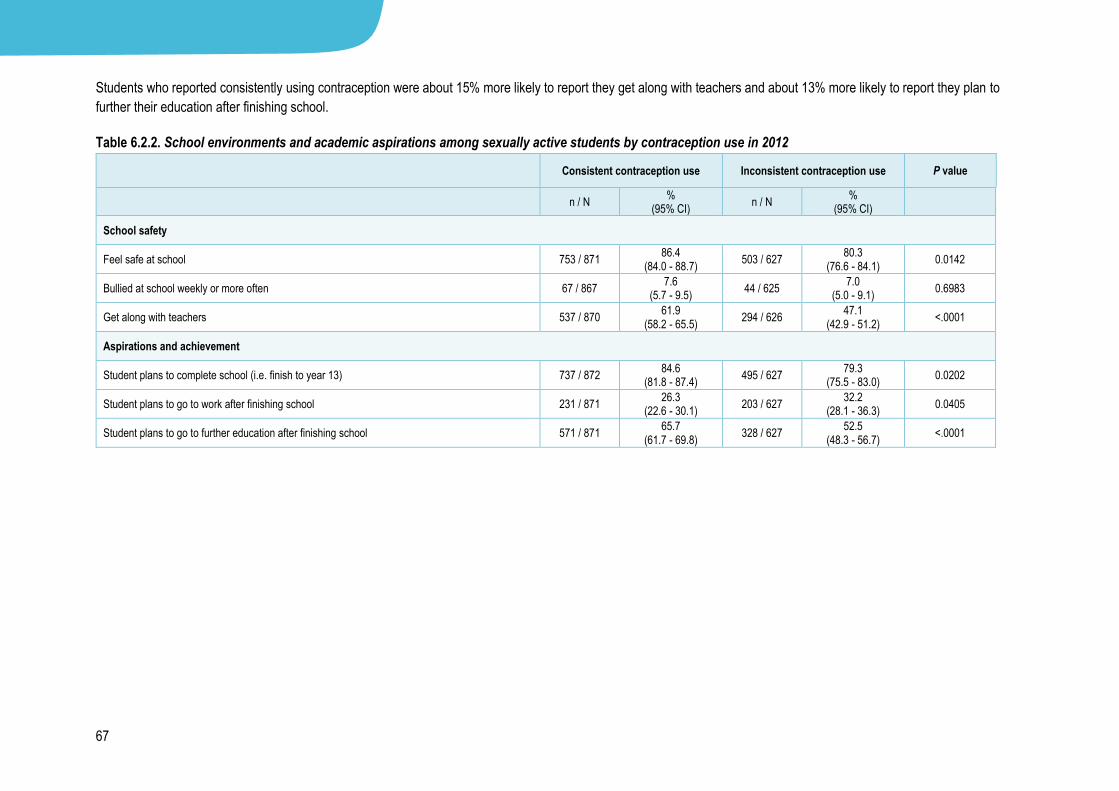
67
Students who reported consistently using contraception were about 15% more likely to report they get along with teachers and about 13% more likely to report they plan to
further their education after finishing school.
Table 6.2.2. School environments and academic aspirations among sexually active students by contraception use in 2012
Consistent contraception use Inconsistent contraception use P value
n / N
% (95% CI)
n / N %
(95% CI)
School safety
Feel safe at school 753 / 871 86.4
(84.0 - 88.7) 503 / 627
80.3 (76.6 - 84.1)
0.0142
Bullied at school weekly or more often 67 / 867 7.6
(5.7 - 9.5) 44 / 625
7.0 (5.0 - 9.1)
0.6983
Get along with teachers 537 / 870 61.9
(58.2 - 65.5) 294 / 626
47.1 (42.9 - 51.2)
<.0001
Aspirations and achievement
Student plans to complete school (i.e. finish to year 13) 737 / 872 84.6
(81.8 - 87.4) 495 / 627
79.3 (75.5 - 83.0)
0.0202
Student plans to go to work after finishing school 231 / 871 26.3
(22.6 - 30.1) 203 / 627
32.2 (28.1 - 36.3)
0.0405
Student plans to go to further education after finishing school 571 / 871 65.7
(61.7 - 69.8) 328 / 627
52.5 (48.3 - 56.7)
<.0001
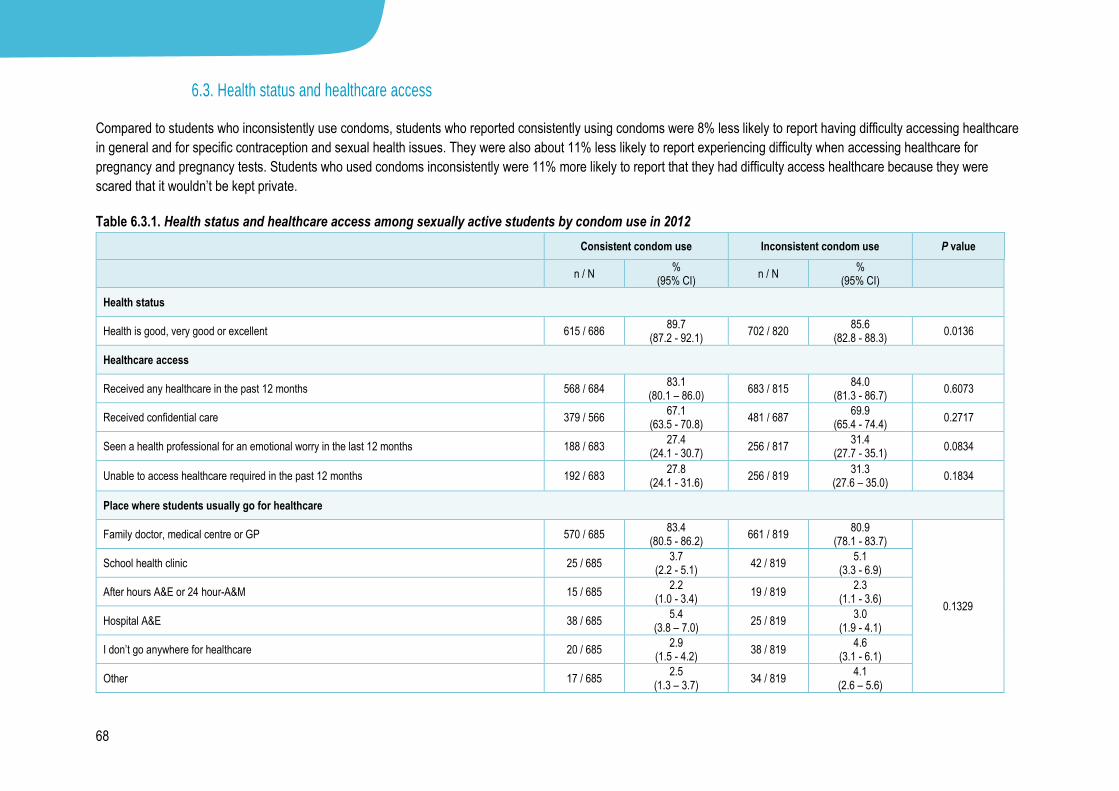
68
6.3. Health status and healthcare access
Compared to students who inconsistently use condoms, students who reported consistently using condoms were 8% less likely to report having difficulty accessing healthcare
in general and for specific contraception and sexual health issues. They were also about 11% less likely to report experiencing difficulty when accessing healthcare for
pregnancy and pregnancy tests. Students who used condoms inconsistently were 11% more likely to report that they had difficulty access healthcare because they were
scared that it wouldn’t be kept private.
Table 6.3.1. Health status and healthcare access among sexually active students by condom use in 2012
Consistent condom use Inconsistent condom use P value
n / N
% (95% CI)
n / N %
(95% CI)
Health status
Health is good, very good or excellent 615 / 686 89.7
(87.2 - 92.1) 702 / 820
85.6 (82.8 - 88.3)
0.0136
Healthcare access
Received any healthcare in the past 12 months 568 / 684 83.1
(80.1 – 86.0) 683 / 815
84.0 (81.3 - 86.7)
0.6073
Received confidential care 379 / 566 67.1
(63.5 - 70.8) 481 / 687
69.9 (65.4 - 74.4)
0.2717
Seen a health professional for an emotional worry in the last 12 months 188 / 683 27.4
(24.1 - 30.7) 256 / 817
31.4 (27.7 - 35.1)
0.0834
Unable to access healthcare required in the past 12 months 192 / 683 27.8
(24.1 - 31.6) 256 / 819
31.3 (27.6 – 35.0)
0.1834
Place where students usually go for healthcare
Family doctor, medical centre or GP 570 / 685 83.4
(80.5 - 86.2) 661 / 819
80.9 (78.1 - 83.7)
0.1329
School health clinic 25 / 685 3.7
(2.2 - 5.1) 42 / 819
5.1 (3.3 - 6.9)
After hours A&E or 24 hour-A&M 15 / 685 2.2
(1.0 - 3.4) 19 / 819
2.3 (1.1 - 3.6)
Hospital A&E 38 / 685 5.4
(3.8 – 7.0) 25 / 819
3.0 (1.9 - 4.1)
I don’t go anywhere for healthcare 20 / 685 2.9
(1.5 - 4.2) 38 / 819
4.6 (3.1 - 6.1)
Other 17 / 685 2.5
(1.3 – 3.7) 34 / 819
4.1 (2.6 – 5.6)

69
Type of health issue that student had difficulty getting help for
An injury 90 / 650 13.9
(11.1 - 16.7) 112 / 784
14.3 (11.4 - 17.3)
0.8076
Help with stopping smoking 30 / 650 4.6
(3.1 - 6.2) 54 / 784
6.9 (5.0 - 8.8)
0.0883
Help with drug or alcohol use 30 / 650 4.6
(3.0 - 6.1) 46 / 784
5.9 (4.3 - 7.4)
0.2255
A long-term health condition 13 / 650 2.0
(0.8 - 3.2) 27 / 784
3.5 (1.9 – 5.0)
0.1322
A condition that does not last long (e.g. a cold) 51 / 650 7.9
(5.9 - 9.8) 60 / 784
7.7 (5.6 - 9.7)
0.8784
Contraception/sexual health 66 / 650 10.2
(8.0 - 12.5) 142 / 784
18.1 (15.0 - 21.2)
<.0001
An emotional worry 90 / 650 13.8
(11.0 - 16.6) 152 / 784
19.3 (16.5 - 22.1)
0.0069
Pregnancy or pregnancy test 31 / 650 4.8
(3.1 - 6.4) 123 / 784
15.6 (12.7 - 18.6)
<.0001
Something else 37 / 650 5.5
(3.6 - 7.4) 66 / 784
8.4 (6.1 - 10.6)
0.0442
Reasons for being unable to access healthcare services
Have had difficulty accessing healthcare 272 / 650 41.7
(38.0 - 45.4) 392 / 784
49.9 (46.0 - 53.9)
0.0019
I didn’t know how to 30 / 190 15.8
(10.0 - 21.6) 67 / 252
26.5 (21.0 - 31.9)
0.0100
No transport 46 / 190 23.9
(18.5 - 29.3) 86 / 252
33.8 (27.1 - 40.5)
0.0328
Couldn’t get an appointment 39 / 190 20.3
(14.1 - 26.4) 51 / 252
20.2 (15.1 - 25.4)
0.9899
I couldn’t get in touch with a health professional or person I usually see 23 / 190 12.0
(7.7 - 16.2) 38 / 252
15.1 (10.7 - 19.4)
0.3449
I didn’t want to make a fuss 88 / 190 46.2
(39.1 - 53.3) 102 / 252
40.3 (34.3 - 46.4)
0.2128
I couldn’t be bothered 54 / 190 28.2
(20.9 - 35.5) 79 / 252
31.6 (25.3 - 37.9)
0.5162
I didn’t feel comfortable with the person 29 / 190 15.3
(10.4 - 20.3) 42 / 252
16.7 (11.6 - 21.9)
0.6882
The staff were unfriendly 10 / 190 5.2
(2.2 - 8.3) 8 / 252
3.1 (0.8 - 5.5)
0.3017
I was too scared 45 / 190 24.1
(17.9 - 30.3) 87 / 252
34.2 (27.6 - 40.9)
0.0191
I was too embarrassed 59 / 190 31.1
(24.4 - 37.7) 93 / 252
36.8 (30.2 - 43.4)
0.1931

70
I was hoping the problem would go away or get better with time 88 / 190 46.6
(40.7 - 52.5) 123 / 252
48.5 (42.6 - 54.3)
0.6169
I was worried it wouldn’t be kept private 27 / 190 14.4
(10.0 - 18.7) 64 / 252
25.1 (18.7 - 31.6)
0.0065
I had no one to go with 40 / 190 21.1
(15.3 - 26.8) 56 / 252
21.9 (16.1 - 27.6)
0.8501
It cost too much 61 / 190 31.7
(24.7 - 38.7) 76 / 252
30.1 (24.5 - 35.8)
0.7115
Other reason 21 / 190 11.0
(6.4 - 15.6) 28 / 252
10.9 (7.3 - 14.6)
0.9912
1 For the question Place where students usually go for healthcare’, students could only choose one response option so the p-value has been done to measure for significant difference between all of the options
Students who used contraception consistently were 9% less likely to report they were unable to access the healthcare they required within the last 12 months or they had seen
a healthcare professional for an emotional worry within the last 12 months. They were also 7% more likely to report their family doctor or medical centre is the place they
usually go for healthcare. Students who reported using contraception inconsistently were 5% more likely to report having difficulty getting help with smoking cessation, drug
and alcohol use, contraception or sexual health, pregnancy or pregnancy tests and other health issues that were not listed. These students were more likely to report that the
reason they had difficulty getting help for their health issues was that they were embarrassed, worried that it would not be kept private, or not know how to access healthcare.
Table 6.3.2. Health status and healthcare access among sexually active students by contraception use in 2012
Consistent contraception use Inconsistent contraception use P value
n / N
% (95% CI)
n / N %
(95% CI)
Health status
Health is good, very good or excellent 791 / 872 90.7
(88.4 - 93.1) 523 / 624
83.7 (80.3 - 87.1)
0.001
Healthcare access
Received any healthcare in the past 12 months 742 / 867 85.7
(82.9 - 88.4) 501 / 622
80.6 (77.3 - 84.0)
0.0304
Received confidential care 530 / 744 71.4
(68.1 - 74.7) 325 / 501
64.7 (59.4 - 69.9)
0.0121
Seen a health professional for an emotional worry in the last 12 months 222 / 869 25.5
(22.2 - 28.8) 215 / 621
34.6 (30.6 - 38.6)
0.0003
Unable to access healthcare when required in the past 12 months 224 / 870 25.6
(22.3 - 28.9) 215 / 621
34.5 (30.4 - 38.5)
0.0007
Place where students usually go for healthcare
Family doctor, medical centre or GP 739 / 870 85.0
(82.8 - 87.3) 488 / 624
78.5 (75.1 - 81.9)
0.0011
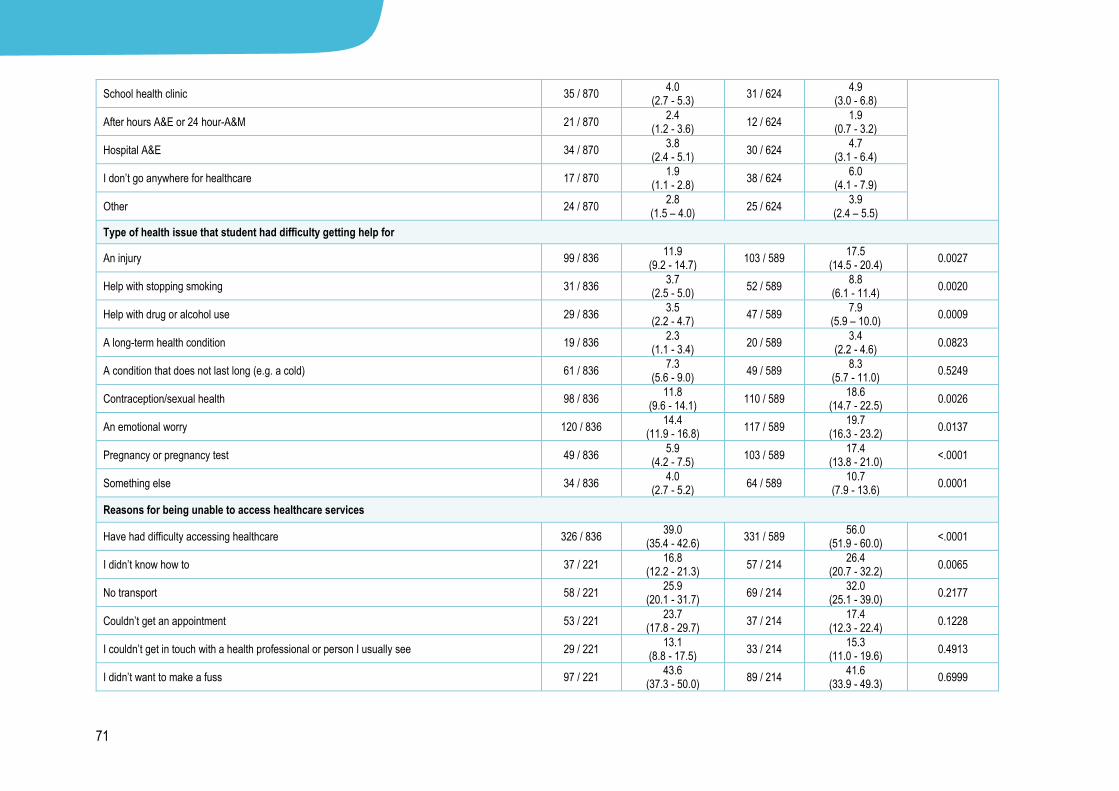
71
School health clinic 35 / 870 4.0
(2.7 - 5.3) 31 / 624
4.9 (3.0 - 6.8)
After hours A&E or 24 hour-A&M 21 / 870 2.4
(1.2 - 3.6) 12 / 624
1.9 (0.7 - 3.2)
Hospital A&E 34 / 870 3.8
(2.4 - 5.1) 30 / 624
4.7 (3.1 - 6.4)
I don’t go anywhere for healthcare 17 / 870 1.9
(1.1 - 2.8) 38 / 624
6.0 (4.1 - 7.9)
Other 24 / 870 2.8
(1.5 – 4.0) 25 / 624
3.9 (2.4 – 5.5)
Type of health issue that student had difficulty getting help for
An injury 99 / 836 11.9
(9.2 - 14.7) 103 / 589
17.5 (14.5 - 20.4)
0.0027
Help with stopping smoking 31 / 836 3.7
(2.5 - 5.0) 52 / 589
8.8 (6.1 - 11.4)
0.0020
Help with drug or alcohol use 29 / 836 3.5
(2.2 - 4.7) 47 / 589
7.9 (5.9 – 10.0)
0.0009
A long-term health condition 19 / 836 2.3
(1.1 - 3.4) 20 / 589
3.4 (2.2 - 4.6)
0.0823
A condition that does not last long (e.g. a cold) 61 / 836 7.3
(5.6 - 9.0) 49 / 589
8.3 (5.7 - 11.0)
0.5249
Contraception/sexual health 98 / 836 11.8
(9.6 - 14.1) 110 / 589
18.6 (14.7 - 22.5)
0.0026
An emotional worry 120 / 836 14.4
(11.9 - 16.8) 117 / 589
19.7 (16.3 - 23.2)
0.0137
Pregnancy or pregnancy test 49 / 836 5.9
(4.2 - 7.5) 103 / 589
17.4 (13.8 - 21.0)
<.0001
Something else 34 / 836 4.0
(2.7 - 5.2) 64 / 589
10.7 (7.9 - 13.6)
0.0001
Reasons for being unable to access healthcare services
Have had difficulty accessing healthcare 326 / 836 39.0
(35.4 - 42.6) 331 / 589
56.0 (51.9 - 60.0)
<.0001
I didn’t know how to 37 / 221 16.8
(12.2 - 21.3) 57 / 214
26.4 (20.7 - 32.2)
0.0065
No transport 58 / 221 25.9
(20.1 - 31.7) 69 / 214
32.0 (25.1 - 39.0)
0.2177
Couldn’t get an appointment 53 / 221 23.7
(17.8 - 29.7) 37 / 214
17.4 (12.3 - 22.4)
0.1228
I couldn’t get in touch with a health professional or person I usually see 29 / 221 13.1
(8.8 - 17.5) 33 / 214
15.3 (11.0 - 19.6)
0.4913
I didn’t want to make a fuss 97 / 221 43.6
(37.3 - 50.0) 89 / 214
41.6 (33.9 - 49.3)
0.6999

72
I couldn’t be bothered 60 / 221 27.1
(21.2 - 32.9) 69 / 214
32.5 (25.2 - 39.8)
0.2659
I didn’t feel comfortable with the person 39 / 221 17.7
(12.8 - 22.5) 34 / 214
16.0 (11.0 - 21.1)
0.5815
The staff were unfriendly 11 / 221 4.9
(2.0 - 7.9) 8 / 214
3.7 (1.4 - 6.0)
0.5022
I was too scared 62 / 221 28.3
(21.0 - 35.7) 71 / 214
33.0 (26.3 - 39.6)
0.3476
I was too embarrassed 66 / 221 29.8
(23.5 - 36.0) 85 / 214
39.8 (33.3 - 46.4)
0.0155
I was hoping the problem would go away or get better with time 105 / 221 47.6
(41.3 - 53.9) 102 / 214
47.5 (40.3 - 54.6)
0.9867
I was worried it wouldn’t be kept private 33 / 221 15.0
(10.4 - 19.6) 56 / 214
26.0 (19.8 - 32.1)
0.0031
I had no one to go with 41 / 221 18.5
(13.6 - 23.4) 52 / 214
24.0 (18.4 - 29.6)
0.1230
1 For the question Place where students usually go for healthcare, students could only choose one response option so the p-value has been done to measure for significant difference between all of the options
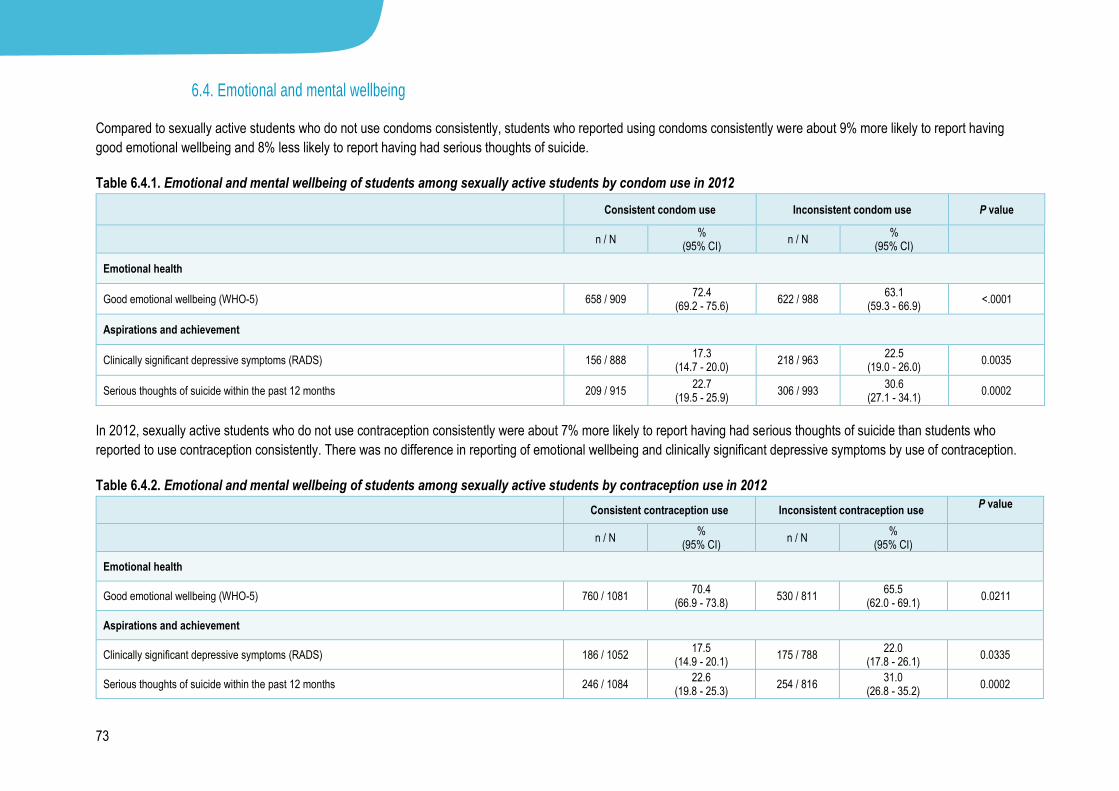
73
6.4. Emotional and mental wellbeing
Compared to sexually active students who do not use condoms consistently, students who reported using condoms consistently were about 9% more likely to report having
good emotional wellbeing and 8% less likely to report having had serious thoughts of suicide.
Table 6.4.1. Emotional and mental wellbeing of students among sexually active students by condom use in 2012
Consistent condom use Inconsistent condom use P value
n / N %
(95% CI) n / N
% (95% CI)
Emotional health
Good emotional wellbeing (WHO-5) 658 / 909 72.4
(69.2 - 75.6) 622 / 988
63.1 (59.3 - 66.9)
<.0001
Aspirations and achievement
Clinically significant depressive symptoms (RADS) 156 / 888 17.3
(14.7 - 20.0) 218 / 963
22.5 (19.0 - 26.0)
0.0035
Serious thoughts of suicide within the past 12 months 209 / 915 22.7
(19.5 - 25.9) 306 / 993
30.6 (27.1 - 34.1)
0.0002
In 2012, sexually active students who do not use contraception consistently were about 7% more likely to report having had serious thoughts of suicide than students who
reported to use contraception consistently. There was no difference in reporting of emotional wellbeing and clinically significant depressive symptoms by use of contraception.
Table 6.4.2. Emotional and mental wellbeing of students among sexually active students by contraception use in 2012
Consistent contraception use Inconsistent contraception use
P value
n / N
% (95% CI)
n / N %
(95% CI)
Emotional health
Good emotional wellbeing (WHO-5) 760 / 1081 70.4
(66.9 - 73.8) 530 / 811
65.5 (62.0 - 69.1)
0.0211
Aspirations and achievement
Clinically significant depressive symptoms (RADS) 186 / 1052 17.5
(14.9 - 20.1) 175 / 788
22.0 (17.8 - 26.1)
0.0335
Serious thoughts of suicide within the past 12 months 246 / 1084 22.6
(19.8 - 25.3) 254 / 816
31.0 (26.8 - 35.2)
0.0002
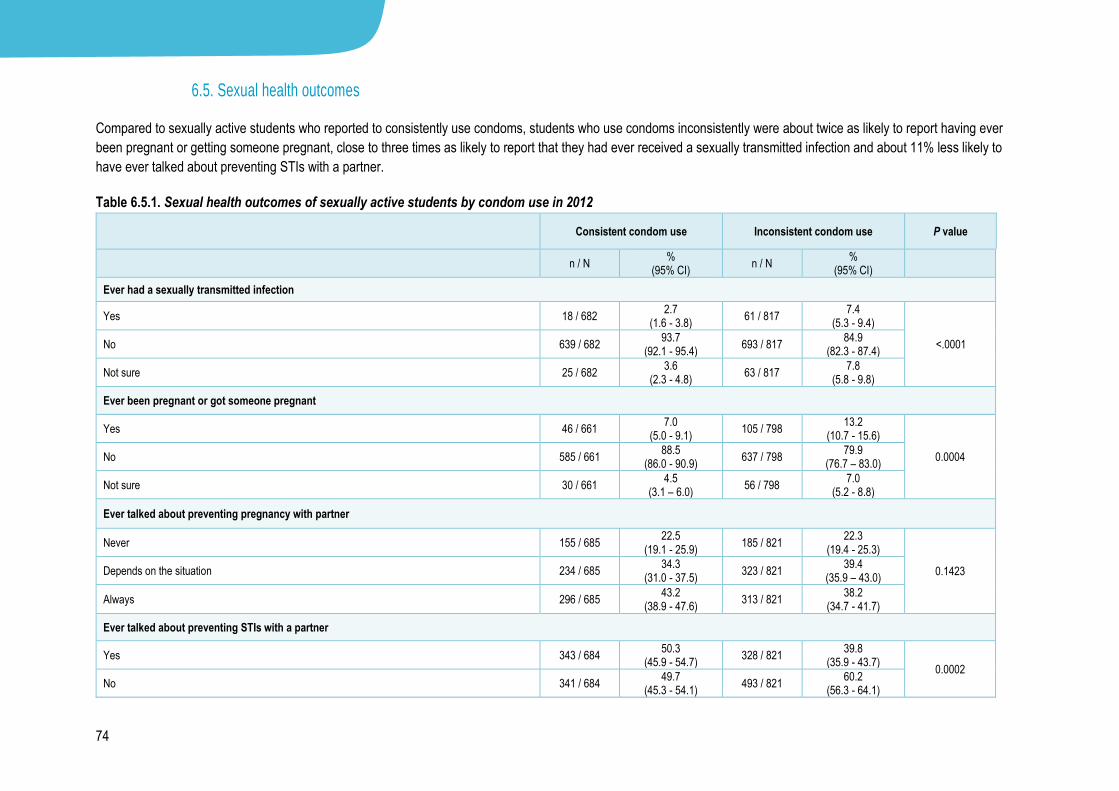
74
6.5. Sexual health outcomes
Compared to sexually active students who reported to consistently use condoms, students who use condoms inconsistently were about twice as likely to report having ever
been pregnant or getting someone pregnant, close to three times as likely to report that they had ever received a sexually transmitted infection and about 11% less likely to
have ever talked about preventing STIs with a partner.
Table 6.5.1. Sexual health outcomes of sexually active students by condom use in 2012
Consistent condom use Inconsistent condom use P value
n / N
% (95% CI)
n / N %
(95% CI)
Ever had a sexually transmitted infection
Yes 18 / 682 2.7
(1.6 - 3.8) 61 / 817
7.4 (5.3 - 9.4)
<.0001 No 639 / 682 93.7
(92.1 - 95.4) 693 / 817
84.9 (82.3 - 87.4)
Not sure 25 / 682 3.6
(2.3 - 4.8) 63 / 817
7.8 (5.8 - 9.8)
Ever been pregnant or got someone pregnant
Yes 46 / 661 7.0
(5.0 - 9.1) 105 / 798
13.2 (10.7 - 15.6)
0.0004 No 585 / 661 88.5
(86.0 - 90.9) 637 / 798
79.9 (76.7 – 83.0)
Not sure 30 / 661 4.5
(3.1 – 6.0) 56 / 798
7.0 (5.2 - 8.8)
Ever talked about preventing pregnancy with partner
Never 155 / 685 22.5
(19.1 - 25.9) 185 / 821
22.3 (19.4 - 25.3)
0.1423 Depends on the situation 234 / 685 34.3
(31.0 - 37.5) 323 / 821
39.4 (35.9 – 43.0)
Always 296 / 685 43.2
(38.9 - 47.6) 313 / 821
38.2 (34.7 - 41.7)
Ever talked about preventing STIs with a partner
Yes 343 / 684 50.3
(45.9 - 54.7) 328 / 821
39.8 (35.9 - 43.7)
0.0002
No 341 / 684 49.7
(45.3 - 54.1) 493 / 821
60.2 (56.3 - 64.1)
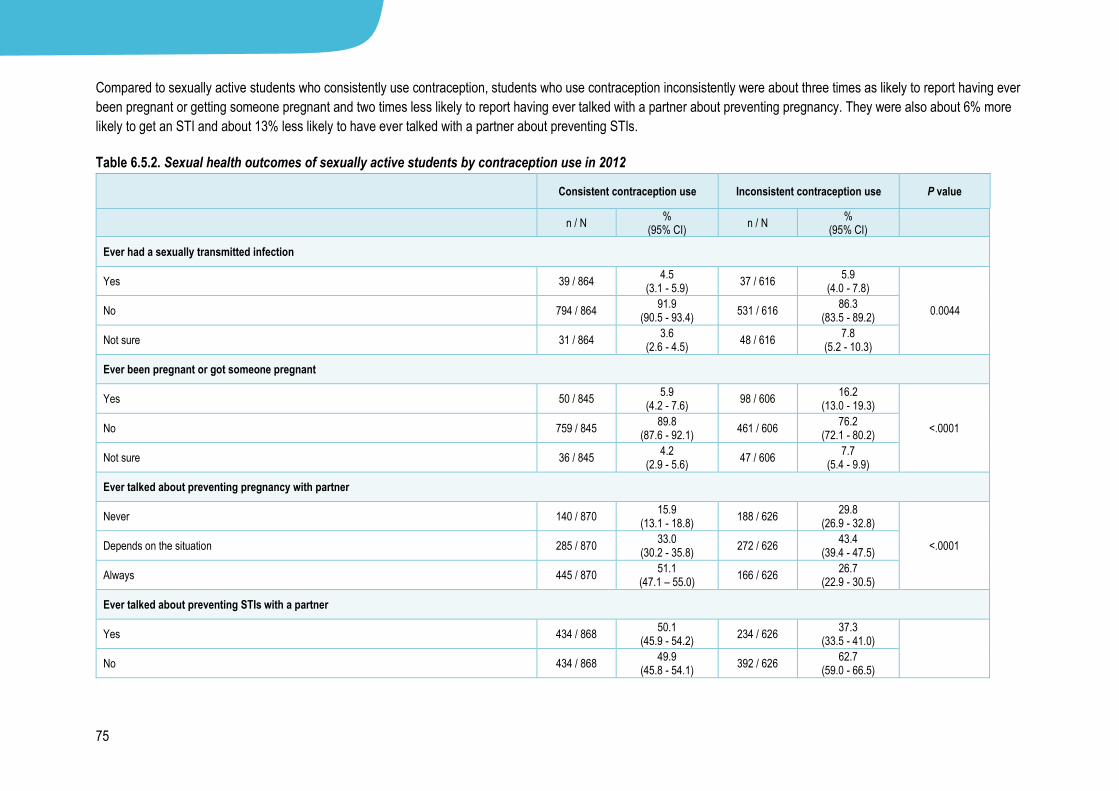
75
Compared to sexually active students who consistently use contraception, students who use contraception inconsistently were about three times as likely to report having ever
been pregnant or getting someone pregnant and two times less likely to report having ever talked with a partner about preventing pregnancy. They were also about 6% more
likely to get an STI and about 13% less likely to have ever talked with a partner about preventing STIs.
Table 6.5.2. Sexual health outcomes of sexually active students by contraception use in 2012
Consistent contraception use Inconsistent contraception use P value
n / N
% (95% CI)
n / N %
(95% CI)
Ever had a sexually transmitted infection
Yes 39 / 864 4.5
(3.1 - 5.9) 37 / 616
5.9 (4.0 - 7.8)
0.0044 No 794 / 864 91.9
(90.5 - 93.4) 531 / 616
86.3 (83.5 - 89.2)
Not sure 31 / 864 3.6
(2.6 - 4.5) 48 / 616
7.8 (5.2 - 10.3)
Ever been pregnant or got someone pregnant
Yes 50 / 845 5.9
(4.2 - 7.6) 98 / 606
16.2 (13.0 - 19.3)
<.0001 No 759 / 845 89.8
(87.6 - 92.1) 461 / 606
76.2 (72.1 - 80.2)
Not sure 36 / 845 4.2
(2.9 - 5.6) 47 / 606
7.7 (5.4 - 9.9)
Ever talked about preventing pregnancy with partner
Never 140 / 870 15.9
(13.1 - 18.8) 188 / 626
29.8 (26.9 - 32.8)
<.0001 Depends on the situation 285 / 870 33.0
(30.2 - 35.8) 272 / 626
43.4 (39.4 - 47.5)
Always 445 / 870 51.1
(47.1 – 55.0) 166 / 626
26.7 (22.9 - 30.5)
Ever talked about preventing STIs with a partner
Yes 434 / 868 50.1
(45.9 - 54.2) 234 / 626
37.3 (33.5 - 41.0)
No 434 / 868 49.9
(45.8 - 54.1) 392 / 626
62.7 (59.0 - 66.5)
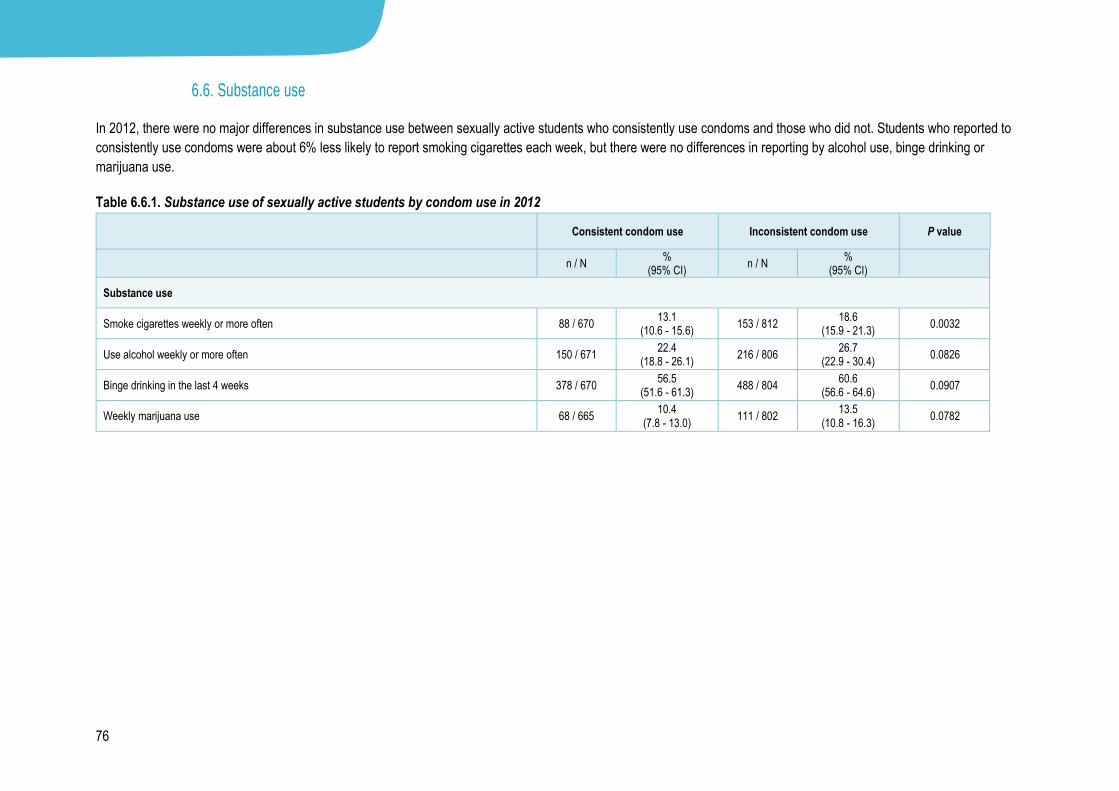
76
6.6. Substance use
In 2012, there were no major differences in substance use between sexually active students who consistently use condoms and those who did not. Students who reported to
consistently use condoms were about 6% less likely to report smoking cigarettes each week, but there were no differences in reporting by alcohol use, binge drinking or
marijuana use.
Table 6.6.1. Substance use of sexually active students by condom use in 2012
Consistent condom use Inconsistent condom use P value
n / N
% (95% CI)
n / N %
(95% CI)
Substance use
Smoke cigarettes weekly or more often 88 / 670 13.1
(10.6 - 15.6) 153 / 812
18.6 (15.9 - 21.3)
0.0032
Use alcohol weekly or more often 150 / 671 22.4
(18.8 - 26.1) 216 / 806
26.7 (22.9 - 30.4)
0.0826
Binge drinking in the last 4 weeks 378 / 670 56.5
(51.6 - 61.3) 488 / 804
60.6 (56.6 - 64.6)
0.0907
Weekly marijuana use 68 / 665 10.4
(7.8 - 13.0) 111 / 802
13.5 (10.8 - 16.3)
0.0782

77
Compared to students who consistently use contraception, students who reported inconsistently using contraception were two times as likely to report smoking cigarettes
weekly and more than two times as likely to report using marijuana at least weekly. There were no differences in reporting by alcohol use or binge drinking.
Table 6.6.2. Substance use of sexually active students who forced unwanted sexual experience on others in 2012
Consistent contraception use Inconsistent contraception use P value
n / N
% (95% CI)
n / N %
(95% CI)
Substance use
Smoke cigarettes weekly or more often 97 / 856 11.3
(9.1 - 13.4) 142 / 611
23.0 (19.3 - 26.6)
<.0001
Use alcohol weekly or more often 199 / 853 23.4
(19.8 - 26.9) 159 / 604
26.2 (22.1 - 30.3)
0.2642
Binge drinking in the last 4 weeks 486 / 853 57.0
(52.2 - 61.8) 376 / 601
62.5 (57.9 - 67.1)
0.0584
Weekly marijuana use 65 / 848 7.7
(5.6 - 9.9) 107 / 602
17.5 (14.2 - 20.7)
<.0001

78
6.7. Violence and neighbourhoods
In 2012, for the following sets of questions there was no difference between those who use condoms consistently and those who did not for experience of violence,
neighbourhood environments, caring people outside the family, employment and spirituality. The only significant difference across these variables was students who reported
to use condoms inconsistently were about one-and-a-half times as likely to report they had been touched in a sexual way or made to do unwanted sexual things compared to
students who reported to consistently use condoms.
Table 6.7.1 Violence and neighbourhoods of sexually active students by condom use in 2012
Consistent condom use Inconsistent condom use P value
n / N
% (95% CI)
n / N %
(95% CI)
Family violence
Witnessing adults hitting or physically hurting a child in the home 112 / 663 16.8
(13.8 - 19.9) 141 / 790
17.8 (15.2 - 20.4)
0.5866
Witnessing adults hitting or physically hurting another adult in the home 68 / 657 10.3
(7.3 - 13.3) 95 / 787
12.0 (9.9 - 14.1)
0.3857
Violence
Been hit or harmed on purpose one or more times in the last 12 months 253 / 684 36.8
(32.9 - 40.8) 326 / 821
39.7 (36.0 - 43.5)
0.2974
Been in a serious physical fight in the last 12 months 195 / 682 28.5
(24.5 - 32.5) 236 / 817
28.7 (25.2 - 32.2)
0.9322
Ever been touched in a sexual way or made to do unwanted sexual things 132 / 663 19.9
(16.5 - 23.4) 235 / 803
29.1 (25.1 - 33.0)
0.0017
Caring people outside of the family
Have a friend who helps and looks out for them some or all of the time 627 / 651 96.4
(95.1 - 97.7) 757 / 790
95.8 (94.5 - 97.2)
0.5398
Have an adult outside their family who they would feel okay talking to about a serious problem 442 / 647 68.5
(64.4 - 72.5) 513 / 790
65.0 (60.9 - 69.1)
0.2412
Neighbourhood
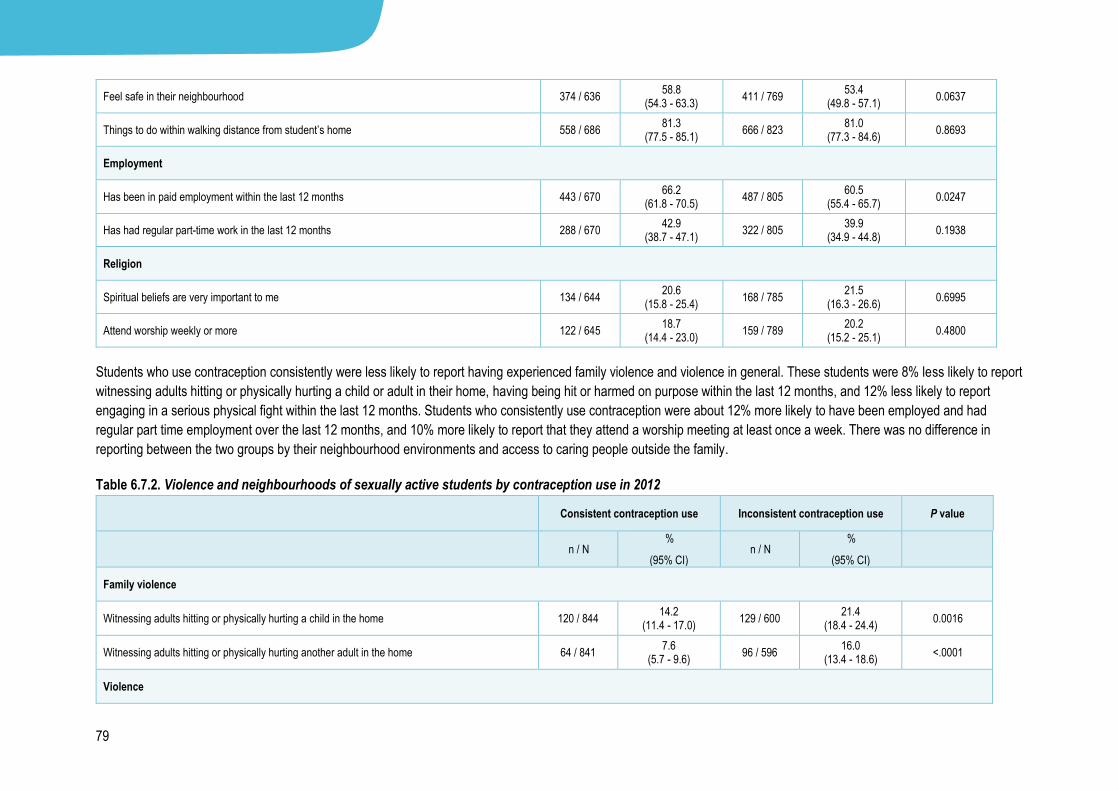
79
Feel safe in their neighbourhood 374 / 636 58.8
(54.3 - 63.3) 411 / 769
53.4 (49.8 - 57.1)
0.0637
Things to do within walking distance from student’s home 558 / 686 81.3
(77.5 - 85.1) 666 / 823
81.0 (77.3 - 84.6)
0.8693
Employment
Has been in paid employment within the last 12 months 443 / 670 66.2
(61.8 - 70.5) 487 / 805
60.5 (55.4 - 65.7)
0.0247
Has had regular part-time work in the last 12 months 288 / 670 42.9
(38.7 - 47.1) 322 / 805
39.9 (34.9 - 44.8)
0.1938
Religion
Spiritual beliefs are very important to me 134 / 644 20.6
(15.8 - 25.4) 168 / 785
21.5 (16.3 - 26.6)
0.6995
Attend worship weekly or more 122 / 645 18.7
(14.4 - 23.0) 159 / 789
20.2 (15.2 - 25.1)
0.4800
Students who use contraception consistently were less likely to report having experienced family violence and violence in general. These students were 8% less likely to report
witnessing adults hitting or physically hurting a child or adult in their home, having being hit or harmed on purpose within the last 12 months, and 12% less likely to report
engaging in a serious physical fight within the last 12 months. Students who consistently use contraception were about 12% more likely to have been employed and had
regular part time employment over the last 12 months, and 10% more likely to report that they attend a worship meeting at least once a week. There was no difference in
reporting between the two groups by their neighbourhood environments and access to caring people outside the family.
Table 6.7.2. Violence and neighbourhoods of sexually active students by contraception use in 2012
Consistent contraception use Inconsistent contraception use P value
n / N
%
(95% CI) n / N
%
(95% CI)
Family violence
Witnessing adults hitting or physically hurting a child in the home 120 / 844 14.2
(11.4 - 17.0) 129 / 600
21.4 (18.4 - 24.4)
0.0016
Witnessing adults hitting or physically hurting another adult in the home 64 / 841 7.6
(5.7 - 9.6) 96 / 596
16.0 (13.4 - 18.6)
<.0001
Violence
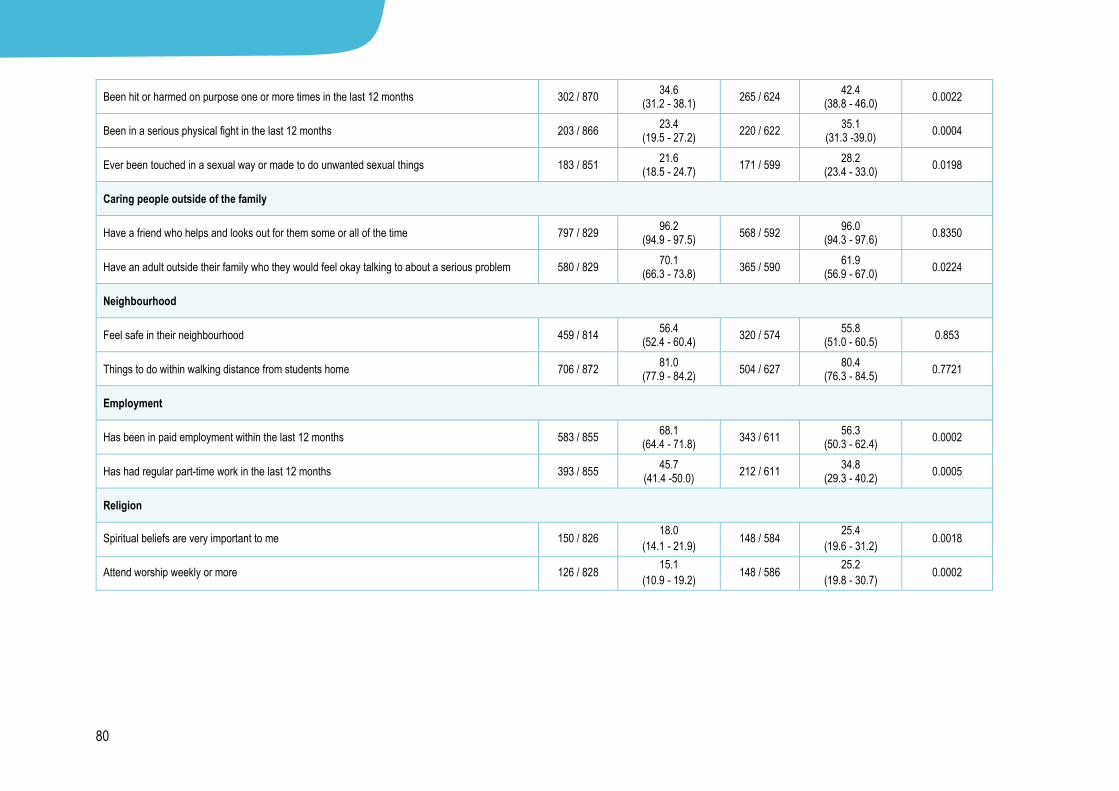
80
Been hit or harmed on purpose one or more times in the last 12 months 302 / 870 34.6
(31.2 - 38.1) 265 / 624
42.4 (38.8 - 46.0)
0.0022
Been in a serious physical fight in the last 12 months 203 / 866 23.4
(19.5 - 27.2) 220 / 622
35.1 (31.3 -39.0)
0.0004
Ever been touched in a sexual way or made to do unwanted sexual things 183 / 851 21.6
(18.5 - 24.7) 171 / 599
28.2 (23.4 - 33.0)
0.0198
Caring people outside of the family
Have a friend who helps and looks out for them some or all of the time 797 / 829 96.2
(94.9 - 97.5) 568 / 592
96.0 (94.3 - 97.6)
0.8350
Have an adult outside their family who they would feel okay talking to about a serious problem 580 / 829 70.1
(66.3 - 73.8) 365 / 590
61.9 (56.9 - 67.0)
0.0224
Neighbourhood
Feel safe in their neighbourhood 459 / 814 56.4
(52.4 - 60.4) 320 / 574
55.8 (51.0 - 60.5)
0.853
Things to do within walking distance from students home 706 / 872 81.0
(77.9 - 84.2) 504 / 627
80.4 (76.3 - 84.5)
0.7721
Employment
Has been in paid employment within the last 12 months 583 / 855 68.1
(64.4 - 71.8) 343 / 611
56.3 (50.3 - 62.4)
0.0002
Has had regular part-time work in the last 12 months 393 / 855 45.7
(41.4 -50.0) 212 / 611
34.8 (29.3 - 40.2)
0.0005
Religion
Spiritual beliefs are very important to me 150 / 826 18.0
(14.1 - 21.9) 148 / 584
25.4
(19.6 - 31.2) 0.0018
Attend worship weekly or more 126 / 828 15.1
(10.9 - 19.2) 148 / 586
25.2
(19.8 - 30.7) 0.0002
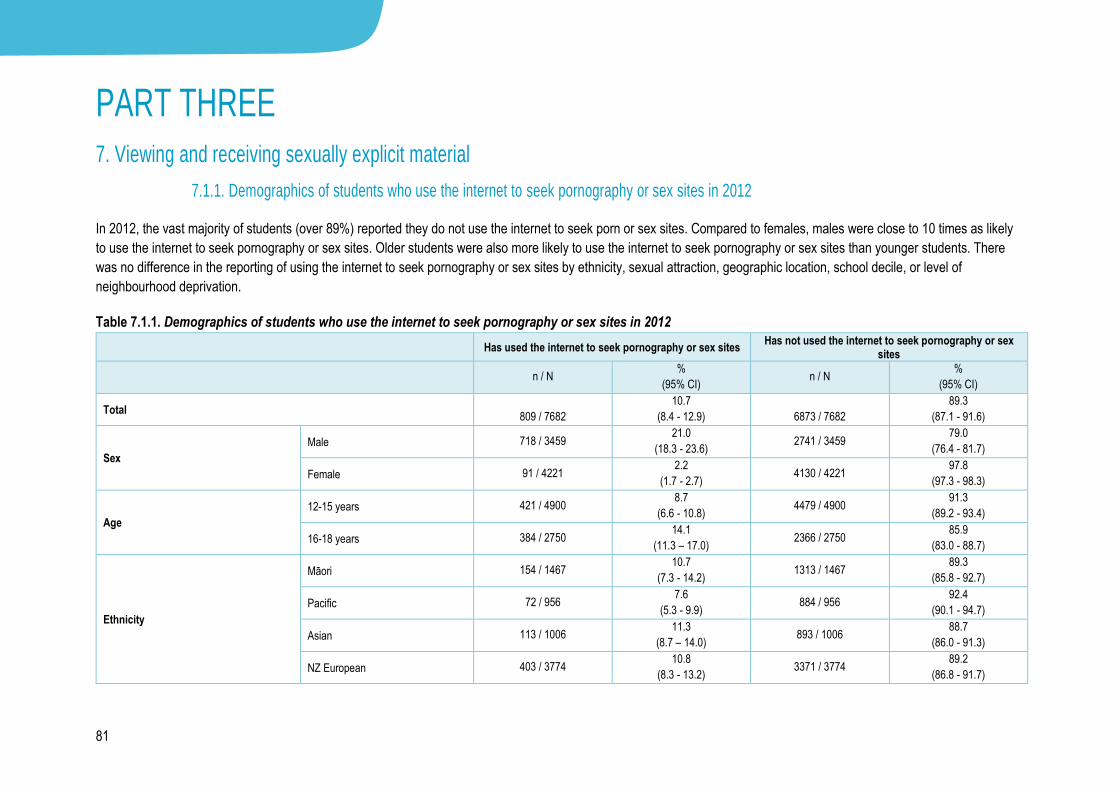
81
PART THREE 7. Viewing and receiving sexually explicit material
7.1.1. Demographics of students who use the internet to seek pornography or sex sites in 2012
In 2012, the vast majority of students (over 89%) reported they do not use the internet to seek porn or sex sites. Compared to females, males were close to 10 times as likely
to use the internet to seek pornography or sex sites. Older students were also more likely to use the internet to seek pornography or sex sites than younger students. There
was no difference in the reporting of using the internet to seek pornography or sex sites by ethnicity, sexual attraction, geographic location, school decile, or level of
neighbourhood deprivation.
Table 7.1.1. Demographics of students who use the internet to seek pornography or sex sites in 2012
Has used the internet to seek pornography or sex sites Has not used the internet to seek pornography or sex
sites
n / N %
(95% CI) n / N
%
(95% CI)
Total 809 / 7682
10.7
(8.4 - 12.9) 6873 / 7682
89.3
(87.1 - 91.6)
Sex
Male 718 / 3459 21.0
(18.3 - 23.6) 2741 / 3459
79.0
(76.4 - 81.7)
Female 91 / 4221 2.2
(1.7 - 2.7) 4130 / 4221
97.8
(97.3 - 98.3)
Age
12-15 years 421 / 4900 8.7
(6.6 - 10.8) 4479 / 4900
91.3
(89.2 - 93.4)
16-18 years 384 / 2750 14.1
(11.3 – 17.0) 2366 / 2750
85.9
(83.0 - 88.7)
Ethnicity
Māori 154 / 1467 10.7
(7.3 - 14.2) 1313 / 1467
89.3
(85.8 - 92.7)
Pacific 72 / 956 7.6
(5.3 - 9.9) 884 / 956
92.4
(90.1 - 94.7)
Asian 113 / 1006 11.3
(8.7 – 14.0) 893 / 1006
88.7
(86.0 - 91.3)
NZ European 403 / 3774 10.8
(8.3 - 13.2) 3371 / 3774
89.2
(86.8 - 91.7)

82
Other 64 / 470 13.8
(10.0 - 17.6) 406 / 470
86.2
(82.4 – 90.0)
Sexual attraction
Attracted to opposite sex 717 / 6845 10.6
(8.3 – 13.0) 6128 / 6845
89.4
(87.0 - 91.7)
Attracted to same or both sexes 76 / 429 17.7
(13.7 - 21.7) 353 / 429
82.3
(78.3 - 86.3)
Urban/rural
Urban 682 / 6476 10.6
(8.4 - 12.9) 5794 / 6476
89.4
(87.1 - 91.6)
Rural 116 / 1124 10.7
(7.2 - 14.2) 1008 / 1124
89.3
(85.8 - 92.8)
School decile
Low 106 / 1442 7.4
(3.9 - 10.8) 1336 / 1442
92.6
(89.2 - 96.1)
Medium 323 / 2987 11.1
(8.1 - 14.1) 2664 / 2987
88.9
(85.9 - 91.9)
High 380 / 3253 11.7
(7.6 - 15.8) 2873 / 3253
88.3
(84.2 - 92.4)
Neighbourhood deprivation
Low 281 / 2581 11.0
(8.2 - 13.8) 2300 / 2581
89.0
(86.2 - 91.8)
Medium 327 / 2756 12.0
(9.4 - 14.6) 2429 / 2756
88.0
(85.4 - 90.6)
High 190 / 2263 8.5
(6.4 - 10.6) 2073 / 2263
91.5
(89.4 - 93.6)
1 This table and section 7.1 refers to answers from the question What do you do on the internet (you can choose as many as apply to you)? Students’ responses were included in this table and section 7.1 if as one
of their responses they selected Seek pornography or sex sites.
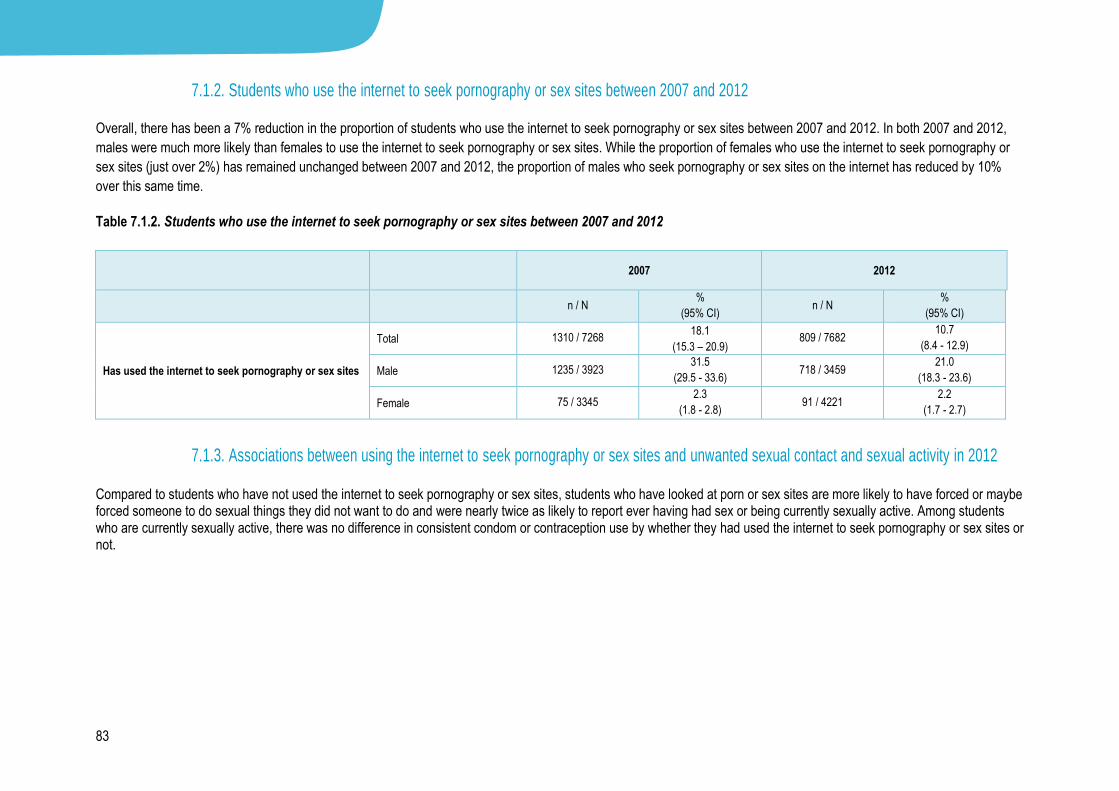
83
7.1.2. Students who use the internet to seek pornography or sex sites between 2007 and 2012
Overall, there has been a 7% reduction in the proportion of students who use the internet to seek pornography or sex sites between 2007 and 2012. In both 2007 and 2012,
males were much more likely than females to use the internet to seek pornography or sex sites. While the proportion of females who use the internet to seek pornography or
sex sites (just over 2%) has remained unchanged between 2007 and 2012, the proportion of males who seek pornography or sex sites on the internet has reduced by 10%
over this same time.
Table 7.1.2. Students who use the internet to seek pornography or sex sites between 2007 and 2012
7.1.3. Associations between using the internet to seek pornography or sex sites and unwanted sexual contact and sexual activity in 2012 Compared to students who have not used the internet to seek pornography or sex sites, students who have looked at porn or sex sites are more likely to have forced or maybe forced someone to do sexual things they did not want to do and were nearly twice as likely to report ever having had sex or being currently sexually active. Among students who are currently sexually active, there was no difference in consistent condom or contraception use by whether they had used the internet to seek pornography or sex sites or not.
2007 2012
n / N %
(95% CI) n / N
%
(95% CI)
Has used the internet to seek pornography or sex sites
Total 1310 / 7268 18.1
(15.3 – 20.9) 809 / 7682
10.7
(8.4 - 12.9)
Male 1235 / 3923 31.5
(29.5 - 33.6) 718 / 3459
21.0
(18.3 - 23.6)
Female 75 / 3345 2.3
(1.8 - 2.8) 91 / 4221
2.2
(1.7 - 2.7)
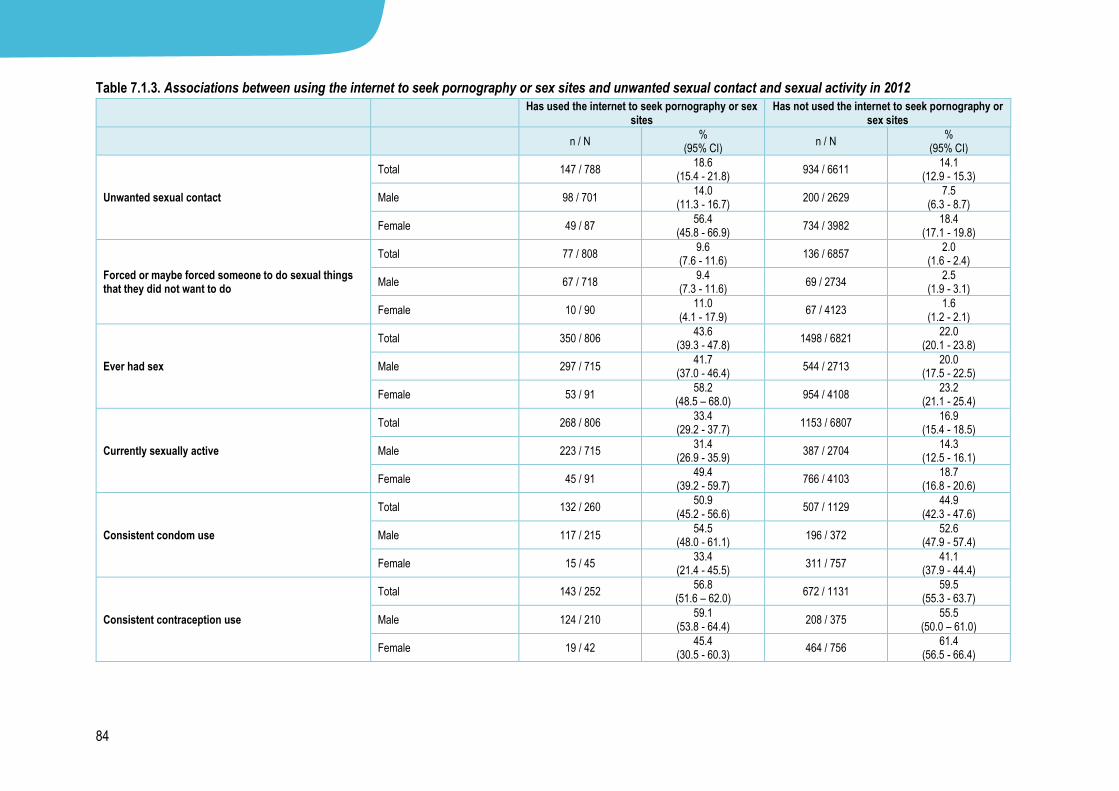
84
Table 7.1.3. Associations between using the internet to seek pornography or sex sites and unwanted sexual contact and sexual activity in 2012
Has used the internet to seek pornography or sex
sites Has not used the internet to seek pornography or
sex sites
n / N %
(95% CI) n / N
% (95% CI)
Unwanted sexual contact
Total 147 / 788 18.6
(15.4 - 21.8) 934 / 6611
14.1 (12.9 - 15.3)
Male 98 / 701 14.0
(11.3 - 16.7) 200 / 2629
7.5 (6.3 - 8.7)
Female 49 / 87 56.4
(45.8 - 66.9) 734 / 3982
18.4 (17.1 - 19.8)
Forced or maybe forced someone to do sexual things that they did not want to do
Total 77 / 808 9.6
(7.6 - 11.6) 136 / 6857
2.0 (1.6 - 2.4)
Male 67 / 718 9.4
(7.3 - 11.6) 69 / 2734
2.5 (1.9 - 3.1)
Female 10 / 90 11.0
(4.1 - 17.9) 67 / 4123
1.6 (1.2 - 2.1)
Ever had sex
Total 350 / 806 43.6
(39.3 - 47.8) 1498 / 6821
22.0 (20.1 - 23.8)
Male 297 / 715 41.7
(37.0 - 46.4) 544 / 2713
20.0 (17.5 - 22.5)
Female 53 / 91 58.2
(48.5 – 68.0) 954 / 4108
23.2 (21.1 - 25.4)
Currently sexually active
Total 268 / 806 33.4
(29.2 - 37.7) 1153 / 6807
16.9 (15.4 - 18.5)
Male 223 / 715 31.4
(26.9 - 35.9) 387 / 2704
14.3 (12.5 - 16.1)
Female 45 / 91 49.4
(39.2 - 59.7) 766 / 4103
18.7 (16.8 - 20.6)
Consistent condom use
Total 132 / 260 50.9
(45.2 - 56.6) 507 / 1129
44.9 (42.3 - 47.6)
Male 117 / 215 54.5
(48.0 - 61.1) 196 / 372
52.6 (47.9 - 57.4)
Female 15 / 45 33.4
(21.4 - 45.5) 311 / 757
41.1 (37.9 - 44.4)
Consistent contraception use
Total 143 / 252 56.8
(51.6 – 62.0) 672 / 1131
59.5 (55.3 - 63.7)
Male 124 / 210 59.1
(53.8 - 64.4) 208 / 375
55.5 (50.0 – 61.0)
Female 19 / 42 45.4
(30.5 - 60.3) 464 / 756
61.4 (56.5 - 66.4)

85
7.2.1. Demographics of students who were sent unwanted sexual material (including porn, pictures, videos or words) in 2012
In 2012, the vast majority of students (85%) reported they had not been sent unwanted sexual material including porn, pictures, videos or words within the last 12 months.
Māori and Pacific students were more likely than NZ European or Asian students to have been sent unwanted sexual material within the last 12 months. Students who are
attracted to the same or both sexes were nearly twice as likely to receive unwanted sexual material than those attracted to the opposite sex, and students who live in areas
characterised by deprivation were slightly more likely than those living in wealthy areas to receive unwanted sexual material. There was no difference in receiving unwanted
sexual material by sex, age, geographic location or school decile.
Table 7.2.1.1. Demographics of students who were sent unwanted sexual material within the last 12 months in 2012
Has been sent unwanted sexual material Has not been sent unwanted sexual material in last 12
months
n / N %
(95% CI) n / N
% (95% CI)
Total 1176 / 8093 14.6
(13.6 - 15.5) 6917 / 8093
85.4 (84.5 - 86.4)
Sex
Male 501 / 3617 13.9
(12.5 - 15.4) 3116 / 3617
86.1 (84.6 - 87.5)
Female 675 / 4474 15.1
(13.9 - 16.3) 3799 / 4474
84.9 (83.7 - 86.1)
Age
12-15 years 772 / 5180 14.9
(13.7 - 16.2) 4408 / 5180
85.1 (83.8 - 86.3)
16-18 years 398 / 2880 13.9
(12.8 - 14.9) 2482 / 2880
86.1 (85.1 - 87.2)
Ethnicity
Māori 277 / 1593 17.5
(15.2 - 19.7) 1316 / 1593
82.5 (80.3 - 84.8)
Pacific 210 / 1122 18.7
(16.5 - 20.9) 912 / 1122
81.3 (79.1 - 83.5)
Asian 131 / 1014 12.9
(10.6 - 15.1) 883 / 1014
87.1 (84.9 - 89.4)
NZ European 470 / 3873 12.2
(11.0 - 13.4) 3403 / 3873
87.8 (86.6 – 89.0)
Other 86 / 484 17.7
(14.1 - 21.4) 398 / 484
82.3 (78.6 - 85.9)
Sexual attraction
Attracted to opposite sex 969 / 7064 13.8
(12.7 - 14.8) 6095 / 7064
86.2 (85.2 - 87.3)
Attracted to same or both sexes 122 / 468 26.0
(22.2 - 29.9) 346 / 468
74.0 (70.1 - 77.8)
Urban/rural Urban 990 / 6780 14.6
(13.6 - 15.6) 5790 / 6780
85.4 (84.4 - 86.4)
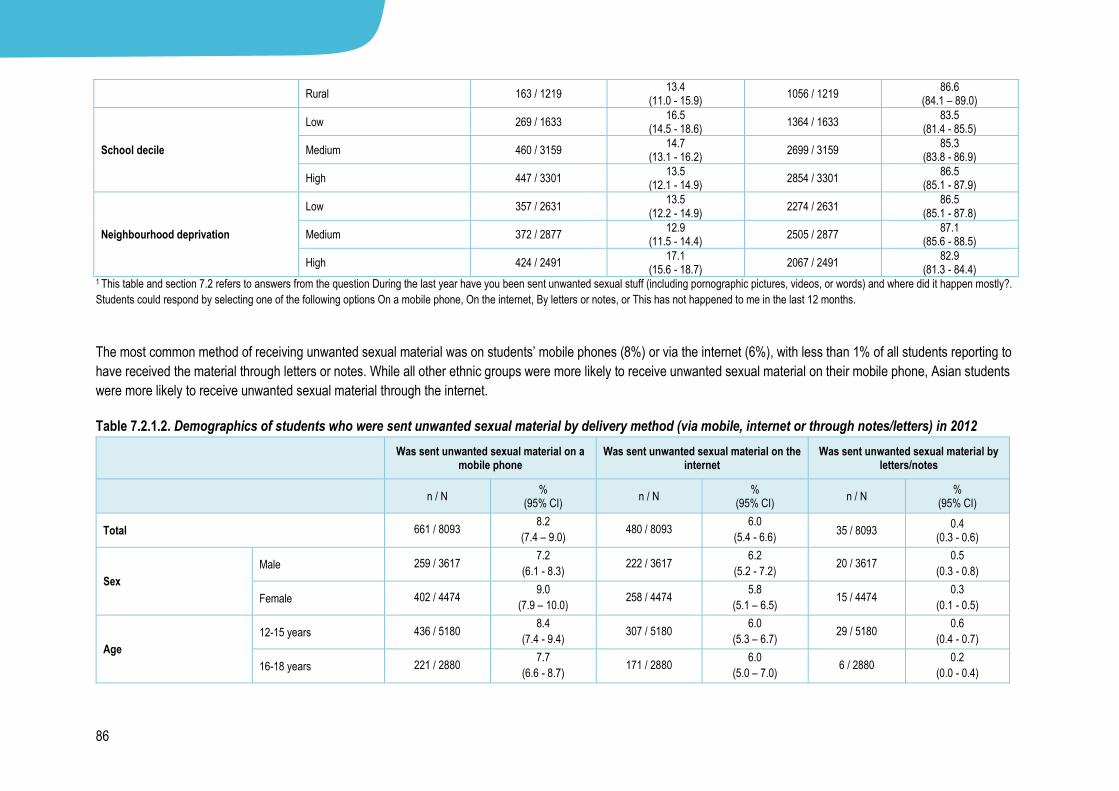
86
Rural 163 / 1219 13.4
(11.0 - 15.9) 1056 / 1219
86.6 (84.1 – 89.0)
School decile
Low 269 / 1633 16.5
(14.5 - 18.6) 1364 / 1633
83.5 (81.4 - 85.5)
Medium 460 / 3159 14.7
(13.1 - 16.2) 2699 / 3159
85.3 (83.8 - 86.9)
High 447 / 3301 13.5
(12.1 - 14.9) 2854 / 3301
86.5 (85.1 - 87.9)
Neighbourhood deprivation
Low 357 / 2631 13.5
(12.2 - 14.9) 2274 / 2631
86.5 (85.1 - 87.8)
Medium 372 / 2877 12.9
(11.5 - 14.4) 2505 / 2877
87.1 (85.6 - 88.5)
High 424 / 2491 17.1
(15.6 - 18.7) 2067 / 2491
82.9 (81.3 - 84.4)
1 This table and section 7.2 refers to answers from the question During the last year have you been sent unwanted sexual stuff (including pornographic pictures, videos, or words) and where did it happen mostly?.
Students could respond by selecting one of the following options On a mobile phone, On the internet, By letters or notes, or This has not happened to me in the last 12 months.
The most common method of receiving unwanted sexual material was on students’ mobile phones (8%) or via the internet (6%), with less than 1% of all students reporting to
have received the material through letters or notes. While all other ethnic groups were more likely to receive unwanted sexual material on their mobile phone, Asian students
were more likely to receive unwanted sexual material through the internet.
Table 7.2.1.2. Demographics of students who were sent unwanted sexual material by delivery method (via mobile, internet or through notes/letters) in 2012
Was sent unwanted sexual material on a mobile phone
Was sent unwanted sexual material on the internet
Was sent unwanted sexual material by letters/notes
n / N %
(95% CI) n / N
% (95% CI)
n / N %
(95% CI)
Total 661 / 8093 8.2
(7.4 – 9.0) 480 / 8093
6.0
(5.4 - 6.6) 35 / 8093
0.4 (0.3 - 0.6)
Sex
Male 259 / 3617 7.2
(6.1 - 8.3) 222 / 3617
6.2
(5.2 - 7.2) 20 / 3617
0.5
(0.3 - 0.8)
Female 402 / 4474 9.0
(7.9 – 10.0) 258 / 4474
5.8
(5.1 – 6.5) 15 / 4474
0.3
(0.1 - 0.5)
Age
12-15 years 436 / 5180 8.4
(7.4 - 9.4) 307 / 5180
6.0
(5.3 – 6.7) 29 / 5180
0.6
(0.4 - 0.7)
16-18 years 221 / 2880 7.7
(6.6 - 8.7) 171 / 2880
6.0
(5.0 – 7.0) 6 / 2880
0.2
(0.0 - 0.4)

87
Ethnicity
Māori 162 / 1593 10.2
(8.4 – 12.0) 107 / 1593
6.8
(5.5 - 8.1) 8 / 1593
0.5
(0.2 - 0.8)
Pacific 111 / 1122 9.9
(8.1 - 11.7) 88 / 1122
7.8
(5.9 - 9.8) 11 / 1122
1.0
(0.6 - 1.4)
Asian 42 / 1014 4.1
(2.8 - 5.4) 85 / 1014
8.4
(6.6 - 10.2) 4 / 1014
0.4
(0.1 - 0.7)
NZ European 297 / 3873 7.7
(6.7 - 8.7) 164 / 3873
4.3
(3.6 - 4.9) 9 / 3873
0.2
(0.1 - 0.4)
Other 49 / 484 10.0
(7 .0- 13.1) 35 / 484
7.3
(4.8 - 9.7) 2 / 484
0.4
(0.0 – 1.0)
Sexual attraction
Attracted to opposite sex 561 / 7064 8.0
(7.1 - 8.8) 390 / 7064
5.6
(4.9 - 6.2) 18 / 7064
0.2
(0.1 - 0.4)
Attracted to same or both sexes
57 / 468 12.0
(8.7 - 15.3) 59 / 468
12.7
(9.9 - 15.6) 6 / 468
1.3
(0.3 - 2.3)
Urban/rural
Urban 543 / 6780 8.0
(7.1 - 8.9) 415 / 6780
6.1
(5.5 - 6.8) 32 / 6780
0.5 (0.3 - 0.6)
Rural 107 / 1219 8.8
(6.8 - 10.7) 54 / 1219
4.5
(3.2 - 5.9) 2 / 1219
0.1 (0.0 - 0.3)
School decile
Low 158 / 1633 9.7
(8.1 - 11.2) 98 / 1633
6.1
(4.8 - 7.4) 13 / 1633
0.8 (0.4 - 1.3)
Medium 266 / 3159 8.4
(6.9 – 10.0) 185 / 3159
5.9
(5.0 - 6.9) 9 / 3159
0.3 (0.1 - 0.5)
High 237 / 3301 7.2
(6.2 - 8.1) 197 / 3301
5.9
(4.9 – 7.0) 13 / 3301
0.4 (0.2 - 0.6)
Neighbourhood deprivation
Low 206 / 2631 7.8
(6.7 - 8.8) 146 / 2631
5.6
(4.6 - 6.6) 5 / 2631
0.2 (0.0 - 0.3)
Medium 207 / 2877 7.2
(6.1 - 8.4) 155 / 2877
5.4
(4.5 - 6.3) 10 / 2877
0.3 (0.1 - 0.6)
High 237 / 2491 9.6
(8.3 - 10.8) 168 / 2491
6.8
(5.8 - 7.8) 19 / 2491
0.8 (0.4 - 1.1)
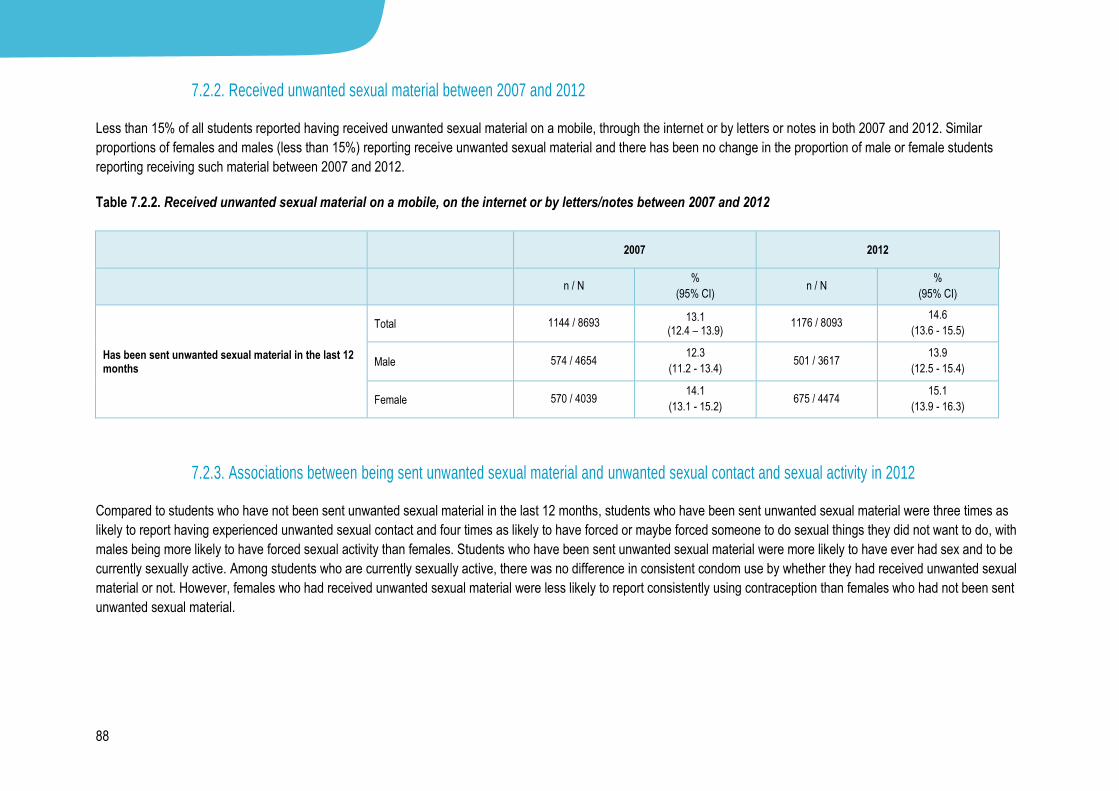
88
7.2.2. Received unwanted sexual material between 2007 and 2012
Less than 15% of all students reported having received unwanted sexual material on a mobile, through the internet or by letters or notes in both 2007 and 2012. Similar
proportions of females and males (less than 15%) reporting receive unwanted sexual material and there has been no change in the proportion of male or female students
reporting receiving such material between 2007 and 2012.
Table 7.2.2. Received unwanted sexual material on a mobile, on the internet or by letters/notes between 2007 and 2012
7.2.3. Associations between being sent unwanted sexual material and unwanted sexual contact and sexual activity in 2012
Compared to students who have not been sent unwanted sexual material in the last 12 months, students who have been sent unwanted sexual material were three times as
likely to report having experienced unwanted sexual contact and four times as likely to have forced or maybe forced someone to do sexual things they did not want to do, with
males being more likely to have forced sexual activity than females. Students who have been sent unwanted sexual material were more likely to have ever had sex and to be
currently sexually active. Among students who are currently sexually active, there was no difference in consistent condom use by whether they had received unwanted sexual
material or not. However, females who had received unwanted sexual material were less likely to report consistently using contraception than females who had not been sent
unwanted sexual material.
2007 2012
n / N %
(95% CI) n / N
%
(95% CI)
Has been sent unwanted sexual material in the last 12 months
Total 1144 / 8693 13.1
(12.4 – 13.9) 1176 / 8093
14.6
(13.6 - 15.5)
Male 574 / 4654 12.3
(11.2 - 13.4) 501 / 3617
13.9
(12.5 - 15.4)
Female 570 / 4039 14.1
(13.1 - 15.2) 675 / 4474
15.1
(13.9 - 16.3)

89
Table 7.2.3. Associations between being sent unwanted sexual material and unwanted sexual contact and sexual activity in 2012
Has been sent unwanted sexual material in the
last 12 months Has not been sent unwanted sexual material in
last 12 months
n / N %
(95% CI) n / N
% (95% CI)
Unwanted sexual contact
Total 385 / 1100 34.6
(31.3 – 38.0) 757 / 6583
11.5 (10.5 - 12.5)
Male 112 / 471 23.3
(19.3 - 27.4) 193 / 2940
6.6 (5.7 - 7.5)
Female 273 / 629 43.2
(39.2 - 47.1) 564 / 3643
15.5 (14.2 - 16.8)
Forced or maybe forced someone to do sexual things that they did not want to do
Total 94 / 1172 8.0
(6.2 - 9.8) 138 / 6912
2.0 (1.7 - 2.4)
Male 65 / 497 13.0
(10.3 - 15.8) 84 / 3114
2.7 (2.1 - 3.3)
Female 29 / 675 4.3
(2.6 - 5.9) 54 / 3798
1.4 (1.1 - 1.8)
Ever had sex
Total 446 / 1150 38.8
(35.4 - 42.3) 1486 / 6773
22.0 (20.2 - 23.7)
Male 190 / 487 39.2
(34.4 – 44.0) 678 / 3030
22.4 (20 - 24.7)
Female 256 / 663 38.6
(34.3 - 42.8) 808 / 3743
21.6 (19.7 - 23.5)
Currently sexually active
Total 142 / 484 29.3
(25.8 - 32.9) 1145 / 6764
17.0 (15.5 - 18.4)
Male 199 / 662 30.0
(25.9 - 34.2) 490 / 3024
16.2 (14.2 - 18.3)
Female 341 / 1146 29.7
(26.6 - 32.9) 655 / 3740
17.6 (15.9 - 19.2)
Consistent condom use
Total 158 / 336 47.1
(42.7 - 51.5) 504 / 1117
45.2 (42.3 – 48.0)
Male 73 / 140 52.1
(44.7 - 59.5) 247 / 468
52.8 (48.6 – 57.0)
Female 85 / 196 43.5
(37.5 - 49.4) 257 / 649
39.6 (36.2 – 43.0)
Consistent contraception use
Total 162 / 325 49.9
(43.6 - 56.2) 684 / 1117
61.3 (57.4 - 65.2)
Male 65 / 131 49.7
(40.7 - 58.7) 275 / 471
58.5 (53.9 – 63.0)
Female 97 / 194 50.0
(41.9 - 58.1) 409 / 646
63.4 (58.4 - 68.4)

90
PART FOUR 8. Māori and Pacific students
8.1.1. Māori demographics
In 2012, more than half of the Māori participants were female and 15 years old or younger. Over 40% of the Māori population reported living in poor areas and attending low
decile schools, while less than one-quarter of Māori participants reported living in wealthy areas or attending high decile schools. Similar proportions of Māori reported being
same or both sex-attracted (6%) or transgender (4%) as the general population in the Youth’12 survey (see Table A. Participant demographic characteristics of students in
2012).
Table 8.1.1. Māori participant demographic characteristics of students in 2012
n / N %
Sex
Male 801 / 1699
47.1
(44.8 - 49.5)
Female 898 / 1699
52.9
(50.5 - 55.2)
Age
13 or under 413 / 1698
24.3
(22.3 - 26.4)
14 435 / 1698
25.6
(23.5 - 27.7)
15 354 / 1698
20.8
(18.9 - 22.8)
16 278 / 1698
16.4
(14.6 - 18.1)
17 or over 218 / 1698
12.8
(11.2 - 14.4)
Sexual attraction
Attracted to opposite sex 1469 / 1561
94.1
(92.9 - 95.3)
Attracted to same or both sexes 92 / 1561
5.9
(4.7 - 7.1)
Gender identity Not transgender 1517 / 1577
96.2
(95.3 - 97.1)
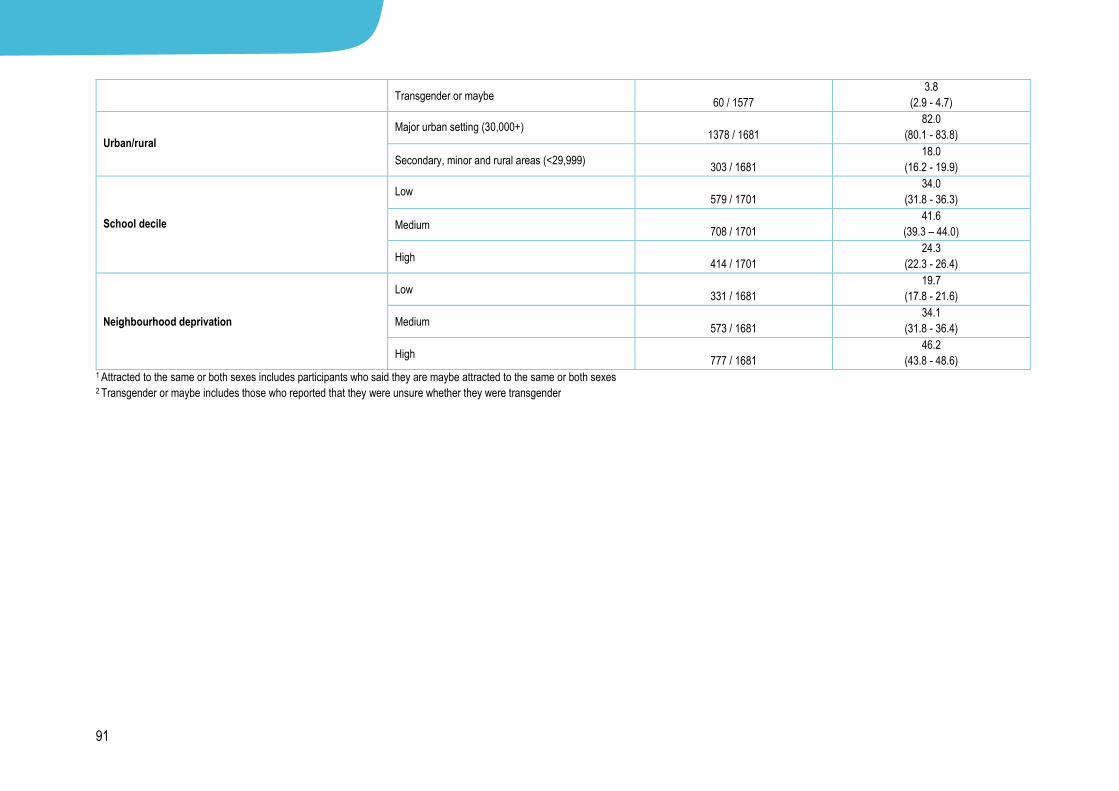
91
Transgender or maybe 60 / 1577
3.8
(2.9 - 4.7)
Urban/rural
Major urban setting (30,000+) 1378 / 1681
82.0
(80.1 - 83.8)
Secondary, minor and rural areas (<29,999) 303 / 1681
18.0
(16.2 - 19.9)
School decile
Low 579 / 1701
34.0
(31.8 - 36.3)
Medium 708 / 1701
41.6
(39.3 – 44.0)
High 414 / 1701
24.3
(22.3 - 26.4)
Neighbourhood deprivation
Low 331 / 1681
19.7
(17.8 - 21.6)
Medium 573 / 1681
34.1
(31.8 - 36.4)
High 777 / 1681
46.2
(43.8 - 48.6) 1 Attracted to the same or both sexes includes participants who said they are maybe attracted to the same or both sexes 2 Transgender or maybe includes those who reported that they were unsure whether they were transgender

92
8.1.2. Sexual activity and contraception use among Māori students
The majority (64.5%) of Māori students reported never having had sex. Of those who had sex, 26% were currently sexually active (had sex within the previous three months).
As would be expected, older students (16-18 years) were more likely to report having ever had sex and that they were currently sexually active compared to younger students
(12-15 years). Students attending low decile schools were about 10% more likely to have ever had sex than students in high decile schools. There was no difference in
reporting of ever having sex and being currently sexually active by sex, living in rural or urban places or neighbourhood deprivation. Of the Māori students who reported being
currently sexually active, just less than half reported always using condoms and always using contraception. Apart from students living in rural areas being 19% more likely to
always use condoms than students living in urban areas, there were no differences among Māori students consistent use of contraception and condoms by any of the other
demographic variables.
Table 8.1.2. Sexual activity and contraception use among currently sexually active of Māori students in 2012
Ever had sex Sexually active Always uses contraception Always uses condoms
n / N %
(95% CI) n / N
% (95% CI)
n / N %
(95% CI) n / N
% (95% CI)
Total 584 / 1639
35.5
(32.6 - 38.3) 433 / 1632
26.4
(24.1 - 28.8) 204 / 420
48.5
(42.6 - 54.5) 183 / 418
43.9
(38.3 - 49.6)
Sex
Male 279 / 766
36.2
(32.3 – 40.0) 198 / 763
25.7
(22.6 - 28.7) 95 / 188
50.4
(41.9 - 58.9) 95 / 186
51.3
(43.1 - 59.4)
Female 305 / 873
34.9
(31.1 - 38.7) 235 / 869
27.1
(23.9 - 30.3) 109 / 232
47.0
(39.1 - 54.9) 88 / 232
38.0
(31.0 - 45.1)
Age
12-15 years 319 / 1157
27.4
(24.3 - 30.6) 224 / 1151
19.3
(16.7 - 22.0) 94 / 216
43.3
(35.6 - 50.9) 98 / 213
46.0
(38.1 – 54.0)
16-18 years 265 / 479
55.1
(49.8 - 60.4) 209 / 478
43.6
(38.4 - 48.7) 110 / 204
54.0
(47.5 - 60.6) 84 / 205
41.3
(33.7 - 48.8)
Urban/rural
Urban 468 / 1334
35.1
(32.0 - 38.1) 353 / 1327
26.6
(24.0 - 29.2) 159 / 343
46.3
(39.5 - 53.1) 139 / 341
40.8
(35.3 - 46.2)
Rural 114 / 289
38.8
(31.9 - 45.7) 77 / 288
26.3
(21.0 - 31.7) 45 / 74
60.9
(52.1 - 69.7) 43 / 74
59.0
(47.6 - 70.4)
School decile
Low 225 / 536
41.6
(36.5 - 46.7) 169 / 530
31.6
(27.4 - 35.8) 71 / 163
43.5
(35.8 - 51.2) 66 / 183
41.9
(33.0 - 50.8)
Medium 231 / 699
33.1
(28.6 - 37.6) 167 / 697
24.1
(20.5 - 27.6) 69 / 163
42.3
(32.2 - 52.4) 74 / 158
45.5
(36.1 - 54.8)
High 130 / 406
32.0
(28.3 - 35.6) 98 / 406
24.1
(20.2 - 28.0) 64 / 95
67.2
(59.3 - 75.1) 43 / 97
44.0
(31.6 - 56.3)
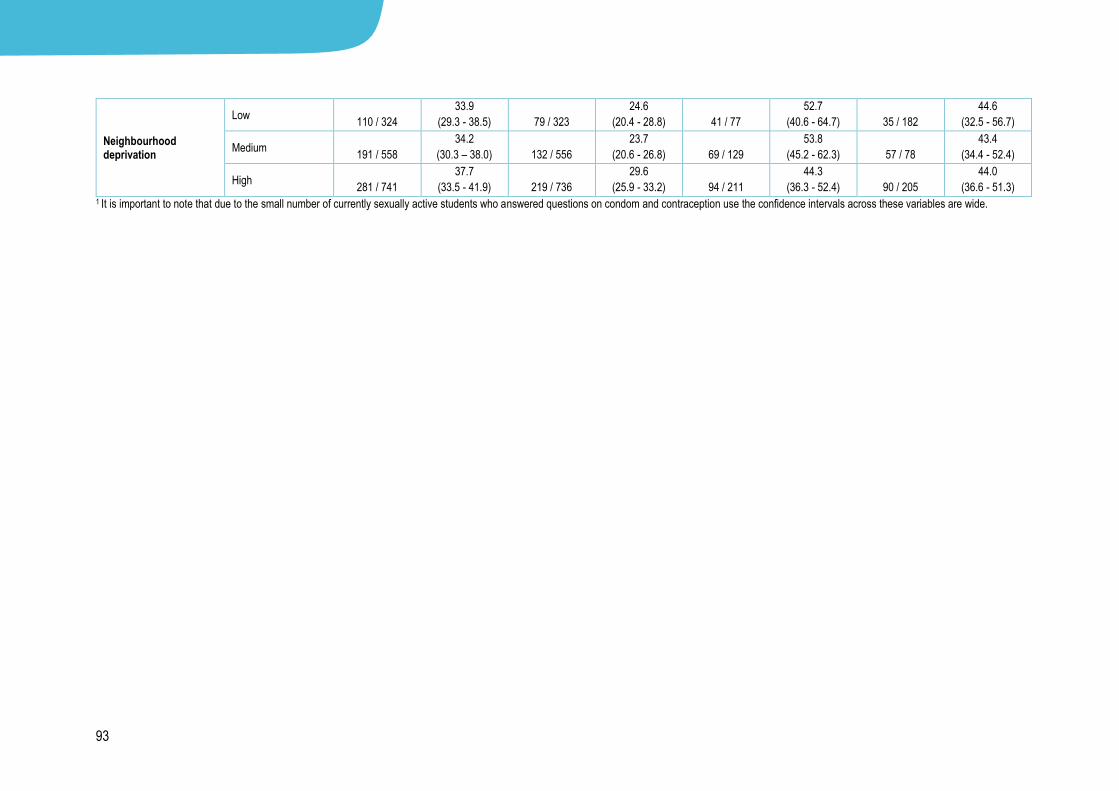
93
Neighbourhood deprivation
Low 110 / 324
33.9
(29.3 - 38.5) 79 / 323
24.6
(20.4 - 28.8) 41 / 77
52.7
(40.6 - 64.7) 35 / 182
44.6
(32.5 - 56.7)
Medium 191 / 558
34.2
(30.3 – 38.0) 132 / 556
23.7
(20.6 - 26.8) 69 / 129
53.8
(45.2 - 62.3) 57 / 78
43.4
(34.4 - 52.4)
High 281 / 741
37.7
(33.5 - 41.9) 219 / 736
29.6
(25.9 - 33.2) 94 / 211
44.3
(36.3 - 52.4) 90 / 205
44.0
(36.6 - 51.3) 1 It is important to note that due to the small number of currently sexually active students who answered questions on condom and contraception use the confidence intervals across these variables are wide.

94
8.1.3. Māori students’ condom use, contraception use, pregnancy and STI prevention discussions
Over two-thirds of Māori students who reported having had sex within the last three months reported using a condom or contraception when they last engaged in sexual
intercourse. Of these students, males were 14% more likely than females to report using a condom when they last engaged in sexual intercourse. Māori students who
attended a high decile school and students who lived in wealthier areas were more likely than Māori students at low decile schools and those who live in poorer
neighbourhoods to report using some form of contraception when they last engaged in sexual intercourse (25% and 18% differences respectively). Of the currently sexually
active Māori students, about 31% reported always talking with their partner/s about pregnancy prevention and about 40% reported talking about STIs with their partner/s. The
only demographic difference for these two variables was that female students were 17% more likely to report always talking with their partner/s about pregnancy prevention.
Table 8.1.3. Māori students’ use of condoms and contraception at the last sexual intercourse and discussion of pregnancy and STI prevention with partner/s in
2012
Condom at last sex Contraception at last sex Always talk with partner/s
about pregnancy prevention
Ever talked about STIs with
partner/s
n / N %
(95% CI) n / N
% (95% CI)
n / N %
(95% CI) n / N
% (95% CI)
Total 219 / 326 67.1
(62.6 - 71.6) 237 / 346
68.9
(63.5 - 74.4) 176 / 575
30.8
(26.6 – 35.0) 228 / 571
40.1
(35.4 - 44.7)
Sex
Male 112 / 149 74.9
(68.5 - 81.3) 105 / 152
69.4
(62.6 - 76.3) 59 / 274
21.7
(17.1 - 26.4) 95 / 271
35.2
(29.7 - 40.6)
Female 107 / 177 60.5
(53.8 - 67.2) 132 / 194
68.5
(60.9 - 76.1) 117 / 301
39.1
(34.1 - 44.1) 133 / 300
44.5
(37.3 - 51.7)
Age
12-15 years 125 / 175 71.4
(65.2 - 77.6) 106 / 168
63.5
(56.0 – 71.0) 87 / 312
28.2
(23.0 - 33.4) 116 / 309
37.6
(31.5 - 43.7)
16-18 years 93 / 150 61.9
(54.2 - 69.7) 131 / 177
74.5
(67.7 - 81.2) 89 / 263
33.9
(28.0 - 39.7) 113 / 262
43.4
(37.8 - 49.0)
Urban/rural
Urban 172 / 265 64.9
(60.0 - 69.8) 194 / 285
68.1
(61.9 - 74.3) 140 / 460
30.5
(26.0 - 35.0) 185 / 456
40.4
(35.8 - 45.1)
Rural 47 / 60 78.5
(68.5 - 88.5) 43 / 58
76.3
(64.3 - 88.2) 35 / 112
32.6
(24.0 - 41.1) 44 / 112
40.6
(28.4 - 52.7)
School decile
Low 78 / 121 64.4
(55.0 - 73.8) 72 / 125
58.6
(51.4 - 65.7) 55 / 217
25.7
(18.3 - 33.1) 82 / 216
38.5
(29.5 - 47.4)
Medium 88 / 125 70.3
(63.9 - 76.6) 95 / 137
69.4
(60.6 - 78.1) 71 / 229
30.9
(25.8 - 36.1) 93 / 227
40.8
(33.6 – 48.0)
High 53 / 80 66.0
(59.3 - 72.8) 70 / 84
83.2
(74.6 - 91.8) 50 / 130
38.6
(29.5 - 47.6) 54 / 129
41.8
(33.9 - 49.8)
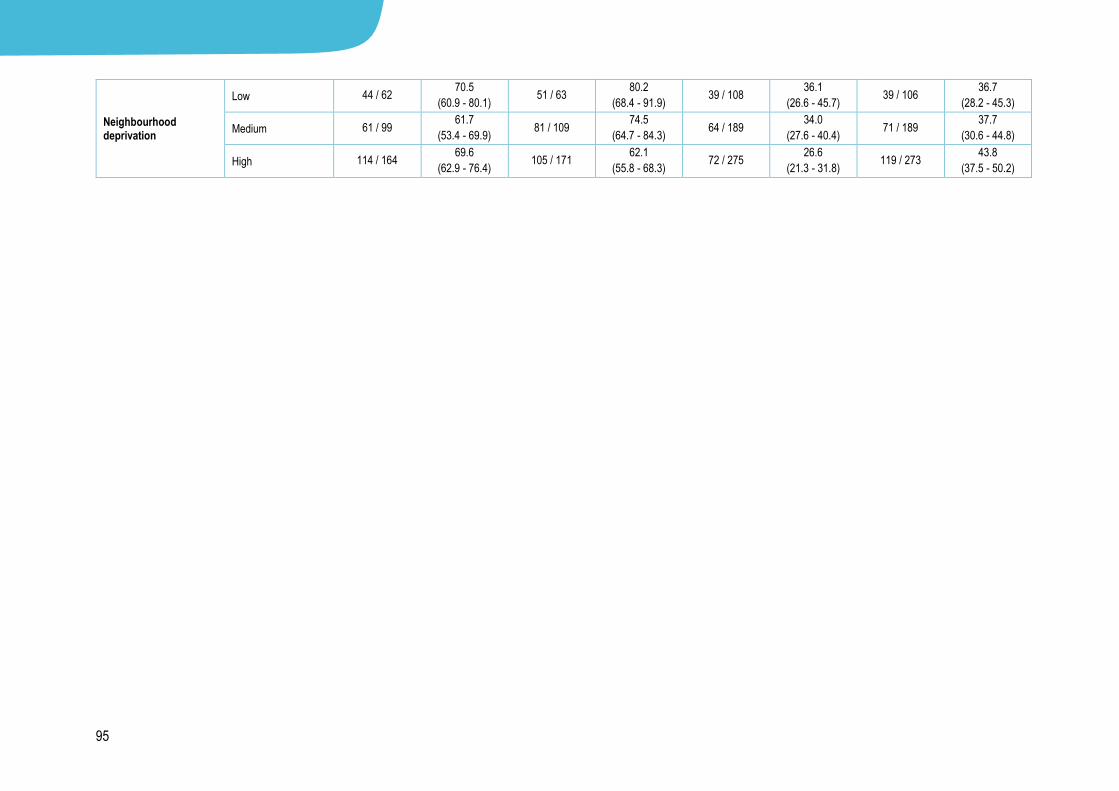
95
Neighbourhood deprivation
Low 44 / 62 70.5
(60.9 - 80.1) 51 / 63
80.2
(68.4 - 91.9) 39 / 108
36.1
(26.6 - 45.7) 39 / 106
36.7
(28.2 - 45.3)
Medium 61 / 99 61.7
(53.4 - 69.9) 81 / 109
74.5
(64.7 - 84.3) 64 / 189
34.0
(27.6 - 40.4) 71 / 189
37.7
(30.6 - 44.8)
High 114 / 164 69.6
(62.9 - 76.4) 105 / 171
62.1
(55.8 - 68.3) 72 / 275
26.6
(21.3 - 31.8) 119 / 273
43.8
(37.5 - 50.2)
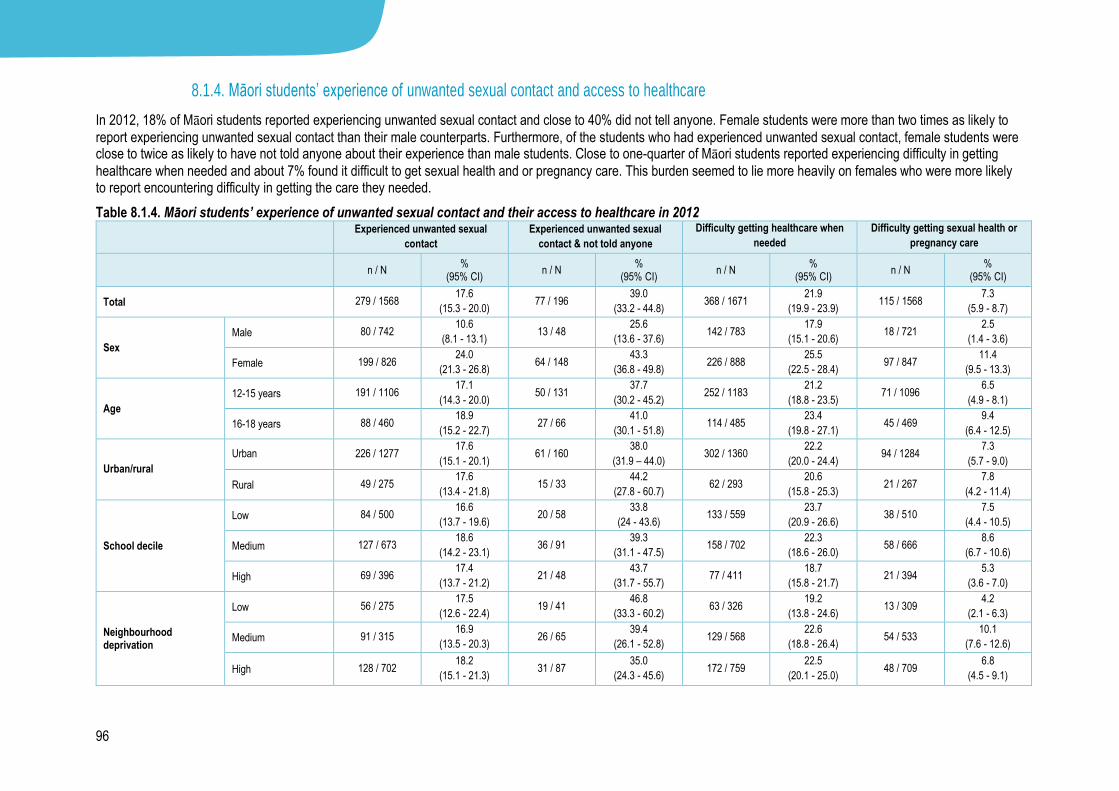
96
8.1.4. Māori students’ experience of unwanted sexual contact and access to healthcare
In 2012, 18% of Māori students reported experiencing unwanted sexual contact and close to 40% did not tell anyone. Female students were more than two times as likely to
report experiencing unwanted sexual contact than their male counterparts. Furthermore, of the students who had experienced unwanted sexual contact, female students were close to twice as likely to have not told anyone about their experience than male students. Close to one-quarter of Māori students reported experiencing difficulty in getting
healthcare when needed and about 7% found it difficult to get sexual health and or pregnancy care. This burden seemed to lie more heavily on females who were more likely to report encountering difficulty in getting the care they needed.
Table 8.1.4. Māori students’ experience of unwanted sexual contact and their access to healthcare in 2012
Experienced unwanted sexual
contact
Experienced unwanted sexual
contact & not told anyone
Difficulty getting healthcare when
needed
Difficulty getting sexual health or
pregnancy care
n / N %
(95% CI) n / N
% (95% CI)
n / N %
(95% CI) n / N
% (95% CI)
Total 279 / 1568 17.6
(15.3 - 20.0) 77 / 196
39.0
(33.2 - 44.8) 368 / 1671
21.9
(19.9 - 23.9) 115 / 1568
7.3
(5.9 - 8.7)
Sex
Male 80 / 742 10.6
(8.1 - 13.1) 13 / 48
25.6
(13.6 - 37.6) 142 / 783
17.9
(15.1 - 20.6) 18 / 721
2.5
(1.4 - 3.6)
Female 199 / 826 24.0
(21.3 - 26.8) 64 / 148
43.3
(36.8 - 49.8) 226 / 888
25.5
(22.5 - 28.4) 97 / 847
11.4
(9.5 - 13.3)
Age
12-15 years 191 / 1106 17.1
(14.3 - 20.0) 50 / 131
37.7
(30.2 - 45.2) 252 / 1183
21.2
(18.8 - 23.5) 71 / 1096
6.5
(4.9 - 8.1)
16-18 years 88 / 460 18.9
(15.2 - 22.7) 27 / 66
41.0
(30.1 - 51.8) 114 / 485
23.4
(19.8 - 27.1) 45 / 469
9.4
(6.4 - 12.5)
Urban/rural
Urban 226 / 1277 17.6
(15.1 - 20.1) 61 / 160
38.0
(31.9 – 44.0) 302 / 1360
22.2
(20.0 - 24.4) 94 / 1284
7.3
(5.7 - 9.0)
Rural 49 / 275 17.6
(13.4 - 21.8) 15 / 33
44.2
(27.8 - 60.7) 62 / 293
20.6
(15.8 - 25.3) 21 / 267
7.8
(4.2 - 11.4)
School decile
Low 84 / 500 16.6
(13.7 - 19.6) 20 / 58
33.8
(24 - 43.6) 133 / 559
23.7
(20.9 - 26.6) 38 / 510
7.5
(4.4 - 10.5)
Medium 127 / 673 18.6
(14.2 - 23.1) 36 / 91
39.3
(31.1 - 47.5) 158 / 702
22.3
(18.6 - 26.0) 58 / 666
8.6
(6.7 - 10.6)
High 69 / 396 17.4
(13.7 - 21.2) 21 / 48
43.7
(31.7 - 55.7) 77 / 411
18.7
(15.8 - 21.7) 21 / 394
5.3
(3.6 - 7.0)
Neighbourhood deprivation
Low 56 / 275 17.5
(12.6 - 22.4) 19 / 41
46.8
(33.3 - 60.2) 63 / 326
19.2
(13.8 - 24.6) 13 / 309
4.2
(2.1 - 6.3)
Medium 91 / 315 16.9
(13.5 - 20.3) 26 / 65
39.4
(26.1 - 52.8) 129 / 568
22.6
(18.8 - 26.4) 54 / 533
10.1
(7.6 - 12.6)
High 128 / 702 18.2
(15.1 - 21.3) 31 / 87
35.0
(24.3 - 45.6) 172 / 759
22.5
(20.1 - 25.0) 48 / 709
6.8
(4.5 - 9.1)

97
8.2. Pacific demographics
In 2012, more than half of the Pacific participants were female, 15 years old or younger and the vast majority lived in urban areas. Over 64% of the Pacific population reported
living in poor areas and attending low decile schools, while less than 8% of Pacific participants reported living in wealthy areas and 13% reported attending high decile schools.
About 8% of Pacific students reported to be same or both-sex attracted and 6% reported to be transgender (4%).
Table 8.2.1. Pacific participant demographic characteristics of students in 2012
n / N %
Sex
Male 521 / 1201 43.4
(40.6 - 46.2)
Female 680 / 1201 56.6
(53.8 - 59.4)
Age
13 or under 271 / 1200 22.6
(20.2 - 25)
14 270 / 1200 22.5
(20.1 - 24.9)
15 262 / 1200 21.8
(19.5 - 24.2)
16 218 / 1200 18.2
(16 - 20.4)
17 or over 179 / 1200 14.9
(12.9 - 16.9)
Sexual attraction
Attracted to opposite sex 912 / 992 91.9
(90.2 - 93.6)
Attracted to same or both sexes 80 / 992 8.1
(6.4 - 9.8)
Gender identity
Not transgender 1005 / 1070 93.9
(92.5 - 95.4)
Transgender or maybe 65 / 1070 6.1
(4.6 - 7.5)
Urban/rural
Major urban setting (30,000+) 1159 / 1186 97.7
(96.9 - 98.6)
Secondary, minor and rural areas (<29,999) 27 / 1186 2.3
(1.4 - 3.1)
School decile Low 771 / 1201 64.2
(61.5 - 66.9)
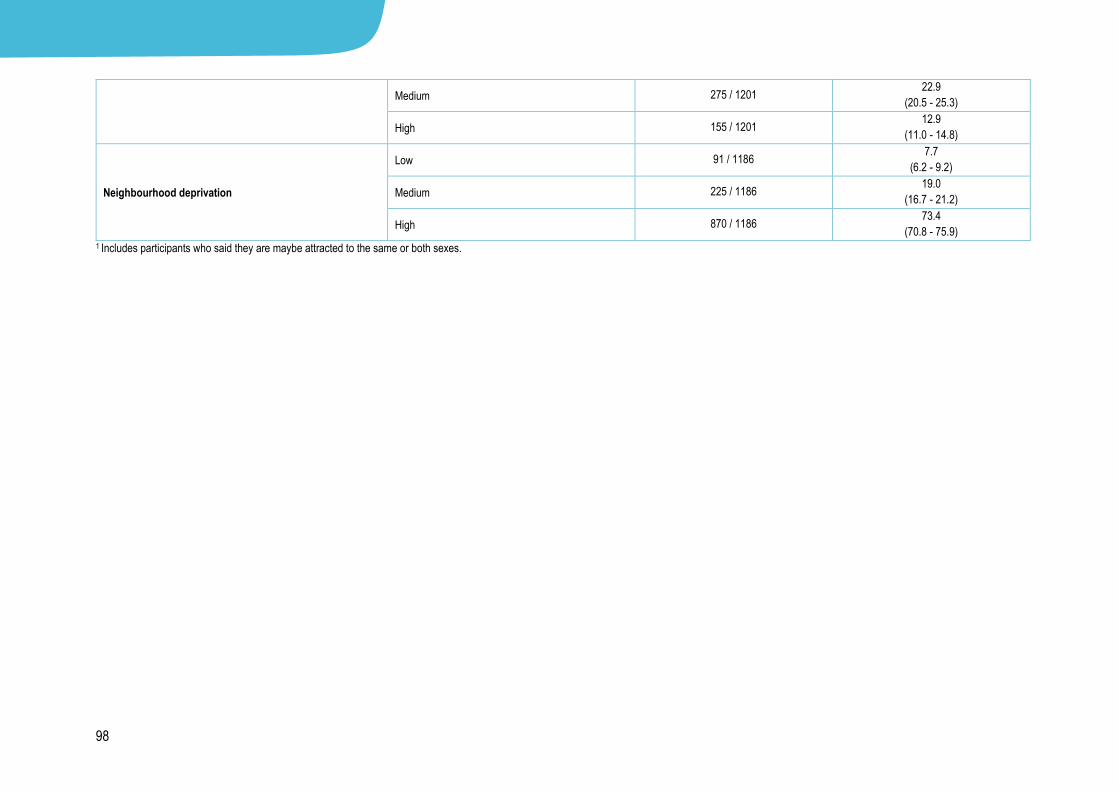
98
Medium 275 / 1201 22.9
(20.5 - 25.3)
High 155 / 1201 12.9
(11.0 - 14.8)
Neighbourhood deprivation
Low 91 / 1186 7.7
(6.2 - 9.2)
Medium 225 / 1186 19.0
(16.7 - 21.2)
High 870 / 1186 73.4
(70.8 - 75.9) 1 Includes participants who said they are maybe attracted to the same or both sexes.

99
8.2.2. Sexual activity and contraception use among Pacific students
Similar to the overall population, the majority (74.7%) of Pacific students reported never having had sex. One-quarter of Pacific students reported ever having sex and one-fifth
said that they were currently sexually active (had sex within the previous three months). As would be expected, older students (16-18 years) were more likely to report ever
having sex and being currently sexually active than younger students (12-15 years). There was no difference among Pacific students in their reporting of having ever had sex
and being currently sexually active by sex, living in rural or urban places, school decile or neighbourhood deprivation. Of the Pacific students who reported to be currently
sexually active, about 40% reported always using condoms and 35% reported always using contraception. There were no differences among Pacific students always using
contraception and always using condoms by any of the demographic variables.
Table 8.2.2. Sexual activity and contraception use of sexually active Pacific students in 2012
Ever had sex Sexually active Always uses contraception Always uses condoms
n / N %
(95% CI) n / N
% (95% CI)
n / N %
(95% CI) n / N
% (95% CI)
Total 285 / 1130 25.3
(22.0 - 28.5) 224 / 1128
19.9
(17.1 - 22.7) 91 / 215
42.4
(34.6 - 50.2) 75 / 217
34.6
(30.5 - 38.7)
Sex
Male 141 / 478 29.6
(25.4 - 33.8) 110 / 476
23.2
(19.5 - 26.9) 42 / 105
40.1
(29.1 - 51.2) 41 / 109
37.7
(32.0 - 43.5)
Female 144 / 652 22.1
(18.2 -26.0) 114 / 652
17.5
(14.2 - 20.8) 49 / 110
44.5
(35.9 - 53.2) 34 / 108
31.5
(24.5 - 38.5)
Age
12-15 years 139 / 763 18.3
(15.3 - 21.3) 107 / 761
14.1
(11.9 - 16.3) 45 / 101
44.8
(34.2 - 55.3) 43 / 103
42.0
(34.3 - 49.6)
16-18 years 144 / 363 39.7
(34.9 - 44.5) 117 / 363
32.3
(27.7 - 36.8) 46 / 114
40.2
(29.4 - 51.1) 32 / 114
28.0
(21.5 - 34.4)
Urban/rural
Urban 271 / 1093 24.8
(21.6 - 28.0) 213 / 1091
19.5
(16.8 - 22.3) 84 / 205
41.0
(35.4 – 48.6) 69 / 207
33.4
(29.3 - 37.5)
Rural 10 / 27 39.1
(19.9 - 58.3) 8 / 27
31.6
(9.8 - 53.4) 6 / 7
86.1
(63.8 – 100.0) 4 / 7
56.7
(33.2 - 80.1)
School decile
Low 174 / 719 24.2
(20.3 - 28.2) 135 / 717
18.8
(15.4 - 22.3) 50 / 130
38.4
(28.4 - 48.4) 44 / 130
33.8
(30.4 - 37.3)
Medium 75 / 260 29.0
(21.3 - 36.7) 59 / 260
22.9
(16.5 - 29.2) 26 / 56
46.7
(35.0 - 58.3) 21 / 58
36.4
(25.4 - 47.4)
High 36 / 151 24.0
(18.5 - 29.5) 30 / 151
20.0
(15.2 - 24.8) 15 / 29
51.7
(35.7 - 67.7) 10 / 29
34.4
(19.6 - 49.3)
Neighbourhood deprivation
Low 27 / 90 29.9
(19.2 - 40.6) 23 / 90
25.5
(15.2 - 35.8) 14 / 23
60.9
(46.2 – 75.5) 9 / 22
40.9
(22.7 - 59.1)
Medium 58 / 217 27.0
(20.4 - 33.5) 43 / 217
20.0
(14.3 - 25.8) 18 / 39
46.4
(32.3 – 60.6) 15 / 43
35.1
(20.4 - 49.7)
High 196 / 813 24.1
(20.3 – 28.0) 155 / 811
19.1
(16.0 - 22.3) 58 / 150
38.7
(30.2 – 47.2) 49 / 149
33.0
(27.8 - 38.1)
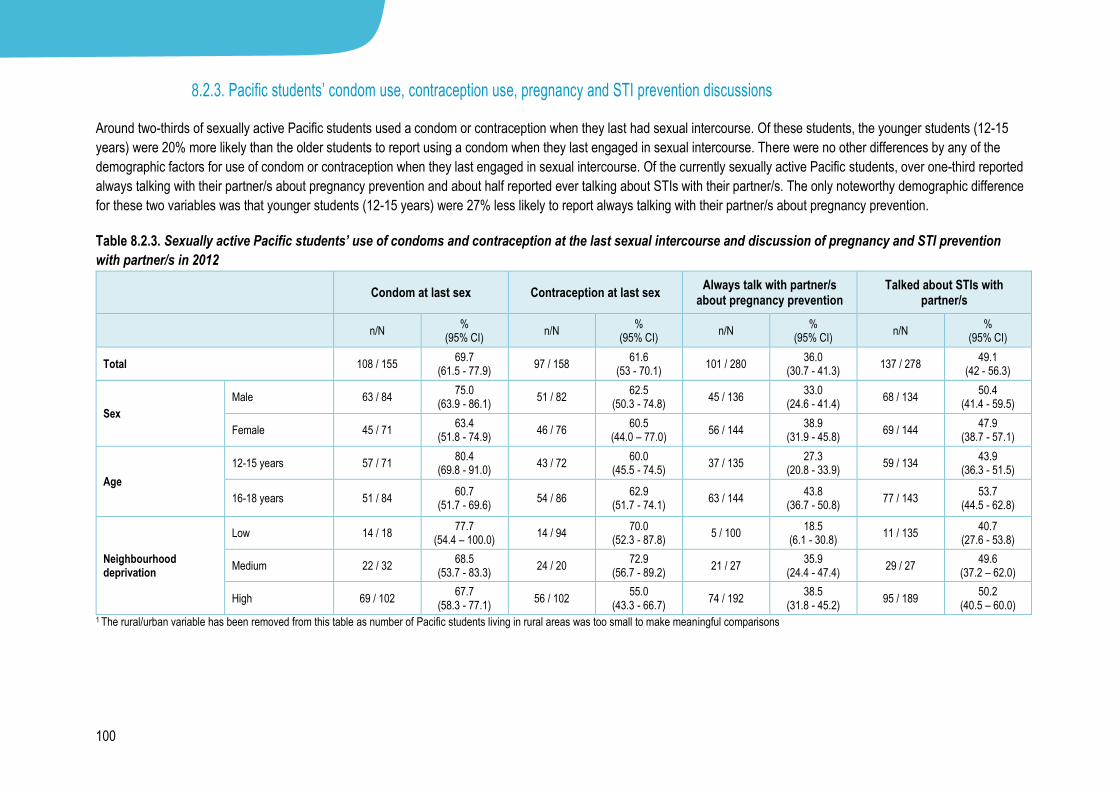
100
8.2.3. Pacific students’ condom use, contraception use, pregnancy and STI prevention discussions
Around two-thirds of sexually active Pacific students used a condom or contraception when they last had sexual intercourse. Of these students, the younger students (12-15
years) were 20% more likely than the older students to report using a condom when they last engaged in sexual intercourse. There were no other differences by any of the
demographic factors for use of condom or contraception when they last engaged in sexual intercourse. Of the currently sexually active Pacific students, over one-third reported
always talking with their partner/s about pregnancy prevention and about half reported ever talking about STIs with their partner/s. The only noteworthy demographic difference
for these two variables was that younger students (12-15 years) were 27% less likely to report always talking with their partner/s about pregnancy prevention.
Table 8.2.3. Sexually active Pacific students’ use of condoms and contraception at the last sexual intercourse and discussion of pregnancy and STI prevention
with partner/s in 2012
Condom at last sex Contraception at last sex Always talk with partner/s
about pregnancy prevention Talked about STIs with
partner/s
n/N %
(95% CI) n/N
% (95% CI)
n/N %
(95% CI) n/N
% (95% CI)
Total 108 / 155 69.7
(61.5 - 77.9) 97 / 158
61.6 (53 - 70.1)
101 / 280 36.0
(30.7 - 41.3) 137 / 278
49.1 (42 - 56.3)
Sex
Male 63 / 84 75.0
(63.9 - 86.1) 51 / 82
62.5 (50.3 - 74.8)
45 / 136 33.0
(24.6 - 41.4) 68 / 134
50.4 (41.4 - 59.5)
Female 45 / 71 63.4
(51.8 - 74.9) 46 / 76
60.5 (44.0 – 77.0)
56 / 144 38.9
(31.9 - 45.8) 69 / 144
47.9 (38.7 - 57.1)
Age
12-15 years 57 / 71 80.4
(69.8 - 91.0) 43 / 72
60.0 (45.5 - 74.5)
37 / 135 27.3
(20.8 - 33.9) 59 / 134
43.9 (36.3 - 51.5)
16-18 years 51 / 84 60.7
(51.7 - 69.6) 54 / 86
62.9 (51.7 - 74.1)
63 / 144 43.8
(36.7 - 50.8) 77 / 143
53.7 (44.5 - 62.8)
Neighbourhood deprivation
Low 14 / 18 77.7
(54.4 – 100.0) 14 / 94
70.0 (52.3 - 87.8)
5 / 100 18.5
(6.1 - 30.8) 11 / 135
40.7 (27.6 - 53.8)
Medium 22 / 32 68.5
(53.7 - 83.3) 24 / 20
72.9 (56.7 - 89.2)
21 / 27 35.9
(24.4 - 47.4) 29 / 27
49.6 (37.2 – 62.0)
High 69 / 102 67.7
(58.3 - 77.1) 56 / 102
55.0 (43.3 - 66.7)
74 / 192 38.5
(31.8 - 45.2) 95 / 189
50.2 (40.5 – 60.0)
1 The rural/urban variable has been removed from this table as number of Pacific students living in rural areas was too small to make meaningful comparisons

101
8.2.4. Pacific students’ experience of unwanted sexual contact and access to healthcare
In 2012, 22% of Pacific students reported experiencing unwanted sexual contact and close to 40% had not told anyone. Female students were about two times as likely to
report experiencing unwanted sexual contact and to have not told anyone compared to their male counterparts. Close to one-quarter of Pacific students reported experiencing
difficulty in getting healthcare when needed and about 6% found it difficult to get sexual health and or pregnancy care. This burden of accessing sexual health or pregnancy
care seemed to lie more heavily on older female students who were more likely to report encountering difficulty in getting the care they needed than males and younger
students. There were no differences in the reporting of getting healthcare when needed for Pacific student by school decile or level of neighbourhood deprivation.
Table 8.2.4. Sexually active Pacific students’ experience of unwanted sexual contact and their access to healthcare
Experienced unwanted sexual
contact
Experienced unwanted sexual
contact and not told anyone
Difficulty getting healthcare
when needed
Difficulty getting sexual health
or pregnancy care
n/N %
(95% CI) n/N
% (95% CI)
n/N %
(95% CI) n/N
% (95% CI)
Total 233 / 1066 21.8
(18.9 - 24.7) 65 / 166
39.2
(31.1 - 47.3) 284 / 1177
24.1
(21.9 - 26.3) 64 / 1105
5.8
(4.2 - 7.4)
Sex
Male 67 / 449 14.9
(11.7 - 18.2) 9 / 39
22.9
(10.7 - 35.2) 106 / 506
20.9
(17.0 - 24.8) 8 / 457
1.8
(0.7 - 2.9)
Female 166 / 617 26.9
(23.0 - 30.7) 56 / 127
44.2
(36.2 - 52.3) 178 / 671
26.5
(23.3 - 29.7) 56 / 648
8.7
(6.3 – 11.0)
Age
12-15 years 156 / 721 21.6
(17.6 - 25.6) 37 / 97
38.2
(27.9 - 48.6) 175 / 786
22.2
(18.9 - 25.6) 27 / 735
3.7
(2.1 - 5.3)
16-18 years 77 / 344 22.3
(17.8 - 26.8) 28 / 69
40.6
(28.0 - 53.2) 108 / 387
27.9
(24.5 - 31.3) 36 / 366
9.9
(7.6 - 12.2)
School decile
Low 142 / 678 21.0
(17.3 - 24.6) 33 / 98
33.7
(23.8 - 43.5) 191 / 750
25.5
(22.5 - 28.4) 44 / 702
6.3
(4.1 - 8.4)
Medium 54 / 241 22.4
(17.6 - 27.1) 20 / 43
46.3
(29.7 - 62.9) 56 / 272
20.5
(16.5 - 24.5) 12 / 254
4.8
(2.9 - 6.7)
High 37 / 147 25.1
(17.8 - 32.3) 12 / 25
48.7
(30.0 - 67.5) 37 / 155
23.8
(17.3 - 30.2) 8 / 149
5.4
(1.1 - 9.7)
Neighbourhood deprivation
Low 15 / 87 17.2
(6.8 - 27.6) 7 / 11
63.7
(34.9 - 92.5) 21 / 91
23.0
(14.1 - 31.9) 2 / 86
2.3
(0 - 5.6)
Medium 43 / 200 21.4
(16.1 - 26.8) 9 / 32
28.2
(10.5 - 46.0) 49 / 224
21.8
(16.9 - 26.8) 11 / 207
5.3
(2.7 – 8.0)
High 174 / 770 22.6
(19.2 - 26.1) 49 / 122
40.2
(30.3 - 50.0) 210 / 850
24.7
(21.8 - 27.6) 50 / 800
6.3
(4.4 - 8.1) 1 The rural/urban variable has been removed from this table as number of Pacific students living in rural areas was too small to make meaningful comparisons

102
Summary and conclusions This report presents findings from Youth’12, the third national health and wellbeing survey of secondary school
students in New Zealand. This is New Zealand’s largest and most comprehensive survey of the health and
wellbeing of New Zealand’s young people in secondary schools. Included in the survey are a range of factors
that impact on the healthy development of young people, including family/whānau, community, education and
social environments. This report focuses on reporting the sexual violence experiences and the sexual and
reproductive health of students in secondary schools.
The information in this report was provided by a representative sample of 8,500 students from secondary schools
throughout New Zealand in 2012. There are three parts to this report: (1) Experience of unwanted sexual
contact, (2) Sexual and reproductive health and (3) Ethnic specific information for Māori and Pacific students.
Also reported are selected time trends from the 2001, 2007 and 2012 surveys.
Experience of unwanted sexual contact
Fifteen percent of New Zealand secondary school students report an experience of unwanted sexual contact.
Females were more than twice as likely to report unwanted sexual contact than males. Most commonly, it was a
boyfriend/girlfriend or a ‘friend’ who forced an unwanted sexual experience on the student. Over half (55%) of the
students who reported unwanted sexual contact reported that it happened when they were 14 years or younger.
Nearly three-quarters of males and just over half of the females never told anyone about it. Those who do
disclose unwanted sexual contact most commonly tell a friend. It appears that being able to disclose sexual
abuse and coercion is very difficult for children and young people, with over half of the female students and close
to three quarters of male students who experienced unwanted sexual contact reporting that had not told anyone.
They tended to talk to their peers about these experiences which may mean that they did not get the help and
support needed by experienced clinicians and services. Between 2001 and 2012, the rate of reported unwanted
sexual contact decreased by 8%.
Students who reported unwanted sexual contact were less likely than those who had not experienced unwanted
sexual contact to report good family relationships, very good or excellent health and access healthcare when
they needed it. Students who reported unwanted sexual contact were more likely to report food insecurity,
household overcrowding, moving home frequently, feeling unsafe at school, not getting along with their teachers
not having plans to complete school to year 13. They were more likely to see a health professional for emotional
concerns, have poorer mental health and sexual health, use tobacco, alcohol and marijuana and witness
violence in their homes. Unwanted sexual contact did not appear to impact on students’ aspirations to do well at
school.
A small proportion (3%) of students report forcing someone to do sexual things that they didn’t want to do, with
males twice as likely to report this compared to females. Between 2001 and 2012, the proportion of young
people who report forcing someone to do sexual things has decreased from close to 4% to nearly 2%. Young
people who report forcing someone to do sexual things have a range of poorer outcomes compared to those who
had not. They more frequently reported poor family relationships, feeling less safe at school, poor sexual health,
high rates of substance use, poor mental health and less aspiration to achieve at school. They also had difficulty
accessing help for emotional health concerns and alcohol use. Students who reported forcing someone to do
sexual things, were more likely to report being victims of violence including experiencing unwanted sexual
contact, witnessing family violence and being in serious physical fight within the previous year.
103
These findings emphasise the importance of quality education that addresses sexual safety among children and
young people. In addition, family/whanau should be equipped with the skills and information to talk to their
children about these issues. Health, social services and schools must also be well equipped with appropriate
resourcing, policies and training to effectively and sensitively prevent and respond to sexual violence against
children and young people. Policies and practices that continue to contribute to violence and current social
norms in New Zealand must be examined (Ministry of Justice, 2009; Woodley, Davis & Metzger, 2013; Heise,
2011). Finally, programmes, education and social campaigns that prevent violence, support young people to
develop healthy relationships and address barriers to help-seeking such as the silence and shame associated
with sexual violence must be mobilised to ensure that we have safe children and young people.
Sexual and reproductive health
Twenty-four percent of New Zealand secondary school students have ‘ever had sex’ (have had sexual
intercourse at least once and this does not include sexual abuse) and 19% report being currently sexually active
(have had sex within the last three months). As would be expected, older students are more likely to be sexually
active than younger students. In 2012, 12% fewer students reported ever having sex and 7% fewer students
reported being sexually active than in 2007. Of those sexually active students, 55% reported one sexual partner
within the previous three months.
Forty-five percent of sexually active students reported ‘always using condoms’. Over two-thirds (68%) of young
people reported using a condom the last time they had sex. Males, older students and students living in rural
communities more frequently reported using a condom the last time they had sex. Between 2001 and 2012,
there has been a reduction in students who reported always using condoms. Fifty-eight percent of students
always used contraception. Of those sexually active students, 80% reported condoms were the most common
source of contraception utilised, followed by the contraceptive pill (45%). Over three-quarters of students (77%)
reported using contraception the last time they had sex. Students from poorer communities, low decile schools
and rural students were less likely to use contraception the last time they had sex. Thirty-six percent of students
reported talking about preventing pregnancy with their partner and 42% talking with their partner about
preventing sexually transmitted infections. Females were more likely to initiate discussions about prevention of
pregnancy and sexually transmitted infections. There have been no improvements in contraception use over the
2001-2012 period.
Young people who consistently used condoms are more likely to report having family meals together at least five
times per week and that their parents wanted to know where they were and who they are with. Students who
always use condoms less frequently reported family violence, fighting, poor mental health, experiencing a
pregnancy or sexually transmitted infection, smoking cigarettes and experiencing unwanted sexual contact
compared to those who do not use condoms. Factors associated with consistent contraception use included
having an adult who cared about them a lot, that they got on with their teachers, had part time employment,
attended a place of worship and aspired to attend tertiary education after they leave school. Students who
always used contraception were less likely to report living in overcrowded housing, have neither parent working,
and not sleep in a room that is not a bedroom (e.g. a lounge or garage). They less frequently reported poor
mental health, a pregnancy or sexually transmitted infection, smoking cigarettes or using marijuana. Students
who always report using contraception were able to access healthcare with less difficulty, and were more likely to
report a family doctor/GP as their usual place to access healthcare.
Evidence suggests that the most effective strategies to reduce unintended teen pregnancy and STIs among
youth include:

104
Comprehensive sexuality curricula at school that cover accurate information, clear messages regarding
ways to avoid sex until ready and the consistent use of condoms/contraception once sexually active,
build communication and resistance skills, address social pressures and is reinforced many times over
an extended period and at different developmental stages (i.e. not one-off sessions/conversations).
Access to non-judgmental, accessible, preferably free healthcare. Good primary care either through
school based health services (S. Denny, Balhorn, Lawrence, & Cosgriff, 2005; S Denny et al., 2012 ; S.
Denny et al., 2014) and/or General Practitioner/Primary care provider with youth health training (Health
Workforce New Zealand Youth Review Team, 2011).
Youth development programmes that enable young people to vision a positive picture for themselves.
Young people who have goals and ambitions for the future are less likely to take risks sexually (Kirby
2007; Kirby, 2008). It is clear from our findings that holistic healthy youth development approaches are
required to ensure young people are assisted to make safer sexual choices. Young people need
families, schools and communities where they feel safe, quality housing, good public health policies,
supportive whānau, quality information and education, accessible and affordable healthcare and
opportunities for development. Strategies to ensure all youth have access to these resources and skills
are required.
Viewing and receiving sexually explicit material
Eleven percent of students use the internet to seek pornography or sex sites, with males more likely to do so
compared to females. Seven percent fewer students in 2012 compared to 2007 use the internet to seek
pornography or sex sites. Students who access the internet to seek pornography or sex sites more frequently
report unwanted sexual contact and are more likely to have ever had sex or be currently sexually active.
Fifteen percent of students had been sent unwanted sexually explicit material (SEM) in the last 12 months. Māori
students, Pacific students, same/both-sex attracted students and students from high deprivation (lower socio-
economic) neighbourhoods were more likely to be sent unwanted SEM. Unwanted SEM was mostly sent via
mobile phone (8%) or the internet (6%). Asian students more frequently reported being sent unwanted SEM via
the internet. There has been no change between 2007 and 2012 in the proportion of students reporting
unwanted SEM.
Students who were sent unwanted SEM were three times more likely to report unwanted sexual contact and four
times more likely to report forcing someone else to do sexual things that they didn’t want to do. Students who
were sent unwanted SEM were more likely to report ever having sex and being currently sexually active.
Consistent with international literature it would seem that exposure to unwanted and wanted sexually explicit
material can be associated with increased sexual risk taking, sexually coercive situations and sexual aggression
for young people (Braun-Courville & Rojas, 2009; Owens, Behun, Manning & Reid, 2012). The evidence
suggests that youth who actively seek out pornography may have unrealistic values and expectations of their
sexual partners, have more permissive sexual attitudes and earlier sexual experimentation.
Māori and Pacific students
Eighteen percent of Māori students said they had been forced to do sexual things that they didn’t want to do and
39% had not told anyone about the abuse. Twenty six percent of Māori students at secondary school report
being currently sexually active. Less than half of sexually active Māori students always used contraception (49%)
and condoms (44%). Two-thirds (67.1%) of Māori students reported using condoms the last time they had sex.
Māori students who lived in wealthier areas more frequently reported using contraception the last time they had
sex compared to students who live in poorer areas. Thirty one percent reported talking about contraception and

105
40% reported talking to about STI prevention with their partner. Twenty two percent of Māori students reported
difficulty accessing healthcare when they needed it, and 7% reported difficulty accessing sexual health or
pregnancy care.
Twenty-two percent of Pacific students report they had been forced to do sexual things that they didn’t want to do
and 39% had not told anyone about the abuse. Twenty percent of Pacific secondary school students report being
sexually active. Of sexually active Pacific students, 42% always use contraception and 35% always use
condoms. Over two-thirds (70%) report using condoms the last time they had sex, and 62% report using
contraception the last time they had sex. Thirty six percent of Pacific students always talked about pregnancy
prevention with their partner and half (49%) report talking to their partner about STI prevention. Twenty-four
percent of Pacific students reported difficulty accessing healthcare they needed, and 6% report difficulty
accessing sexual health and pregnancy care.
There are health disparities for Māori and Pacific students compared to their NZ European peers that have
persisted over time. Strategies that address these inequities through culturally responsive curricula, builds
workforce education and cultural competence, addresses barriers to access and education are required.
Conclusions
This report summarises the findings for unwanted sexual contact and sexual and reproductive health of New
Zealand’s young people attending secondary schools. There have been improvements, with fewer young people
reporting unwanted sexual contact in 2012 compared to 2001. However, 15% of all students reporting unwanted
sexual contact, is unacceptably high. Accessible healthcare remains a problem, particularly for Māori and Pacific
students, or students from poor and rural communities. Access to appropriate care for those who have forced
unwanted sexual contact on others, is also required. The effects of unwanted sexual contact can have lasting
impacts on young people, their whānau and communities. Exposure to unwanted sexually explicit material via
the internet or a cell phone is associated with a greater odds of being sexually active and unwanted sexual
contact. Strategies that effectively address the behaviour of those who force unwanted sexual experiences and
sexually explicit material onto others, that promote and teach students about positive relationships and good
communication, and addresses the larger social norms, policies and practices that contribute to violence are
required.
Almost a quarter of students in secondary schools are sexually active, with trends towards fewer students ‘ever
having sex’ or being sexually active between 2001 and 2012. In addition, fewer students also reported utilising
the internet for porn between 2007 and 2012. However, for sexually active students, condom use has reduced
over the past decade and contraception use has remained stable with no improvements. For those who are
sexually active, accessible and non-judgemental contraceptive care/primary care remains a problem, particularly
for Māori and Pacific students and those from poorer neighbourhoods, low decile schools and rural communities.
It is clear from our findings that keeping our young people safe and sexually healthy requires a whole person
approach, it requires: safe communities and schools; quality housing; sound public health policies; supportive
whānau/family; quality information and education; accessible and affordable healthcare; culturally competent and
finally, opportunities for youth development - our young people need opportunities to thrive.

106
Links and resources General youth health and wellbeing
Youthline – for 24/7 health information and support
www.youthline.co.nz
Free phone 0800 37 66 33
Free TXT 234 between 8am and midnight
Email: [email protected]
KidsLine – talk to someone 24/7 0800 KIDSLINE
Urge is a youth health and information service for
teenagers covering sex, drugs, drink, emotional
wellbeing (stress) and body issues
Phone: 09 360 9531
Email: [email protected]
Website: www.whakamanana.co.nz or www.urge.org.nz
RainbowYOUTH – information and support for queer,
same-sex attracted or gender diverse youth www.ry.org.nz
Emotional wellbeing and mental health
Information about mental health www.mentalhealth.org.nz/resourcefiner/listings/search/
The Lowdown – information about youth mental
health, feeling stressed and sad www.thelowdown.co.nz
Suicide Prevention Information www.spinz.org.nz
SPARX – a free self-help computerised gaming
programme to help learn skills to help with feeling
down, stressed or depressed
www.sparx.org.nz
Violence and family violence
For immediate help if you or someone else is in
danger Call 111
Rape prevention education www.rapecrisis.org.nz
HELP provides professional and specialised support
services to sexual abuse and assault survivors http://helpauckland.org.nz/
2 Shine - making homes violence free http://www.2shine.org.nz/
Free helpline 0508 744 633
Support for women and children for family violence https://womensrefuge.org.nz/domestic-violence/ 0800
Refuge (0800 733 843)
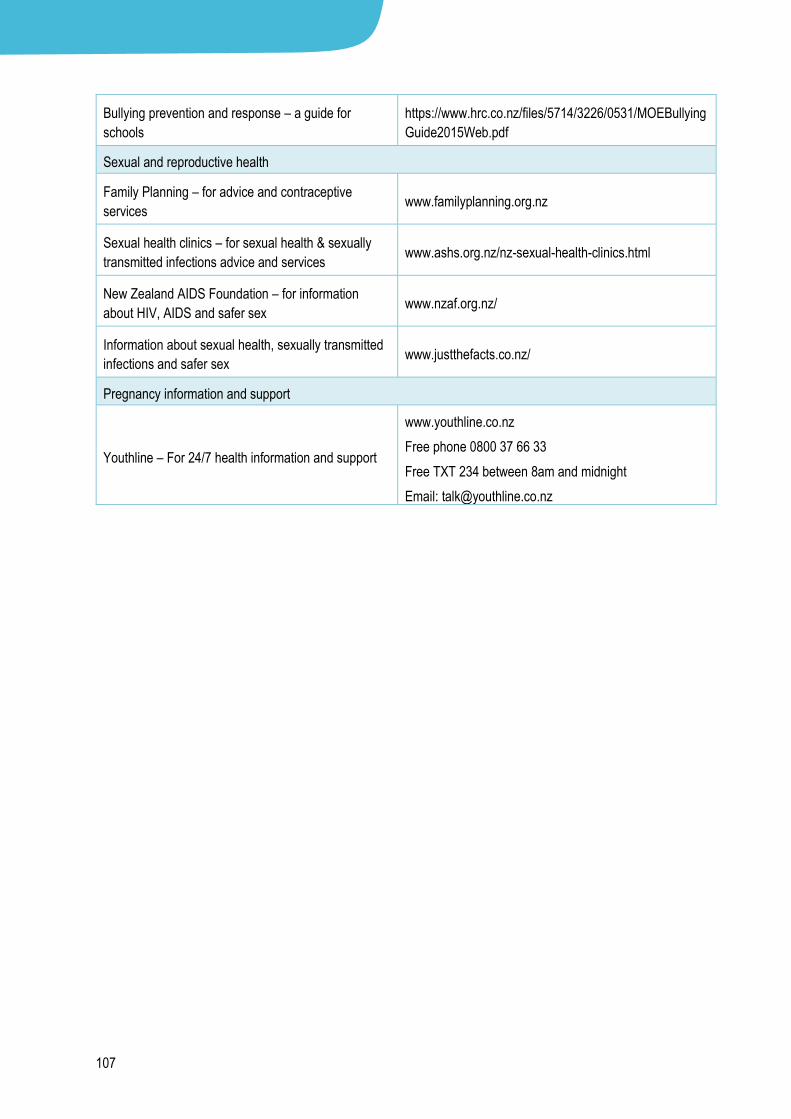
107
Bullying prevention and response – a guide for
schools
https://www.hrc.co.nz/files/5714/3226/0531/MOEBullying
Guide2015Web.pdf
Sexual and reproductive health
Family Planning – for advice and contraceptive
services www.familyplanning.org.nz
Sexual health clinics – for sexual health & sexually
transmitted infections advice and services www.ashs.org.nz/nz-sexual-health-clinics.html
New Zealand AIDS Foundation – for information
about HIV, AIDS and safer sex www.nzaf.org.nz/
Information about sexual health, sexually transmitted
infections and safer sex www.justthefacts.co.nz/
Pregnancy information and support
Youthline – For 24/7 health information and support
www.youthline.co.nz
Free phone 0800 37 66 33
Free TXT 234 between 8am and midnight
Email: [email protected]

108
References Adolescent Health Research Group. (2002). Alternative education students health: From Northland and Auckland regions.
Auckland: University of Auckland. Adolescent Health Research Group. (2003). New Zealand youth: A profile of their health and wellbeing. Auckland: University
of Auckland. Adolescent Health Research Group. (2008). Youth'07: The Health and Wellbeing of Secondary School Students in New
Zealand. Initial Findings. Auckland: University of Auckland. Braun-Courville, D. K., & Rojas, M. (2009). Exposure to Sexually Explicit Web Sites and Adolescent Sexual Attitudes and
Behaviors. Journal of Adolescent Health, 45(2), 156-162. http://dx.doi.org/10.1016/j.jadohealth.2008.12.004 Clark, T. C., Fleming, T., Bullen, P., Crengle, S., Denny, S., Dyson, B., . . . Lewycka, S. (2013). Health and well-being of
secondary school students in New Zealand: Trends between 2001, 2007, and 2012. Journal of Paediatrics and Child Health, 49, 925-934.
Clark, T. C., Fleming, T., Bullen, P., Denny, S., Crengle, S., Dyson, B., Fortune, S., Lucassen, M., Peiris-John, R., Robinson, E., Rossen, F., Sheridan, J., Teevale, T., Utter, J. (2013a). Youth’12 Overview: The health and wellbeing of New Zealand secondary school students in 2012. Auckland, New Zealand: The University of Auckland.
Clark, T.C., Fleming, T., Bullen, P., Crengle, S., Denny, S., Dyson, B., Fortune, S., Peiris-John, R., Robinson, E., Rossen, F., Sheridan, J., Teevale, T., Utter, J., & The Adolescent Health Research Group (2013b). Youth’12 Prevalence Tables: The health and wellbeing of New Zealand secondary school students in 2012 . Auckland, New Zealand; The University of Auckland.
Clark, T.C., Robinson, E., Crengle, S., Grant, S., Galbreath, R.A. & Sykora, J. (2009). Youth’07: The Health and Wellbeing of Secondary School Students in New Zealand. Findings on Young People and Violence. Auckland: The University of Auckland.
Clark, T. C., Smith, J. M., Raphael, D., Jackson, C., Fleming, T., Denny, S., & Robinson, E. (2010). Youth’09: The health and wellbeing of young people in alternative education. A report on the needs of alternative education students in Auckland and Northland. Auckland: The University of Auckland.
Denny, S., Clark, T., & Watson, P. (2004). The health of alternative education students compared to secondary school students: A New Zealand study. New Zealand Medical Journal, 117(1205), 1-12.
Denny, S., Balhorn, A., Lawrence, A., & Cosgriff, J. (2005). Student access to primary health care and preventive health screening at a school-based health centre in South Auckland, New Zealand. N Z Med J, 118(1218), U1561.
Denny, S., Farrant, B., Cosgriff, J., Harte, M., Cameron, T., Johnson, R., . . . Robinson, E. (2012 ). Access to private and confidential healthcare among secondary school students in New Zealand. Journal of Adolescent Health 51(3), 285-291. 10.1016/j.jadohealth.2011.12.02
Denny, S., S., G., R., G., Clark, T. C., Fleming, T., Bullen, P., . . . Teevale, T. (2014). Health Services in New Zealand Secondary Schools and the Associated Health Outcomes for Students. Auckland: University of Auckland.
Fleming, T.M., Watson, P.D., Robinson, E., Ameratunga, S., Dixon, R., Clark, T.C., Crengle, S. (2007) Violence and New Zealand Young People: Findings of Youth2000 - A National Secondary School Youth Health and Wellbeing Survey. Auckland: The University of Auckland.
Johnson, R., & Denny, S. J. (2007). The health and wellbeing of secondary school students attending teen parent units in New Zealand. Auckland: The University of Auckland.
Health Workforce New Zealand Youth Review Team. (2011). Report on the Youth Health Workforce Service Review. Retrieved from https://www.health.govt.nz/system/files/documents/pages/youth-health-workforce-service-review.pdf
Heise, L. (2011). What works to prevent partner violence: An evidence overview. STRIVE Research Consortium. ISBN: 9780902657852
Kirby, D. B. (2008). The impact of abstinence and comprehensive sex and STD/HIV education programs on adolescent sexual behavior. Sexuality Research & Social Policy, 5(3), 18-27.
Kirby D. B (2007). Emerging Answers 2007: Research Findings on Programs to Reduce Teen Pregnancy and Sexually Transmitted Diseases. Washington, DC: National Campaign to Prevent Teen Pregnancy.
Le Brun C., Robinson E., Warren H., Watson P.D. (2004) Non-heterosexual Youth - A Profile of their Health and Wellbeing: Data from Youth2000. Auckland: The University of Auckland.
Lucassen, M.F.G., Clark, T. C., Moselen, E., Robinson, E.M., & The Adolescent Health Research Group. (2014). Youth’12 The Health and Wellbeing of Secondary School Students in New Zealand: Results for Young People Attracted to the Same Sex or Both Sexes. Auckland: The University of Auckland.
Ministry of Education. (2016) School Deciles. Retrieved from http://www.education.govt.nz/school/running-a-school/resourcing/operational-funding/school-decile-ratings/
Ministry of Justice (2009). Te Toiora Mata Tauherenga. Report of the Taskforce for Action on Sexual Violence. Ministry of Justice, Wellington.

109
Owens, E. W., Behun, R. J., Manning, J. C., & Reid, R. C. (2012). The Impact of Internet Pornography on Adolescents: A Review of the Research. Sexual Addiction & Compulsivity, 19(1-2), 99-122. 10.1080/10720162.2012.660431
Rossen, F.V., Lucassen, M.F.G., Denny, S. & Robinson, E. (2009). Youth ‘07 The health and wellbeing of secondary school students in New Zealand: Results for young people attracted to the same sex or both sexes. Auckland: The University of Auckland.
Salmond C, Crampton P, Sutton F, et al. (2006) NZDep2006 census Area Unit data. Retrieved from www.otago.ac.nz/wellington/research/hirp/ otago020194.html.
Woodley, A., Davis, R. & Metzger, N. (2013) Breaking the Silence but Keeping Secrets: What Young People Want to Address Sexual Violence. Tu Wahine Trust and HELP (Auckland Sexual Abuse HELP Foundation): Auckland

110
Denny, S., Balhorn, A., Lawrence, A., & Cosgriff, J. (2005). Student access to primary health care and preventive health screening at a school-based health centre in South Auckland, New Zealand. N Z Med J, 118(1218), U1561.
Denny, S., Farrant, B., Cosgriff, J., Harte, M., Cameron, T., Johnson, R., . . . Robinson, E. (2012 ). Access to private and confidential healthcare among secondary school students in New Zealand. Journal of Adolescent Health 51(3), 285-291. 10.1016/j.jadohealth.2011.12.020
Denny, S., S., G., R., G., Clark, T. C., Fleming, T., Bullen, P., . . . Teevale, T. (2014). Health Services in New Zealand Secondary Schools and the Associated Health Outcomes for Students. Auckland: University of Auckland.
Health Workforce New Zealand Youth Review Team. (2011). Report on the Youth Health Workforce Service Review. Retrieved from https://www.health.govt.nz/system/files/documents/pages/youth-health-workforce-service-review.pdf
Denny, S., Balhorn, A., Lawrence, A., & Cosgriff, J. (2005). Student access to primary health care and preventive health screening at a school-based health centre in South Auckland, New Zealand. N Z Med J, 118(1218), U1561.
Denny, S., Farrant, B., Cosgriff, J., Harte, M., Cameron, T., Johnson, R., . . . Robinson, E. (2012 ). Access to private and confidential healthcare among secondary school students in New Zealand. Journal of Adolescent Health 51(3), 285-291. 10.1016/j.jadohealth.2011.12.020