shale gas water water management consortiums: marcellus and
TRANSCRIPT

1
Shale Gas Water WaterManagement Consortiums:
Marcellus and Barnett RegionsTom Hayes, GTI
GWPC Water/Energy SymposiumPittsburgh, PA
September 27, 2010

2


Challenges Produced Water (PW) comprises >90% of
total waste volume from gas development Produced Water (PW) is at ground zero in
debates over unconventional gas development
Many areas of the U.S. are running out of reinjection capacity (e.g. Rocky Mountain States, Appalacian areas, CBNG basins)
Energy planners and stakeholders need alternatives for PW mgt to avoid constraints to energy production

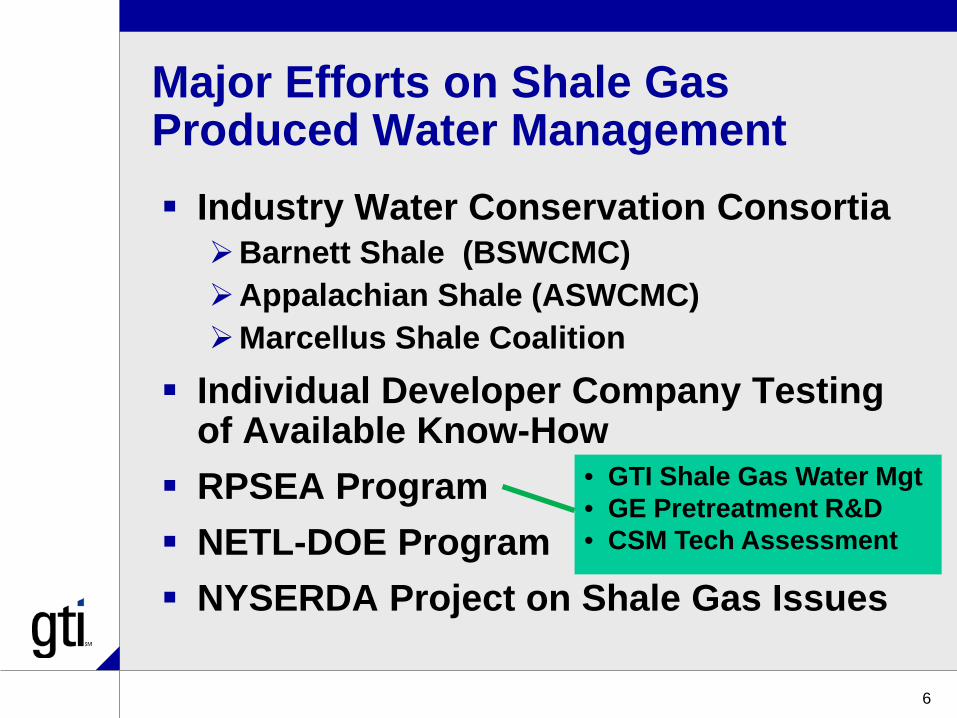
Major Efforts on Shale Gas Produced Water Management Industry Water Conservation Consortia Barnett Shale (BSWCMC)Appalachian Shale (ASWCMC)Marcellus Shale Coalition
Individual Developer Company Testing of Available Know-How
RPSEA Program NETL-DOE Program NYSERDA Project on Shale Gas Issues
5
Major Efforts on Shale Gas Produced Water Management Industry Water Conservation Consortia Barnett Shale (BSWCMC)Appalachian Shale (ASWCMC)Marcellus Shale Coalition
Individual Developer Company Testing of Available Know-How
RPSEA Program NETL-DOE Program NYSERDA Project on Shale Gas Issues
6
• GTI Shale Gas Water Mgt• GE Pretreatment R&D• CSM Tech Assessment
Barnett Shale and Appalachian Shale Water Conservation Committees Demographic Surveys on Water Practices Identification of the Best Opportunity for
Water Conservation Expert Panels on Water Issues and Mgt Defining Water Conditioning Targets Establishing Present Day Best Practices Prioritizing R&D Directions Outreach to Stakeholders
7

Components in Flowback Water
Constituents of Produced Water
Frac Job Additives+

Natural Gas Industry Water Use in the Barnett Shale
Frac Jobs Drilling Other
10%
89%
Total Water Projected Use = 10,905 Ac-Ft(2006 Estimate)
<1%

Water Sources Used in the Barnett Shale for Natural Gas Development
Groundwater Surface Water Reuse and Recycle
<1%43% 56%
Total 2006 Water Use = 10,905 Ac-Ft/yrDaily Use = 9.7 MG

0
500
1000
1500
2005 2010 (Projected)
Mun
icip
al
Stea
mEl
ectr
ic
Irrig
atio
n
Man
ufac
turin
g
Live
stoc
k
Min
ing
Bar
nett
Dril
ling
Ann
ual W
ater
Use
1000
’s A
cre-
Feet
Natural Gas Development
Freshwater Users in the Barnett Shale Region
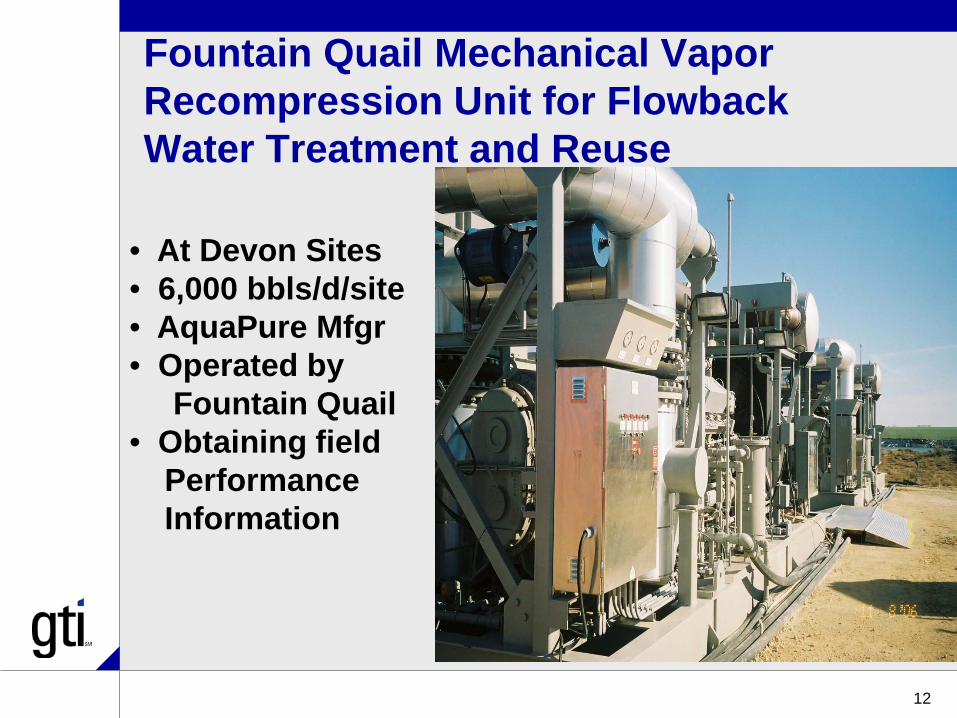
Fountain Quail Mechanical Vapor Recompression Unit for FlowbackWater Treatment and Reuse
12
• At Devon Sites• 6,000 bbls/d/site• AquaPure Mfgr• Operated by
Fountain Quail• Obtaining field
Performance Information

Encana Ultrafiltration

Electrocoagulation Testing
14

Reverse Osmosis Trials in the Barnett

Currently Available Innovative Brine Management Technology Options Fountain Quail (Thermal Processing for
Water Recovery) 212 Resources (Thermal Processing for
Water Recovery) GE Thermal Processing (Thermal
Processing for Water Recovery) Intevras (Heat Recovery from
Compressor Engines for Brine Evap) GeoPure (UF / Reverse Osmosis) Ecosphere Technologies (Ozonation
and Reverse Osmosis)

Example Products from the Consortia Companies Survey Results Water Data from Grab Samples Water Availability Assessment Reports Proceedings of the Frac Job Expert Panel Information from the review of equipment
vendors and solution providers Identified Friction Reducers that Perform
Well at High TDS Levels R&D Planning Reflecting Industry Priorities Website: www.barnettshalewater.org
17

Recent Results from Sampling and Analysis of Flowback Water funded by the Marcellus Shale Coalition

New Data on Sampling and Analysis of Flowback Water Funding from MSC and ASWCMC
Industry Consortia Sampling from 19 locations Initiated and completed in 2009 Includes general chemistry and detailed
analysis of constituents of interest Lists of Constituents of Interest
provided by the USEPA, WV-DEP and PA-DEP
Over 250 determinations performed on samples

Summary of Results Flowback water characteristics are
consistent with ranges observed with conventional produced water
Low suspended solids and TOC Man-made chemicals of concern are at
non-detect levels. BTEX and PAHs are at trace levels. Oils and greases are at non-problem levels,
but some control may be needed Soluble organics are highly biodegradable Heavy metals are lower than in Mun Sludge
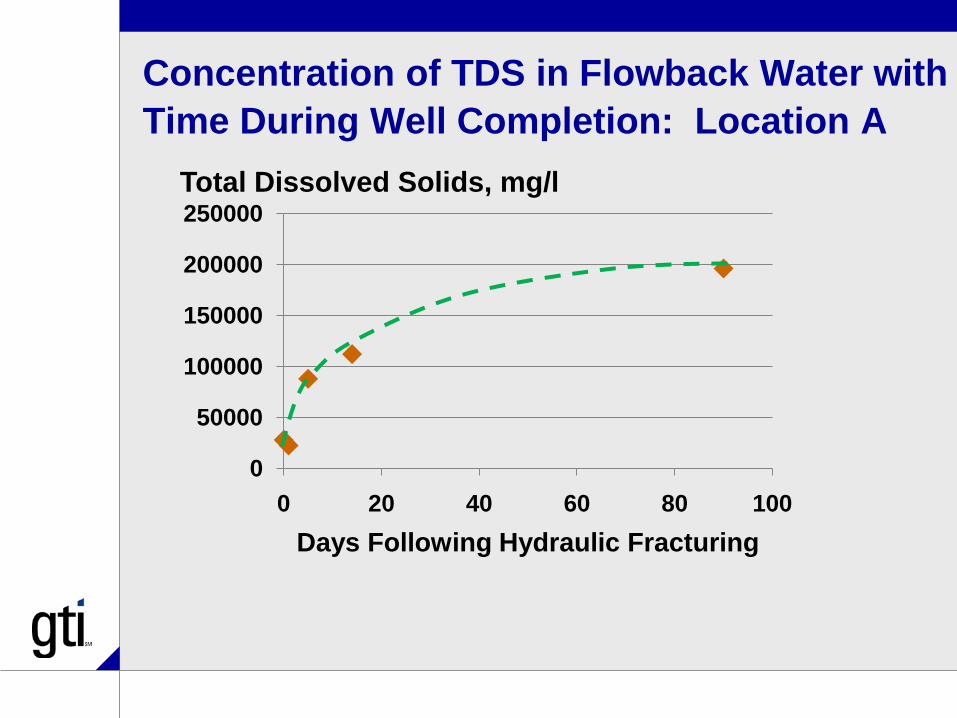
Concentration of TDS in Flowback Water with Time During Well Completion: Location A
0
50000
100000
150000
200000
250000
0 20 40 60 80 100Days Following Hydraulic Fracturing
Total Dissolved Solids, mg/l

Conceptual Example of Salt Concentration Versus Time in Flowback Water Collected with Time During Well Completion
0
20000
40000
60000
80000
100000
120000
0 5 10 15Days Following Hydraulic Fracturing
Total Dissolved Solids, mg/lFlow
Rate
TDS Builds up ---But Flow Rate Decreases.Therefore, early 20-50% of FBWater may be low in TDS
Categories of Chemicals of Concern
Volatile Organics Semivolatile Organics Pesticides Organophosphorus Pesticides PCBs Metals

Summary of Results of Volatiles Measurements in 14-Day Samples
Possible Treatment Needs Brine Volume Reduction with Water
Recovery (for reuse in future frac jobs) Removal of Polymers (Friction Reducer
Compounds) Scale Control (Including NORM Scale) Oil and Grease Control Soluble Organics: Decrease Total
Organic Carbon Control of suspended solids Microbial Control

Well 1
Well 2
Near-WellWater MgtDecisions
Pre-Concentrate
?
ConcentatorAlternatives
ThermalMembranesHybrid
ProcessingEtc.
Final Disposal orUtilization Options
•Deep Well Injection (Class II) of Brines
•Conventional Dispat POTWs
•By-Product Salt Recovery
•Landfill•Ocean Disposal•Etc.
Make-upWater
By-Pass
WaterRecoveredFor Reuse
PretreatOptions
ConditioningOptions
By-PassYes
No
FlowbackWater orPW
In-Field Near-Field Far-FieldWithin 2 mi Within 20 mi Within 200 mi
Generic Flowsheet of Management Options
Blend
Completion

RPSEA Funded Work
Barnett and Appalachian Shale Water Management and Reuse (GTI)
27
Deliverables Database on Shale Gas FB and PW
Compositions Conceptual designs for low TDS FB water
segregation and mgt Guidance Document on best practices for
alternate water source utilization (BEG) Engineering decision tool on mechanical
vapor recompression evaporative treatment processing
Electrically driven processing for low-energy partial demineralization
New Generation of coated membranes for improved UF/NF/RO capabilities (UT)
28
Benefits and Impact to Industry
Reduce industry demand of fresh water for shale gas developments
Ease water availability constraints to well development and completion.
Decrease environmental impacts due to water transportation (i.e. air impacts, fugitive dust, traffic, and carbon footprint)
Reduced cost of water processing for reuse of flowback water for future well completions.
29

For more informationContact Tom Hayes (847.768.0722)Email: [email protected]