shane greenstein and sarit markovich
TRANSCRIPT
2
PRICING EXPERIENCE GOODS IN INFORMATION GOOD
MARKETS: THE CASE OF EBUSINESS SERVICE PROVIDERS
SHANE GREENSTEIN* AND SARIT MARKOVICH**
MARCH 2011
Abstract
We study the pricing strategies of firms providing a service in experience good markets with switching costs. Using data on vendors providing “hosting and related services” at an early stage of the market, we test for pricing distortions that follow from oligopolistic competition with quality uncertainty and switching costs. We find that firms with brand name charge a premium for their product—leveraging the reputation accumulated in closely related markets. As the theoretical literature suggests, we also find that the type of pricing distortions along the product line depends on consumers’ expectations about quality. If consumers underestimate the quality of the product, firms behave as if they discount introductory contracts in order to build trust, and later on markup upgraded contract. In contrast, firms that offer a quality level that is lower than consumers’ expectations markup initial contracts while discounting upgraded ones.
Key words: information goods, pricing strategies, electronic business
JEL: L81, L15, L11
We thank Jim Dana, Chris Forman, Avi Goldfarb, Aviv Nevo, Scott Stern, the editors, anonymous referees, and seminar participants at Tel-Aviv University and Northwestern University for comments. All errors are our responsibility. * Kellogg School of Management, Northwestern University, Evanston, IL 60208. E-mail: [email protected] ** Arison School of Business, IDC Hertzliya, Israel. E-mail: [email protected].
3
1. INTRODUCTION
In the last decade, the term information technology has ballooned to encompass many
aspects of computing and technology. Thinking about the term very broadly, Shapiro and
Varian (1999) define information goods to be anything that can be digitized: books,
music, software and even a phone conversation. One prominent feature of information
goods is that they have large fixed costs of production, and small variable costs of
reproduction. The challenge in pricing then becomes finding a way to sell a service with a
mark-up above cost to a large enough set of consumers, so as to cover those high fixed
costs. Since different consumers may have radically different values for a particular
information good, differential pricing becomes very important. While there are many
forms of differential pricing, one of the most common pricing strategies in information
good markets is quality discrimination, also known as versioning (see Varian 1997). In
this case, producers offer different qualities/versions of the same good for different
prices. Versioning allows consumers to sort themselves into different groups according
to their willingness to pay. Consumers with high willingness to pay choose higher quality
versions, while consumers with lower willingness to pay choose the low quality versions.
Two additional common characteristics make pricing strategies in information good
markets even more complex: (1) Experience goods, and (2) Lock-in. Most information
goods show features of experience goods. In contrast to search goods whose quality can
be determined before purchase, experience goods’ true quality is only learned upon
consumption (Nelson, 1970). Moreover, consumers typically invest time and other
resources in the information product they acquired. These investments make it costly for
the consumer to switch to other alternatives; giving rise to lock-in.
Using data on electronic Business Software Providers (eBSP) in 2001, this paper
studies pricing strategies in an information good market that exhibits quality uncertainty
and switching costs. These estimates allow us to evaluate whether (and which) distortion
patterns predicted in the theoretical literature are realized empirically. Specifically, we
study whether eBS providers charge a premium for brand name, for an existing
relationship, for quality tiers, and whether these premiums vary with the position of the
specific contract within the provider’s product line.
The eBSP market provides a good example in which to observe these effects because
the market is characterized by considerable uncertainty about the value of the service.
During the period of our data, this market was still in the early stages of its development
and only a handful of firms had more than several years’ experience. Furthermore, the
4
market had few normalized procedures for measuring inputs or outputs, and in the eyes
of the participants, had only recently experienced a shake-out affiliated with the dot-com
crash. A typical contract in this market charges a monthly fee for a combination of
hosting services and storefront software. Most eBSPs offer a menu of contracts that vary
in the level of hosting offered and sometimes in the quality of the storefront software.
Storeowners must spend time creating the store, uploading the data and learning how to
use the software. This is a time consuming process and therefore creates high switching
costs.
In an ideal experimental setting, examining pricing distortions in markets with
experience goods requires a panel data observing producers’ behavior over a long period
of time. The unique structure of our data allows us to make progress on understanding
pricing strategies based on a single year dataset. Specifically, most producers in our data
offer a product line and let consumers choose the version of the product most
appropriate for them. While the theoretical literature allows producers to adjust their
prices over time so as to attract different segments of consumers, versioning allows
producers to sell to different market segments at different prices in a single period of
time. We, therefore, regard the pricing of low-end versions to act as first period pricing.
Prices of consequent versions are then considered as pricing in consequent periods.
The economic literature provides different – and sometimes contrasting - theories
for optimal pricing of experience goods. Shapiro (1983) investigates optimal pricing
policy of a monopolist in a two-period model when each consumer learns the true value
of the product through experience. The paper finds that if consumers overestimate the
quality of the product, producers should take advantage of a good reputation and charge
an initial high price. Subsequent periods should be then characterized by a declining
price path followed by a jump up to a terminal price. If, however, consumers
underestimate quality, the optimal way to build reputation is to start with low
introductory prices followed by higher regular prices. Assuming forward-looking
consumer, Bergemann and Valimaki (2006) find that in a mass market, optimal prices
should decline over time. Conversely, in a niche market, optimal prices should initially
be low followed by higher prices that extract surplus from the buyers with high
willingness to pay.1
1 The intuition behind their results is as follows. In an experience goods market, the seller is facing two different submarkets simultaneously: demand of those who already consumed the product and thus learned their preferences and demand from those who are uninformed. Since some consumers are more informed than others regarding the quality of the product, in mass markets the monopolist first skims the more attractive part of the market. This is in contrast to niche markets where the monopolist must offer low initial
5
Switching costs are ubiquitous in information good markets. The way information is
stored, manipulated and communicated typically varies across producers. Consumers
thus bear switching costs when they switch from one information system to another and
consequently may face lock-in. Anticipating a price hike, consumers typically seek an
initial discount or other “carrot” as a compensation for the lock-in. The literature (for a
survey, see Farrell and Klemperer, 2007) offers similar pricing strategies—i.e., initial
introductory prices followed by higher prices—as optimal pricing in the case of high
switching costs.
The economic literature offers contrasting pricing strategies for experience good
markets, some of which differ, and sometimes contrast, optimal pricing strategies in
markets with lock-in. Moreover, the literature on optimal pricing strategies in markets
with experience goods has focused mainly on monopolistic markets. It is not clear,
however, whether the same predictions apply once we introduce competition. We also
examine this open question.
We find that firms with brand name in closely related markets, as expected, charge a
premium for their product. Nevertheless, the existence of previous relationship in a
related, yet different, market does not help with the uncertainty consumers have for the
goods; and thus does not allow for a premium. As the theoretical literature suggests, the
combination of experience good with switching costs encourages firms to discount their
initial contract, so as to attract consumers to try their goods. Firms then take advantage
of the high switching costs, as well as the resolved uncertainty, and markup their top
contracts. While most providers seem to be tilting the whole pricing line in a way that
lowers prices for basic contracts and raises prices of top contracts, an interesting set of
providers in our data set appears to be tilting prices the other way around—i.e., charging
a premium for initial products while discounting top contracts. These providers are
newly founded firms that focus on the eBSP market. While these startups have not
managed to establish a brand name yet, their focus and specialization in the market may
act as a signal of high quality for consumers. Their pricing strategy is then in line with
Shapiro’s (1983) optimal pricing in the case where consumers overestimate the quality of
the good.
We perform two robustness checks. In the first, we examine pricing differences
within portfolios. The results show that firms that offer low quality products have
smaller pricing differences within their product line. This suggests that such firms
prices to capture a larger share of the uninformed consumers at the expense of targeting the more attractive informed segment of the market.

6
cannot mark up their top contracts, and despite the switching costs, a premium would
most likely result in consumers switching to other alternatives. Furthermore, we find
that firms with high level of uncertainty about the quality of their product—e.g., firms
that offer open source—find it hard as well to tilt the pricing of their product line.
The second robustness check looks at firms’ quality choice. We find that, in general,
firms with a brand name tend to choose a quality level that is lower than the average in
the market. These firms have already established their reputation and thus tend to invest
less in quality in comparison to those lacking a reputation. Interestingly, while one
would expect the set of specializing firms discussed above to offer a higher than average
quality, in practice these firms offer an average quality in the market. This finding
supports the hypothesis that consumers likely overestimate the quality these firms offer.
We know of only one paper examining pricing in hosting markets and related areas,
namely, Thompson and Thompson (2006). The authors estimate a hedonic price
equation for a sample of hosting firms gathered from the FastFind Directory. We ask
quite a different question from their study, so our data sets reflect different goals. We
add additional information, in particular with regards to the quality of the storefront
software. Such data is hard to collect, so their data set has more observations than ours,
while we have more depth about our question of interest.
The paper proceeds as follows: Section 2 provides a review of the marketplace.
Section 3 presents our empirical model, while in Section 4 we discuss our data. We
discuss the key results in Section 5, and finally Section 6 concludes.
2. THE EBSP MARKET
We study the e-Business Service Providers (eBSP) market. By 2001, the commercial
Internet had diffused to over half the households in the United States and to virtually all
medium and large businesses—with estimates for retail electronic commerce exceeding
$32 billion a year in the United States.2 This demand grew from almost nothing six years
earlier, most of it in applications of the World Wide Web. eBSPs offer solutions for small
or medium-sized businesses that are interested in creating an online store or in
improving their already existing online storefront. These businesses anticipated the
value of an on-line outlet, but did not have a large set of employees devoted to
information systems operations. Hence, they generally preferred to outsource
2 See e.g., Table 6, U.S. Electronic Shopping and Mail Order Houses (NAICS 454110) for total sales in 2002 in E-Stats, http://www.census.gov/eos/www/papers/2002/2002finaltables.pdf.

7
development activity and operational tasks. Large business users with in-house staff also
may have preferred to hire an eBSP if the needs of the storefront exceeded the
capabilities of the staff.
eBusiness service providers offer a bundle of hosting services (mainly disk space)
and a storefront software which includes a store builder and a store manager. The store
builder helps with creating the online store: designing the store’s layout (usually from a
predefined template) and recording the products characteristics: name, price, picture
and quantity (most store builders require a manual entry of each and every product,
while some offer automatic loading). Once the store has been created, the store manager
software accepts online transactions, calculates taxes, manages quantities and produces
reports.
The monthly fee an eBSP charges depends on the contract’s hosting level as well as
on the quality of the storefront software (hereafter cart). While basic contracts usually
offer a small disk space together with a low quality cart, top contracts typically offer a
large disk space as well as a sophisticated cart. Under the above structure, a small
business that wants to go online but is not sure about its online scale, or about the value
an e-presence can generate for it, can start with the basic contract and only if and when
needed, can upgrade to a better contract with more disk space and a higher quality cart.
One would, therefore, expect to see some self-selection in this market where firms that
have a clear understanding of the value of creating an e-presence would choose more
advanced contracts relative to firms who are uncertain about this value.
Note that, “going online” means that the storeowner has to spend time on creating
the store, uploading the data and learning how to use the software. This is a time
consuming process and therefore creates high switching costs. Moreover, engaging with
an eBSP the consumer is uncertain about the scale of its online store, the scalability of
the contract is very important and therefore a forward-looking user considers the entire
product line offered by the eBSP before choosing a provider.
We observe entrants of three different types. We label them Brand, Relation, and
Specialist. Brand firms, like Microsoft and IBM, have build reputation in other markets
and attempt to extract rents for their promises of reliability, continuity, and quality
service in this experience good market. Relation firms are firms that were in a related
business before entering the eBSP market; typically as an ISP. Relation firms enjoy a
pre-existing relationship with a set of customer to whom they now offer hosting services.
In this situation, the Relation firm offers complimentary services that take advantage of

8
close relationships between the supplier and buyer or of other factors that underlie trust,
which is a valuable factor to some buyers in a market with experience goods.3 The third
set of entrants is a Specialist. Most of these firms are newly founded. They specialize in
all facets of being an eBSP and are typically small firms that develop all their own
software.
The three firm identities coincide with distinct approaches to offering quality. The
vast majority of Specialists focus on offering high-quality solutions, typically
programmed by their own employees. When these firms provide only low-quality carts,
they have little to distinguish themselves from others. In contrast, since the storefront
services are not the core business of the Relation firms, these firms buy a third-party cart
and resell it to their customers. The quality of the carts offered by Relation and Brand
firms varies considerably, depending on the firms’ reselling choices.
The data for this study comes from 2001. By then, market forces had already
eliminated a set of risky (or, perhaps, better characterized as intemperate) approaches to
pricing. For example, during 2000, before the dot-com crash, many providers offered
their basic contract for free and charged a monthly fee only once the consumer chose to
upgrade to a better contract. This strategy was aimed at generating switching costs with
users, with firms gaining revenue later as long as the users remained with their existing
provider. The crash of 2000 appears to have rendered this pricing strategy ineffective or
simply unpopular, as by 2001 the providers who offered free contracts either went out of
business or moved to charging a monthly fee for all contracts.
3. THE EMPIRICAL MODEL
The unit of observation is the contract offered to potential customers. For each contract,
i, we observe a price offered to customers, as well as a vector, Xi, which represents the
features of each contract. We will assume that there exists a function that maps features
into prices. In practice, we might consider a function such as Pi = f(Xiβ) + εi, where ε is
an error term, f is chosen by a set of econometric procedures, and β must be estimated.
Pi is chosen by firm of type τ, where τ can be Brand, Relation, or Specialist. We
observe the vector of characteristics Hi, Qi, where these are contract i's hosting and
3 As Greenstein (2000) shows, ISPs typically offer one or more of the following services: ISP services, Hosting
services, Web-design services and, Maintenance and support services. We focus on the group of providers that offer
many of all four services, focusing specifically on whether they do offer maintenance and support. We capture this
fourth service with the variable phonesupport which we define below. While the group of Relation firms we study may
still differ in their geographical locations, which might affect the type of consumers they face, we have studied this
effect in a previous version of the paper and found that these differences do not affect Relation firms’ pricing behavior.

9
quality of features, respectively. In addition we observe the firm’s choice of cart Ki.
Finally, l is the position of the contract variety within the firm's product line, which we
define subsequently. It will be an ordinal category, such as lowest, highest, or middle
contract within a product line offered by an eBSP. We denote by Nc the total number of
firms that offer a contract variety with an overall similar level of homogeneous features,
c—e.g., memory size and product slots. In general we write the price function as
f(τ,l,Hi,Qi,Ki,Nc), where we treat all these determinants as exogenous. In practice,
empirical data will violate this exogeneity assumption, especially for Nc, which concerns
us less because we treat it as a control. We defer a full discussion until later.
Now we discuss the interpretation of the coefficients. We imagine a two step entry
process, where firms first enter and then compete in prices. From the viewpoint of a firm
in 2001, most of these entry costs are sunk. We think of contract i's cost function as
pertaining to only its variable expenses, while the monetary component of entry costs are
debts the firm tries to pay through pricing above variable costs. For reasons we will
describe momentarily, we write the costs function as C(Hi,Qi,Ki). Hence, we will think of
τ, l, and Nc as contributing to contract i's margins above costs, but not cost levels. In
some situations we can also interpret Qi similarly.4
Clearly, increases in hosting service, Hi, raise both unit costs and prices for a
contract. Hence, a positive coefficient on either variable is uninformative about margins.
In contrast, while it is clear that higher Qi should raise prices, some quality
improvements involve regular operational expenses that affect unit costs. Consequently,
we can attribute margins to quality when those qualitative improvements involve little
operational cost or the costs are largely sunk, as they are for Brand and Specialist
providers.5 Nevertheless, for a Relation firm the cart choice, Ki, shapes a firm’s prices as
well as variable costs, since cart owners may charge licensing fees (except when it is open
source). Hence, a coefficient on carts informs us about price, but not margins.
By a similar line of reasoning, upgrades strategies involve few operational expenses,
so we interpret differences in price levels affiliated with a contract’s position, l, as
indicating differences in margins. Similarly, the level of competition for each contract,
Nc, affects margins, not costs.
4 Note that there was almost no new entry into this market after the dot-com crash. As a result, we do not observe any firms who entered around the time of our survey. Most firms expended the vast majority of their entry costs before we observe them. 5 While the coefficient tells us about which designs generated higher or lower margins for these providers, it will not tell us whether the total incremental improvement in revenues from increasing quality over the next highest level exceeded the cost of designing it.
10
Finally, when interpreting the firm type, τ, we also bring one historical trend to our
interpretation. Most of these firms were not mass market providers. Most Relation firms
and Specialists attempted to target user communities with inelastic demand. In these
cases we associate higher prices for a type of firm with greater margins. We do not expect
low mark-up to support high profitability unless it translates into large market share,
which – based on trade press reports of industry events – few, if any, of these firms
achieved. Judging from news reports, even the Brand firms did not realize such
aspirations. 6
4. DATA
By 2001, the eBSP market contained a large number of providers offering a large variety
of Web solutions, from basic hosting to sophisticated store managers. In this section we
describe the data we collected about these firms.
To build a comparable set of services, we focus on custom Internet solutions
offered to small and mid-sized firms, which offer online transactions in addition to help
with building and managing the storefront. We include only those observations that (1)
offer a store-builder, (2) offer online credit card processing, and (3) do not require users
to have any knowledge in HTML/ XML or any other computer language.
The data collection process was as follows: We first searched Yahoo! and thelist for
listings of providers.7 We then looked at each provider Web site; and for each contract
offered, we collected information on monthly prices, cart’s features and hosting
attributes.8 We kept observations that were complete. In total, we collected data on 433
contracts offered by 145 firms. As a further check, we randomly called a number of
providers to verify the online quotes; we found no discrepancies. We now discuss the
definitions of the variables that determine price.
Firm Type. Firm type was comparatively easy to assess. The few Brand firms that existed
in 2001 were IBM, Microsoft, Yahoo!, and Ameritech. Another prominent branded firm,
Intel, had recently exited. All the Relation firms were regional ISPs from a wide variety of
locations across the United States. There were also a significant number of Specialists.
6 As illustrated by Intel’s high profile exit prior to our data collection. 7 This site, maintained by Meckler Media, provides ISPs the opportunity to advertise their services. The ISPs fill out a questionnaire where the answers are partially formatted; answers are then displayed in a way that allows users to compare different ISP services. 8 Since, in some cases, the pricing quotations advertised on thelist were inaccurate, we disregarded these
quotes and used only the quotations advertised on the providers' Web site.
11
Overall, we have in our data 11 contracts by Brand firms, 394 by Relation, and 33 by
Specialists. In our regressions, we define two dummy variables, Brand and Specialist,
respectively. Relation is omitted.
Hosting Services. Standard contracts provide users (e.g., store owners) with server
space—hosting services. We define the variables Storage and ProductSlots as the
available disk space and the maximum number of product slots allowed in the store,
respectively. Some firms, however, offer contracts with an unlimited, or infinite, amount
of features in either one dimension or both. There were several different but
econometrically equivalent specifications for this feature of contracts. We employ the
following: In case of an infinite amount of storage or product slots, the variable is set to a
somewhat arbitrary number, at a level equal to a step above the highest level in the data.
Then the corresponding dummy variable, that is, InfStorage or InfProdSlots, is set
to one. These arbitrary numbers are 5000 MB for storage and 200,000 for product slots.
Note that since from the store owner’s point of view, the variables ProductSlots and
Storage are complements, a store owner would not value a contract with unlimited disk
space (or, conversely, product slots) but a very small number of product slots (or disk
space) as most of the offered disk space (or product slots) cannot be used.
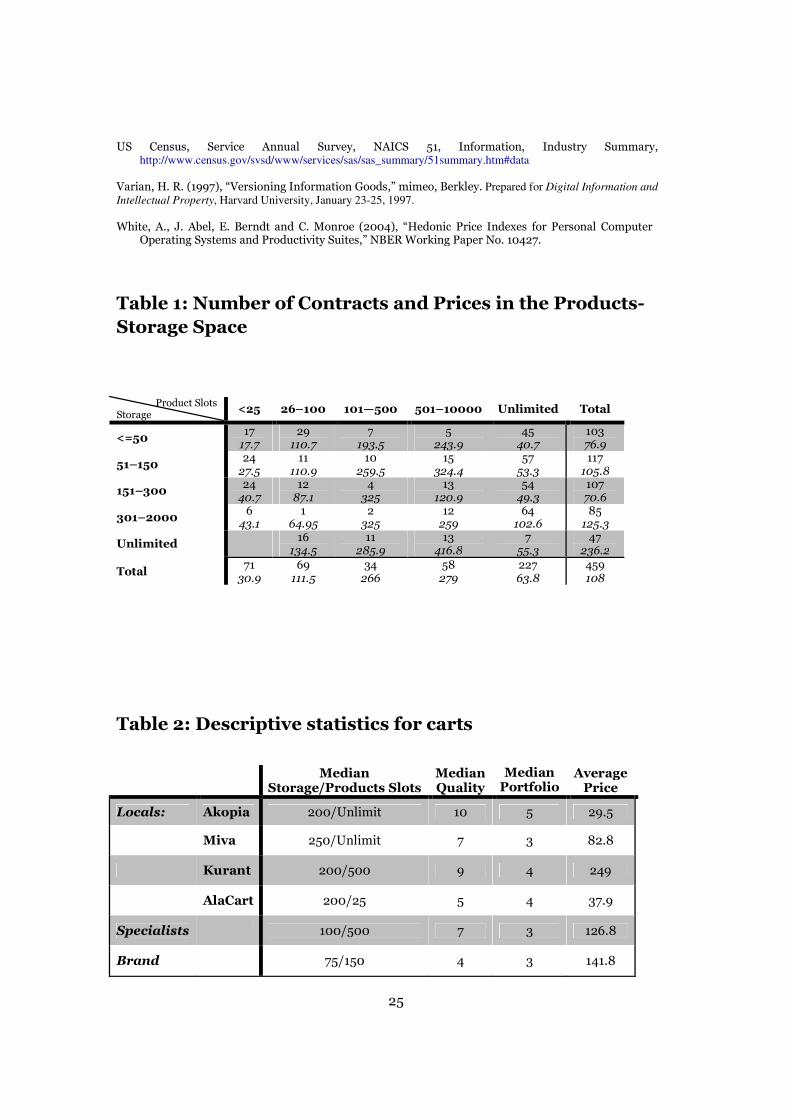
In Table 1, we show the storage–product slot offerings distribution. For each
storage–product slot range combination, the Table gives the number of contracts offered
(top number) and the average monthly price of these contracts (bottom number).
Interestingly, the combinations are spread all over the storage–product slot space.
Furthermore, the Table shows that providers tend to use a limitation on one dimension
of the space (storage or product slots) as a tool to also limit the other dimension. Almost
60% of the contracts in our data limit either storage or product slot space, and of these
more than 80% offer an unlimited, or infinite amount of product slots. Note that 10% of
the available contracts offer an unlimited amount of product slots with a small amount of
storage (less than 50 megabytes, or MB), while there are no contracts that offer
unlimited storage with less than 25 product slots. In addition, note that there is plenty of
variability in the pricing of the contracts, without any notable trend.
-------------------------------------------------------------------------
Table 1 about here
--------------------------------------------------------------------------
12
Quality of Cart. A cart is a combination of a store builder and a store manager and its
quality is directly related to the quality of the store builder and the store manager
software. We found 10 relevant features for an on-line store that are indicative of the
software’s quality: (1) Templates - Different layouts, color schemes, and styles for the
storefront display; (2) Inventory Controls - An inventory manager to prevent backorders;
(3) Shipping Calculator - automatically calculates shipping cost, primarily on the basis of
weight and location; (4) Tax Calculator - automatically calculates the tax on products
shipped within the United States; (5) Customer Reports and Trend Reports - Overviews of
the activity on the store’s site, such as a count of viewed pages, the average number of
pages each visitor looked at, and which sites and search engines referred the visitors to
the site; (6) Transaction Data Exporter - Helps keep track of sales for accounting
purposes; (7) Catalogue Importer - Enables the use of a database, such that the store data
can be uploaded from a file rather than added one by one; (8) Coupons/Discount Creator-
Create coupons for customers to use in the store; (9) Site Search - A search engine for
items on the store’s site; and (10) Tools for Saving User Profiles. The presence of the five
latter features is a symptom of a high-quality cart.
Each cart received one point for the availability of each of these features. In practice,
the variable Quality takes on values between four and ten. We also add one additional
measure of quality. PhoneSupport is a dummy variable that gets a value of one if the
monthly price includes free phone support. Phone support, which many providers charge
extra for, is a very important service for the new online storeowner. If the free phone
support is given only for couple of months PhoneSupport gets the relative fraction of
these months within the first year. To test for different behavior of Specialists, we add
SpecialQual and SpecialPhone, which interacts Specialist with Quality and
PhoneSupport, respectively.
Our data consists of eight different third-party carts and sixteen Specialist carts.
Table 2 gives the distribution of the most common carts9—Akopia, Miva, Kurant and
AlaCart—along the storage, product slots, price, and quality lines. The table shows that,
on average, Relation firms tend to offer more storage than Specialists. This makes sense
given that Relation firms are also active in the hosting business, and consequently are
likely to have lower storage costs than Specialists. Whereas there is dispersion with the
amount of storage offered, with product slots, each third-party firm tends to offer only a
specific range. Specifically, Miva and Akopia only offer an unlimited amount of product
9 Constitute 90% of all observations. The other 10% involve four other uncommon third-party carts.
13
slots, while AlaCart offers contracts with a comparatively low amount of product slots. In
terms of range of cart quality, Table 2 shows that AlaCart is at the low-end, Miva is in the
middle, and Kurant and Akopia are at the high end. The Specialists are found everywhere
along the quality line. Accordingly, we define Akopia, AlaCart, Kurant, and Miva as
dummy variables of the major carts and omit the four small carts. We treat these as
“fringe” suppliers.
-------------------------------------------------------------------------
Table 2 about here
--------------------------------------------------------------------------
Position within Product Line. The switching cost literature (e.g., Farrell and Klemperer,
2007) or the more recent literature on versioning of information goods (Shapiro and
Varian, 1998; Chen and Hitt, 2006) suggests a star prediction. A firm’s price will be low at
the bottom of the product line to attract consumers who will purchase higher margin
products later. In the classic price discrimination model of Mussa and Rosen (1978),
mark-ups at the bottom of the product line are distorted upward to induce purchase at the
top of the product line, where there is monopoly pricing. More recent generalizations by
Rochet and Stole (2002) argue that this effect depends on trade-offs between the
participation constraint and valuation of vertical quality dimension.
We define three variables for the position of a contract within the firm’s product line:
Bottom, Top, and Position. Bottom is a dummy variable for the simplest contract in a
portfolio. Top is a dummy for the highest. Position is a variable number that equals one
for the lowest contract, two for the second, and so on. The variable Portfolio gives the
number of contracts the firm offers. PortBottom and PortTop interact Portfolio with
Bottom and Top, respectively.
Upgrade Path. If firms, indeed, offer introductory prices in order to reduce the cost of
“experiencing” their product, or in order to lock-in consumers; the pricing and attributes
of subsequent contracts would have a key effect on the profitability of such pricing
strategies. One would expect store owners to value product lines that offer contracts with
balanced number of product slots and storage, and would thus expect providers to offer
portfolios of balanced contracts along which users could grow. Actual data, however, seem
14
to defy this expectation.10 As it turns out, a firm’s upgrading path strategy is highly
correlated with its type as well as with the third-party cart the firm offers. Most firms tend
to upgrade along the storage line, in which case the number of product slots stays the
same for all contracts within a portfolio. While high-quality carts like Akopia mostly do
not limit the number of product slots, lower-quality carts like AlaCart tend to fix the
number of available product slots at a low level, in which case the marginal benefit from
additional storage decreases as the available storage increases. Specialists use many
different upgrading strategies; however, they tend to use one specific dimension to limit
the whole space. That is, they upgrade along one dimension while not limiting the second
one.
Given this behavior, we experimented with a variety of specifications for the upgrade
path choice. Because it is the least common, the choice to fix storage levels is difficult to
identify from other behavior. We, therefore, define a dummy variable, Notfixed, to
account for the differences between contracts that are part of a portfolio where one
feature is fixed and contracts that are part of a portfolio in which both features grow.
Competition. Most of the literature on optimal pricing in experience good markets focuses
on monopolistic markets. However, the literature on switching costs suggests that firms
may compete ex-ante for the ex-post market power that comes with lock-in (see Farrell
and Klemperer, 2007 for a survey). Our empirical analysis examines the effect of
competition on firms’ pricing strategies. In particular, firms may have little market power
at the “entry level” end of their portfolios and more at the high end.
As it turns out, firms tend to offer their hosting services at a few modal levels or
ranges. Hence, it is straightforward to define competition at a practical level around scalar
focal points, such as “between 80 and 100 products.” We then define competition around
supply within each storage–product slot box; as is shown in Table 1. In each segment,
firms compete both with contracts offering the same cart as well as with contracts offering
different carts. That is, in general, competition within segments depends on the total
number of contracts within the segment, the total number of firms, as well as the total
number of different carts. We define the following additional variables: marketSize is
10
One interpretation suggested to us was that this represented deliberate attempts at obfuscation by vendors—see, for example, Ellison and Ellison (2005). Another was that this represented a simple marketing strategy to “frame” middle choices, making them appear comparatively more attractive by making the end choices appear to be less attractive. We are agnostic between these and other explanations. As elsewhere, our approach is to characterize this behavior and identify whether it facilitates higher or lower prices, then we discuss the range of interpretations the estimates allow for.
15
the total number of contracts offered within the segment; numCarts is the number of
different carts offered within a segment.
Though each firm treats its rival’s decisions as exogenous, we still face an endogeneity
issue related to an omitted variable. For example, Table 1 shows that the high end of the
space is very crowded. Does the heavy competition on the high end of the product slot
space limit the firms' ability to extract high value? Or does high supply simply reflect the
presence of more users in these segments? The first (second) process supports a negative
(positive) relationship between more competition and prices. In light of these inherent
ambiguities, we interpret the coefficients for these variables with caution.
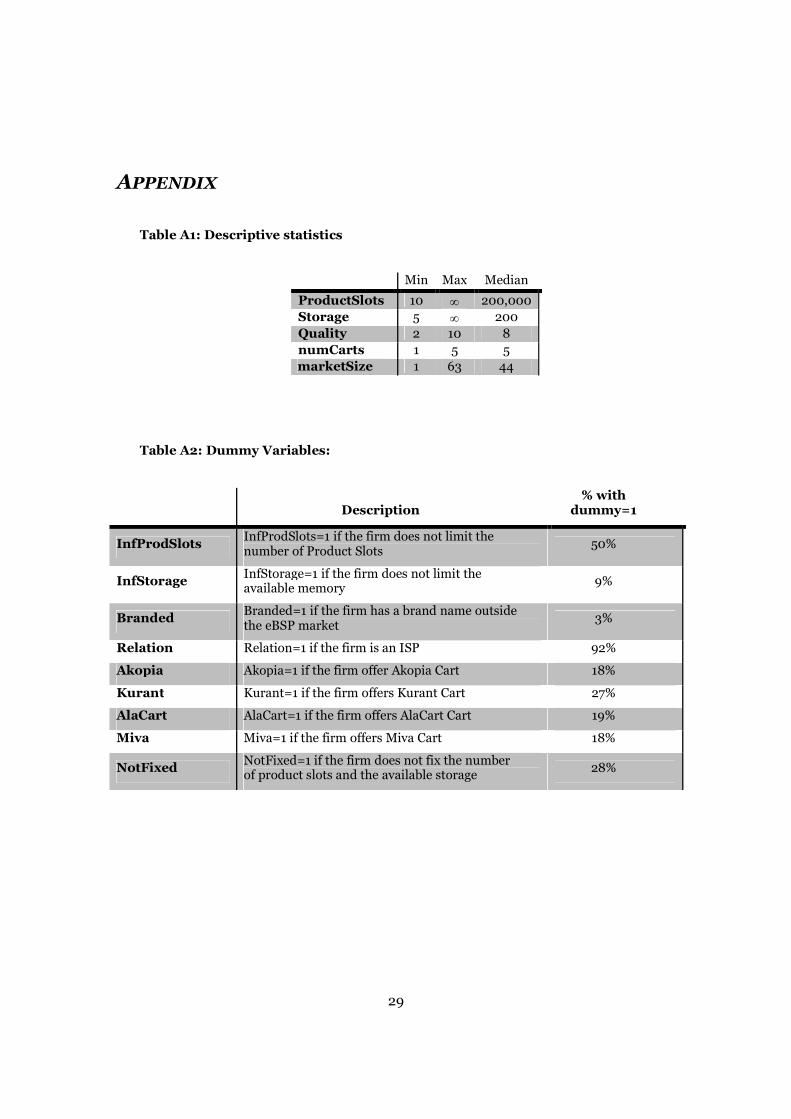
We apply our approach to the menu of prices and characteristics for 433 contracts
offered by 145 firms based in the United States. The appendix provides some descriptive
statistics of our data. Our statistical approach resembles the few other empirical studies
of contracting in technology markets, i.e., we closely examine each contract’s features
and classify these features.11 As in other research where contracting practices have never
before been analyzed, we focus on establishing the statistical regularities and identifying
the underlying economic relationships determining value. In this sense, we also resemble
empirical studies of pricing of other high technology firms.12
5. RESULTS
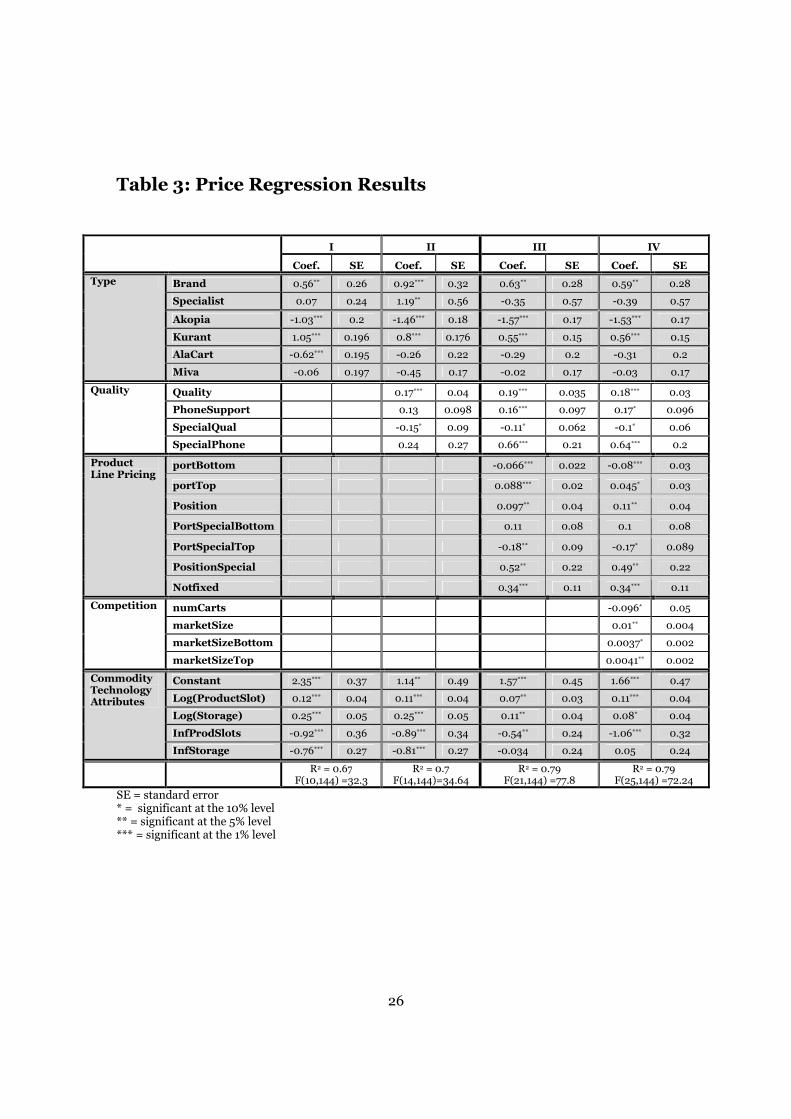
In Table 3, we present four specifications analyzing firms’ pricing strategies. We follow
statistical procedures established by prior researchers (Berndt 1991). For each
specification, we present the Ordinary Least Squares estimators with clustered standard
errors.13 The log of prices is the dependent variable.14 In all our estimates we assume the
right-hand-side variables are statistically exogenous and discuss ways in which violation
of this assumption might shape the interpretation of coefficients.
-------------------------------------------------------------------------
Table 3 about here
--------------------------------------------------------------------------
11 See, e.g., Lerner and Merges’ (1998) study of contracts between venture capitalists and biotech firms or Elfenbein and Lerner’s (2003) study of contracts between Internet portals and their online partners. 12 Much of this dates to Griliches (1961). For recent work see, e.g., White et al (2004) on prices for operating systems, Berndt et al (1995) on prices for personal computer hardware, or Berndt and Rappaport (2005) on pricing of mobile computers. 13
We also estimated a random-effect regression, which was superior to a fixed effect regression by standard tests; however it does not add much over the OLS regression with clustered standard errors. Sometimes the coefficients or standard errors change slightly, but not by much or not in qualitatively important ways. For the sake of parsimony and space, we show only the OLS with clustered standard errors results. 14
Box-cox tests strongly favor the log price specification.
16
The first specification examines the effect of brand name and reputation on firms’
ability to charge a premium in experience good markets; while not controlling for quality
levels or competition. Since hosting services are a commodity, and since many of the
competing firms (mostly ISPs) offer hosting independently of their eBSP offerings, we
include Storage and ProductSlots as controls in the regression. As the results show
Brand firms charge a premium of more than 50 percent on their products. That is, the
high level of uncertainty regarding quality allows firms with brand name and reputation
to charge a premium for the confidence, in terms of quality, they provide. Note that, in
this market, making the right choice is crucial, as choosing a product of low quality would
not only result in high-switching cost but may also affect the user’s brand name in its
market. A poor quality website would not only negatively affect the user’s current sales,
but might affect its reputation and thus its future sales as well.
Of the four common third party carts only Kurant commences a premium. This is,
most likely, because of the third-party brand name the cart has among ISPs together with
its high quality. Note that Relation firms that resell Kurant probably share the premium
with Kurant in licensing revenue,15 so higher prices do not necessarily translate into
higher margins. Akopia and AlaCart have a negative significant coefficient. While
AlaCart’s discount can be explained by its low quality in addition to its lack of reputation,
Akopia offers a very high-quality cart.16 Akopia, however, is an open source and Relation
providers are not charged when they offer it. Moreover, this also means that the providers
cannot as easily give support for the operation of the cart, as ISPs often do not understand
all the source code well enough to be able to solve all problems for their users. This is in
contrast to firms like Kurant which offer support to the ISPs that use them, and thus
enables the ISPs help their customers solve complex problems. Thus, discounting Akopia
might be directly related to the increased uncertainty consumers face when choosing an
Akopia cart.
As mentioned before, Specialists are mostly newly founded firms that specialize in
all facets of being an eBSP. Unlike the Brand and Relation firms which are active in many
other markets—e.g., ISPs, software, search engine—Specialists focus only on the eBSP
market. Whether Specialists can charge a premium for their product or not depends then
on consumers’ expectations. While on one hand these are startups with little reputation,
15
However, the cart vendors were reluctant to share information about their historical licensing practices
with us, so we could not verify what fraction of this premium stayed with hosting firms who resold it. 16 The third column in Table 4 presents the discount/premium a Relation firm can charge due to quality.
17
on the other hand this market is their core expertise. The results show that given this
tradeoff, Specialists indeed do not charge a premium for their product. Nevertheless, as
specification II shows, once we control for quality the coefficient on Specialist becomes
positive and significant. That is, controlling for quality, Specialists charge a premium for
the expertise they offer.
The second specification in Table 3 controls for “observable” quality of the contract.
Based on the ten features described in section 4, we create a measurement for quality
that consumers can observe before purchasing the contract, and can thus reduce the
uncertainty with regards to the quality of the good. In addition, typically consumers feel
more comfortable purchasing an experience good when the firm offers close customer
support. We, therefore, also control in our analysis for whether the firm offers phone
support or not. We interact both variables with Specialist firms and examine whether the
different types of providers charge differently for these features.
As the results in specification II show, the higher the discernible quality of the
product the higher the price firms charge for it. Since higher quality is typically more
costly to produce, the increase in price may just convey the higher costs firms face when
offering higher quality. Interestingly, Specialists charge lower prices on quality. While
this can be related to the uncertainty that comes with startup firms, an alternative
explanation can be actually related to cost. While Relation firms outsource the carts,
Specialists develop the features in house. It is, therefore, reasonable to assume that the
Specialists’ cost of quality is lower; specifically given that this cost is mostly part of their
fixed rather than variable cost. The coefficient on phonesupport is positive but not
significant; both overall as well as when interacted with Specialists.
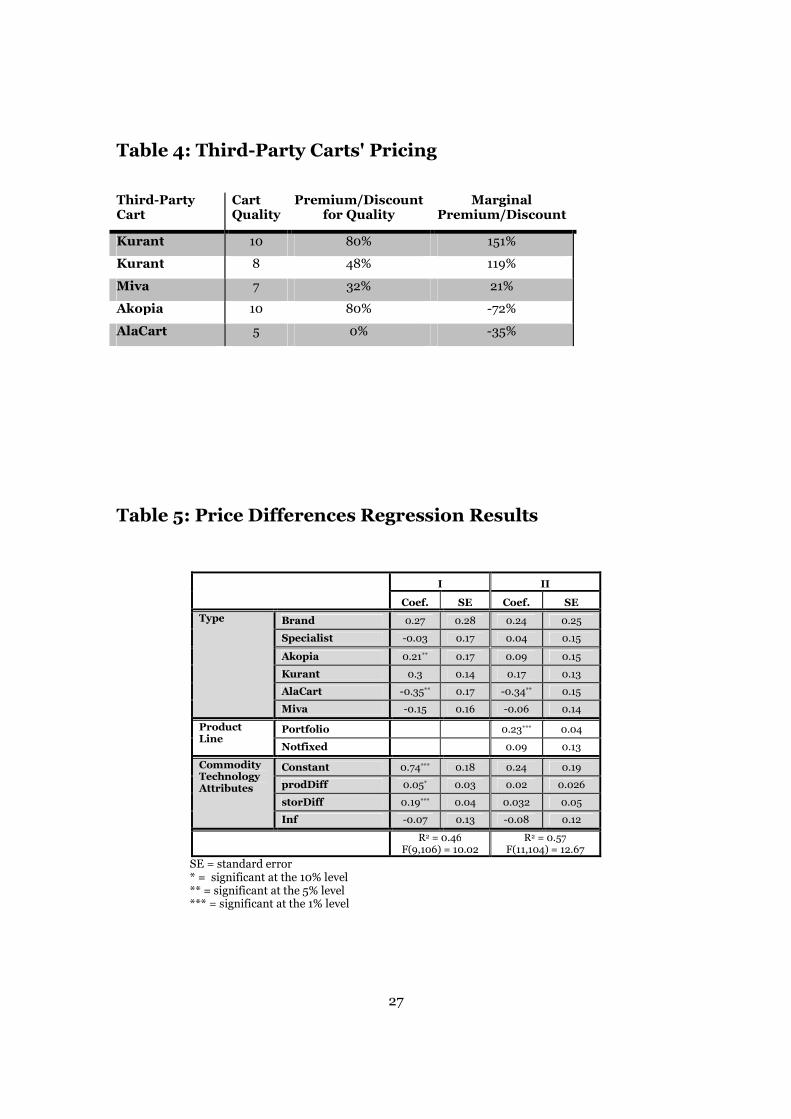
In order to isolate the “brand/quality” effect, we conduct a counter-factual
experiment: How would prices change as an ISP alters its cart choice while not altering
other features? To illustrate this question, we take as a benchmark a Relation firm that
did not engage with one of the more common third-party carts—Kurant, Miva, Akopia or
AlaCart. The median quality offered by such providers is 5. We take this benchmark and
calculate the marginal premium or discount Relation firms can charge by switching to
one of the common third-party carts. The last column in table 4 shows the results.
Kurant offers two carts with two different quality levels. While Relation firms that offer
the higher quality cart can charge a premium of about 150%, offering the lower-quality
cart allows for a premium of 120%. Relation firms offering either of these carts are
pursuing a “brand-name” strategy. Relation firms offering AlaCart, in contrast, are
18
taking a distinct tact—offering a “generic-products” strategy. As a result, such firms must
discount their contracts.
-------------------------------------------------------------------------
Table 4 about here
--------------------------------------------------------------------------
5.1 PRICING STRATEGIES ALONG THE PRODUCT LINE
The third specification in Table 3 adds the effect of ordering and upgrading on a firms'
pricing strategy. PortBottom is negative and significant, PortTop is positive and
significant, and Position is positive and significant. This suggests the following basic
pattern: In line with the theoretical literature, firms discount their initial prices and
charge a premium for their top products. This is consistent with pricing experience
goods as well as pricing goods with switching costs. It is also consistent with the self-
selection behavior discussed above. As consumers get to know the product better,
appreciate better the value an e-presence can generate for them, and once they invested
in learning it, firms increase prices as well as their premium. Interestingly, the more
contracts a firm offers, the lower the initial price and the higher the top price. The
discounts can reach more than 25% for product lines with four contracts, where the
premium for the top contract in these product lines is around 35%. That is, firms seem to
be tilting the entire pricing line in a way that lowers prices for basic contracts and raises
prices of top contracts.
As mentioned in the introduction, Shapiro (1983) finds that whether firms should
initially discount their product and then price it up, or the other way around, depends on
whether consumers over-estimate or underestimate the quality of the product. Since
consumer, most likely, underestimate the quality of carts offered by Relation firms (as
this is not their core competence), the pricing strategy above makes sense for Relation
firms. In the case of Specialists, however, this is not necessarily the case. While, as
startup firms, consumers may have some uncertainty regarding their sustainability, since
the eBSP market is the heart of their business, consumers probably expect Specialists to
develop high quality carts. In order to examine Specialists pricing strategies, we define
the following variables. PortSpecial interacts Portfolio (the number of contracts the
firm offers) with Specialist. PortSpecialBottom and PortSpecialTop then interact
19
PortSpecial with Bottom and Top, respectively. Finally, PositionSpecial interacts
Position (the location of the contract within the product line) and Specialist.17
The coefficient on PortSpecialBottom is positive but not significant and the
coefficient on PortSpecialTop is negative and significant. This suggests that while
Specialists may find it optimal to mark up their initial contract, the uncertainty
consumers have toward startups, together with the lock-in effect stops them from doing
so. Still, combining the effects of PortTop and PortSpecialTop, Specialists discount
their top contracts by almost 10%. This discounting strategy is consistent with the
optimal pricing strategy in Shapiro (1983) for the case where consumers overestimate
the quality of the product. Certainly, this discount may be a result of competition. We
control for competition in the next section, and show that this result is not driven by
competition.
Interestingly, once we control for pricing along the product line, both
phonesupport and SpecialPhone become positive and significant. The premium
charged for these services can be explained by either the confidence customer support
gives consumers, or by the higher costs associated with these services. Finally, Notfixed
is positive and significant, supporting the hypothesis that consumers value an upgrading
path that balances the amount of storage and product slots. Consumers do not want to
pay for storage or product slots they cannot use because of other limitations; therefore,
firms must discount such contracts.
5.2 COMPETITION
The fourth specification in Table 3 presents the results controlling for competition. Both
measures of competition are significant. The coefficient on numCarts is negative, which
suggests that prices decrease as the number of carts offered within a segment increases.
This result is in line with Thompson and Thompson (2008) who find in the hosting
market that, once controlling for quality, firms’ mean price decreases with the number of
their immediate competing neighbors. The coefficient for marketSize is positive and
seems to capture an unmeasured demand effect. The variables marketSizeBottom and
marketSizeTop are the interactions of marketSize with Bottom and Top,
respectively. The coefficient on marketSizeTop is positive and significant. This result is
in line with the premise that firms have more market power at the high end of their
17 Unfortunately, the small number of observations of Brand firms in our dataset does not provide enough variation for us to study Brand firms’ pricing strategies along the product line.
20
product line – once consumers have learned about the quality of their product and also
experience high switching costs. Surprisingly, the coefficient on marketSizeBottom is
positive as well, yet on the border of significance. To better understand the effect of
competition on firms pricing strategies, we look at a "monopolistic market"—a box with
only one contract, and compare it to the most competitive box—a box with sixty-three
contracts and five competing carts.18
The results show that prices in the more competitive box are on average higher by
14% than the monopolistic market. While this result is very surprising on the surface, it is
consistent with our findings in the data description section. While as Bresnahan, Stern
and Trajtenberg (1997) suggest, in an industry with no obvious barriers to entry one
would expect participants to seek out relatively under-populated market segments, we
speculate that crowded product spaces—specifically, the top and bottom of the product
space—are crowded because most users are there. The settings are competitive to some
degree, but we cannot tell how much difference this competition makes. Endogenous
entry means the statistics about the presence of suppliers are more informative about the
size of demand than the competitive intensity of rivalry.
5.3 ROBUSTNESS CHECKS
Pricing within a Product Line. Our focus in the previous section was on differences
across firms. To better understand a firm’s pricing strategy, we next study the difference
of prices within a portfolio. For each firm i, we define
=
i
Bottom
i
Topi
P
PpriceDiff log , where i
TopP
and i
BottomP are the prices of the top contract and bottom contract offered by firm i,
respectively. We run a regression with priceDiff as the dependent variable. This is a
robustness check for our inferences in the hedonic price equation. This new equation has
differenced out unobservables for two contracts coming from the same firm. It is
identified from differences between firms. We define the differences in the product slots
and storage offering in a similar way,
=
i
Bottom
i
Topi
tproductSlo
tproductSloprodDiff log ,
=
i
Bottom
i
Topi
storage
storagestorDiff log . We use as many of the same variables as possible,
18 The competitive segments—boxes—are based on the product-storage space introduced in Table 1.
21
dropping the measurement of competition, which cannot identify any single coefficient
in this specification. Because we want to study price ranges, we look only at firms that
offer portfolios with at least two contracts. The resulting data set includes 116
observations of 116 firms. We present the results in Table 5. This robustness check is
largely consistent with the earlier specifications, though with less statistical significance
due to the smaller number of observations.
In general, given the way firms tilt their prices along the product line, one would
expect Brand firms to have larger price differences within the portfolio, while Specialists
should have smaller price differences. In the first specification, both coefficients have the
right sign, however both are not significant. Of the four third-party carts, only Akopia and
AlaCart have significant coefficients. The coefficient for Akopia is positive, suggesting that
offering an open source, ISPs that offer Akopia indeed tilt their pricing: reducing
introductory contracts in order to attract consumers. Once consumers, however, have
invested in understanding the product and learning how to work with it, these Relation
firms can enjoy some market power and markup their top contracts. On the other hand,
AlaCart’s low quality does not allow its product to be marked-up, even once consumers
experience high costs to switch to other alternatives. As expected, the results in
specification II show that price differences increase with the number of contracts the firm
offers. This effect is large and significant.
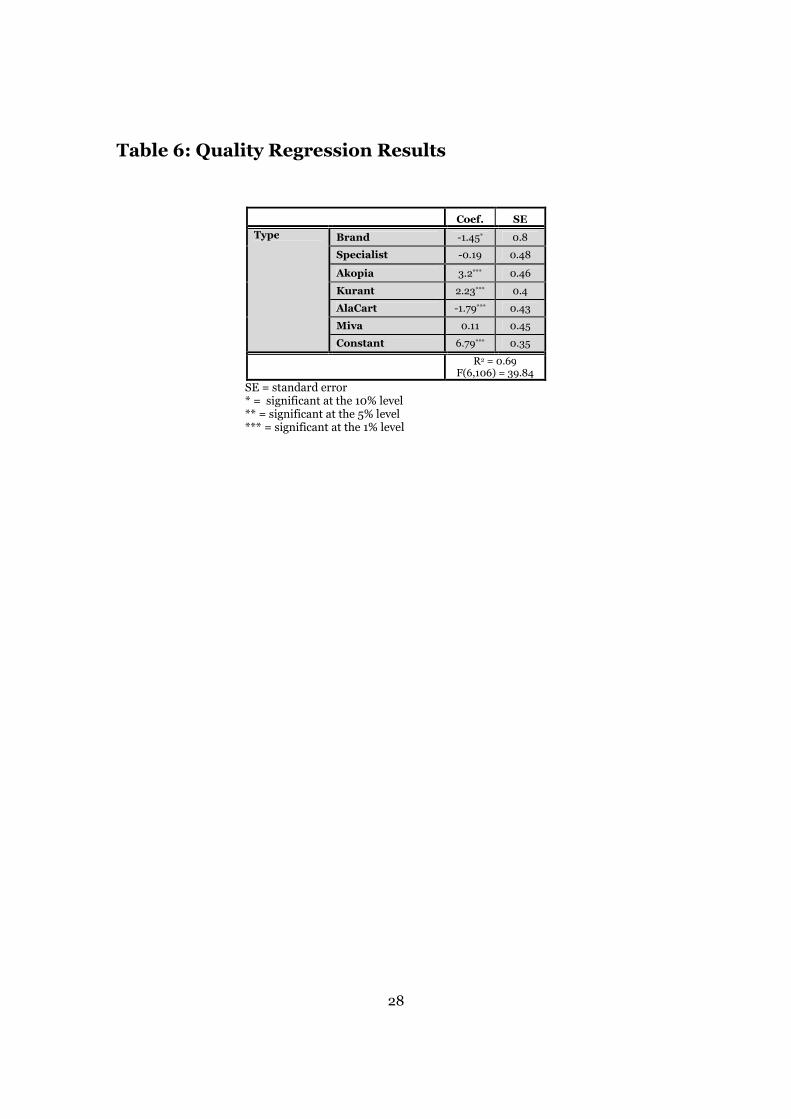
Quality levels. Shapiro (1982) studies firms’ optimal quality decisions in markets where
consumers are imperfectly informed about product quality. Viewing reputation as an
expectation of quality, the paper finds that optimal quality level must lie below the perfect
information quality level. While we cannot test this finding directly, as it is not clear what
is the perfect information quality level in our case, we can test whether firms with brand
name choose quality levels that are lower or higher than the average qualities in the
market. Using the same data as in the price differential regression above, we run a
regression with Quality as the left hand side variable, and firms’ type: Brand, Specialist,
Akopia, Kurant, AlaCart and Miva, on the right hand side. The results can be found in
Table 6.
-------------------------------------------------------------------------
Table 6 about here
--------------------------------------------------------------------------

22
There are no surprises; the coefficient on Brand is negative and significant. This
suggests that Brand firms indeed invest less in quality compared to other participants in
the market. These firms take advantage of the reputation and brand name they have and
expect to attract consumers based on these assets. Specialists’ quality seems to be in line
with the average quality in the market—the coefficient on Specialist is negative but not
significant. Since this market is the heart of their business, one could imagine that
consumers would expect a higher quality from this type of providers. This result then
supports the pricing strategy we observed in the previous section where Specialist markup
their introductory contracts, yet discount their top ones.
There is no uniformity in the quality choice of third party carts. The coefficients on
Akopia and Kurant are positive and significant, while the coefficient on AlaCart is negative
and significant. Note that since Relation firms only resell these carts, we are not interested
in the quality choice of the third-party firms, but rather the cart choice of Relation firms.
Out of the 105 Relation firms in our data, 17 chose Akopia, 28 chose Kurant, 20 chose
Miva and 26 resell AlaCart. That is, more than 40% of Relation firms choose a cart that
offers a higher than average quality. This suggests that, in line with our findings, most
Relation firms suspected that previous relationship with the customer would most likely
not help reduce consumers’ uncertainty in the eBSP market, and thus chose to invest in a
high quality cart.
6. CONCLUSION
Young technology markets typically feature high level of uncertainty as consumers are
not sure about the quality of the products offered. Furthermore, many of these markets
normally exhibit lock-in as consumers have high costs of switching from one firm to the
other. Finally, these markets are mostly characterized by high fixed costs and very low
variable costs. As a result of all these characteristics, pricing in such markets is a
challenge. The theoretical literature offers a variety of optimal pricing strategies. In
particular, versioning—creating different version of the same product—has been found
especially beneficial in allowing consumers to segment themselves and thus choose their
optimal version given their willingness to pay. Firms then must decide how to price their
products along the product line.
We study firms’ pricing strategies in such a young technology market: the eBusiness
Service Providers market, where firms offer a product line of different versions of the
same product. We find that both uncertainties about the quality of the good as well as the
23
existence of switching costs affect the way firms price in this market. Specifically, as
often is the case, brand name in this market can substitute for experience. Firms with
brand name in closely related markets can leverage their brand name and charge a
premium in this market, as their reputation act as a guarantee for reliability. This is the
“you never get fired for buying an IBM” effect. Interestingly, previous relationship in
markets that are not as closely related to the eBSP market, do not provide sufficient
confidence to allow for a premium. In addition, we find that since consumers’ level of
uncertainty regarding the quality of the product is relatively high, firms discount
introductory contracts so as to allow consumers to experience the good and asses its
quality. Firms then take advantage of switching costs and mark up top versions of their
product. In contrast, a set of Specialists firms in our data set tilt prices in an opposite
way: marking up introductory prices, while discounting the top versions of their product.
The theoretical literature offers two different explanations for these types of pricing
strategies. Shapiro (1983) shows that whether a firm should “tilt up” or “tilt down” its
prices depends on consumers’ expectations with regards to the quality of the product.
Alternatively, Bergemann and Valimaki (2006) find that in a mass market, optimal
prices should decline over time, while in a niche market optimal prices should increase
over time. Their definition of niche and mass market depends on the fundamentals of the
industry. One should, therefore, expect to see different pricing policies across different
industry, but not between firms within the same market. Based on their definition,
pricing strategies in the eBSP market should likely follow pricing in mass market: Firms
should discount introductory contracts and markup top contracts. While, indeed, many
firms in this market follow this pricing strategy, there seem to be additional elements
that affect firms’ pricing strategy in this market. Specifically, we believe that consumers
in this market overestimate the quality of the product Specialist offer. It is, therefore,
optimal for these companies to “tilt up” their prices such that they markup introductory
contracts and discount top ones.
24
REFERENCES
Berndt, E. (1991), The Practice of Econometrics—Classic and Contemporary, Addison-Wesley. Berndt, E.R., Z. Griliches, and N.J. Rappaport, 1995. “Econometric estimates of price indexes for
personal computers in the 1990’s,” Journal of Econometrics, 68, pp.243-268. Berndt, E.R., and N.J. Rappaport (2001), “Price and Quality of Desktop and Mobile Personal
Computers: A Quarter Century Historical Overview,” American Economic Review, Vol 91, 2, May, pp 268-273.
Bergemann, D. and J. Valimaki (2006), “Dynamic Pricing of New Experience Goods,” Journal of
Political Economy 114:713–743. Bresnahan, T., S. Stern, and M. Trajtenberg (1997), “Market Segmentation and the Sources of Rents
from Innovation: Personal Computers in the late 1980s,” RAND Journal of Economics, Special Issue, pp.17-44.
Chen, P. Y, and L. Hitt, (2006), Information Technology and Switching Costs,” In Handbook of
Economics and Information Systems, T. Hendershott, ed. Elsevier. pp. 437- 470. Elfenbein, D., J. Lerner, (2003), “Ownership and control rights in Internet portal alliances, 1995-1999,”
RAND Journal of Economics 34, 356–369. Ellison, G., and S. F. Ellison (2005), “Learning about Markets from the Internet,” Journal of Economic Perspectives 19 (2): 139–52.Farrell, J. and P. Klemperer, 2007. “Coordination and Lock-In: Competition with Switching Costs and Network Effects,” Handbook of Industrial Organization, 3. Greenstein, Shane (2000), "Building and Developing the Virtual World: The Commercial Internet Access Market." Journal of Industrial Economics, December. 48 (4):391–411. Griliches, Z. (1961), "Hedonic Price Indexes for Automobiles: An Econometric Analysis of Quality
Change," originally in The Price Statistics of the Federal Government, New York: NBER, 1961. Lerner, J. and R. Merges (1998), "The Control of Technology Alliances: An Empirical Analysis of the
Biotechnology Industry," Journal of Industrial Economics Mussa, M. and S. Rosen (1978), “Monopoly and Product Quality," Journal of Economic Theory, 18:
301–17. Nelson, P. (1970), “Advertising and consumer behavior,” Journal of Political Economy, 78(2): 311-329. Rochet, J. C. and L. Stole (2002), “Nonlinear Pricing with Random Participation,'' Review of Economic
Studies, 69(1): 277-311. Shapiro, C. (1982) "Consumer Information, Product Quality, and Seller Reputation," Bell Journal of
Economics, 13(1), pp. 20-35. Shapiro, C. (1983), “Optimal Pricing of Experience Goods,” Bell Journal of Economics, 14, 497–507. Shapiro, C. and H.R. Varian (1998), "Versioning: The Smart Way to Sell Information," Harvard Business
Review, (November-December). Shapiro, C. and H. R. Varian (1999), Information Rules: A Strategic Guide the Network Economy.
Harvard Business School Press, Boston. Thompson, M. S. and S. Thompson (2006), “Pricing in a Market without Apparent Horizontal
Differentiation,” Economics of Innovation and New Technology. Thompson, M. S. and S. Thompson (2008), “Intra-industry differences in vertical integration,
heterogeneous costs and pricing: the case of web hosting,” Empirica, 35(5): 503-523
25
US Census, Service Annual Survey, NAICS 51, Information, Industry Summary, http://www.census.gov/svsd/www/services/sas/sas_summary/51summary.htm#data
Varian, H. R. (1997), “Versioning Information Goods,” mimeo, Berkley. Prepared for Digital Information and
Intellectual Property, Harvard University, January 23-25, 1997. White, A., J. Abel, E. Berndt and C. Monroe (2004), “Hedonic Price Indexes for Personal Computer
Operating Systems and Productivity Suites,” NBER Working Paper No. 10427.
Table 1: Number of Contracts and Prices in the Products-
Storage Space
Product Slots Storage <25 26–100 101—500 501–10000 Unlimited Total
<=50 17
17.7 29
110.7 7
193.5 5
243.9 45
40.7 103 76.9
51–150 24
27.5 11
110.9 10
259.5 15
324.4 57
53.3 117
105.8
151–300 24
40.7 12
87.1 4
325 13
120.9 54
49.3 107 70.6
301–2000 6
43.1 1
64.95 2
325 12
259 64
102.6 85
125.3
Unlimited 16
134.5 11
285.9 13
416.8 7
55.3 47
236.2
Total 71
30.9 69
111.5 34
266 58
279 227 63.8
459 108
Table 2: Descriptive statistics for carts
Median Storage/Products Slots
Median Quality
Median Portfolio
Size
Average Price
Locals: Akopia 200/Unlimit 10 5 29.5
Miva 250/Unlimit 7 3 82.8
Kurant 200/500 9 4 249
AlaCart 200/25 5 4 37.9
Specialists
100/500 7 3 126.8
Brand
75/150 4 3 141.8
26
Table 3: Price Regression Results
I II III IV
Coef. SE Coef. SE Coef. SE Coef. SE
Type Brand 0.56** 0.26 0.92*** 0.32 0.63** 0.28 0.59** 0.28
Specialist 0.07 0.24 1.19** 0.56 -0.35 0.57 -0.39 0.57
Akopia -1.03*** 0.2 -1.46*** 0.18 -1.57*** 0.17 -1.53*** 0.17
Kurant 1.05*** 0.196 0.8*** 0.176 0.55*** 0.15 0.56*** 0.15
AlaCart -0.62*** 0.195 -0.26 0.22 -0.29 0.2 -0.31 0.2
Miva -0.06 0.197 -0.45 0.17 -0.02 0.17 -0.03 0.17
Quality Quality 0.17*** 0.04 0.19*** 0.035 0.18*** 0.03
PhoneSupport 0.13 0.098 0.16*** 0.097 0.17* 0.096
SpecialQual -0.15* 0.09 -0.11* 0.062 -0.1* 0.06
SpecialPhone 0.24 0.27 0.66*** 0.21 0.64*** 0.2
Product Line Pricing
portBottom -0.066*** 0.022 -0.08*** 0.03
portTop 0.088*** 0.02 0.045* 0.03
Position 0.097** 0.04 0.11** 0.04
PortSpecialBottom 0.11 0.08 0.1 0.08
PortSpecialTop -0.18** 0.09 -0.17* 0.089
PositionSpecial 0.52** 0.22 0.49** 0.22
Notfixed 0.34*** 0.11 0.34*** 0.11
Competition numCarts -0.096* 0.05
marketSize 0.01** 0.004
marketSizeBottom 0.0037* 0.002
marketSizeTop 0.0041** 0.002
Commodity Technology Attributes
Constant 2.35*** 0.37 1.14** 0.49 1.57*** 0.45 1.66*** 0.47
Log(ProductSlot) 0.12*** 0.04 0.11*** 0.04 0.07** 0.03 0.11*** 0.04
Log(Storage) 0.25*** 0.05 0.25*** 0.05 0.11** 0.04 0.08* 0.04
InfProdSlots -0.92*** 0.36 -0.89*** 0.34 -0.54** 0.24 -1.06*** 0.32
InfStorage -0.76*** 0.27 -0.81*** 0.27 -0.034 0.24 0.05 0.24
R2 = 0.67 F(10,144) =32.3
R2 = 0.7 F(14,144)=34.64
R2 = 0.79 F(21,144) =77.8
R2 = 0.79 F(25,144) =72.24
SE = standard error * = significant at the 10% level ** = significant at the 5% level *** = significant at the 1% level
27
Table 4: Third-Party Carts' Pricing
Third-Party Cart
Cart Quality
Premium/Discount for Quality
Marginal Premium/Discount
Kurant 10 80% 151%
Kurant 8 48% 119%
Miva 7 32% 21%
Akopia 10 80% -72%
AlaCart 5 0% -35%
Table 5: Price Differences Regression Results
I II
Coef. SE Coef. SE
Type Brand 0.27 0.28 0.24 0.25
Specialist -0.03 0.17 0.04 0.15
Akopia 0.21** 0.17 0.09 0.15
Kurant 0.3 0.14 0.17 0.13
AlaCart -0.35** 0.17 -0.34** 0.15
Miva -0.15 0.16 -0.06 0.14
Product Line
Portfolio 0.23*** 0.04
Notfixed 0.09 0.13
Commodity Technology Attributes
Constant 0.74*** 0.18 0.24 0.19
prodDiff 0.05* 0.03 0.02 0.026
storDiff 0.19*** 0.04 0.032 0.05
Inf -0.07 0.13 -0.08 0.12
R2 = 0.46 F(9,106) = 10.02
R2 = 0.57 F(11,104) = 12.67
SE = standard error * = significant at the 10% level ** = significant at the 5% level *** = significant at the 1% level
28
Table 6: Quality Regression Results
Coef. SE
Type Brand -1.45* 0.8
Specialist -0.19 0.48
Akopia 3.2*** 0.46
Kurant 2.23*** 0.4
AlaCart -1.79*** 0.43
Miva 0.11 0.45
Constant 6.79*** 0.35
R2 = 0.69 F(6,106) = 39.84
SE = standard error * = significant at the 10% level ** = significant at the 5% level *** = significant at the 1% level
29
APPENDIX
Table A1: Descriptive statistics
Table A2: Dummy Variables:
Description
% with dummy=1
InfProdSlots InfProdSlots=1 if the firm does not limit the number of Product Slots
50%
InfStorage InfStorage=1 if the firm does not limit the available memory
9%
Branded Branded=1 if the firm has a brand name outside the eBSP market
3%
Relation Relation=1 if the firm is an ISP 92%
Akopia Akopia=1 if the firm offer Akopia Cart 18%
Kurant Kurant=1 if the firm offers Kurant Cart 27%
AlaCart AlaCart=1 if the firm offers AlaCart Cart 19%
Miva Miva=1 if the firm offers Miva Cart 18%
NotFixed NotFixed=1 if the firm does not fix the number of product slots and the available storage
28%
Min Max Median
ProductSlots 10 ∞ 200,000
Storage 5 ∞ 200
Quality 2 10 8
numCarts 1 5 5
marketSize 1 63 44