shaping integrated
TRANSCRIPT
INTEGRATEDANNUAL REPORT
2018-19
SHAPING A BETTER WORLDSINCE 1845

INTEGRATED ANNUAL REPORT 2018–19
2
PROOF

3
CONTENTS Message from the Vice-Chancellor
Overview of the University
Vision and Strategy
Strategic Priorities and Enablers
Financial Review
Public Benefit Statement
Corporate Governance
Responsibilities of Senate in respect of the Financial Statements
Independent Auditor’s Report
Statement of Principal Accounting Policies
Consolidated and University Statements of Comprehensive Income
Consolidated and University Statements of Changes in Reserves
Consolidated and University Balance Sheets
Consolidated Cash Flow
Notes to the Accounts
5
8
9
10-23
25-40
43-49
52-55
56
57-58
59-62
63
64-65
66
67
68-91

INTEGRATED ANNUAL REPORT 2018–19
4
PROOF

5
As I reflect on my first year as President and Vice-Chancellor, I am proud of what we have achieved in fulfilling this commitment. Importantly, our achievements have impacted on both society and the economy in Northern Ireland, supporting the communities that we serve. This impact reflects both the strengths of Queen’s and greater partnership and collaborative working.
This new Integrated Report tells the story of the 2018-19 academic year – charting our progress against the University’s strategic priorities and reviewing our operating and financial position. As a University, we have achieved a great deal over the past year and it is important to reflect on our successes.
In this Report, you will read about the significant impact the University makes locally, nationally and internationally and the many achievements of our sta! and our students. You will find out how we have enhanced our global collaborations, strengthened our international reputation and the major role we play in driving the local economy through innovation and, particularly, through our leadership in the Belfast Region City Deal.
This Report also represents a year of continuing challenge with the prolonged absence of an Executive at Stormont and the potential implications of Brexit. The lack of a sustainable higher education funding model for Northern Ireland is a particular problem.
MESSAGE FROM THE VICE-CHANCELLOR
Not only do over 30% of our young people go to Great Britain for their tertiary education funded by the Northern Ireland budget, but only a third return, resulting in a reduction in the pipeline of skilled talent needed to drive our economy.
However, we believe these challenges are opportunities for Northern Ireland and Queen’s is well positioned to respond. During the 2019-20 academic year, we will be developing our new Strategic Plan which will reflect the changing external environment and new opportunities.
In the meantime, we will continue to focus on research excellence and innovation with impact, delivering high-quality teaching and learning, growing our international student numbers and reputation, and ensuring that our social impact is the best possible. In concert, these will drive the economy through innovation and skill and deliver positive social change for the people of Northern Ireland.
Professor Ian Greer President and Vice-Chancellor
Our achievements have impacted on both society and the economy in Northern Ireland, supporting the communities that we serve.
At Queen’s University, we are committed to transforming lives through education, research and social responsibility.

6
PROOF
7
STRATEGICREVIEW

INTEGRATED ANNUAL REPORT 2018–19
8
PROOF
Founded in 1845 as Queen’s College Belfast, one of three Queen’s Colleges in Ireland, it became an independent university in 1908 and is the ninth oldest university in the UK.
Today, Queen’s is one of the top 200 universities worldwide, ranked at 173 (QS World University Rankings 2020). With an annual turnover in excess of £370 million, over 24,000 students and 4,000 sta!, our university plays a unique leadership role in Northern Ireland, contributing £1.9 billion to the UK economy.
As a member of the Russell Group of UK research intensive universities, Queen’s combines excellence in research and education with a student-centred ethos. The University is ranked 8th in the UK for Research Intensity with over 75% of our research assessed as ‘world-leading’ or ‘internationally excellent’ in REF 2014. In research innovation, our impact has been recognised by six Queen’s Anniversary
OVERVIEW OF THE UNIVERSITY
Prizes, the most recent one for our work on cyber security worldwide.
Queen’s is a globally connected and networked University with strategic partnerships across the world, helping us to expand our impact on wider society locally, nationally and globally. Amongst our dynamic partnerships are academic links with leading institutions in America, China, India, the Middle East and Asia.
Ranked 22nd in the world for international outlook, Queen’s is a diverse institution with almost 700 international sta! and over 2,600 international students from over 75 di!erent countries.
The unique and positive impact of Queen’s locally and globally is well recognised and evidenced through our key achievements. It is because of these successes we are able to plan with even more ambition for the future.
Queen’s is one of the leading universities in the UK and Ireland with a distinguished heritage and history.
INTEGRATED ANNUAL REPORT 2018–19

9
PEOPLE AND CULTURE
INFRASTRUCTURE FUNDING AND GOVERNANCE
VISION AND STRATEGY The Corporate Plan 2016-21 provides a roadmap for the development of the University. It sets out strategic priorities and enablers designed to realise the ambition articulated within the University’s vision.
A WORLD-CLASS INTERNATIONAL UNIVERSITY THAT SUPPORTS OUTSTANDING STUDENTS AND STAFF, WORKING IN WORLD-CLASS FACILITIES, CONDUCTING LEADING-EDGE EDUCATION AND RESEARCH, FOCUSED ON THE NEEDS OF SOCIETY.
Our three strategic priority areas are:
These priorities are supported by three key enablers:
EDUCATION AND STUDENTS
RESEARCH INNOVATION AND IMPACT
INTEGRATED ANNUAL REPORT 2018–19
10
PROOF
STUDENT EXPERIENCEDuring the year, new initiatives were introduced to enhance the student and educational experience.
In February 2019, the Students’ Union launched a new campaign, OMNI, to raise awareness of mental health issues facing students.
The University also agreed to develop a new joint student and sta! mental health project which recognises a whole university approach to supporting student and sta! wellbeing.
During the year, the University, along with Belfast HSC Trust and Ulster University, also announced an investment of £150,000 to help enhance mental health services for students living in Belfast.
Through the project, better working systems will be developed between the Belfast Trust mental health services and support and wellbeing services delivered in each of the two universities.
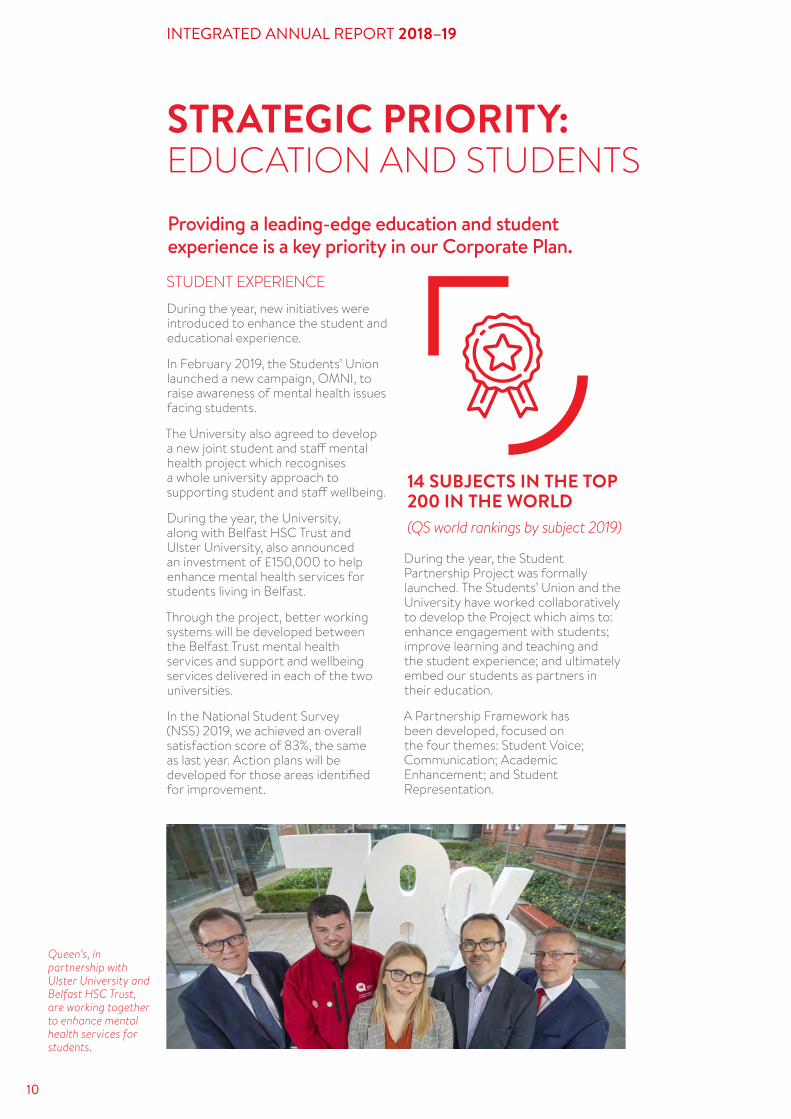
In the National Student Survey (NSS) 2019, we achieved an overall satisfaction score of 83%, the same as last year. Action plans will be developed for those areas identified for improvement.
STRATEGIC PRIORITY: EDUCATION AND STUDENTS Providing a leading-edge education and student experience is a key priority in our Corporate Plan.
14 SUBJECTS IN THE TOP 200 IN THE WORLD(QS world rankings by subject 2019)
During the year, the Student Partnership Project was formally launched. The Students’ Union and the University have worked collaboratively to develop the Project which aims to: enhance engagement with students; improve learning and teaching and the student experience; and ultimately embed our students as partners in their education.
A Partnership Framework has been developed, focused on the four themes: Student Voice; Communication; Academic Enhancement; and Student Representation.
Queen’s, in partnership with Ulster University and Belfast HSC Trust, are working together to enhance mental health services for students.
11
A new cross-disciplinary Liberal Arts degree has been introduced in the Faculty of Arts, Humanities and Social Sciences as well as higher level apprenticeships in Pharmaceutical Analysis, Cyber Security and Software Engineering.
WIDENING PARTICIPATION Queen’s has a strong track record in widening access and ensuring “those who have the ability to benefit from higher education have an opportunity to do so.” The Pathway Opportunity Programme, which o!ers entry to under-represented groups, has now expanded to seven degree pathways with the numbers of students participating increasing to 185.
During the year, widening participation initiatives, such as the Pathway Opportunity Programme, Scholarships, the Homework Clubs and Reading Together project received over £300k in philanthropic support. Welcome bursaries for students from a widening participation background were also provided through the Queen’s Annual Fund.
In 2019, a new Widening Participation Strategy was approved to deliver even greater impact. The Strategy aims to widen participation; raise attainment; contribute to a strong regional skills base; and bridge gaps
There has also been ongoing development of the curriculum to meet the current and future needs of our students and wider society. For example, Royal Society of Biology and Institute of Food Science and Technology accreditation has been achieved for the suite of degrees o!ered by the School of Biological Sciences.
in retention, progression and success to ensure our students enjoy the best possible outcomes, at University and as graduates.
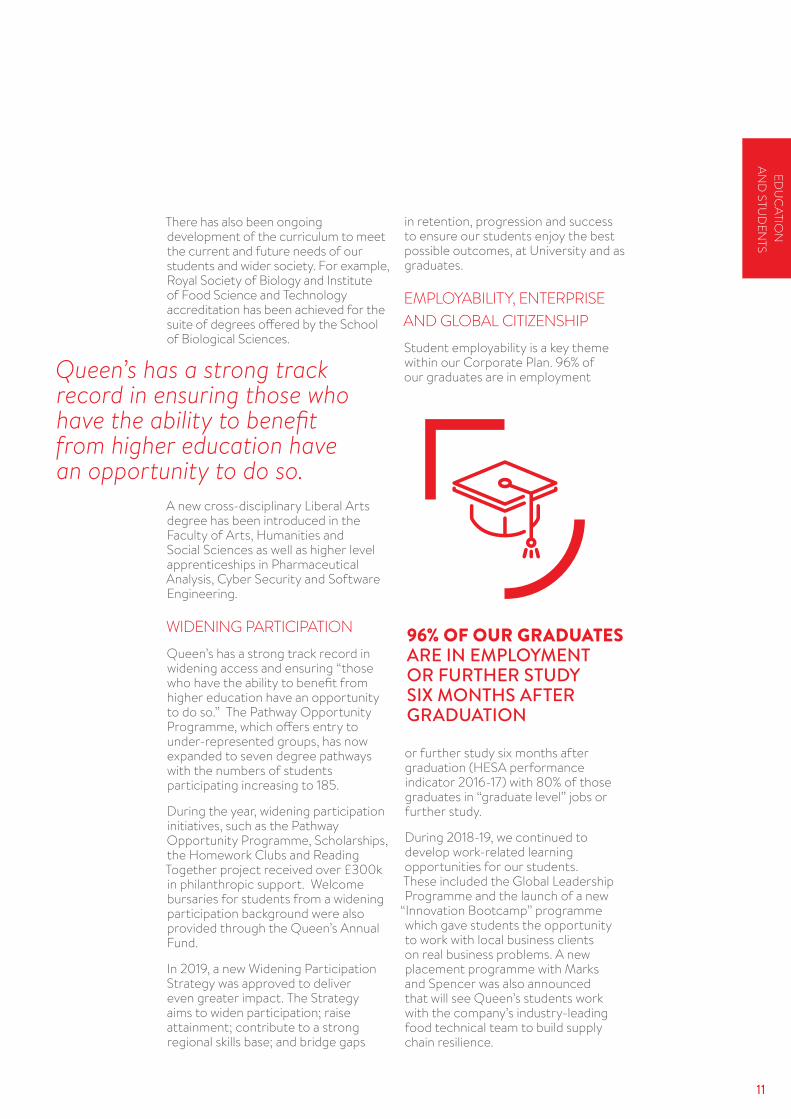
EMPLOYABILITY, ENTERPRISE AND GLOBAL CITIZENSHIP Student employability is a key theme within our Corporate Plan. 96% of our graduates are in employment Queen’s has a strong track
record in ensuring those who have the ability to benefit from higher education have an opportunity to do so.
or further study six months after graduation (HESA performance indicator 2016-17) with 80% of those graduates in “graduate level” jobs or further study.
During 2018-19, we continued to develop work-related learning opportunities for our students. These included the Global Leadership Programme and the launch of a new
“Innovation Bootcamp” programme which gave students the opportunity to work with local business clients on real business problems. A new placement programme with Marks and Spencer was also announced that will see Queen’s students work with the company’s industry-leading food technical team to build supply chain resilience.
96% OF OUR GRADUATES ARE IN EMPLOYMENT OR FURTHER STUDY SIX MONTHS AFTER GRADUATION
EDU
CATIO
N AN
D STU
DEN
TS

INTEGRATED ANNUAL REPORT 2018–19
12
PROOF
This year’s Development Weeks gave students the opportunity to engage in extra-curricular activity and gain Degree Plus accreditation.
Over 120 events and activities took place during the Weeks including the first ever Student Partnership Conference organised in collaboration with the Students’ Union. During the year, over 2,200 students participated in Students’ Union-led employability, entrepreneurial and enterprise activities across a broad range of activity. This included initiatives such as ‘What’s The Big Idea’ competition, Dragon’s Den and the Innovate Her Programme.
Students also took part in international opportunities, including: 25 who visited Toronto as part of the 2019 Queen’s Global Leadership programme; eight who were selected for the prestigious Washington Ireland Program; and over 30 who undertook placements as part of the British Council’s IAESTE (International Association for the Exchange of Students for Technical Experience) programme.
OUR STUDENTSQueen’s is known for providing a rich experience for home students, but also for our growing population of GB and international students.
OUR INTERNATIONAL STUDENT POPULATION
INCREASED BY 11% TO 2,619
WE ARE 22ND IN THE WORLD FOR INTERNATIONAL
OUTLOOK
(Times Higher Education World University Rankings 2020)
In 2018-19, our international student population increased by 11% to 2,619, enhancing the diversity of our campus and city.
During the year, our students continued to show their potential for global impact. A Queen’s Engineering student, Judith Cameron, won the UK Female Undergraduate of the Year award, sponsored by Rolls-Royce while Gift Sotonye-Frank, a PhD student in the School of Law was named the 2019 First Trust Bank Queen’s Student of the Year for her contribution to student life and for being the voice of women students.
Our sta! were also recognised for their teaching achievements with nine Queen’s Teaching Awards presented across five categories. Among the winners were: Dr Gemma Carney – School of Social Sciences, Education and Social Work, Dr Stephen Kelly – School of Arts, English and Languages and Dr Richard Gault – School of Electronics, Electrical Engineering and Computer Science who won the Student-nominated category.
The first twelve students from our Pathway Opportunity Programme to take up a place at Queen’s started their degrees in September 2018.

13
Queen’s is known for providing a rich experience for home students, but also for our growing population of GB and international students.
INTEGRATED ANNUAL REPORT 2018–19
14
PROOF
RESEARCH ENVIRONMENTDuring the year, work continued on the implementation of the University’s Research Strategy 2016-21 which is based on three priorities – creating a culture of research ambition; connecting to tackle global challenges; and fostering a vibrant Postgraduate and Postdoctoral Community.
Considerable progress has been made across the strategic priorities, with Queen’s commitment to the research environment rea#rmed in the launch of an Engaged Research Action Plan in January 2019.
STRATEGIC PRIORITY: RESEARCH Queen’s aims to be recognised globally for the social, economic and cultural benefit we deliver through our research.
ONE OF THE TOP 200 UNIVERSITIES WORLDWIDE, RANKED AT 173
Preparations also continued for the Research Excellence Framework (REF) 2021, the system for assessing the quality of research in UK higher education institutions.
In 2019, the University agreed to become a signatory to the San Francisco Declaration on Research Assessment (DORA), a worldwide initiative aimed at improving the ways in which outputs of scholarly research are evaluated.
During 2018-19, the value of research awards reached £75.5m. Some of the major grants secured this year included:
• £2.3m from the Engineering and Physical Sciences Research Council (EPSRC) for Roadmaps to Zero Net Emissions in Urban Public Transport;
• £2.6m from the Arts and Humanities Research Council (AHRC) for the Creative Industries Cluster Programme; and
• £2.8m from Innovate UK for PathLEAD: Pathology Image Data Lake for Education, Analytics and Discovery.
The University was also one of 25 universities from across the UK to be awarded an Impact Acceleration Account (IAA) by the Economic and Social Research Council (ESRC). The award of more than £1m will support academics using social science-based research to tackle major societal challenges across the world over the next four years.
RESEARCH WITH IMPACT Queen’s research continues to change the lives of individuals and make a di!erence to society worldwide.
Researchers from the Centre of Public Health have found that a sedentary lifestyle is linked to around 70,000 deaths per year in the UK. This amounts to more than £0.7bn per year in costs to the NHS for treating the health consequences.
Computer scientists at the Institute of Electronics, Communications and Information Technology (ECIT) have designed a new innovative system to reduce delays on smart devices.
15
in Bangladesh. This new method also increases the calcium content of rice.
A team from School of Psychology have discovered that many children are su!ering from an undiagnosed developmental condition, which a!ects their ability to learn mathematics. The team carried out research on the prevalence of Specific Learning Disorder in Mathematics (SLDM), also known as dyscalculia.
Queen’s has collaborated in the global Understanding Unbelief programme to advance the scientific understanding
The new system will process data geographically closer to the devices, instead of via “The Cloud”.
Researchers at the Institute for Global Food Security have found a new way to reduce inorganic arsenic in rice by modifying processing methods at traditional, small-scale parboiling plants
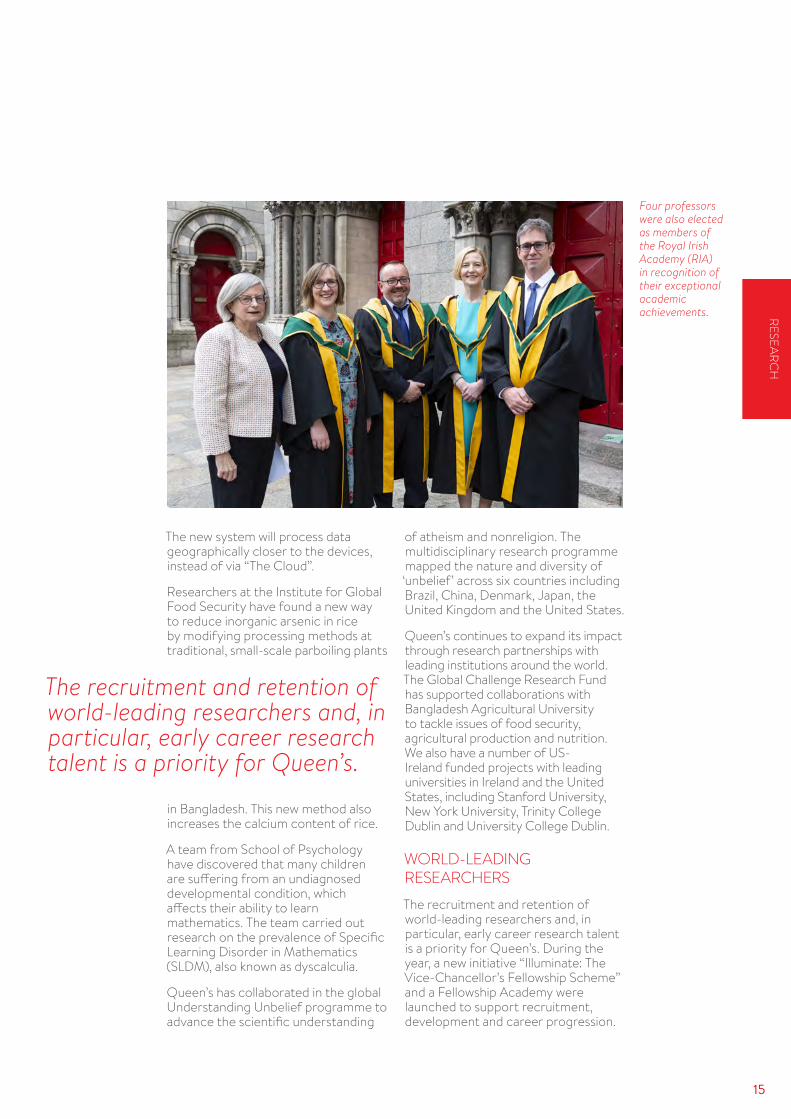
Four professors were also elected as members of the Royal Irish Academy (RIA) in recognition of their exceptional academic achievements.
The recruitment and retention of world-leading researchers and, in particular, early career research talent is a priority for Queen’s.
of atheism and nonreligion. The multidisciplinary research programme mapped the nature and diversity of ‘unbelief’ across six countries including Brazil, China, Denmark, Japan, the United Kingdom and the United States.
Queen’s continues to expand its impact through research partnerships with leading institutions around the world. The Global Challenge Research Fund has supported collaborations with Bangladesh Agricultural University to tackle issues of food security, agricultural production and nutrition. We also have a number of US-Ireland funded projects with leading universities in Ireland and the United States, including Stanford University, New York University, Trinity College Dublin and University College Dublin.
WORLD-LEADING RESEARCHERS The recruitment and retention of world-leading researchers and, in particular, early career research talent is a priority for Queen’s. During the year, a new initiative “Illuminate: The Vice-Chancellor’s Fellowship Scheme” and a Fellowship Academy were launched to support recruitment, development and career progression.
RESEARCH
INTEGRATED ANNUAL REPORT 2018–19
16
PROOF
During 2018-19, the achievements of our academics were celebrated. Professor Stephen Smartt from the Astrophysics Research Centre was awarded the Royal Irish Academy (RIA) 2018 Gold Medal in Physical and Mathematical Sciences, while Professor Máire O’Neill from the Centre for Secure Information Technologies (CSIT) was awarded a Blavatnik Award for her world-class reputation for research and invention in the field of hardware security.
Four professors were elected as members of the Royal Irish Academy in recognition of their exceptional academic achievements:
• Professor Isabel Torres, School of Arts, English and Languages.
• Professor Kieran McEvoy, the School of Law and Senator George J. Mitchell Institute for Global Peace, Security and Justice.
• Professor Moyra Haslett, School of Arts, English and Languages.
• Professor Fearghal McGarry, History at the School of History, Anthropology, Philosophy and Politics
Six academics were also recognised in this year’s Vice-Chancellor’s Research Prizes. They included Professor Helen McCarthy from the School of Pharmacy who won the Research Innovation Prize and the Modern Languages Core Disciplinary Research Group which was awarded the Research Culture Prize.
POSTGRADUATE COMMUNITYThe University has continued to develop a vibrant environment for the postgraduate community which increased to 4,475 during 2018-19. This equates to 28% of the first degree population, approaching the Corporate Plan target of 30%.
This year, we welcomed 20 Early Career Researchers as part of the SPaRK programme, a €3.2m Horizon 2020 funded Marie Skłodowska-Curie
doctoral training programme, which combines ground-breaking research projects with higher level skills development.
Queen’s, along with the University of Glasgow, was also awarded a £4m grant for our EPSRC Centre for Doctoral Training (CDT) to train the next generation of engineers and scientists in data storage. During the year, the University also launched a joint programme with the University of Aberdeen which brings together our environmental research and teaching centres of excellence to deliver a unique PhD opportunity for 100 students.
Throughout the year, the Graduate School continued to support the needs of postgraduate students. This included academic, personal and professional skills development through initiatives such as the Master Your Leadership programme, the Chartered Management Institute Level 7 qualification and the Making Most of Masters programme which is an opportunity for students to undertake work-based placements.
Postgraduate students play a direct role in the development of both the talent pipeline for the region and research collaborations between universities and industry. Key industry partners have included Seagate, Rolls-Royce, Randox and Devenish Nutrition.
OUR POSTGRADUATE COMMUNITY INCREASED TO 4,475 DURING 2018-19

17
The Graduate School continues to support the needs of postgraduate students.

INTEGRATED ANNUAL REPORT 2018–19
18
PROOF
STRATEGIC PRIORITY: INNOVATION AND IMPACT Enhancing and expanding our impact on society is a key priority identified in our Corporate Plan.
The City Deal is made up of 22 integrated projects that each fall within one of three investment pillars and are intended to deliver economic growth with 20,000 new and better jobs.
ECONOMIC IMPACTDuring the year, a major achievement in relation to our research and economic impact was the Belfast Region City Deal. This once in a lifetime opportunity for our City Region will provide substantial investment for infrastructure and innovation to drive the economy. This will bring around £350m in funding from Westminster to develop capacity and capability in some of our key research areas.
The City Deal is made up of 22 integrated projects that each fall within one of three investment pillars and are intended to deliver economic growth with 20,000 new and better jobs. Queen’s and Ulster University are collaborating on the projects that fall within the ‘Innovation and Digital’ pillar. Queen’s is leading the following projects:
• Advanced Manufacturing Innovation Centre (AMIC) which will accelerate new technology developments through the innovation phase and ensure real-world industrial challenges are solved through cutting-edge research.
• The Global Innovation Institute (GII), a cross disciplinary digital innovation hub to deliver innovation and address global challenges in the health, agri-food, IT and fin tech sectors.
• The Institute for Research Excellence in Advanced Clinical Healthcare (i-REACH), a partnership between the NHS, academia and industry to support a competitive, sustainable and high-value Life and Health Sciences sector.
• The Screen and Media Innovation Lab - Jointly led by Queen’s and Ulster University, this project builds on the success that the creative industries have created for NI, already contributing £1 billion GVA to the economy and employing around 26,000 people.
As well as the innovation projects, both institutions are working closely with the FE Colleges to support employability and embed skills.
The opportunities presented through the City Deal recognise the crucial role universities play as economic engines, and the specific impact of Queen’s was highlighted in a commissioned report conducted by London Economics.
The independent report, which looked at our impact in 2015-16, found that Queen’s contributed £1.9bn to the UK economy.
Other highlights included: our research impact which showed that for every £1m invested in research activity at Queen’s, an additional £3.9m is generated across the UK economy; and our teaching and learning impact which generates over £400m in tax income for the Exchequer and £400m in earnings for our graduates.
19
SUPPORT FOR BUSINESSUniversities are crucial in nurturing the skills supply that help businesses scale-up, in providing the ideas that drive new products and services and in creating entirely new businesses.
Queen’s remains a leader in commercial impact. During the year, QUBIS Ltd., our commercial arm, was ranked first in the UK for ‘income generated’ and our commercialisation activity has generated more return than any other UK university.
We are also third in the league of all UK universities for ‘investment received into spin-outs’ placing us in the same cluster as Oxford University, University College London and Imperial College London. This performance was driven by recent investment deals into Causeway Sensors, Titan IC Systems and ReVana Therapeutics.
During 2018-19, four new companies were spun out - Cibus Analytical, VascVersa, FjordStrong and Univ8 Genomics – bringing the number of active companies in Queen’s portfolio to 38.
We remain number one in the UK for our participation in Knowledge Transfer Partnerships (KTPs), engaging with businesses to improve their competitiveness and productivity through the better use of knowledge, technology and skills.
During the year, we reached a collaboration milestone with a portfolio of over 50 live KTPs – our highest ever number and the first UK university to achieve this. Our strong performance was also recognised at the Innovate UK KTP Best of the Best 2019 Awards when the KTP team at Queen’s won ‘Outstanding Contribution from a Knowledge Base KTP Support team’.
The University also continued to support the delivery of a number of key programmes to support businesses, including the Invest NI Design Services Programme and ConnectED.
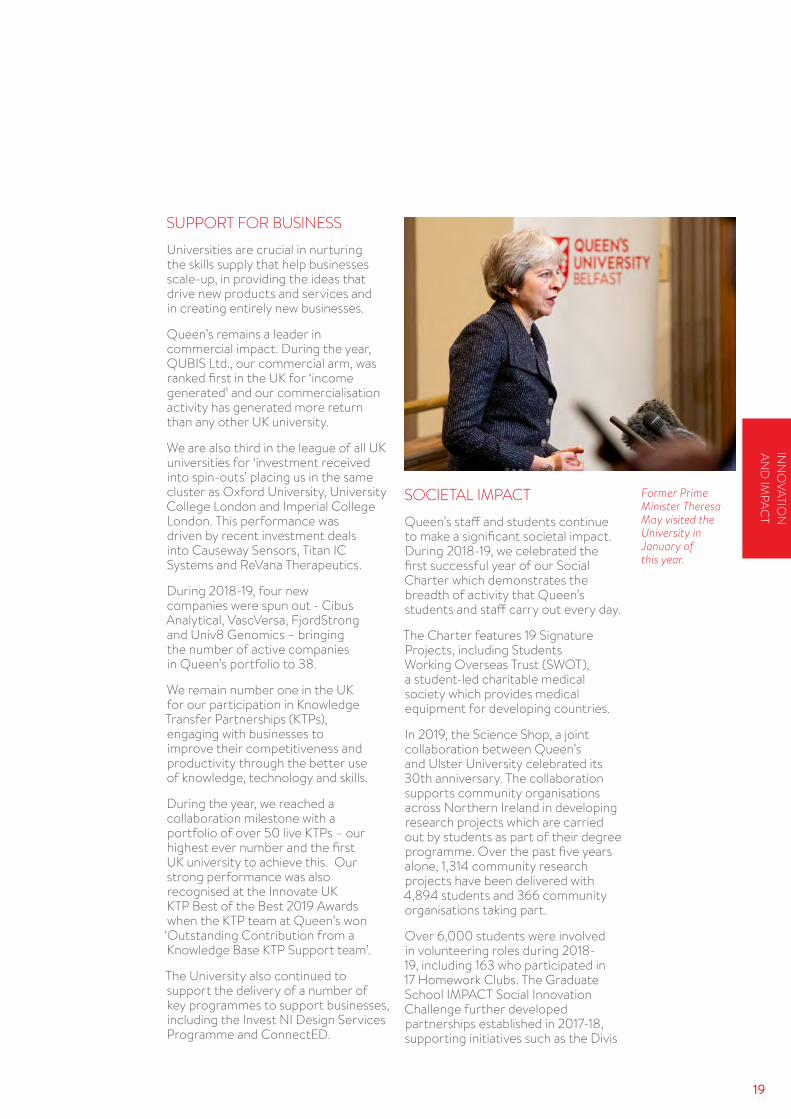
Former Prime Minister Theresa May visited the University in January of this year.
SOCIETAL IMPACTQueen’s sta! and students continue to make a significant societal impact. During 2018-19, we celebrated the first successful year of our Social Charter which demonstrates the breadth of activity that Queen’s students and sta! carry out every day.
The Charter features 19 Signature Projects, including Students Working Overseas Trust (SWOT), a student-led charitable medical society which provides medical equipment for developing countries.
In 2019, the Science Shop, a joint collaboration between Queen’s and Ulster University celebrated its 30th anniversary. The collaboration supports community organisations across Northern Ireland in developing research projects which are carried out by students as part of their degree programme. Over the past five years alone, 1,314 community research projects have been delivered with 4,894 students and 366 community organisations taking part.
Over 6,000 students were involved in volunteering roles during 2018-19, including 163 who participated in 17 Homework Clubs. The Graduate School IMPACT Social Innovation Challenge further developed partnerships established in 2017-18, supporting initiatives such as the Divis
INN
OVATIO
N
AND
IMPAC
T
INTEGRATED ANNUAL REPORT 2018–19
20
PROOF
Bridge mentoring scheme, continued volunteering with Hydebank College and new opportunities with R-City in both Belfast and South Africa.
Our Social Charter commits us to play a leadership role locally and globally and this has included hosting major public events. Key events this year included the symposia at Queen’s with the University of Chicago and at Yale which both focused on conflict resolution and peace building.
The University also hosted events by leading public figures such as the Tánaiste – Simon Coveney; former President of Ireland, Mary McAleese; the speaker of the House of Commons, John Bercow; and Secretary Hillary Rodham Clinton who received an honorary degree in October 2018.
Our academics continue to play a leadership role in the debate on Brexit and on policy issues a!ecting Northern Ireland, which has no regional source of evidenced-based policy. Building on the policy-related work taking place at the University, Queen’s, along with Ulster University, have co-founded a new initiative called ‘Pivotal: Public Policy Forum’ (PPPF). This will enable the University to engage with an ambitious plan of policy-related initiatives and further influence policy in Northern Ireland.
INNOVATION THROUGH COLLABORATION During the year, Queen’s continued to expand its impact on wider society through collaboration with a diverse range of partners. This included the launch of a new Health
120 GLOBAL COLLABORATIONS
6,000 STUDENTS INVOLVED IN
VOLUNTEERING ROLES
50 LIVE KNOWLEDGE TRANSFER
PARTNERSHIPS (KTPS)
Alliance in partnership with Ulster University and Invest NI which aims to improve the health and wellbeing of the citizens of Northern Ireland and boost the local economy. The ‘Health Innovation Research Alliance Northern Ireland’ (HIRANI) brings academia, healthcare and business together to promote collaboration, investment and growth. It will facilitate an increase in commercial research and innovation activity in Northern Ireland by addressing complex barriers to allow the translation of research into tangible patient benefit and value for the economy.
Queen’s and nine other universities across Ireland confirmed their commitment to collaborate, on an all-island basis, across a broad range of research and education initiatives. This includes proposals for a new All-Island Doctoral Training Partnership
- Innovation Lab Ireland - with a focus on innovation. The ten universities will also take forward collaborations around key research themes in partnership with the CBI, IBEC, NI Chamber of Commerce, Enterprise Ireland and Science Foundation Ireland.
The University has over 120 global partnerships. During the year collaborations included an agreement with Tezpur University in India for a joint PhD programme and enhanced links in Medicine and Nursing with the Mohammed Bin Rashid University of Medicine and Health Sciences (MBRU) in Dubai. In 2019, we also celebrated 10 years of INTO at Queen’s, an international education partnership. Since 2009, over 2,000 students have progressed from INTO Queen’s onto university degrees.

21
Secretary Hillary Rodham Clinton who received an honorary degree in October 2018
INTEGRATED ANNUAL REPORT 2018–19
22
PROOF
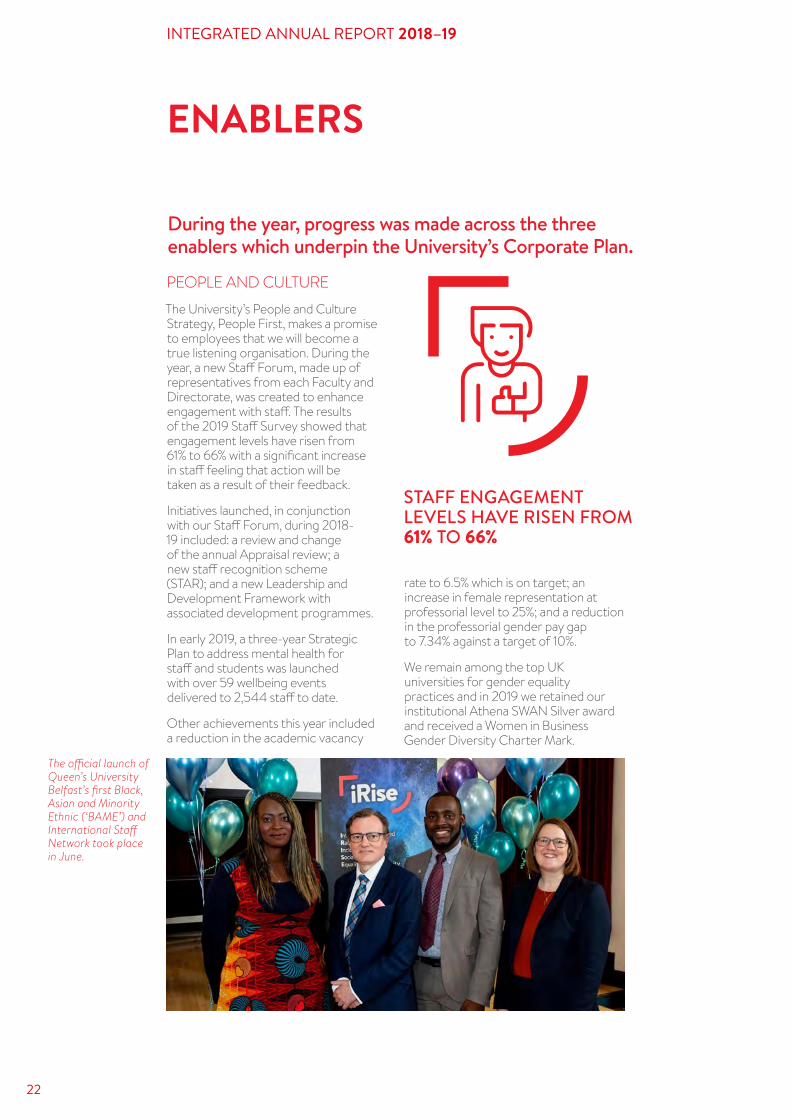
PEOPLE AND CULTUREThe University’s People and Culture Strategy, People First, makes a promise to employees that we will become a true listening organisation. During the year, a new Sta! Forum, made up of representatives from each Faculty and Directorate, was created to enhance engagement with sta!. The results of the 2019 Sta! Survey showed that engagement levels have risen from 61% to 66% with a significant increase in sta! feeling that action will be taken as a result of their feedback.
Initiatives launched, in conjunction with our Sta! Forum, during 2018-19 included: a review and change of the annual Appraisal review; a new sta! recognition scheme (STAR); and a new Leadership and Development Framework with associated development programmes.
In early 2019, a three-year Strategic Plan to address mental health for sta! and students was launched with over 59 wellbeing events delivered to 2,544 sta! to date.
Other achievements this year included a reduction in the academic vacancy
ENABLERS
During the year, progress was made across the three enablers which underpin the University’s Corporate Plan.
STAFF ENGAGEMENT LEVELS HAVE RISEN FROM 61% TO 66%
rate to 6.5% which is on target; an increase in female representation at professorial level to 25%; and a reduction in the professorial gender pay gap to 7.34% against a target of 10%.
We remain among the top UK universities for gender equality practices and in 2019 we retained our institutional Athena SWAN Silver award and received a Women in Business Gender Diversity Charter Mark.
The o!cial launch of Queen’s University Belfast’s first Black, Asian and Minority Ethnic (‘BAME’) and International Sta" Network took place in June.

23
and the conservation and restoration of the iconic Lanyon Building. The £32m Wellcome-Wolfson Institute for Experimental Medicine was o#cially opened during the year as well as the Precision Medicine Centre of Excellence, which will radically change the landscape of modern medicine in Northern Ireland and beyond.
Investment in infrastructure has averaged £50m per annum over the last three years, ahead of the Corporate Plan target (£40m). The investment in our estate has transformed our campus and our world class sporting facilities were showcased in 2019 when the
During the year we also launched iRISE, our first Black, Asian and Minority Ethnic and International Sta! network and held our first cross-faculty Technician Commitment event which celebrated the unique expertise and contribution of Queen’s 240 technicians.
Our alumni networks have also expanded with the establishment of a China Alumni Association Group. Queen’s has over 2,000 alumni throughout China and graduate committees have now been established in the major cities of Beijing, Shenzhen and Shanghai. During the year, our alumni also attended events in the US, India, Singapore and Kula Lumpur.
INFRASTRUCTUREProviding world class education and research facilities for our students and sta! is a key Corporate Plan aim, and a Capital Development Plan for the period 2018-23 was approved by Senate in June 2018. Key projects completed this academic year included a new School of Biological Sciences
Irish Rugby team held an open training session at Queen’s Sport Upper Malone.
The University has also invested in its digital infrastructure and during 2018-19, the phased roll-out of Canvas, our Virtual Learning Environment, continued with the creation of 177 academic modules and 600 sta! and 5,000 students currently using Canvas. The full roll-out took place in September 2019.
The £32m Wellcome-Wolfson Institute for Experimental Medicine was o!cially opened during the year.
Providing world class education and research facilities for our students and sta" is a key Corporate Plan aim.
During the year, we continued to enhance the environmental sustainability of our estate. The University successfully reduced its carbon emissions to 22,000 tonnes, ahead of the Corporate Plan target and was named among Northern Ireland’s top companies for environmental leadership, achieving platinum status in this year’s NI Environmental Benchmarking Survey. We also received a prestigious Green Flag Award – the benchmark national standard for parks and green spaces in the UK and became the first organisation to achieve GOLD standard in Cycling UK’s Cycle Friendly Employer accreditation.
FUNDING AND GOVERNANCEProgress in this area is covered in the financial review section.
ENABLERS

INTEGRATED ANNUAL REPORT 2018–19
24
PROOF

25
FINAN
CIAL REVIEW
FINANCIAL REVIEW
INTEGRATED ANNUAL REPORT 2018–19
26
PROOF
An unrealised gain of £35.0m on our investments and investment properties was generated. Of this total, some £27.6m relates to an increase in the market value of the Group’s shareholding in Kainos Group plc.
The overall SOCI for the year is a loss of £38.3m and this compares to a comprehensive income position of £93.3m for 2017-18.
Whilst the balance sheet has been significantly impacted upon by the 2017 actuarial valuation in respect of the USS, the net assets position remained strong at £527.5m.
Financial sustainability continues to underpin the delivery of the Corporate Plan 2016-2021. E!ective governance and strong financial performance is critical to the success of Queen’s and we are well positioned to meet the challenges facing the sector which include a structural funding deficit; the export of NI school leavers to GB; pension deficits; and Brexit.
A summary of the key financial highlights for 2018-19 is set out in the adjacent page.
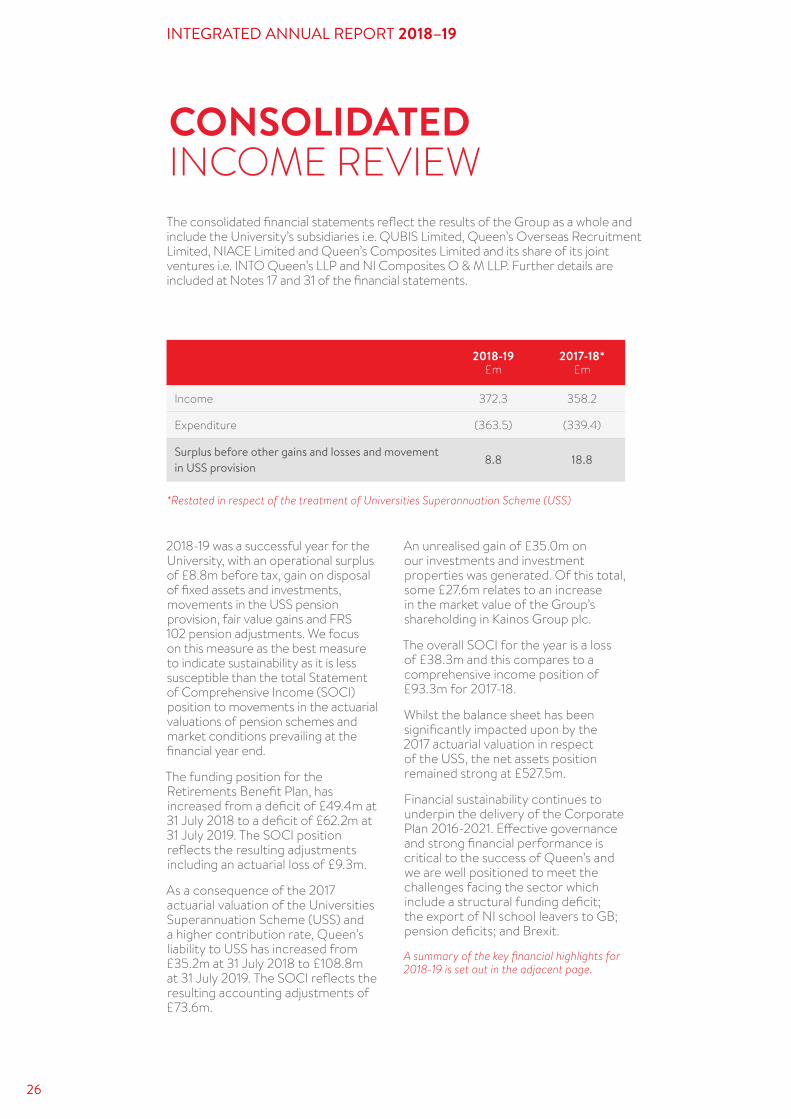
2018-19 was a successful year for the University, with an operational surplus of £8.8m before tax, gain on disposal of fixed assets and investments, movements in the USS pension provision, fair value gains and FRS 102 pension adjustments. We focus on this measure as the best measure to indicate sustainability as it is less susceptible than the total Statement of Comprehensive Income (SOCI) position to movements in the actuarial valuations of pension schemes and market conditions prevailing at the financial year end.
The funding position for the Retirements Benefit Plan, has increased from a deficit of £49.4m at 31 July 2018 to a deficit of £62.2m at 31 July 2019. The SOCI position reflects the resulting adjustments including an actuarial loss of £9.3m.
As a consequence of the 2017 actuarial valuation of the Universities Superannuation Scheme (USS) and a higher contribution rate, Queen’s liability to USS has increased from £35.2m at 31 July 2018 to £108.8m at 31 July 2019. The SOCI reflects the resulting accounting adjustments of £73.6m.
The consolidated financial statements reflect the results of the Group as a whole and include the University’s subsidiaries i.e. QUBIS Limited, Queen’s Overseas Recruitment Limited, NIACE Limited and Queen’s Composites Limited and its share of its joint ventures i.e. INTO Queen’s LLP and NI Composites O & M LLP. Further details are included at Notes 17 and 31 of the financial statements.
CONSOLIDATED INCOME REVIEW
2018-19 £m
2017-18*£m
Income 372.3 358.2
Expenditure (363.5) (339.4)
Surplus before other gains and losses and movement in USS provision 8.8 18.8
*Restated in respect of the treatment of Universities Superannuation Scheme (USS)

27
NOTES
Increase in International Student Income
International student fee
income (full and part-time) increased by £4.3m (14%)
during 2018-19
14%
OperationalSurplus is 2.4%
Surplus as a percentage of income reduced
from 5.2% in 2017-18 to 2.4 %. (Note 1)
2.4%
Income from Research Grants and Contracts
Income from research grants and contracts, remained in line with
2017-18
£91.7m
Growth in Income from Non-Government Sources
Income from non-government sources has increased year on year
by 5% (Note 2)
5%
Expenditure on Core Estate
Expenditure on core estate represents 3.7% of the
Insurable Replacement Value. This compares to 4.9%
in 2017-18
3.7%
Sta! Costs % of Income
Sta! costs represent 57% of income which is in line with
the position for 2017-18(Note 3)
57%
1. Surplus is prior to the movement in the USS provision, the fair value gain on investments and the actuarial adjustment in respect of the Retirement Benefits Plan (RBP) and the Universities Superannuation Scheme (USS)
2. Non-Government income sources exclude recurrent funding from the Department for the Economy (DfE) in respect of teaching, research and specific grants including the Postgraduate Award Scheme.
3. Sta! Costs exclude the movement associated with the USS Pension Scheme.
FINANCIAL HIGHLIGHTS 2018-19
CO
NSO
LIDATED
IN
CO
ME REVIEW
INTEGRATED ANNUAL REPORT 2018–19
28
PROOF
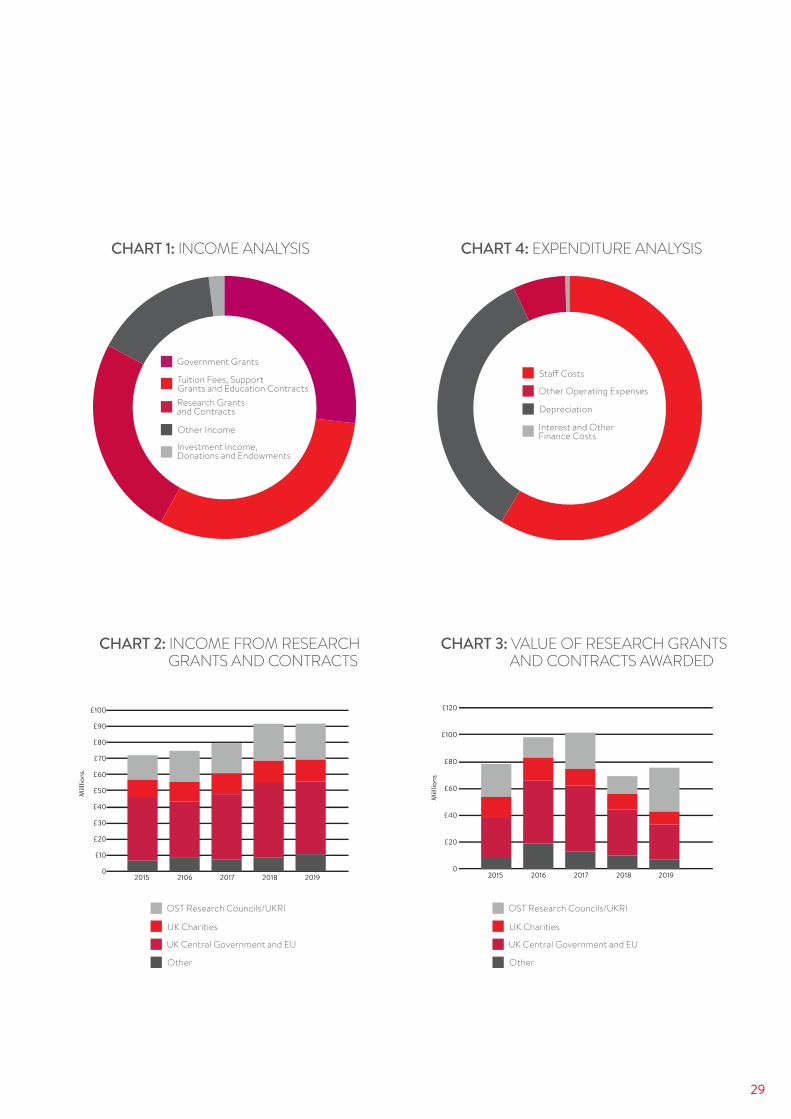
INCOMETotal income for the year was £372.3m, representing an increase of £14.1m (4%). The main components of this income are shown in Chart 1.
Funding from Government increased marginally from that received in 2017-18 and includes the allocation from the Department for the Economy (DfE) of additional non recurrent qualitative research (QR) funding of £2.7m which has been earmarked to support the implementation of the Illuminate Vice-Chancellors Fellowship Scheme.
EXPENDITURETotal expenditure for the year, excluding the adjustments in respect of the USS pension deficit, was £363.5m, representing an increase of £24.1m (7%). The main components of expenditure are shown in Chart 4.
Sta! costs, excluding the impact of the USS Pension provision, increased by £18.8m (10%) mainly as a result of a reduction in the level of vacant posts and reflects the annual pay awards and incremental progression.
Queen’s sta! costs excluding the costs associated with USS pension deficit, represented 57% of income in 2018-19, compared to the average for the Peer Group in 2017-18 of 53% and the average number of sta! increased to 4,187. Other operating expenditure increased by £4.3m (4%), largely due to increased expenditure on consumables and laboratory equipment; equipment maintenance and utilities.
Depreciation costs increased year on year by £1.9m in line with the Capital Development Plan.
TOTAL INCOME FOR THE YEAR WAS £372.3M, REPRESENTING AN INCREASE OF £14.1M (4%)Income from tuition fees and education contracts increased by £6.6m (6%). Of this total, international tuition fee income increased by £4.3m or 14%.
As set out in Chart 2, whilst research income remained broadly in line with the previous year at £91.7m, research awards increased year on year from £69.3m to £75.5m. In line with our Research Strategy, there was an increase of £24.4m in awards from UKRI, as set out in Chart 3 with reductions in awards from other sources including UK Central Government and the EU.
29
CHART 1: INCOME ANALYSIS
CHART 2: INCOME FROM RESEARCH GRANTS AND CONTRACTS
CHART 4: EXPENDITURE ANALYSIS
Investment Income, Donations and Endowments
Other Income
Research Grants and Contracts
Tuition Fees, Support Grants and Education Contracts
Government Grants
OST Research Councils/UKRI OST Research Councils/UKRI
Other Other
UK Central Government and EU UK Central Government and EU
UK Charities UK Charities
Interest and Other Finance Costs
Depreciation
Other Operating Expenses
Sta! Costs
0
£20
£40
£60
£80
£100
£120
20192018201720162015
0
£10
£20
£30
£40
£50
£60
£70
£80
£90
£100
20192018201721062015
Milllions
Milllions
0
£20
£40
£60
£80
£100
£120
20192018201720162015
0
£10
£20
£30
£40
£50
£60
£70
£80
£90
£100
20192018201721062015
Milllions
Milllions
CHART 3: VALUE OF RESEARCH GRANTS AND CONTRACTS AWARDED
INTEGRATED ANNUAL REPORT 2018–19
30
PROOF
GAIN ON DISPOSAL OF FIXED ASSETS AND INVESTMENTSIn 2018-19, a gain of £0.1m was realised as a consequence of the disposal of the Group’s holdings in TruCorp Limited in 2016-17.
The comparable figure for 2017-18 of £2.1m related to the disposal of an element of the Group’s shareholding in Kainos Group plc.
FAIR VALUE GAIN ON INVESTMENTS AND INVESTMENT PROPERTYThe fair value gain on the Group’s assets and investments at 31 July 2019 resulted in an unrealised benefit of £35.0m within the SOCI.
Of this total, £27.6m related to the increase in the market value of the Group’s holding in Kainos Group plc.
The balance relates, in the main, to an increase in the market value of the General Investment Fund.
ACTUARIAL ADJUSTMENT IN RESPECT OF PENSION SCHEMESThe funding position of the Retirement Benefits Plan (RBP) Pension Scheme, as measured in line with accounting requirements, has increased from a deficit of £49.4m at 31 July 2018, to a deficit of £62.2m at 31 July 2019.
Under FRS 102, the SOCI includes the resulting actuarial adjustment of £9.3m for the year.
UNIVERSITIES SUPERANNUATION SCHEME (USS)The March 2017 valuation of the USS identified a funding deficit of £7.5bn, this compares to a funding deficit of £5.3bn based on the 31 March 2014 actuarial valuation. Furthermore, the scheme actuary determined that significant deficit contributions would be required to make good the funding gap -5% deficit contributions in 2017 compared with 2.1% deficit
contributions in 2014.
The combined impact of a deterioration in the funding position and a higher contribution rate has resulted in a much larger liability for all participating employers to recognise in their financial statements. For Queen’s, this equates to an estimated increase in the USS liability of £73.6m from £35.2m at 31 July 2018 to £108.8m at 31 July 2019.
Under FRS 102, the SOCI reflects the resulting accounting adjustments of £73.6m for the year.
BALANCE SHEETThe University had total consolidated net assets of £527.5m as at 31 July 2019. Whilst this represents a reduction of £38.3m from the prior year, as a consequence of the USS deficit, the net asset position remains strong.
THE UNIVERSITY HAD TOTAL CONSOLIDATED NET ASSETS OF £527.5M AS AT 31 JULY 2019
This reflects the significant investment in the capital programme over the last decade; the investment portfolio; the strong liquidity position of the University, and its e!ective working capital management processes, in particular, the robust control of debtors.

31
The total level of realised unrestricted reserves is £160.5m, which are ring fenced by Faculties and Professional Services to support delivery of the Corporate Plan 2016-2021 and the capital development programme.
CAPITAL AND LONG TERM MAINTENANCEQueen’s vibrant campus continues to be transformed, expanding an environment that stimulates, enables and supports world-class education and research.
Significant capital expenditure has continued across the entire University in terms of new build and major refurbishment of the existing estate. The total projected cost of authorised building projects is currently in the region of £189.6m.
These projects will maintain the momentum of the capital development programme, investing in world-class infrastructure for students and sta!. In addition, the University has committed £26m in support of the Belfast Region City Deal Programme and the Innovation Projects.
During 2018-19, significant progress was made on a number of transformational projects including an investment of £34.9m in Biological Sciences at Chlorine Gardens. This will be the new hub for the School of Biological Sciences and the Institute for Global Food Security and it will be key to the development of the life sciences and agri-food sectors in Northern Ireland.
During the year, important conservation and restoration work was carried out to the iconic Lanyon Building, the showpiece of Queen’s and there was an extensive upgrade of the Queen’s Film Theatre (QFT) which celebrated its 50th Anniversary.
CASH AND TREASURY MANAGEMENTCash balances, which include short-term deposits were £208.9m at the year end, this represents a reduction of £4.8m from the prior year. The University has a comprehensive Treasury Policy in place. The policy is regularly reviewed by the Investment Committee to ensure that risk is minimised and, during the banking and financial sector uncertainty of recent years, this has proved to be robust.
There was an extensive upgrade of the Queen’s Film Theatre which celebrated its 50th Anniversary.

INTEGRATED ANNUAL REPORT 2018–19
32
PROOF
INVESTMENT PERFORMANCEThe notes to the accounts set out full details of the two University Investment Funds.
The University Investment Fund is administered under the terms set out in the Queen’s University (Trust Scheme) Order (Northern Ireland) 1982, and includes endowment funds donated and bequeathed to the University for specific purposes.
The fund is actively managed by Schroders/Cazenove Capital Management and at 31 July 2019 was valued at £60.2m. Investment by endowment fund holders in the fund is by share purchase, and with 6,768,818 shares issued, the value of a share was £8.90. This was a decrease of 1.0% on the valuation of £8.99 the previous year.
The total income distributed by the fund to endowments was 30p per share, an increase of 1p or 3.4% on the previous year’s distribution of 29p, and amounted in total to £2.0m.
The General Investment Fund is for the longer term investment of University funds and is passively managed by Legal & General Investment Management. At 31 July 2019, the fund was valued at £90m, an increase of £5.8m, or 6.9%, on the previous year’s valuation of £84.2m.
During the course of the year, the Investment Committee recommended to Senate the appointment of Black Rock, as investment manager for both the University’s Investment and Central Investment Fund. The transition to Black Rock will occur during the 2019-20 year.
RESPONSIBLE INVESTMENTDecisions in respect of investments are made on the recommendation of the Investment Committee, guided by the University’s Responsible Investment Policy.
The Investment Committee meet with Schroders/Cazenove Capital Management and Legal & General Investment Management on a regular basis.
The managers have a clear understanding of the University’s Responsible Investment Policy and Environmental, Social, and Governance (ESG) screening and engagements are an integral part of their presentations and regular reporting. They are both signatories to the United Nations Principles of Responsible Investment (UN PRI), and have received A+ ratings from the PRI Association in their annual assessment reports. Both managers have sizeable teams of ESG professionals researching, engaging with companies, and voting at meetings. They produce regular annual and quarterly reports summarising their activities, copies of which may be viewed on their respective websites.
Schroders/Cazenove Capital Management has been a leader in the area of Responsible Investing for 20 years and provide ESG client solutions in ethically screened mandates. Their team of fourteen dedicated ESG professionals has conducted research and carried out
THE UNIVERSITY INVESTMENT FUND IS VALUED AT £60.2M AS AT 31 JULY 2019
REPORT ON INVESTMENT PERFORMANCE AND COMMITMENT TO RESPONSIBLE INVESTMENT

33
REPORT ON INVESTMENT PERFORMANCE AND COMMITMENT TO RESPONSIBLE INVESTMENT
over 2,200 engagements in 2018 across 52 countries globally. This has been integrated into their work on managing climate risk and their reports can be viewed on their webpage: www.schroders.com/en/strategic-capabilities/sustainability/
As one of the World’s largest asset managers, Legal & General use their scale of operations, and influence, to ensure that companies integrate environmental, social and governance issues into their everyday thinking, in order to develop resilient longer-term strategies, taking into consideration all of their stakeholders. They also encourage markets and regulators to create an environment in which good management of ESG factors is valued and supported. Their Corporate Governance and Responsible Investment Team is committed to product development in this area,
and in 2018 launched 14 ‘Future World Funds’. These funds have been developed to provide a mainstream way to invest and take account of the financial risks of climate change within investment portfolios. It is their belief that ESG issues are an important part of long-term risk management and therefore a fundamental element of their clients’ fiduciary duty. A summary of Legal & General’s activities on behalf of clients, particularly in the area of climate change, and the associated financial risks, is detailed on their webpage: www.lgim.com/uk/en/
These activities demonstrate the Investment Committee’s commitment to Responsible Investment and its incorporation into the long-term management and investment arrangements for the University’s Investment Funds.
Our fund administrators have committed to ESG through the launch of ‘The Future World Fund’.

INTEGRATED ANNUAL REPORT 2018–19
34
PROOF
The University is a participating employer in two separate defined benefit pension schemes, the Retirement Benefits Plan (RBP), which is available to sta! in posts graded 1-5, and the Universities Superannuation Scheme (USS), which is available to sta! at grade 6 and above.
RETIREMENT BENEFITS PLAN (RBP)The RBP funding position is calculated annually for accounting purposes, in accordance with FRS 102, and a full Actuarial Valuation is undertaken triennially by the Scheme Actuary.
As set out in note 23 of the Financial Statements, the RBP funding position under FRS 102 shows a deficit of £62.2m at 31 July 2019 (£49.4m at 31 July 2018). The increase in the deficit position reflects a number of factors including: updated financial and demographic assumptions which underpin the calculation; a decrease in the discount rate applied; and a gain on investments. The last Actuarial Valuation of the RBP was at 31 March 2017, was completed in September 2017 and a recovery plan was
agreed between the Trustees and the University. The next Actuarial Valuation will be as at 31 March 2020.
UNIVERSITIES SUPERANNUATION SCHEME (USS)USS is the principal pension scheme provided in the Higher Education sector and, with 198,000 active members, 360 participating employers, and assets of some £60bn, is one of the largest pension schemes in the UK. FRS 102 requires each institution to recognise a liability for its share of the USS funding deficit, based on its commitment to the recovery plan agreed as part of the out workings of the most recent Actuarial Valuation. The 31 March 2017 Valuation (and the associated Recovery Plan and Schedule of Contributions) was signed o! on 28 January 2019, and this is the new basis for calculating the USS liability.
The 31 March 2017 Valuation identified a funding deficit of £7.5bn (£5.3bn at 31 March 2014). The scheme actuary also determined that significantly higher deficit contributions would be required to make good the funding gap – 5.0% deficit contributions in 2017 compared
PENSION SCHEMES

35
with 2.1% deficit contributions in 2014.
This necessitated an increase in contribution rates for both scheme members and employers in April 2019, with further contribution increases which were due to be implemented in October 2019 and April 2020. The combined impact of a deterioration in the funding position and a higher deficit contribution rate has resulted in a much larger liability for all participating employers to recognise in their Financial Statements – for Queen’s this equates to an estimated increase in the USS liability of some £73.6m from £35.2m at 31 July 2018 to £108.8m at 31 July 2019.
Completion of the USS 2017 Valuation has been problematic; in fact the Valuation was only finally completed 7 months after the statutory deadline had passed. This was due to a failure to agree the Valuation outcome and the necessary scheme changes, which in turn led to the formation of a Joint Expert Panel (JEP). In November 2018, the JEP issued a report recommending changes to the 2017 Valuation, and these were generally accepted by all stakeholders. However, the USS Trustees chose to complete the 2017 Valuation
on the original basis, and to incorporate the JEP recommendations in a new 31 March 2018 Valuation.
Since 31 July 2019, the 2018 USS actuarial valuation has been finalised and a new deficit recovery plan has been agreed. As at 31 March 2018, the deficit is £3.6bn and the contribution will increase to 21.1% of salary for employers and 9.6% for members, from 1 October 2019 for 2 years, with higher rates thereafter subject to the outcome of the 2020 actuarial valuation.
The impact on Queen’s of the 2018 valuation would be to reduce our liability by £45.9m, from £108.8m to £62.9m with a corresponding reduction of £45.9m in the charge to the SOCI. Clearly, this is a much more favourable outcome than the 2017 valuation. The outcome of the 2018 USS valuation represents a non-adjusting post balance sheet event for 2018-19 and it will become the basis of which the USS liability will be calculated going forward. Full disclosure details are set out in notes 24 and 34 of the Financial Statements.
Pensions continue to be one of the most significant risks facing the HE sector at this time.

INTEGRATED ANNUAL REPORT 2018–19
36
PROOF
There is a need for a substantive investment in Northern Ireland (NI) to support the knowledge economy.
The level of government funding for teaching and research remains a major concern for the University, with continuing uncertainty presenting significant risks to the future stability of the sector. Between 2009-10 and 2018-19, the annual block grant allocation from government to the NI universities has reduced by £34m and this equates to 1�% in cash terms and 30% in real terms.
institutions, and as evidenced by Universities UK, the funding gap between NI and England is of the order of 11%. Our competitors are investing significantly in enhancing the student experience, through both additional sta! and new infrastructure. The implications of the underinvestment in NI is clearly a matter of concern.
The imposition of a succession of budget reductions since 2010-11 has resulted in a “structural deficit” in HE funding, which the Department acknowledge is of the order of £54m. This is clearly not sustainable and runs counter to the strategy of developing NI as a knowledge based economy.
For 2019-20, core government funding for teaching and research was held at 2018-19 levels, representing a further real terms reduction of 2.0%. Furthermore, in 2019-20 current funding from DfE is equivalent to that received in 2012-13.
Queen’s is fully committed to working with our partners in government to deliver better outcomes for all our citizens. The growth of a sustainable knowledge economy in NI requires investment in skills, research and innovation to create wealth. Therefore, sustainable investment in HE in NI should be a priority for a new Executive.
NI is the only region in the UK which has reduced higher education investment in recent years. Other parts of the UK have increased their investment and if Queen’s was funded at the equivalent rate for an English institution, we would have additional teaching income of approximately £20m per annum.
This funding shortfall creates a serious competitive disadvantage for the University against comparative UK
There is a need for a substantive investment in Northern Ireland to support the knowledge economy.
10.0%
5.0%
0.0%
-5.0%
-10.0%
-15.0%
England
Scotland
NorthernIreland
2010/11
2011/12
2012/13
2013/14
2014/15
2015/16
2016/17
2017/18
2018/19
Real
term
s cha
nge
com
pare
d to
201
0/11
*Source: UniversitiesUK (UUK)
HIGHER EDUCATION FUNDING
37
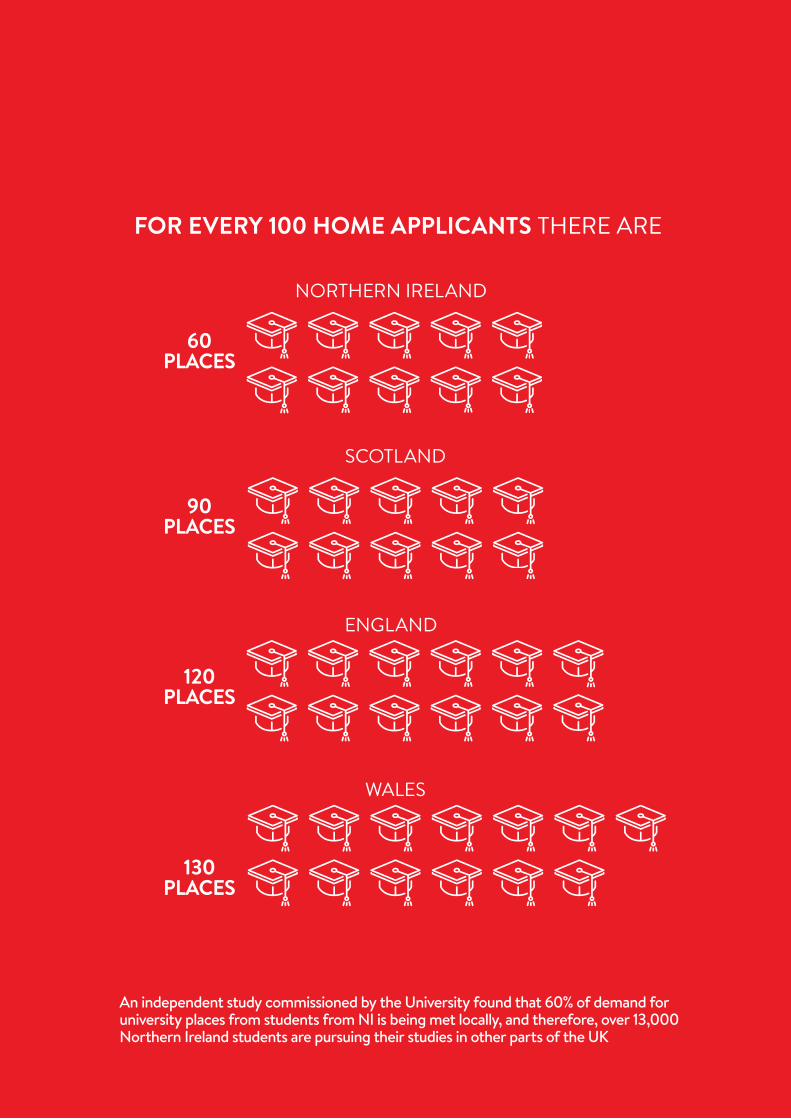
FOR EVERY 100 HOME APPLICANTS THERE ARE
60PLACES
NORTHERN IRELAND
90PLACES
SCOTLAND
120PLACES
ENGLAND
130PLACES
WALES
An independent study commissioned by the University found that 60% of demand for university places from students from NI is being met locally, and therefore, over 13,000 Northern Ireland students are pursuing their studies in other parts of the UK

INTEGRATED ANNUAL REPORT 2018–19
38
PROOF
The University adopts an open, proactive and receptive approach to identifying and managing risks.
A comprehensive Risk Management framework, defined in the University’s Risk Management Policy, assists the identification of the key risks inherent in the delivery of the University’s Corporate Plan 2016-2021.
The Risk Management process within the University is structured to monitor the risks proactively and respond quickly to issues as they arise. The process is overseen by the Audit Committee in order to gain the necessary assurances on the e#cacy of the framework and relay them to Senate.
In addition to the significant risk surrounding the deficit on the USS pension scheme, the key risks to the achievement of the strategic objectives are detailed overleaf.
RISK AND UNCERTAINTY
39
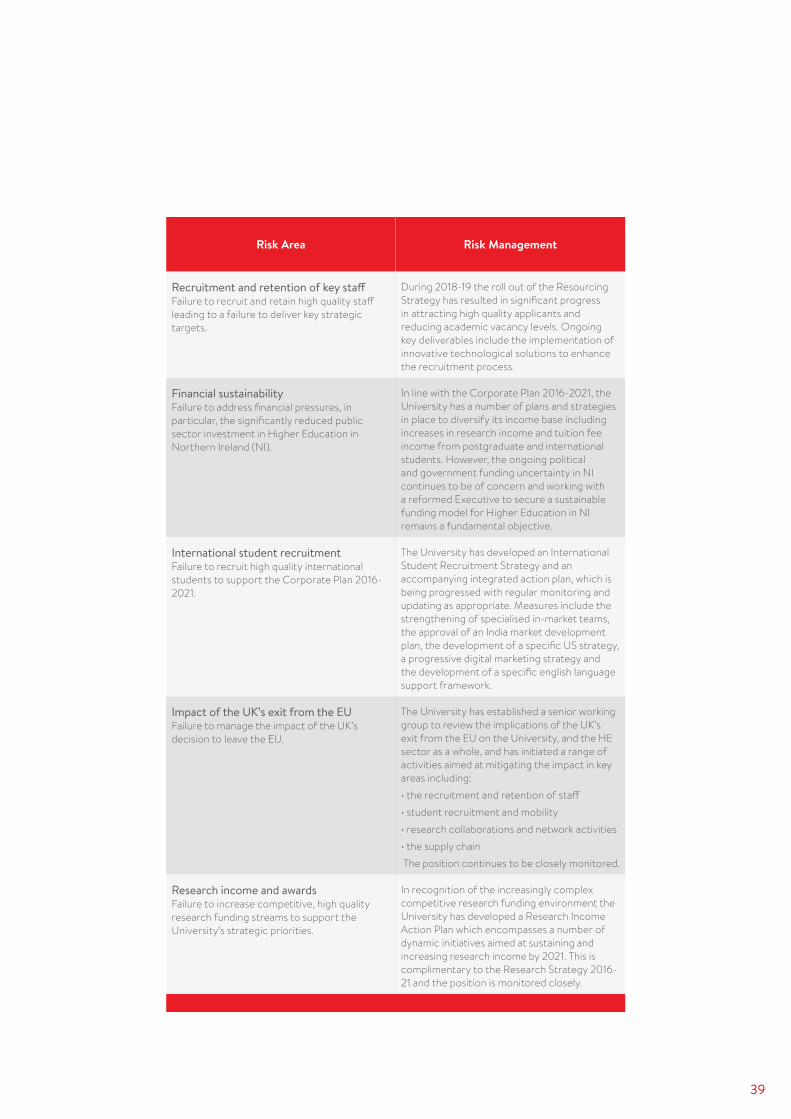
Risk Area Risk Management
Recruitment and retention of key sta! Failure to recruit and retain high quality sta! leading to a failure to deliver key strategic targets.
During 2018-19 the roll out of the Resourcing Strategy has resulted in significant progress in attracting high quality applicants and reducing academic vacancy levels. Ongoing key deliverables include the implementation of innovative technological solutions to enhance the recruitment process.
Financial sustainabilityFailure to address financial pressures, in particular, the significantly reduced public sector investment in Higher Education in Northern Ireland (NI).
In line with the Corporate Plan 2016-2021, the University has a number of plans and strategies in place to diversify its income base including increases in research income and tuition fee income from postgraduate and international students. However, the ongoing political and government funding uncertainty in NI continues to be of concern and working with a reformed Executive to secure a sustainable funding model for Higher Education in NI remains a fundamental objective.
International student recruitmentFailure to recruit high quality international students to support the Corporate Plan 2016-2021.
The University has developed an International Student Recruitment Strategy and an accompanying integrated action plan, which is being progressed with regular monitoring and updating as appropriate. Measures include the strengthening of specialised in-market teams, the approval of an India market development plan, the development of a specific US strategy, a progressive digital marketing strategy and the development of a specific english language support framework.
Impact of the UK’s exit from the EUFailure to manage the impact of the UK’s decision to leave the EU.
The University has established a senior working group to review the implications of the UK’s exit from the EU on the University, and the HE sector as a whole, and has initiated a range of activities aimed at mitigating the impact in key areas including: • the recruitment and retention of sta!• student recruitment and mobility • research collaborations and network activities• the supply chain The position continues to be closely monitored.
Research income and awardsFailure to increase competitive, high quality research funding streams to support the University’s strategic priorities.
In recognition of the increasingly complex competitive research funding environment the University has developed a Research Income Action Plan which encompasses a number of dynamic initiatives aimed at sustaining and increasing research income by 2021. This is complimentary to the Research Strategy 2016-21 and the position is monitored closely.
INTEGRATED ANNUAL REPORT 2018–19
40
PROOF
CONCLUSIONThe University achieved a satisfactory financial performance in 2018-19, with continued investment in our sta!, students and core activities.
The surplus generated will be invested to support the Illuminate Vice-Chancellor Fellowship Scheme, the ongoing investment in our core infrastructure, our commitment to the Belfast Region City Deal and to support the delivery of our strategic priorities.
We recognise that there are a number of significant challenges facing the University and these include the impact of Brexit, pensions, the challenges in international student recruitment, the demographic dip in 18 year olds and, in particular the export of NI students who are pursuing their studies in other parts of the UK.
A new Executive must urgently address the structural deficit of £54m which exists in the HE sector in NI to ensure the ongoing availability of skilled graduates required for sustainable economic growth.
The growth of a sustainable knowledge economy requires investment in skills, research and innovation to create wealth.
During 2019-20 we will be developing our new Strategic Plan which will reflect the changing external environment and new opportunities. A new Corporate Plan will be underpinned by financial sustainability. E!ective governance and strong financial performance is critical to the future success of Queen’s and we are well positioned to respond.

41

INTEGRATED ANNUAL REPORT 2018–19
42
PROOF

43
PUBLIC
BENEFIT STATEM
ENT
PUBLIC BENEFITSTATEMENT

INTEGRATED ANNUAL REPORT 2018–19
44
PROOF
The Corporate Plan 2016-2021, which will drive the growth of the University, emphasises the importance of our impact on society, across our range of activities, and the requirement for positive engagement with the business and wider community. To support this role, the University has re-a#rmed its commitment to the University’s Social Charter which celebrated its first anniversary during 2018-19. The key principles of which are to shape a beter world and to:
• Commit to providing leadership locally and globally.
• Commit to promoting a positive impact on society through our research and education.
• Commit to equality and social justice.
The Social Charter highlights the positive impact the University makes on society economically, socially and culturally.
The University’s Public Engagement Team drive the implementation of the Social Charter. In particular, they aim to connect, enhance and strengthen partnerships between the University and the Northern Ireland Business Sector in support of a vibrant community, through a number of initiatives including the delivery of a series of prestigious lectures which attract a range of high profile speakers and facilitate open dialogue on a range of today’s most pressing issues.
EDUCATION AND STUDENTSQueen’s has had a longstanding commitment to equality of opportunity, with the aim of ensuring that “those who have the ability to benefit from higher education have an opportunity to do so”.
The details of our widening participation initiatives and expenditure (£3.8m per annum) are set out in our Widening Access and Participation Plan.
PUBLIC BENEFIT STATEMENT The University is registered with the Charities Commission for Northern Ireland, and through Senate, is aware of its responsibilities, as a charity, to act for the public benefit across all of its activities.
45
A fundamental review of all our widening participation activities was undertaken during 2018-19 and a comprehensive strategy was developed to drive this agenda forward over the next four years. This strategy aims to widen participation; raise attainment; contribute to a strong regional skills base; and bridge gaps in retention, progression and success to ensure our students enjoy the best possible outcomes, at University and as graduates.
The University’s widening access programme has an excellent record with 29% of undergraduate students from disadvantaged areas. It has a PATHWAY programme which provides a route for talented young people from Northern Ireland who have the ability to study at Queen’s but may require additional support and encouragement to reach their full potential.
Queen’s is committed to equality of opportunity for all students, and has developed a wide range of services to facilitate students with disabilities as an integral part of the Queen’s community.
THE ENVIRONMENTAs outlined in page 23 of this report, the University is committed to living within its environmental limits, whilst continuously improving performance, without compromising the ability of future generations to meet their needs. This is achieved through strong leadership, good governance and the responsible use of science and technology. In support of these principles, the University continues to endeavour to:
• Develop a culture of environmental stewardship and a sense of awareness amongst students and sta! including active involvement in the sector wide Green Impact Scheme.
• Seek to continually improve our environmental performance beyond simple legislative requirement.
• Use our knowledge and understanding of the environment to further the aims of sustainable development.
• Demonstrate leadership in the sustainable management of the environment.
Queen’s has developed a comprehensive Carbon Management Plan, supported by a range of projects including procurement, Green ICT, energy e#ciency, waste minimisation and travel.
PUBLIC
BENEFIT
STATEMEN
T
THE PATHWAY PROGRAMME PROVIDES A ROUTE FOR TALENTED YOUNG PEOPLE FROM NORTHERN IRELAND WHO HAVE THE ABILITY TO STUDY AT QUEEN’S

INTEGRATED ANNUAL REPORT 2018–19
46
PROOF
RESEARCHExcellence in research and innovation, and making a positive global impact, are central to Queen’s Research Strategy. Queen’s is currently ranked 8th in the UK for research intensity and over 75% of our research is rated as world class or internationally leading. Queen’s research continues to change the lives of individuals and society and some examples of this impact are listed below:
• Researchers within the Wellcome – Wolfson Institute for Experimental Medicine have developed a new blood test aimed at diagnosing heart failure at an earlier stage and with greater accuracy to improve outcomes for patients with heart disease.
• Queen’s Management School are involved in the EURHISFIRM project which aims to design a world class research infrastructure system to collect, merge, extract, collate, align and share detailed, reliable and standardised long-term company-level data for Europe. The creation of a vibrant European community will enable researchers, policymakers and other stakeholders to analyse, develop and evaluate e!ective strategies to promote investment and economic growth.
• Researchers at the Centre for Wireless Innovation have created a solution aimed at reducing the costs and complexity of 5G mobile networks which will o!er faster speeds and more reliable connections on smartphones and other devices. The solution will have a global impact as 5G gradually replaces 4G networks.
• Academics from the School of History, Anthropology, Philosophy and Politics are part of the UK wide Place–based Climate Action Network which is aimed at ensuring the UK will meet the requirements of the 2015 Paris agreement on climate change.
• Academics from the School of Social Sciences, Education and Social Work,
TO DATE THREE COMPANIES FROM THE QUBIS PORTFOLIO HAVE BEEN FLOATED ON THE LONDON STOCK EXCHANGE
in conjunction with peers in Ulster University, have carried out research into the attitudes of people in Northern Ireland towards Transgender people. The research is a key source of data on how opinions have changed over the last decades and such studies play an important role in shaping and evaluating key public policies and inform public and political debate.
• Researchers in the Centre for Public Health are undertaking a project in Vietnam to document how the arts and storytelling can be employed to promote healthy behaviour, improve the early detection of breast cancer and learn how the arts, humanities and health sciences can work to develop material that can save lives.
INNOVATION AND IMPACTQueen’s is committed to the creation of a successful and sustainable knowledge economy with key details outlined in pages 18-20 of this report.
We are expanding our impact on wider society through the growth of important partnerships at home and around the

47
world. Queen’s is helping to secure Northern Ireland’s status as a global cyber security hub by o!ering 40 full scholarships for its specialist Applied Cyber Security programmes.
Cyber Security is a growing area of Industry in Northern Ireland and is viewed as an essential element of economic development.
During the year the University also opened the Precision Medicine Centre of Excellence which will radically change the landscape of modern medicine in Northern Ireland and beyond by bringing together high throughput genomics, artificial intelligence and bid data analytics in a fully integrated fashion.
Some of our most enduring global partnerships are in China, and in 2018-19 the second cohort of students undertaking degrees in Pharmaceutical Sciences and Pharmaceutical Biotechnology graduated from the China Queen’s College, which was established in 2014 at the China Medical University in Shenyang.
We also promote The Science Shop, an initiative ran jointly with
the Ulster University, which works with community organisations to provide access to research resources in a number of disciplines.
Queen’s is one of the four highest- performing universities for intellectual property (IP) commercialisation. We are also a key player in the £8m expansion of ICURe, the Innovation to Commercialisation of University Research pilot programme that now includes Northern Ireland.
The success of QUBIS, our commercialisation arm, in creating successful spin-out companies continued in 2018-19.
A total of £480k was invested taking the portfolio of active companies to 36. To date three companies from the QUBIS portfolio have been floated on the London Stock Exchange, Kainos Group, Fusion Antibodies and Andor Technology. We are 2nd highest in the UK for the number of jobs created from spin out companies, with a total of 2,214 to date.
Science Shop celebrates 30 years at Queen’s University Belfast and Ulster University
INTEGRATED ANNUAL REPORT 2018–19
48
PROOF
LOCAL COMMUNITYThe University is involved in a wide range of programmes, in partnership with the local community, and liaises with key internal and external stakeholders to promote community cohesion and has representation on key partnership groups. These include local resident groups and involvement in an initiative which supports community cohesion at a local and strategic level in the Lower Ormeau and Botanic areas of South Belfast.
Queen’s is a member of the South Belfast Round Table, a charity that brings together key agencies and community organisations in South Belfast to address racism in a positive and proactive way.
The University’s Public Engagement team continues to work with Belfast City Council to engage colleagues to assist in the delivery of the Belfast Agenda, the City’s community plan. This enables the University to lend its globally renowned expertise to deliver solutions to local problems. To date this has included providing expertise in public health, educational underachievement and geospatial mapping.
In March and November each year, Queen’s sta! and students take over the streets of South Belfast for a big community litter-pick. Over 50 volunteers take part in each clean up collecting in excess of sixty bags of street litter.
Other projects helping to brighten up our local area include regular painting and planting workshops with residents and community groups in local alleyways and community green spaces.
During 2018-19 the University has been working with statutory agencies including the PSNI, NI Policing Board and the Belfast Policing and Community Partnership (PCSP). Furthermore, the Community Engagement team convenes the Neighbourhood Forum, comprising chairs of the local residents’ groups, local elected representatives and representatives from the community and voluntary sector.
Queen’s encourages our students to reflect on their role as citizens, and future leaders, through our curricular programmes. Our degree pathways all feature elements of citizenship provision and facilitate the development of communication, leadership, teamwork and creativity.
In an event to celebrate the successful first year of our Social Charter, representatives of our Students’ Union related how volunteers are helping young people from disadvantaged areas to improve their studying skills and build self-confidence through homework clubs across Belfast. Further details are set out in page 19 of this report.
Queen’s is home to Northern Ireland’s only art house cinema in the Queen’s Film Theatre (QFT), as well as the
“The University is involved in a wide range of programmes, in partnership with the local community, and liaises with key internal and external stakeholders to promote community cohesion.”
The inaugural TEDxQueen’sUniversityBelfast conference was held in May 2019 at Riddel Hall. This event a!orded opportunities for the general public to hear about some of the many ways in which Queen’s is having a beneficial impact on society. This included talks from several of the University’s leading research colleagues on their ground-breaking research work - Professor Maire O’Neill (cyber security) and Professor Mark Lawler (cancer care innovation); and from local community groups assisted by Queen’s research projects, including the Greater Shankill Partnership.
During 2018-19, the University worked in partnership with a local community group, Belfast South Community Resource and the Urban Villages Initiative to facilitate a GCSE revision school for Math and English.

49
award winning Naughton Gallery. The Seamus Heaney Centre for Poetry reinforces the University’s reputation as a world literary force, whilst the Brian Friel Centre for Theatre Research provides a world-class studio theatre for performing arts students.
Queen’s Sport recognises the importance of promoting a healthy lifestyle, is committed to improving health and wellbeing in the local community and has over 12,000 public, sta! and student members. During the year Queen’s Sport successfully delivered a range of sporting events, positively enhancing the University’s reputation in the local community including:
• Queen’s Park Run which is in its 8th year, continues to attract hundreds of runners from the local community on a weekly basis and operates 52 weeks of the year.
• The Deep RiverRock Queen’s 5K Race – an annual event in the city calendar and now an o#cial Northern Ireland Athletics event and Ulster Championship 5K. This year the race attracted 1,000 runners with
a 3K race aimed at junior athletes and participants of all abilities. Over 40 volunteers were involved in the planning and delivery of this event.
• The Ulster Fitness and Dance Championships which ran over 3 days and involved nearly 1,000 participants from the community.
• The annual Swimathon continued to attract the largest number of participants across all venues in Northern Ireland. Swimathon has attracted over 700,000 swimmers across the UK raising money for charity, including Marie Curie and Cancer Research UK.
• The annual Boat Race is in its 15th year and involved over 1,000 spectators along the River Lagan with 150 school children competing for the Ulster Schools Rowing Championships, 50 race volunteers and over 500 guests attending the event.
• Queen’s facilities at Upper Malone continue to attract community users from local clubs, visiting teams and universities, schools and the public with nearly 8,000 users per week.
The inaugural TEDx Queen’sUniversityBelfast conference was held in May 2019 at Riddel Hall.

INTEGRATED ANNUAL REPORT 2018–19
50
PROOF

51
FINANCIALSTATEMENTS
FINAN
CIAL STATEM
ENTS
52
INTEGRATED ANNUAL REPORT 2018–19
PROOF
CORPORATE GOVERNANCE
The following statement is given to assist readers of the financial statements to obtain an understanding of the governance procedures applied by the Senate of the University.
The University is an autonomous body established under the Irish Universities Act 1908. In common with all public bodies it operates within a strong framework of regulation. Not only does the University comply with all mandatory requirements, but it also strives to operate that guidance which represents best practice. The University has adopted the Higher Education Code of Governance published by the Committee of University Chairs in December 2014 and revised in June 2018. The Code sets out current best practice for the corporate governance of higher education institutions. The University seeks to comply fully with the key recommendations made in the Code.
SUMMARY OF THE UNIVERSITY’S STRUCTURE OF CORPORATE GOVERNANCE
The University’s Senate comprises lay and academic persons appointed under the Statutes of the University, the majority of whom are non–executive. The current members are listed as follows:
Pro–Chancellors Mr S Prenter
Dr S Kingon
President and Vice–Chancellor Professor Ian Greer
Honorary Treasurer Ms O Corr
President, Students’ Union Mr C Veighey
Other members Professor D FitzsimonsProfessor P McKeownDr F Schuppert Dr V AltglasMr K FlanaganMrs L RobertsMr E McMullan Ms B ArthursMr R Bailie Mr A DoranMs E GrahamMr K JessMs M MatchettMs A McGregorMs M ReganMr A ShannonMs P SlevinMs G Ní Dhaimhín
53
CORPORATE GOVERNANCE
The role of the Chair of Senate is separate from the role of the University’s Vice–Chancellor as Chief Executive. Senate is responsible for the ongoing strategic direction of the University, the management and administration of its revenue and property and the general conduct of its a$airs. Senate works with the Executive O%cers to set the institutional mission and strategy, and the Executive O%cers ensure that steps are taken to deliver the institutional goals and that there are e$ective systems of control and risk management in place. Senate approves all major developments and receives regular reports on the day to day activities of the University and its subsidiary companies. Senate meets at least four times a year and is supported by several committees, including a Planning and Finance Committee, a Nominations Committee, a Standing Committee, a Remuneration Committee and an Audit Committee. All of these committees are formally constituted with terms of reference and are comprised mainly of lay members of Senate.
Planning and Finance CommitteeThe Planning and Finance Committee supervises all matters relating to the finance and accounts of the University, the investment of its funds, the receipt of its income and the expenditure thereof, and the management of trust funds. The Committee also advises Senate on the raising and financing of loans. The Planning and Finance Committee report to each meeting of Senate.
Nominations CommitteeThe Nominations Committee seeks out and recommends new lay members for membership to Senate.
Standing CommitteeThe Standing Committee considers, approves, monitors and evaluates the University’s strategy in relation to its people, culture and values to include sta! engagement and its impact on organisational performance. In addition, the Standing Committee is responsible for the initial consideration and approval of policy to ensure the promotion of all aspects of Equality and Diversity across the University including work being undertaken to address gender equality.
Remuneration CommitteeThe Remuneration Committee reviews and determines the salaries and conditions of service of the senior o"cers of the University annually in line with the Senior Salaries Scheme. The scheme treats all senior sta! remuneration, including that of the Vice–Chancellor, in a consistent manner, and progression is linked to corporate and individual performance. A wide range of benchmark data is utilised, and a number of wider societal factors are also taken into account, including the overall funding environment, a!ordability and government
policy.
The current membership of the Remuneration Committee consists of four independent members of Senate, namely Dr S Kingon (Chair), Mr S Prenter, Ms O Corr and Ms M Regan. The terms of reference are as outlined below:
(a) To determine and review annually, on behalf of Senate, the salaries and employment terms and conditions of the Senior Management Group and Senior Academic Managers.
(b) To keep under review the Senior Salaries Scheme, taking due account of wider developments within both higher education and the wider economy.
(c) To oversee severance arrangements for members of the Senior Management Group and Senior Academic Managers in the context of specific guidance from the University’s sponsoring Department and its own policy governing all severance packages, to identify boundaries of delegated authority for agreeing packages and to determine settlements in excess of pre–agreed limits.
(d) To consider and advise on any matters concerning the terms of appointment and conditions of service of the Senior Management Group and Senior Academic Managers when referred to it by the President and Vice–Chancellor or the Pro–Chancellors.
(e) To consider, endorse and monitor performance against the approved key objectives of the Senior Management Group.
(f) To provide an annual report for consideration and approval by Senate.
(g) To promote the University’s responsibilities for equality and diversity by ensuring that relevant issues are given full consideration in all matters relating to the remuneration of all sta! falling within the remit of the Committee.
Senate has welcomed the new Committee of University Chairs (CUC) Higher Education Senior Sta! Remuneration Code published in June 2018. The Code sets out a framework through which Higher Education Institutions can demonstrate that they are being managed in the best interests of their key stakeholders, including sta! and students. In this context, Senate has implemented a number of updates to its practices in response to evolving best practice across the sector. A copy of the report of the Remuneration Committee can be found at the following link:
http://www.qub.ac.uk/about/Leadership–and–structure/Registrars–O"ce/University–Governance/Directory–of–Committees/RemunerationCommittee/
Audit Committee
The current membership of the Audit Committee consists of three independent non–executive members of Senate, namely Mr K Jess (Chair), Ms A McGregor, and Mr E McMullan and two co–optees, Miss H Kirkpatrick and Mr N Coburn.
The terms of reference are as outlined below:
(a) To appoint the University’s External Auditors through a formal procurement process. To rea"rm that appointment, each year during the contracted period, through a recommendation to Senate. The Audit Committee may also remove the External Auditors before the end of their term if serious shortcomings are identified.
(b) To report to Senate on the appointment of the External Auditors, the audit fee, the provision of any non–audit services by the External Auditors, and any questions of resignation or dismissal of the External Auditors.
(c) To discuss with the External Auditors, before the audit begins, the nature and scope of the audit.
(d) To discuss with the External Auditors problems and reservations arising from the interim and final audits, including a review of the External Auditors’ report to the Audit Committee, incorporating management responses, and any other matters the External Auditors may wish to discuss (in the absence of management where necessary).
(e) To appoint the University’s Internal Auditors through a formal procurement process. The Audit Committee may also remove the Internal Auditors before the end of their term if serious shortcomings are identified.
(f) To report to Senate on the appointment and terms of engagement of the Internal Audit service, the audit fee, the provision of any non–audit services by the Internal Auditors, and any questions of resignation or dismissal of the Internal Auditors.
(g) To review the Internal Auditors’ audit risk assessment, strategy and programme; consider major findings of Internal Audit investigations and management’s response and promote co–ordination between the Internal and External Auditors. The Committee will ensure that the resources made available for Internal Audit are su"cient to meet the institution’s needs (or make a recommendation to Senate, as appropriate).

54
INTEGRATED ANNUAL REPORT 2018–19
PROOF
CORPORATE GOVERNANCE
(h) To keep under review the e!ectiveness of the University’s risk management, control and governance arrangements and, in particular, to review the External Auditors’ Report to the Audit Committee, the Internal Auditors’ Annual Report and management responses. The Committee shall make recommendations to relevant committees, or to the Vice–Chancellor, to ensure that measures are taken to deal e!ectively with matters raised in audit reports.
(i) To monitor the implementation of agreed audit–based recommendations, through the Internal Audit – Status of Recommendations report.
(j) To ensure that all significant losses have been properly investigated and that the Internal and External Auditors and, where appropriate, the Department for the Economy (DfE), have been informed.
(k) To consider, approve and oversee the implementation of the institution’s policies on Fraud and Whistleblowing, including being notified of any action taken under these policies.
(l) To provide ongoing assurance to Senate, in respect of the management and quality assurance of data.
(m) To satisfy itself that satisfactory arrangements are in place to promote economy, e"ciency and e!ectiveness.
(n) To consider and approve the University’s Register of Interests Policy, the Policy on the Acceptance of Gifts, Gratuities and Hospitality and the University’s arrangements to ensure compliance with the Bribery Act 2010.
(o) To receive any relevant report from the Northern Ireland Audit O"ce, the National Audit O"ce, the O"ce for Students or any other body, which fulfils a recognised audit function in respect of the University or related institutions, funded in full, or in part, from public funds.
(p) To monitor, annually, the performance and e!ectiveness of the External and Internal Auditors, including any matters a!ecting their objectivity.
(q) To consider the draft annual financial statements, in the presence of the External Auditors, ensuring that su"cient consideration has been given to all relevant matters, that there is compliance with relevant legislation, DfE’s Accounts Directions and accounting standards, and that there are no major disagreements between the External Auditors and the Planning and Finance Committee and/or the Director of Finance over accounting policies.
(r) In the event of the merger or dissolution of the institution, to ensure that the necessary actions are completed, including arranging for a final set of financial statements to be completed and signed.
(s) To report, on a regular basis, to Senate and to compile an Annual Report which, following consideration by Senate, will be sent to DfE – this Annual Report shall include an opinion on the adequacy and e!ectiveness of the University’s arrangements for risk management, internal control, governance and value for money.
(t) The Committee is authorised by Senate to obtain outside legal or other independent professional advice and to secure the attendance of non–members with relevant experience and expertise, if it considers this necessary, normally in consultation with the Registrar and Chief Operating O"cer and/or the Chair of Senate. However, it may not incur direct expenditure, in this respect, in excess of £10,000, without the prior approval of Senate.
The University has implemented a process for identifying, assessing and managing the University’s significant risks in line with the relevant DfE Accounts Direction. The University has also adopted the Higher Education Code of Governance published by the Committee of University Chairs in December 2014 (as revised in June 2018). A Risk Management Committee has been established, and the process of embedding risk management at Faculty/Professional Services level, in both the planning processes and operational arrangements of the University, is well developed. This process is regularly reviewed by the Audit Committee, on behalf of Senate, to ensure that a sound system of internal control, covering all risks, is in place.
STATEMENT ON INTERNAL CONTROL
As the governing body of Queen’s University Belfast, Senate has responsibility for maintaining a sound system of internal control that supports the achievement of the University’s policies, aims and objectives, while safeguarding the public and other funds and assets for which it is responsible. This responsibility has been assigned to Senate in accordance with the University’s Charter and Statutes, and the Financial Memorandum.
The system of internal control is designed to manage, rather than eliminate, the risk of failure to achieve policies, aims and objectives. To that extent it can therefore only provide reasonable, and not absolute, assurance of e!ectiveness.
The system of internal control is based on an ongoing process designed to identify the principal risks to the achievement of policies, aims and objectives, to evaluate the nature and extent of those risks and to manage them e"ciently, e!ectively and economically. This process has been in place for the year ended 31 July 2019 and up to the date of approval of these financial statements, and accords in full with DfE guidance.
55
CORPORATE GOVERNANCE
As the governing body, Senate has responsibility for reviewing the e$ectiveness of the system of internal control. The following processes have been established:
(a) Senate meets at regular intervals (at least four times a year) to consider the strategies and plans of the University.
(b) Senate receives regular reports from the Chairman of the Audit Committee concerning internal control, and also requires regular reports from managers on the steps they are taking to manage risk in their areas of responsibility, including progress reports on key projects.
(c) Senate has established a Risk Management Committee to oversee risk management.
(d) The Audit Committee receives regular reports from the Internal Auditors which include their independent opinion on the adequacy and e!ectiveness of the University’s system of internal control, together with recommendations for improvement.
(e) Programmes of facilitated workshops have been held in Faculties and Professional Services to identify new and emerging risks and to ensure the adequacy of counter measures. Faculties and Professional Services are responsible for identifying, evaluating and managing their significant risks.
(f) A programme of risk awareness training is ongoing and risk management is integrated within the University’s business planning process.
(g) A system of key performance and risk indicators has been developed.
(h) A robust risk prioritisation methodology, based on risk ranking and cost–benefit analysis, has been established.
(i) A Corporate Risk Register is maintained and regularly reviewed and updated with responsibility for the management of each risk embedded within the management structure of the University.
(j) All information used for both operational and financial reporting purposes is captured and processed accurately, and to an appropriate quality standard, particularly where it is used by third parties or relied on by other parts of government.
(k) Reports are received, as appropriate, from budget holders, department heads and project managers on internal control activities.
Senate’s review of the e!ectiveness of the system of internal control is undertaken, on an annual basis, with reference to the DfE’s Accounts Direction. It is Senate’s view that the University has an e!ective risk management process in place and that the Corporate Risk Register is being managed on an active basis with specific action plans in place to address all risks. This view is informed by the work of the University’s Internal Auditors who operate to standards defined in the UK Public Sector Internal Audit Standards (PSIAS).
Senate’s review of the e!ectiveness of the system of internal control is also informed by the work of the senior o"cers within the University, who have responsibility for the development and maintenance of the internal control framework, and by comments made by the External Auditors in their report to the Audit Committee.
As a result of Senate’s overall review of the e!ectiveness of the system of internal control, including risk management, it is content that no significant weaknesses have been identified. This has been confirmed by the assurance given to the University’s Accounting O"cer by the Internal Auditors, in their Annual Statement of Assurance.

56
INTEGRATED ANNUAL REPORT 2018–19
PROOF
Senate is responsible for preparing the Annual Report and consolidated financial statements in accordance with the requirements of the Financial Memorandum issued by the former Department for Employment and Learning (DEL) and applicable law and regulations.
It is required to prepare Group and parent University financial statements in accordance with UK accounting standards and applicable law (UK Generally Accepted Accounting Practice), including FRS 102 The Financial Reporting Standard applicable in the UK and Republic of Ireland. The Financial Memorandum further requires the financial statements to be prepared in accordance with the 2015 Statement of Recommended Practice – Accounting for Further and Higher Education, which is in accordance with the requirements of the Department for the Economy’s (DfE) Accounts Direction to Higher Education Institutions. The Senate is required to prepare financial statements which give a true and fair view of the state of a!airs of the Group and parent University and of their income and expenditure, gains and losses and changes in reserves for that period.
In preparing each of the Group and parent University financial statements, Senate is required to:
• select suitable accounting policies and then apply them consistently;
• make judgements and estimates that are reasonable and prudent;
• state whether applicable UK accounting standards have been followed, subject to any material departures disclosed and explained in the financial statements;
• assess the Group’s and parent University’s ability to continue as a going concern, disclosing, as applicable, matters related to going concern; and
• use the going concern basis of accounting unless it intends to liquidate the Group, or the parent University, or to cease operations, or have no realistic alternative but to do so.
Sentate is responsible for keeping proper accounts and proper records in relation to the accounts. Senate is responsible for such internal control as it determines is necessary to enable the preparation of financial statements that are free from material misstatement, whether due to fraud or error and it has general responsibility for taking such steps as are reasonably open to it, to safeguard the assets of the Group and to prevent and detect fraud and other irregularities.
Senate is also responsible for ensuring that:
• funds from DfE, have been applied in accordance with the Financial Memorandum and any other terms and conditions attached to them;
• there are appropriate financial and management controls in place to safeguard public funds and funds from other sources;
• funds from whatever source administered by the Group or the University for specific purposes have been properly applied to these purposes and managed in accordance with relevant legislation; and
• the economical, e"cient and e!ective management of the University’s resources and expenditure is secured.
Senate is responsible for the maintenance and integrity of the financial statements included on the University’s website. Legislation in the UK governing the preparation and dissemination of financial statements may di!er from legislation in other jurisdictions.
RESPONSIBILITIES OF SENATE IN RESPECT OF THE CONSOLIDATED FINANCIAL STATEMENTS
57
REPORT ON THE AUDIT OF THE FINANCIAL STATEMENTS
Opinion We have audited the financial statements of Queen’s University Belfast (“the University”) for the year ended 31 July 2019 set out on pages 59 to 91, which comprise the Consolidated and University Statements of Comprehensive Income, the Consolidated and University Statements of Changes in Reserves, the Consolidated and University Balance Sheets, the Consolidated Cash Flow Statement and the related notes, including the summary of significant accounting policies on pages 59 to 62. The financial reporting framework that has been applied in their preparation is UK Law and FRS 102 The Financial Reporting Standard applicable in the UK and Republic of Ireland.
In our opinion the financial statements:
• give a true and fair view of the state of the Group’s and the University’s a!airs as at 31 July 2019, and of the Group’s and the University’s income and expenditure, gains and losses and changes in reserves, and of the Group’s cash flows, for the year then ended;
• have been properly prepared in accordance with UK accounting standards, including FRS 102 The Financial Reporting Standard applicable in the UK and Republic of Ireland, and with the 2015 Statement of Recommended Practice – Accounting for Further and Higher Education; and
• meet the requirements of the Department for the Economy (DfE) Accounts Direction to Higher Education Institutions for 2018–19 financial statements.
Basis for opinion We conducted our audit in accordance with International Standards on Auditing (UK) (ISAs (UK)) and applicable law. Our responsibilities under those standards are further described in the Auditor’s responsibilities for the audit of the financial statements section of our report. We are independent of the Group in accordance with ethical requirements that are relevant to our audit of financial statements in the UK, including the Financial Reporting Council (FRC)’s Ethical Standard, and we have fulfilled our other ethical responsibilities in accordance with these requirements.
We believe that the audit evidence we have obtained is su"cient and appropriate to provide a basis for our opinion.
We have nothing to report on Going Concern Senate has prepared the financial statements on the going concern basis as they do not intend to liquidate the Group or the University or to cease their operations, and as they have concluded that the Group and the parent University’s financial position means that this is realistic. They have also concluded that there are no material uncertainties that could have cast significant doubt over their ability to continue as a going concern for at least a year from the date of approval of the financial statements (“the going concern period”).
We are required to report to you if we have concluded that the use of the going concern basis of accounting is inappropriate or there is an undisclosed material uncertainty that may cast significant doubt over the use of that basis for a period of at least a year from the date of approval of the financial statements. We have nothing to report in these respects.
However, as we cannot predict all future events or conditions and as subsequent events may result in outcomes that are inconsistent with judgements that were reasonable at the time they were made, the absence of reference to a material uncertainty in this auditor’s report is not a guarantee that the Group or the parent University will continue in operation.
Other information
Senate are responsible for the other information presented in the Annual Report together with the financial statements. The other information comprises the information included in the Vision and Strategy, Strategic Priorities and Enablers, Financial Review, Public Benefit Statement and Corporate Governance Statement. The financial statements and our auditor’s report thereon do not comprise part of the other information. Our opinion on the financial statements does not cover the other information and, accordingly, we do not express an audit opinion or, except as explicitly stated below, any form of assurance conclusion thereon.
Our responsibility is to read the other information and, in doing so, consider whether, based on our financial statements audit work, the information therein is materially misstated or inconsistent with the financial statements or our audit knowledge. Based solely on that work we have not identified material misstatements in the other information.
RESPECTIVE RESPONSIBILITIES AND RESTRICTIONS ON USE
Responsibilities of Senate for the financial statements As explained more fully in the Responsibilities of Senate Statement set out on page 56, Senate are responsible for: the preparation of the financial statements including being satisfied that they give a true and fair view; such internal control as they determine is necessary to enable the preparation of financial statements that are free from material misstatement, whether due to fraud or error; assessing the Group and parent University’s ability to continue as a going concern, disclosing, as applicable, matters related to going concern; and using the going concern basis of accounting unless they either intend to liquidate the Group and parent University or to cease operations, or have no realistic alternative but to do so.
Auditor’s responsibilities for the audit of the financial statementsOur objectives are to obtain reasonable assurance about whether the financial statements as a whole are free from material misstatement, whether due to fraud or error, and to issue an auditor’s report that includes our opinion. Reasonable assurance is a high level of assurance, but is not a guarantee that an audit conducted in accordance with ISAs (UK) will always detect a material misstatement when it exists. Misstatements can arise from fraud or error and are considered material if, individually or in the aggregate, they could reasonably be expected to influence the economic decisions of users taken on the basis of these financial statements. A fuller description of our responsibilities is provided on the FRC’s website at www.frc.org.uk/auditorsresponsibilities.
INDEPENDENT AUDITOR’S REPORT TO THE SENATE OF QUEEN’S UNIVERSITY BELFAST

58
INTEGRATED ANNUAL REPORT 2018–19
PROOF
REPORT ON OTHER LEGAL AND REGULATORY REQUIREMENTS
We are required to report on the following matters under the former Department for Employment and Learning (now DfE) Audit Code of Practice issued under the Further and Higher Education Act 1992.
In our opinion, in all material respects:
• funds from whatever source administered by the Group or the University for specific purposes have been properly applied to those purposes and managed in accordance with relevant legislation; and
• funds provided by the DfE have been applied in accordance with the Financial Memorandum and any other terms and conditions attached to them.
THE PURPOSES OF OUR AUDIT WORK AND TO WHOM WE OWE OUR RESPONSIBILITIES
Our report is made solely to Senate, in accordance with the Charter and Statutes of the institution. Our audit work has been undertaken so that we might state to Senate those matters we are required to state to them in an auditor’s report and for no other purpose. To the fullest extent permitted by law, we do not accept or assume responsibility to anyone other than the University and Senate, for our audit work, for this report, or for the opinions we have formed.
Sean O’Keefe (Senior Statutory Auditor) for and on behalf of KPMG, Statutory Auditor
Chartered Accountants The Soloist Building 1 Lanyon Place Belfast BT1 3LP
26 November 2019
INDEPENDENT AUDITOR’S REPORT TO THE SENATE OF QUEEN’S UNIVERSITY BELFAST

59
STATEMENT OF PRINCIPAL ACCOUNTING POLICIES
1. Statement of compliance and basis of preparation
These financial statements have been prepared on a going concern basis in accordance with the Statement of Recommended Practice (SORP): Accounting for Further and Higher Education 2015 and in accordance with Financial Reporting Standards (FRS 102). The University is a public benefit entity and therefore has applied the relevant public benefit requirement of FRS 102. The financial statements are prepared in accordance with the historical cost convention (as modified by the revaluation of fixed assets on the transition to FRS 102 as at 1 August 2014 and the revaluation of investments).
The University’s activities together with the factors likely to a!ect its future development, performance and position, are set out in the Financial Review which forms part of the Annual Report. Senate has a reasonable expectation that the University has adequate resources to continue in operational existence for the foreseeable future. Thus it continues to adopt the going concern basis of accounting in preparing the financial statements.
The financial statements are prepared in sterling which is the functional currency of the University and Group and rounded to the nearest £’000.
2. Basis of consolidation
The consolidated financial statements include the University and its wholly owned subsidiaries, QUBIS Limited, Queen’s Overseas Recruitment Limited, Queen’s Composites Limited and its partially owned subsidiary NIACE Limited. Intra–group transactions are eliminated in full on consolidation.
Joint ventures are accounted for using the equity method. The University has taken the exemption under section 3.3 of the SORP (1.12 of FRS 102) to not produce a Cash Flow Statement for the University.
Gains or losses on any intra-group transactions are eliminated in full.
Balances between the Group and its associates and joint ventures are not eliminated. Normal trading transactions that are not settled by the Balance Sheet date are included as current assets or liabilities. Any gains or losses are included in the carrying amount of assets of either entity, the part relating to the University’s share is eliminated.
3. Income recognition
Sale of goods and servicesIncome from the sale of goods or services is credited to the Consolidated and University Statements of Comprehensive Income (SOCI), when the goods or services are supplied to the external customers or the terms of the contract have been satisfied.
Fee income Fee income is stated gross of any expenditure which is not a discount and credited to the SOCI over the period in which students are studying. Bursaries and scholarships are accounted for gross, as expenditure, and not deducted from income.
Investment incomeInvestment income is credited to the SOCI on a receivable basis.
Government revenue grants Government revenue grants including the Department for the Economy (DfE) block grant and research grants are recognised in income over the periods in which the University recognises the related costs for which the grant is intended to compensate. Where part of a government grant is deferred, it is recognised as deferred income within creditors, and allocated between creditors due within one year and due after more than one year, as appropriate.
Non–government grants Grants (including research grants) from non–government sources are recognised in income when the University is entitled to the income and performance related conditions have been met. Income received in advance of performance related conditions being met, is recognised as deferred income within creditors on the Balance Sheet and released to income as the conditions are met.
Donations and endowmentsNon exchange transactions without performance related conditions are donations and endowments. Donations and endowments with donor imposed restrictions are recognised in income, when the University is entitled to the funds. Income is retained within the restricted reserve, until such time that it is utilised in line with such restrictions, at which point the income is released to general reserves through a reserve transfer. Donations with no restrictions are recognised in income when the University is entitled to the funds.
Investment income is recognised in income in the year in which it arises. Appreciation
of endowments, including gains/losses relating to disposals within the Investment Fund, is recorded as fair value gains/losses on investments in the year in which they arise. These items are shown as either restricted or unrestricted income according to the terms applied to the individual endowment fund. There are four main types of donations and endowments identified within reserves:
• Restricted donations – the donor has specified that the donation must be used for a particular objective.
• Unrestricted permanent endowments – the donor has specified that the fund is to be permanently invested to generate an income stream for the general benefit of the University.
• Restricted expendable endowments – the donor has specified a particular objective other than the purchase or construction of tangible fixed assets, and the University has the power to use the capital.
• Restricted permanent endowments – the donor has specified that the fund is to be permanently invested to generate an income stream to be applied to a particular objective.
Capital grantsCapital grants from government sources are recognised in income over the expected useful life of the asset. Other capital grants are recognised in income when the University is entitled to the funds subject to any performance related conditions being met.
4. Accounting for retirement benefits
The two principal pension schemes for the University’s sta! are the Universities Superannuation Scheme (USS) and the Retirement Benefits Plan of Queen’s University Belfast (RBP). The schemes are defined benefit schemes which are externally funded and contracted out of the State Second Pension (S2P). Each fund is valued every three years by professionally qualified independent actuaries. Further detail on the specific pension schemes is provided in note 34 to the accounts.
The USS is a multi–employer scheme. It is not possible to identify the assets and liabilities relating to University members due to the mutual nature of the scheme; therefore, this scheme is accounted for as a defined contribution retirement benefit scheme. As a result obligations for contributions to the USS scheme are recognised as an expense in the income

60
INTEGRATED ANNUAL REPORT 2018–19
PROOF
STATEMENT OF PRINCIPAL ACCOUNTING POLICIES
statement in the periods during which services are rendered by employees.
A liability is recorded within provisions for any contractual commitment to a recovery plan to fund past deficits within the USS scheme.
Under the RBP scheme, as a defined benefit scheme, the University’s obligation is to provide the agreed benefits to current and former employees, and actuarial risk (that benefits will cost more or less than expected) and investment risk (that returns on assets set aside to fund the benefits will di!er from expectations) are borne, in substance, by the University. The University and Group recognise a liability for its obligations under the RBP plan net of the plan’s assets; this liability is included in pension obligations (note 23). This net liability is measured as the estimated amount of benefit that employees have earned in return for their service in the current and prior periods, discounted to determine its present value, less the fair value (at bid price) of plan assets. The calculation is performed by a qualified actuary using the projected unit credit method.
Changes in the net defined benefit liability arising from employee service rendered during the period, net interest on net defined benefit liability, and the cost of plan introductions, benefit changes curtailments and settlements during the period are recognised in the SOCI. Actuarial gains and losses arising from experience adjustments and changes in the actuarial assumptions are charged or credited to other comprehensive income. These amounts together with the return on plan assets, less amounts included in net interest, are disclosed as actuarial gains and losses.
5. Employment benefits
Short term employment benefits such as salaries and compensated absences, are recognised as an expense in the year in which the employees render service to the University. Any unused benefits are accrued, and measured as the additional amount the University expects to pay as a result of the unused entitlement.
6. Foreign currency
Transactions in foreign currencies are translated to sterling at the foreign exchange rate ruling at the date of the transaction. Monetary assets and liabilities denominated in foreign currencies at the balance sheet date are translated to sterling at the foreign exchange rate ruling at that date. Foreign exchange di!erences arising on translation are recognised in the surplus/ (loss) for the year.
7. Interest payable
Interest payable and similar charges includes interest payable, finance charges, unwinding of the discount on provisions and material net foreign exchange losses that are recognised in the SOCI.
8. Exceptional items
Items of exceptional size or incidence which are considered material due to their nature or amount are disclosed separately on the face of the SOCI where it is considered relevant to the understanding of the financial position of the Group and University. Further detail on these items is provided in the notes to the accounts. Consideration is given to such items, with a value in excess of £20m, on a case by case basis.
9. Fixed assets
Fixed assets are stated at cost/deemed cost less accumulated depreciation and accumulated impairment losses.
Land and buildingsFreehold land and buildings and long leasehold land and buildings were revalued to fair value on the date of transition to the 2015 SORP, and these assets are measured on the basis of deemed cost, being the revalued amount at the date of that revaluation. All new land and buildings, completed or purchased, since the date of transition to the 2015 SORP are stated at cost. Costs incurred in relation to land and buildings after initial purchase or construction, and/or valuation, are capitalised to the extent that they increase the expected future benefits to the University.
Freehold land is not depreciated, as it is considered to have an indefinite useful life. Freehold and long leasehold buildings are depreciated on a straight line basis over their expected useful lives. For buildings revalued at fair value at transition date, the estimated useful life is that determined as part of the revaluation exercise. For all other buildings the estimated useful life is either 40 or 60 years depending on the category of the building in question.
No depreciation is charged on assets in the course of construction.
EquipmentEquipment, including micro–computers and software, costing less than £25,000 per individual item, or group of related items, is written o! in the year of acquisition. All other equipment is capitalised.
Capitalised equipment is stated at cost. Cost includes the original purchase price of the asset and the costs attributable to
bringing the asset to its working condition for its intended use. The capitalised equipment is depreciated on a straight line basis over its expected useful life, as follows:
Motor vehicles and other general equipment 4 years
Equipment acquired for specific research projects 2–3 years
Where assets are donated or acquired with the aid of specific grants or donations they are capitalised and depreciated as outlined above.
Depreciation methods, useful lives and residual values are reviewed at the date of preparation of each Balance Sheet.
Impairment
A review for impairment of fixed assets is carried out if events or changes in circumstances indicate that the carrying amount of the asset may not be recoverable.
10. Heritage assets
Heritage assets are tangible assets with historical, artistic, scientific, technological, geophysical or environmental qualities that are held and maintained principally for their contribution to knowledge and culture. Works of art and other valuable artefacts, acquired since 1 August 2007, and valued at over £25,000, have been capitalised and recognised at the cost or value of the acquisition, where such a cost or valuation is reasonably obtainable.
Heritage assets are not depreciated as their long economic life and high residual value, mean that any depreciation would not be material.
11. Investment properties
Investment property comprises land and buildings held for rental income, or capital appreciation, rather than for use in delivering services.
Investment properties are measured initially at cost, or deemed cost at the date of transition to the 2015 SORP, and subsequently at fair value at the end of each reporting period with movements recognised in the SOCI.
Investment properties are not depreciated and are held at fair value.
12. Investments
Non–current investments in equity instruments are measured initially at fair value, which is normally the transaction price. Subsequent to initial recognition, investments, that can be measured reliably, are measured at fair value, with changes
61
STATEMENT OF PRINCIPAL ACCOUNTING POLICIES
in measurement recognised in the SOCI. Realised gains on disposals within the Investment Fund are reinvested within the Fund and recognised within total income for the year and are included within fair value gain on investments and investment property in the SOCI. Realised gains on disposal of equity investments or from the Investment Fund which are realised, are included within gain on disposal of investments within the surplus before tax and fair value gain on investment. Current asset investments relate to deposits held with banks and building societies in the UK, and are initially recognised at transaction price plus attributable transaction costs. Subsequent to initial recognition they are measured at amortised cost using the e!ective interest method, less any impairment losses.
Investments in associates are held at the fair value. Changes in fair value are recognised through other comprehensive income in the relevant subsidiary accounts. In the consolidated financial statements, changes in fair value are recognised in the SOCI.
Investments in subsidiaries are measured at cost less impairment in the University Balance Sheet.
13. Stock
Stock is held at the lower of cost and net realisable value, and is measured on the basis of a first in first out approach.
14. Cash and cash equivalents
Cash includes cash in hand, deposits repayable on demand and overdrafts. Deposits are repayable on demand if they are in practice available within 24 hours without penalty. Cash equivalents are highly liquid investments, with a term of up to 3 months, which are readily convertible to known amounts of cash with insignificant risk of change in value.
15. Provisions, contingent liabilities and contingent assets
Provisions are recognised in the financial statements when:
(a) the University has a present obligation (legal or constructive) as a result of a past event;
(b) it is probable that an outflow of economic benefits will be required to settle the obligation; and
(c) a reliable estimate can be made of the amount of the obligation.
The amount recognised as a provision is determined by discounting the expected future cash flows at a pre–tax rate that reflects risks specific to the liability.
A contingent liability arises from a past event that gives the University a possible obligation, whose existence will only be confirmed by the occurrence, or otherwise, of uncertain future events, not wholly within the control of the University. Contingent liabilities also arise in circumstances where a provision would otherwise be made, but either it is not probable that an outflow of resources will be required, or the amount of the obligation cannot be measured reliably. Contingent liabilities are not recognised in the Balance Sheet but are disclosed in the notes.
16. Accounting for joint operations, jointly controlled assets and jointly controlled operations
The University accounts for its share of joint ventures using the equity method. The University accounts for its share of transactions from joint operations and jointly controlled assets in the SOCI.
17. Concessionary loans
Concessionary loans are measured initially at the amounts received and adjusted to reflect any accrued interest and/or repayment of capital.
18. Financial instruments
The University has elected to adopt Sections 11 and 12 of FRS 102 in respect of the recognition, measurement, and disclosure of financial instruments. Financial assets and liabilities are recognised when the University becomes party to the contractual provision of the instrument and they are classified according to the substance of the contractual arrangements entered into.
A financial asset and a financial liability are o!set only when there is a legally enforceable right to set o! the recognised amounts and an intention either to settle on a net basis, or to realise the asset and settle the liability simultaneously. Financial assets
Basic financial assets include trade and other receivables, cash and cash equivalents, and investments in commercial paper (i.e. deposits and bonds). These assets are initially recognised at transaction price unless the arrangement constitutes a financing transaction, where the transaction is measured at the present value of the future receipts discounted at a market rate of interest. Such assets are subsequently carried at amortised cost using the e!ective interest rate method. Financial assets are assessed for indicators of impairment at each reporting date. If there is objective evidence of impairment, an impairment loss is recognised in the SOCI.
For financial assets carried at amortised cost the impairment loss is the di!erence between the carrying amount of the asset and the present value of the estimated future cash flows, discounted at the asset’s original e!ective interest rate.
Other financial assets, including investments in equity instruments which are not subsidiaries, associates, or joint ventures are initially measured at fair value, which is typically the transaction price. These assets are subsequently carried at fair value and changes in fair value at the reporting date are recognised in the SOCI. Where the investment in equity instruments are not publicly traded and where the fair value cannot be reliably measured the assets are measured at cost less impairment.
Financial assets are de-recognised when the contractual rights to the cash flows from the asset expire or are settled or substantially all of the risks and rewards of the ownership of the asset are transferred to another party.
Financial liabilities
Basic financial liabilities include trade and other payables, bank loans, and intra-group loans. These liabilities are initially recognised at transaction price unless the arrangement constitutes a financing transaction, where the debt instrument is measured at the present value of the future payments discounted at a market rate of interest. Debt instruments are subsequently carried at amortised cost using the e!ective interest rate method.
Trade payables are obligations to pay for goods and services that have been acquired in the ordinary course of business from suppliers. Accounts payable are classified as current liabilities if payment is due within one year or less. If not, they are presented as non-current liabilities. Trade payables are recognised initially at transaction price and subsequently measured at amortised cost using the e!ective interest rate method.
Financial liabilities are de-recognised when the liability is discharged, cancelled or expires.
19. Taxation
The University is an exempt charity within the meaning of Part 3 of the Charities Act 2011, and, as such, is a charity within the meaning of Para 1 of schedule 6 to the Finance Act 2010. Accordingly, the University is potentially exempt from taxation in respect of income or capital gains received within categories covered by Section 478-488 of the Corporation Tax Act 2010 to the extent that such income or gains are applied to exclusively charitable purposes. The University’s non–charitable
62
INTEGRATED ANNUAL REPORT 2018–19
PROOF
STATEMENT OF PRINCIPAL ACCOUNTING POLICIES
subsidiaries are liable to Corporation Tax in the same way as any other commercial organisation.
The University receives no similar exemption in respect of Value Added Tax (VAT). Irrecoverable VAT on inputs is included in the cost of such inputs. Any irrecoverable VAT allocated to fixed assets is included in their cost.
Where appropriate, deferred tax is provided in full on timing di!erences which result in an obligation at the Balance Sheet date to pay more tax, or a right to pay less tax at a future date, at rates expected to apply when they crystallise based on current rates and law. Timing di!erences arise from the inclusion of items of income and expenditure in taxation computations
in periods di!erent from those in which there are included in financial statements. Deferred tax assets are recognised to the extent they are regarded as more likely than not that they will be recovered. Deferred tax assets and liabilities are not discounted.
20. Reserves
Reserves are classified as restricted or unrestricted. Restricted endowment reserves include balances which, through endowment to the University, are held as a permanently restricted fund which the University must hold in perpetuity. Other restricted reserves include balances where the donor has designated a specific purpose and therefore the University is restricted in the use of these funds.
21. Critical accounting estimates and judgements
The preparation of the University’s financial statements requires management to make judgements, estimates and assumptions that a!ect the application of accounting policies and reported amounts of assets and liabilities, income and expenses. These judgements, estimates and associated assumptions are based on historical experience and other factors including expectations of future events that are believed to be reasonable under the circumstances. The resulting accounting estimates will, by definition, seldom equal the related actual results. Details are outlined in note 35.
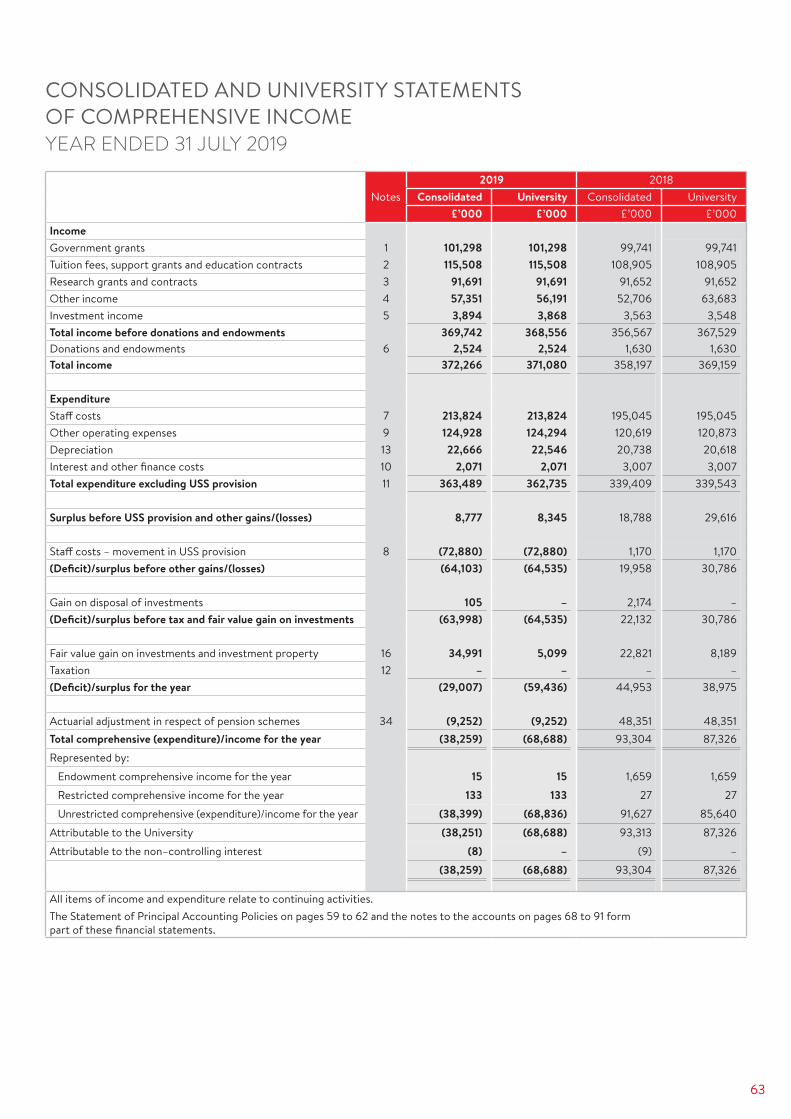
63
CONSOLIDATED AND UNIVERSITY STATEMENTS OF COMPREHENSIVE INCOME YEAR ENDED 31 JULY 2019
Notes2019 2018
Consolidated University Consolidated University£’000 £’000 £’000 £’000
Income Government grants 1 101,298 101,298 99,741 99,741 Tuition fees, support grants and education contracts 2 115,508 115,508 108,905 108,905 Research grants and contracts 3 91,691 91,691 91,652 91,652 Other income 4 57,351 56,191 52,706 63,683 Investment income 5 3,894 3,868 3,563 3,548 Total income before donations and endowments 369,742 368,556 356,567 367,529Donations and endowments 6 2,524 2,524 1,630 1,630Total income 372,266 371,080 358,197 369,159
ExpenditureSta! costs 7 213,824 213,824 195,045 195,045 Other operating expenses 9 124,928 124,294 120,619 120,873 Depreciation 13 22,666 22,546 20,738 20,618 Interest and other finance costs 10 2,071 2,071 3,007 3,007 Total expenditure excluding USS provision 11 363,489 362,735 339,409 339,543
Surplus before USS provision and other gains/(losses) 8,777 8,345 18,788 29,616
Sta! costs – movement in USS provision 8 (72,880) (72,880) 1,170 1,170(Deficit)/surplus before other gains/(losses) (64,103) (64,535) 19,958 30,786
Gain on disposal of investments 105 – 2,174 –(Deficit)/surplus before tax and fair value gain on investments (63,998) (64,535) 22,132 30,786
Fair value gain on investments and investment property 16 34,991 5,099 22,821 8,189Taxation 12 – – – –(Deficit)/surplus for the year (29,007) (59,436) 44,953 38,975
Actuarial adjustment in respect of pension schemes 34 (9,252) (9,252) 48,351 48,351Total comprehensive (expenditure)/income for the year (38,259) (68,688) 93,304 87,326Represented by: Endowment comprehensive income for the year 15 15 1,659 1,659 Restricted comprehensive income for the year 133 133 27 27 Unrestricted comprehensive (expenditure)/income for the year (38,399) (68,836) 91,627 85,640Attributable to the University (38,251) (68,688) 93,313 87,326Attributable to the non–controlling interest (8) – (9) –
(38,259) (68,688) 93,304 87,326
All items of income and expenditure relate to continuing activities.The Statement of Principal Accounting Policies on pages 59 to 62 and the notes to the accounts on pages 68 to 91 form part of these financial statements.
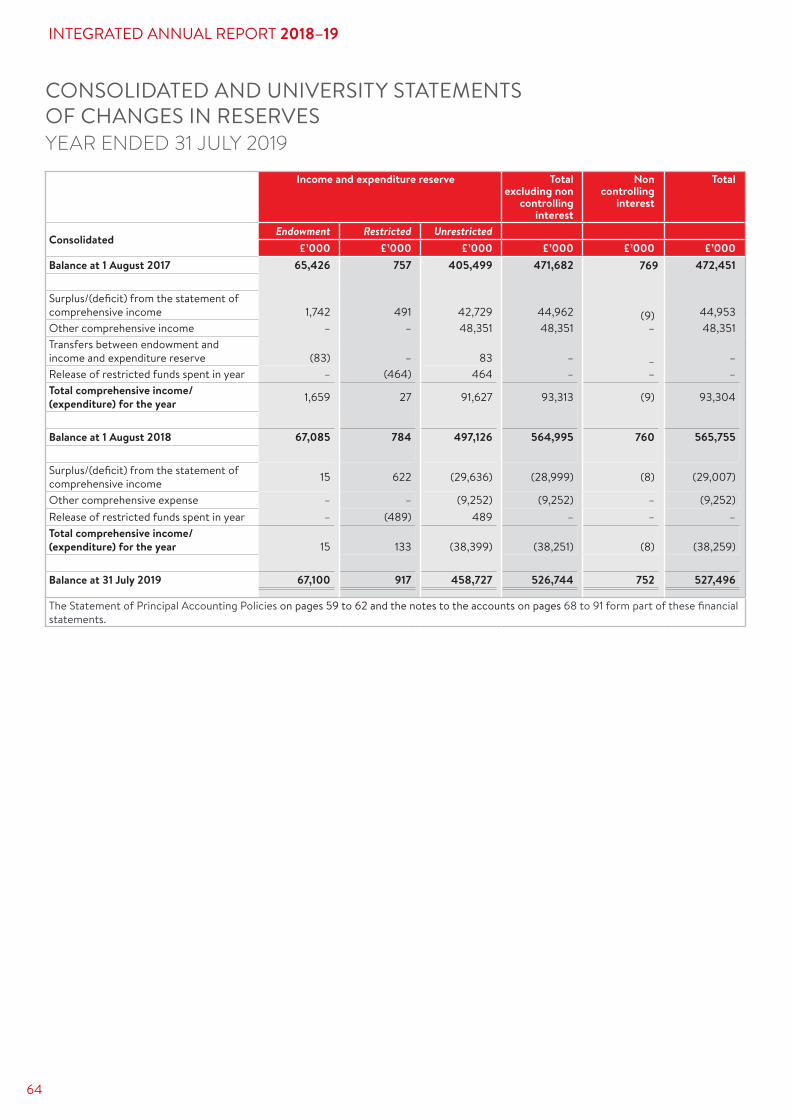
64
INTEGRATED ANNUAL REPORT 2018–19
PROOF
CONSOLIDATED AND UNIVERSITY STATEMENTS OF CHANGES IN RESERVES YEAR ENDED 31 JULY 2019
Income and expenditure reserve Total excluding non
controlling interest
Non controlling
interest
Total
ConsolidatedEndowment Restricted Unrestricted
£’000 £’000 £’000 £’000 £’000 £’000Balance at 1 August 2017 65,426 757 405,499 471,682 769 472,451
Surplus/(deficit) from the statement of comprehensive income 1,742 491 42,729 44,962 (9) 44,953Other comprehensive income – – 48,351 48,351 – 48,351Transfers between endowment and income and expenditure reserve (83) – 83 – – –Release of restricted funds spent in year – (464) 464 – – –Total comprehensive income/(expenditure) for the year 1,659 27 91,627 93,313 (9) 93,304
Balance at 1 August 2018 67,085 784 497,126 564,995 760 565,755
Surplus/(deficit) from the statement of comprehensive income 15 622 (29,636) (28,999) (8) (29,007)
Other comprehensive expense – – (9,252) (9,252) – (9,252)Release of restricted funds spent in year – (489) 489 – – –Total comprehensive income/(expenditure) for the year 15 133 (38,399) (38,251) (8) (38,259)
Balance at 31 July 2019 67,100 917 458,727 526,744 752 527,496
The Statement of Principal Accounting Policies on pages 59 to 62 and the notes to the accounts on pages 68 to 91 form part of these financial statements.
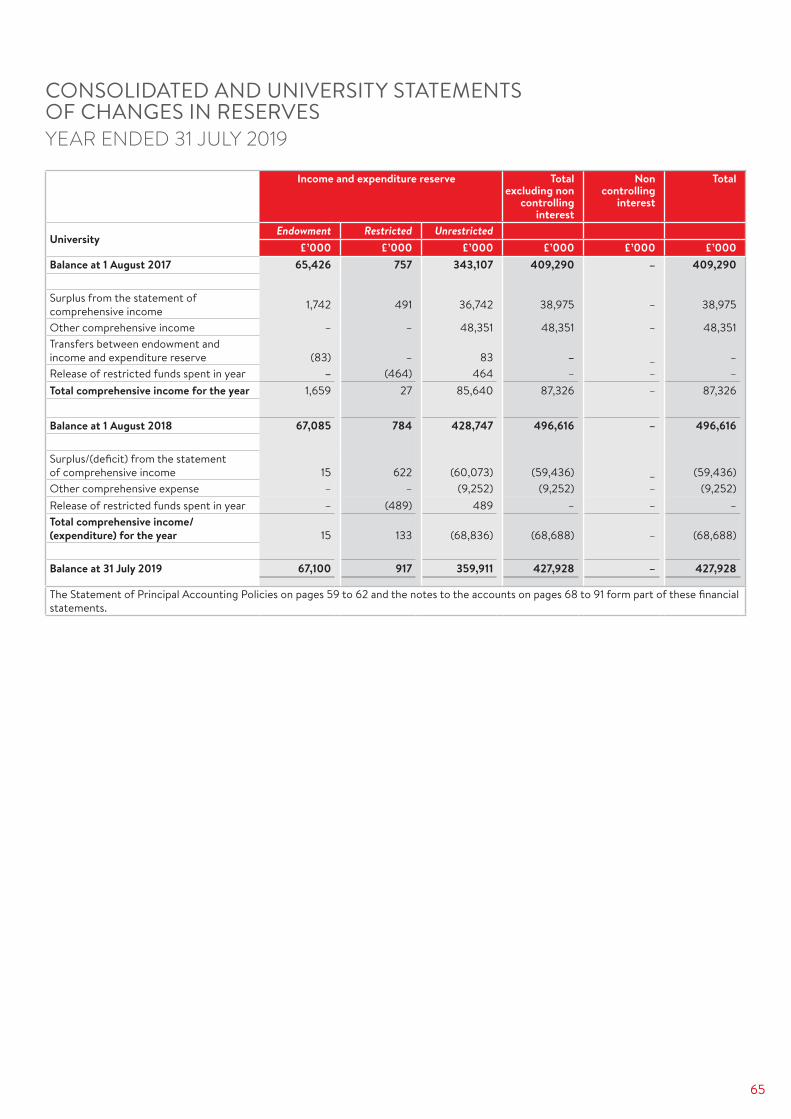
65
Income and expenditure reserve Total excluding non
controlling interest
Non controlling
interest
Total
UniversityEndowment Restricted Unrestricted
£’000 £’000 £’000 £’000 £’000 £’000Balance at 1 August 2017 65,426 757 343,107 409,290 – 409,290
Surplus from the statement of comprehensive income 1,742 491 36,742 38,975 – 38,975
Other comprehensive income – – 48,351 48,351 – 48,351Transfers between endowment and income and expenditure reserve (83) – 83 – – –Release of restricted funds spent in year – (464) 464 – – –Total comprehensive income for the year 1,659 27 85,640 87,326 – 87,326
Balance at 1 August 2018 67,085 784 428,747 496,616 – 496,616
Surplus/(deficit) from the statement of comprehensive income 15 622 (60,073) (59,436) – (59,436)Other comprehensive expense – – (9,252) (9,252) – (9,252)Release of restricted funds spent in year – (489) 489 – – –Total comprehensive income/(expenditure) for the year 15 133 (68,836) (68,688) – (68,688)
Balance at 31 July 2019 67,100 917 359,911 427,928 – 427,928
The Statement of Principal Accounting Policies on pages 59 to 62 and the notes to the accounts on pages 68 to 91 form part of these financial statements.
CONSOLIDATED AND UNIVERSITY STATEMENTS OF CHANGES IN RESERVES YEAR ENDED 31 JULY 2019
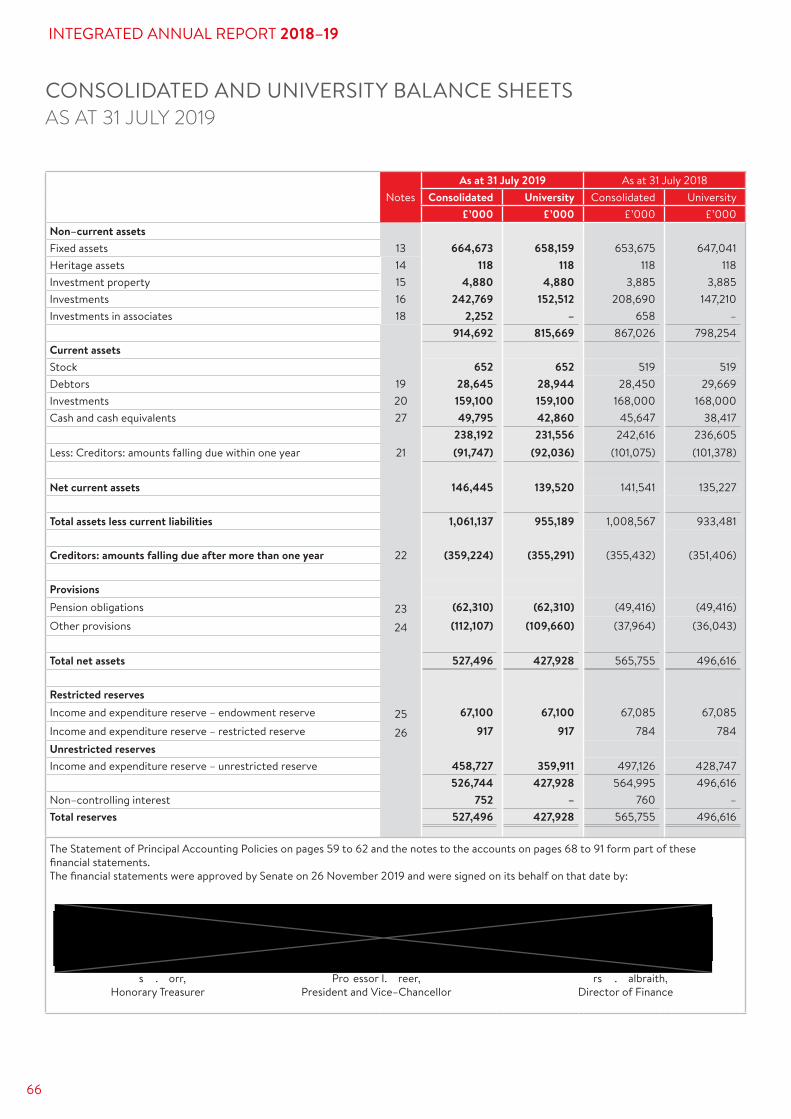
66
INTEGRATED ANNUAL REPORT 2018–19
CONSOLIDATED AND UNIVERSITY BALANCE SHEETSAS AT 31 JULY 2019
NotesAs at 31 July 2019 As at 31 July 2018
Consolidated University Consolidated University£’000 £’000 £’000 £’000
Non–current assetsFixed assets 13 664,673 658,159 653,675 647,041 Heritage assets 14 118 118 118 118 Investment property 15 4,880 4,880 3,885 3,885 Investments 16 242,769 152,512 208,690 147,210 Investments in associates 18 2,252 – 658 –
914,692 815,669 867,026 798,254Current assetsStock 652 652 519 519 Debtors 19 28,645 28,944 28,450 29,669 Investments 20 159,100 159,100 168,000 168,000 Cash and cash equivalents 27 49,795 42,860 45,647 38,417
238,192 231,556 242,616 236,605Less: Creditors: amounts falling due within one year 21 (91,747) (92,036) (101,075) (101,378)
Net current assets 146,445 139,520 141,541 135,227
Total assets less current liabilities 1,061,137 955,189 1,008,567 933,481
Creditors: amounts falling due after more than one year 22 (359,224) (355,291) (355,432) (351,406)
ProvisionsPension obligations 23 (62,310) (62,310) (49,416) (49,416)Other provisions 24 (112,107) (109,660) (37,964) (36,043)
Total net assets 527,496 427,928 565,755 496,616
Restricted reserves Income and expenditure reserve – endowment reserve 25 67,100 67,100 67,085 67,085 Income and expenditure reserve – restricted reserve 26 917 917 784 784 Unrestricted reservesIncome and expenditure reserve – unrestricted reserve 458,727 359,911 497,126 428,747
526,744 427,928 564,995 496,616Non–controlling interest 752 – 760 –Total reserves 527,496 427,928 565,755 496,616
The Statement of Principal Accounting Policies on pages 59 to 62 and the notes to the accounts on pages 68 to 91 form part of these financial statements.The financial statements were approved by Senate on 26 November 2019 and were signed on its behalf on that date by:
rs . albraith, Director of Finance
s . orr, Honorary Treasurer
Pro essor I. reer, President and Vice–Chancellor

67
CONSOLIDATED CASH FLOW STATEMENTYEAR ENDED 31 JULY 2019
Notes2019 2018
£’000 £’000Cash flow from operating activities(Deficit)/surplus for the year (29,007) 44,953Adjustment for non–cash itemsDepreciation 13 22,666 20,738Release of deferred capital grants (15,725) (14,996)Gain on disposal of investments (105) (2,174)Fair value gain on investments and investment property 16 (34,991) (22,821)(Increase)/decrease in stock (133) 7(Increase) in debtors 19 (195) (1,101)(Decrease) in creditors 21 (9,849) (1,258)Increase/(decrease) in pension provision 23 12,894 (44,684)Actuarial adjustment to pension provision 34 (9,252) 48,351Increase/(decrease) in other provisions 24 74,143 (991)Adjustments for investing or financing activitiesInvestment income 5 (3,894) (3,563)Interest payable 10 – –Endowment income 6 (346) (182)Net cash inflow from operating activities 6,206 22,279
Cash flows from investing activitiesCapital grants receipts 21,313 27,796 Disposal of non–current asset investments 3,870 18,270 Other endowment/investments 48 (2,371)Investment income 3,894 3,563 Payments made to acquire fixed assets 13 (34,768) (80,456)New non–current asset investments 16 (4,211) (5,002)Realised/(new) deposits 8,900 (3,000)New associate investments (175) –
(1,129) (41,200)Cash flows from financing activitiesEndowment cash received 346 182 New unsecured loans – 8,000 Repayments of amounts borrowed (1,275) (961)
(929) 7,221
Increase/(decrease) in cash and cash equivalents in the year 4,148 (11,700)
Cash and cash equivalents at beginning of the year 27 45,647 57,347 Cash and cash equivalents at end of the year 27 49,795 45,647
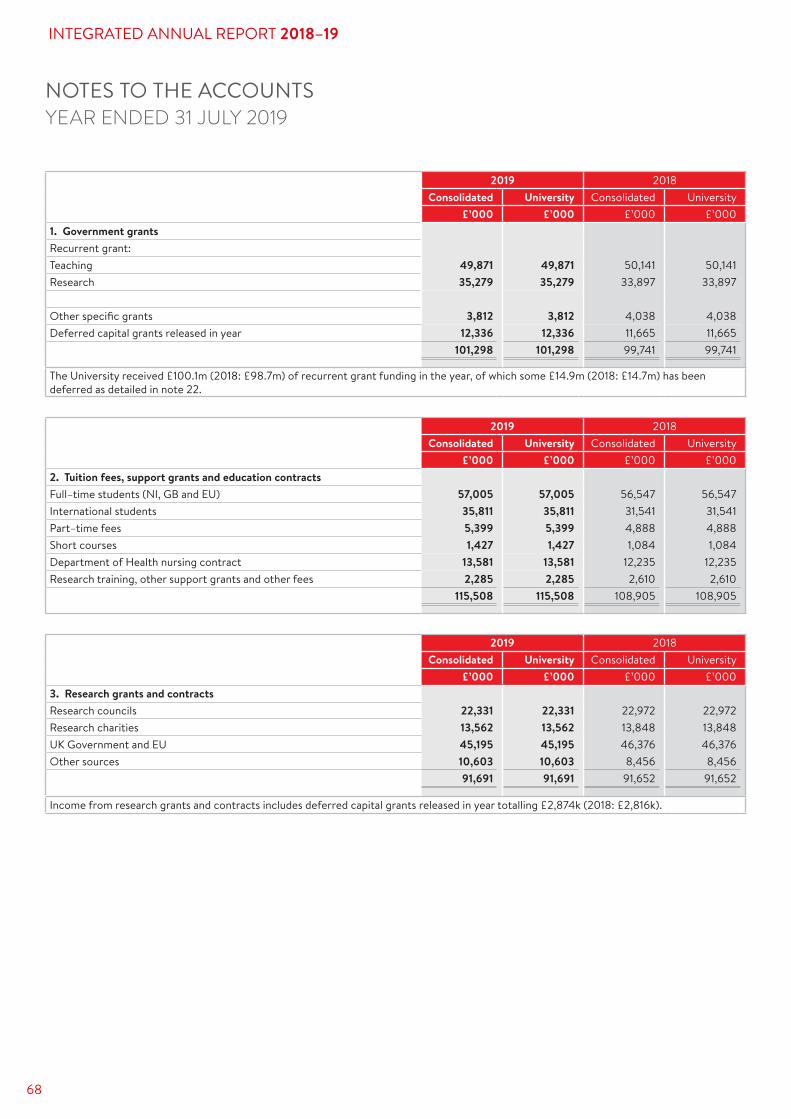
68
INTEGRATED ANNUAL REPORT 2018–19
PROOF
NOTES TO THE ACCOUNTSYEAR ENDED 31 JULY 2019
2019 2018Consolidated University Consolidated University
£’000 £’000 £’000 £’0001. Government grants Recurrent grant:Teaching 49,871 49,871 50,141 50,141 Research 35,279 35,279 33,897 33,897
Other specific grants 3,812 3,812 4,038 4,038 Deferred capital grants released in year 12,336 12,336 11,665 11,665
101,298 101,298 99,741 99,741
The University received £100.1m (2018: £98.7m) of recurrent grant funding in the year, of which some £14.9m (2018: £14.7m) has been deferred as detailed in note 22.
2019 2018Consolidated University Consolidated University
£’000 £’000 £’000 £’0002. Tuition fees, support grants and education contracts Full–time students (NI, GB and EU) 57,005 57,005 56,547 56,547 International students 35,811 35,811 31,541 31,541 Part–time fees 5,399 5,399 4,888 4,888 Short courses 1,427 1,427 1,084 1,084 Department of Health nursing contract 13,581 13,581 12,235 12,235 Research training, other support grants and other fees 2,285 2,285 2,610 2,610
115,508 115,508 108,905 108,905
2019 2018Consolidated University Consolidated University
£’000 £’000 £’000 £’0003. Research grants and contracts Research councils 22,331 22,331 22,972 22,972 Research charities 13,562 13,562 13,848 13,848 UK Government and EU 45,195 45,195 46,376 46,376 Other sources 10,603 10,603 8,456 8,456
91,691 91,691 91,652 91,652
Income from research grants and contracts includes deferred capital grants released in year totalling £2,874k (2018: £2,816k).
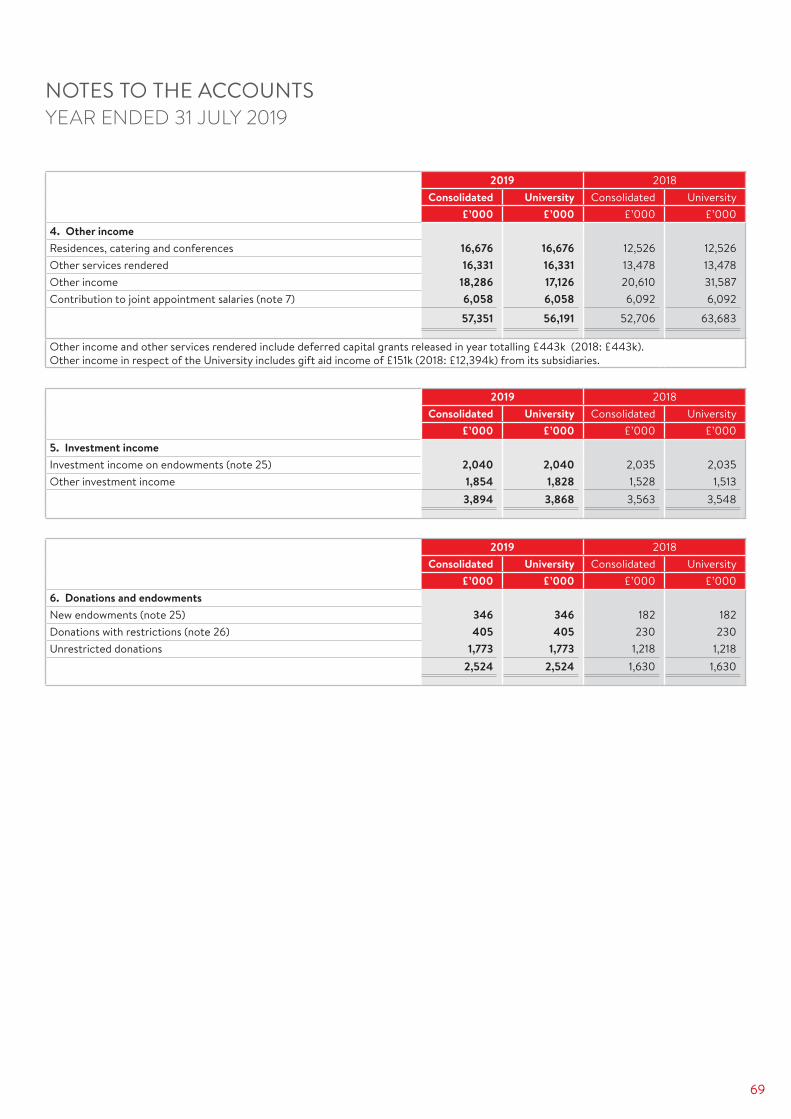
69
2019 2018Consolidated University Consolidated University
£’000 £’000 £’000 £’0004. Other income Residences, catering and conferences 16,676 16,676 12,526 12,526 Other services rendered 16,331 16,331 13,478 13,478 Other income 18,286 17,126 20,610 31,587 Contribution to joint appointment salaries (note 7) 6,058 6,058 6,092 6,092
57,351 56,191 52,706 63,683
Other income and other services rendered include deferred capital grants released in year totalling £443k (2018: £443k).Other income in respect of the University includes gift aid income of £151k (2018: £12,394k) from its subsidiaries.
2019 2018Consolidated University Consolidated University
£’000 £’000 £’000 £’0005. Investment income Investment income on endowments (note 25) 2,040 2,040 2,035 2,035 Other investment income 1,854 1,828 1,528 1,513
3,894 3,868 3,563 3,548
2019 2018Consolidated University Consolidated University
£’000 £’000 £’000 £’0006. Donations and endowments New endowments (note 25) 346 346 182 182 Donations with restrictions (note 26) 405 405 230 230 Unrestricted donations 1,773 1,773 1,218 1,218
2,524 2,524 1,630 1,630
NOTES TO THE ACCOUNTSYEAR ENDED 31 JULY 2019

70
INTEGRATED ANNUAL REPORT 2018–19
PROOF
2019 2018Consolidated University Consolidated University
£’000 £’000 £’000 £’0007. Sta! costs Sta! costs:Salaries 163,702 163,702 149,259 149,259 Social security costs 14,757 14,757 13,699 13,699 Other pension costs 20,538 20,538 18,760 18,760 Current service cost – RBP pension scheme 8,769 8,769 7,235 7,235
207,766 207,766 188,953 188,953 Joint appointment salaries (note 4) 6,058 6,058 6,092 6,092
213,824 213,824 195,045 195,045
Included within sta! costs is £5,222k (2018: £4,716k) relating to amounts paid to teaching assistants, temporary lecturers and other temporary sta!, who were not employed under contract by the University, and are therefore not included in sta! numbers.
2019 2018Consolidated and University
£’000 £’000Emoluments of the Vice–Chancellor:
Salary 295 –Pension contributions to USS 6 –
301 –
Emoluments of the Acting Vice–Chancellor:
Salary – 213 Pension contributions to USS – 7
– 220Total emoluments paid 301 220
In respect of the Vice–Chancellor an additional £nil (2018: £1k) was also paid as an employer’s pension scheme contribution, which represented the employee’s contribution relinquished under the University’s salary sacrifice scheme. The Vice–Chancellor received no additional taxable benefits (2018: £nil). The University requires the Vice-Chancellor to occupy accommodation on the University Campus which comprises of private living accommodation and space for business use. This is treated as a non taxable benefit valued at an estimated annual market rental of £15k for a similar property (prorated to reflect only personal use). A recruitment process for the new Vice–Chancellor was undertaken in 2017–18 and Professor Ian Greer was appointed with e!ect from 1 August 2018. Professor Greer’s remuneration package was determined by the Remuneration Committee and is commensurate with the size of the institution, its budget and the scale of its operations. Queen’s is a highly complex organisation, making a significant contribution to the economic and social wellbeing of the city and the region, and operating in an increasingly competitive environment, which requires the very highest level of leadership. In determining the package, the Remuneration Committee considered relevant benchmark data for the Vice–Chancellors’ pay in universities of similar size and complexity. Accordingly, Professor Greer’s salary was agreed at £295,000. The package reflects the complex demands of the role and is comparable with the lower–range packages within the Russell Group.The Vice-Chancellor’s basic salary is 8.1 times the median pay of sta!, where the median pay is calculated on a full time equivalent basis for the salaries provided by the University to its sta!.The Vice-Chancellor’s total remuneration is 7.0 times the median total remuneration of sta!, where the median total remuneration is calculated on a full time equivalent basis for the total remuneration provided by the University to its sta!.The pay median does not include workers who were not employed under contract by the University.
NOTES TO THE ACCOUNTSYEAR ENDED 31 JULY 2019

71
2019 2018Consolidated and University
Number Number 7. Sta! costs (continued)Salary of higher paid sta!, excluding employer’s pension contributions and the NHS funded element of joint appointments:
£100,000 to £104,999 3 8£105,000 to £109,999 3 3£110,000 to £114,999 9 6£115,000 to £119,999 5 4£120,000 to £124,999 2 3£125,000 to £129,999 3 2£130,000 to £134,999 – 1£135,000 to £139,999 3 –£140,000 to £144,999 – –£145,000 to £149,999 – 1£150,000 to £154,999 – –£155,000 to £159,999 – 1£160,000 to £164,999 – –£165,000 to £169,999 1 –£210,000 to £214,999 – 1£295,000 to £299,999 1 –
2019 2018Consolidated and University
Number Number Sta! numbersAverage sta! numbers by major category:Academic 1,196 1,100Research 669 642Academic related 833 795Technical and clerical 1,008 960Other 481 452
4,187 3,949
2019 2018Consolidated and University
£’000 £’000Key management personnelKey management personnel are those persons having authority and responsibility for planning, directing and controlling the activities of the University. Sta! costs, outlined below, include compensation consisting of salary, benefits, employer’s pension contribution and employer’s social security contribution paid to key management personnel. Due to vacancies in the prior year and changes in the University’s management structure, the full time equivalent (FTE) included within key management personnel in 2018-19 has increased to 11.0 (2018: 9.3 FTE).
Key management personnel compensation 2,135 1,697
NOTES TO THE ACCOUNTSYEAR ENDED 31 JULY 2019
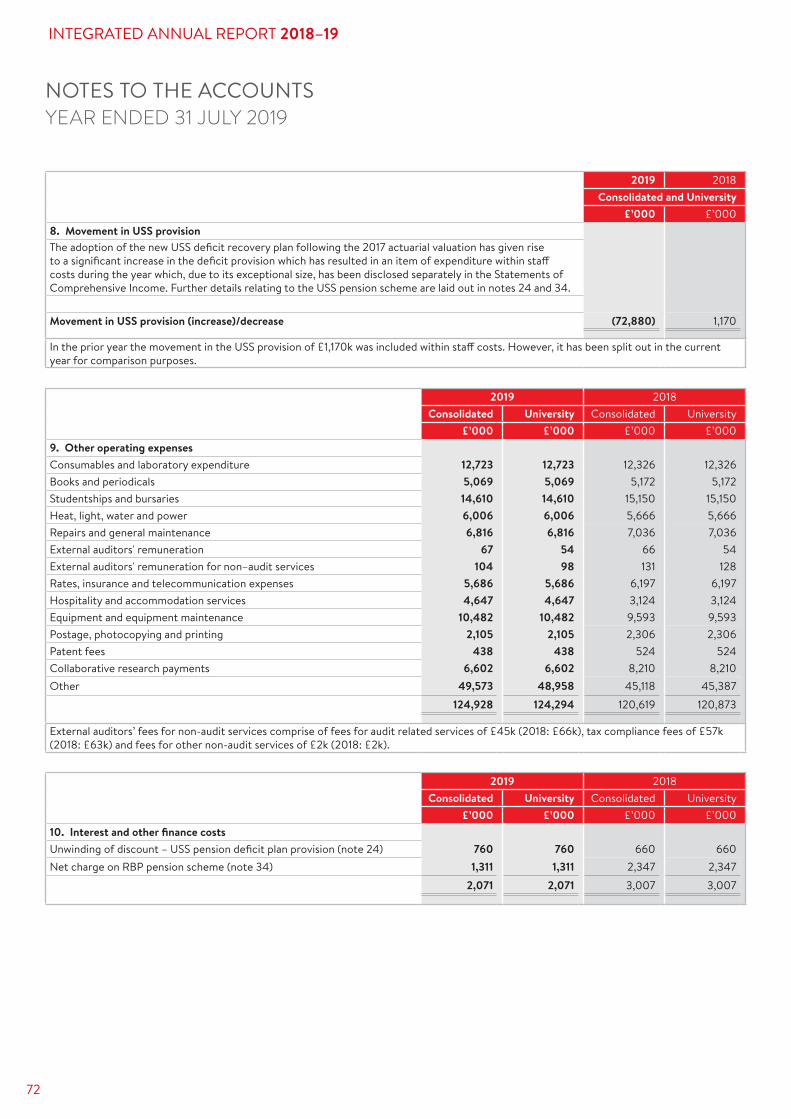
72
INTEGRATED ANNUAL REPORT 2018–19
PROOF
2019 2018Consolidated University Consolidated University
£’000 £’000 £’000 £’0009. Other operating expenses Consumables and laboratory expenditure 12,723 12,723 12,326 12,326 Books and periodicals 5,069 5,069 5,172 5,172 Studentships and bursaries 14,610 14,610 15,150 15,150 Heat, light, water and power 6,006 6,006 5,666 5,666 Repairs and general maintenance 6,816 6,816 7,036 7,036 External auditors' remuneration 67 54 66 54 External auditors' remuneration for non–audit services 104 98 131 128 Rates, insurance and telecommunication expenses 5,686 5,686 6,197 6,197 Hospitality and accommodation services 4,647 4,647 3,124 3,124 Equipment and equipment maintenance 10,482 10,482 9,593 9,593 Postage, photocopying and printing 2,105 2,105 2,306 2,306 Patent fees 438 438 524 524 Collaborative research payments 6,602 6,602 8,210 8,210 Other 49,573 48,958 45,118 45,387
124,928 124,294 120,619 120,873
External auditors’ fees for non-audit services comprise of fees for audit related services of £45k (2018: £66k), tax compliance fees of £57k (2018: £63k) and fees for other non-audit services of £2k (2018: £2k).
2019 2018Consolidated University Consolidated University
£’000 £’000 £’000 £’00010. Interest and other finance costsUnwinding of discount – USS pension deficit plan provision (note 24) 760 760 660 660 Net charge on RBP pension scheme (note 34) 1,311 1,311 2,347 2,347
2,071 2,071 3,007 3,007
NOTES TO THE ACCOUNTSYEAR ENDED 31 JULY 2019
2019 2018Consolidated and University
£’000 £’0008. Movement in USS provision The adoption of the new USS deficit recovery plan following the 2017 actuarial valuation has given rise to a significant increase in the deficit provision which has resulted in an item of expenditure within sta! costs during the year which, due to its exceptional size, has been disclosed separately in the Statements of Comprehensive Income. Further details relating to the USS pension scheme are laid out in notes 24 and 34.
Movement in USS provision (increase)/decrease (72,880) 1,170
In the prior year the movement in the USS provision of £1,170k was included within sta! costs. However, it has been split out in the current year for comparison purposes.
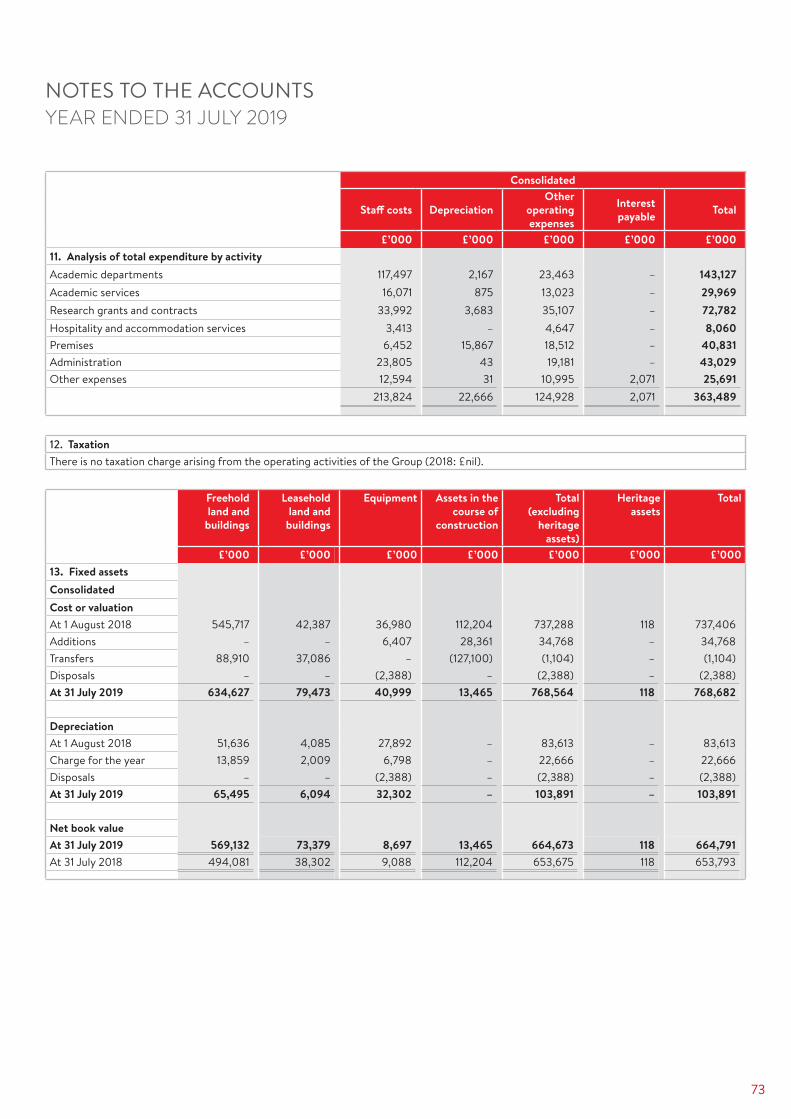
73
NOTES TO THE ACCOUNTSYEAR ENDED 31 JULY 2019
Consolidated
Sta! costs DepreciationOther
operating expenses
Interest payable Total
£’000 £’000 £’000 £’000 £’00011. Analysis of total expenditure by activity Academic departments 117,497 2,167 23,463 – 143,127 Academic services 16,071 875 13,023 – 29,969 Research grants and contracts 33,992 3,683 35,107 – 72,782 Hospitality and accommodation services 3,413 – 4,647 – 8,060 Premises 6,452 15,867 18,512 – 40,831 Administration 23,805 43 19,181 – 43,029 Other expenses 12,594 31 10,995 2,071 25,691
213,824 22,666 124,928 2,071 363,489
12. TaxationThere is no taxation charge arising from the operating activities of the Group (2018: £nil).
Freehold land and
buildings
Leasehold land and
buildings
Equipment Assets in the course of
construction
Total (excluding
heritage assets)
Heritage assets
Total
£’000 £’000 £’000 £’000 £’000 £’000 £’00013. Fixed assetsConsolidatedCost or valuationAt 1 August 2018 545,717 42,387 36,980 112,204 737,288 118 737,406 Additions – – 6,407 28,361 34,768 – 34,768 Transfers 88,910 37,086 – (127,100) (1,104) – (1,104)Disposals – – (2,388) – (2,388) – (2,388)At 31 July 2019 634,627 79,473 40,999 13,465 768,564 118 768,682
DepreciationAt 1 August 2018 51,636 4,085 27,892 – 83,613 – 83,613 Charge for the year 13,859 2,009 6,798 – 22,666 – 22,666 Disposals – – (2,388) – (2,388) – (2,388)At 31 July 2019 65,495 6,094 32,302 – 103,891 – 103,891
Net book value At 31 July 2019 569,132 73,379 8,697 13,465 664,673 118 664,791At 31 July 2018 494,081 38,302 9,088 112,204 653,675 118 653,793

74
INTEGRATED ANNUAL REPORT 2018–19
PROOF
NOTES TO THE ACCOUNTSYEAR ENDED 31 JULY 2019
Freehold land and
buildings
Leasehold land and
buildings
Equipment Assets in the course of
construction
Total (excluding
heritage assets)
Heritage assets
Total
£’000 £’000 £’000 £’000 £’000 £’000 £’00013. Fixed assets (contd.)UniversityCost or valuationAt 1 August 2018 545,717 35,273 36,980 112,204 730,174 118 730,292 Additions – – 6,407 28,361 34,768 – 34,768 Transfers 88,910 37,086 – (127,100) (1,104) – (1,104)Disposals – – (2,388) – (2,388) – (2,388)At 31 July 2019 634,627 72,359 40,999 13,465 761,450 118 761,568
DepreciationAt 1 August 2018 51,636 3,605 27,892 – 83,133 – 83,133 Charge for the year 13,859 1,889 6,798 – 22,546 – 22,546 Disposals – – (2,388) – (2,388) – (2,388)At 31 July 2019 65,495 5,494 32,302 – 103,291 – 103,291
Net book value At 31 July 2019 569,132 66,865 8,697 13,465 658,159 118 658,277At 31 July 2018 494,081 31,668 9,088 112,204 647,041 118 647,159
At 31 July 2019, freehold land and buildings included £93.8m (2018: £90.2m) in respect of freehold land that is not depreciated.Following a review of the University’s fixed asset portfolio, a number of properties/part properties were redesignated as investment properties during the year (note 15).A full valuation of the University’s freehold and long leasehold land and buildings portfolio was carried out on 1 August 2014 by an independent valuer with an appropriate professional qualification and recent experience in the location and class of property. In line with FRS 102, this valuation was used as the deemed cost for these assets at the date of transition i.e. 1 August 2014.
14. Heritage assetsHeritage Assets with an initial cost or value over £25,000 and acquired after 1 August 2007 are capitalised. Since this date the University has acquired heritage assets of £118k relating to pieces of sculpture.
The University holds other heritage assets in its main library and throughout the general campus. The special collections service at Queen’s provides access to the Library’s rare and early printed book, map and manuscript collections, as well as to more modern material relating to Ireland and Ulster in particular. The books, pamphlets, manuscripts, correspondence, photographs and maps are considered to be of lasting research value and include examples of the earliest printed works published between the 16th and early 19th centuries. In order to preserve the material for future readers these collections are housed in a secure and environmentally controlled setting. The University also has an important collection of fine art, silver and sculpture, as well as a build environment which contains some of the best architecture in Ireland. The University has a Curator of Art who manages and develops the collection as well as developing an ambitious programme of educational work.

75
NOTES TO THE ACCOUNTSYEAR ENDED 31 JULY 2019
Subsidiary companies
Other fixed asset
investments
Total
£’000 £’000 £’00016. Non–current investments
Consolidated At 1 August 2018 – 208,690 208,690 Additions – 4,211 4,211 Transfer to investment in associates – (139) (139)Disposals – (3,765) (3,765)Appreciation and gains on disposals – 33,772 33,772 At 31 July 2019 – 242,769 242,769
University At 1 August 2018 2,255 144,955 147,210 Additions – 3,907 3,907 Disposals – (3,765) (3,765)Appreciation and gains on disposals – 5,160 5,160 At 31 July 2019 2,255 150,257 152,512
Consolidated and University2019 2018
£’000 £’00015. Investment propertyBalance at 1 August 3,885 3,700 Transfers from fixed assets (note 13) 1,104 –Net (loss)/gain from fair value adjustments (109) 185 Balance at 31 July 4,880 3,885
A valuation of the investment property was carried out on 1 August 2014 by an independent valuer with an appropriate professional qualification and recent experience in the location and class of property. This valuation is reviewed annually by the University using industry recognised indices and the carrying value of the assets adjusted accordingly for any material changes.
Following a review of the University’s fixed asset portfolio, a number of properties/part properties were redesignated as investment properties during the year.
The University received property rental income of £519k (2018: £321k) in respect of these properties for the year ended 31 July 2019.

76
INTEGRATED ANNUAL REPORT 2018–19
PROOF
NOTES TO THE ACCOUNTSYEAR ENDED 31 JULY 2019
2019 2018Consolidated University Consolidated University
£’000 £’000 £’000 £’00016. Non–current investments (continued)
Other fixed asset investments consist of:
General Investment Fund 90,024 90,024 84,234 84,234
University Investment Fund: UK gilts and fixed asset stocks 5,030 5,030 4,610 4,610 UK equities (listed) 22,999 22,999 24,195 24,195 Overseas investments (listed) 15,776 15,776 14,639 14,639 Other investments 16,428 16,428 17,277 17,277
60,233 60,233 60,721 60,721 Other 5,566 – 4,042 –Listed investments 86,946 – 59,693 –
242,769 150,257 208,690 144,955
General Investment Fund The general investment fund consists of UK equities and investment trusts (listed) valued at market value. The equivalent cost as at 31 July 2019 was £46,748k (2018: £46,748k).
University Investment Fund The University Investment Fund is an investment fund operated on unit trust principles, and administered under the terms of the Queen’s University (Trust Scheme) Order (Northern Ireland) 1982. The purpose of the Investment Fund is to provide an investment vehicle for the greater part of the University endowment funds. The investments are shown at market value.
Listed investments The Group’s listed investments, which are listed on the London Stock Exchange, are stated at market value.
Other investments The Group’s other investments relate to a subsidiary’s investments in 21 other UK unlisted companies.
Fair value gain on investments and investment property The consolidated fair value gain on investments and investment property of £34,991k (2018: £22,821k) as shown in the SOCI, relates to (loss)/appreciation of investment property of (£109k) (2018: £185k), non–current investments of £33,820k (2018: £22,971k) and a fair value gain/(loss) on investments in associates of £1,280k (2018: £(335)k).
The University’s fair value gain on investments and investment property of £5,099k (2018: £8,189k) as shown in the SOCI, relates to (loss)/appreciation of investment property of (£109k) (2018: £185k) and non–current investments of £5,208k (2018: £8,004k).
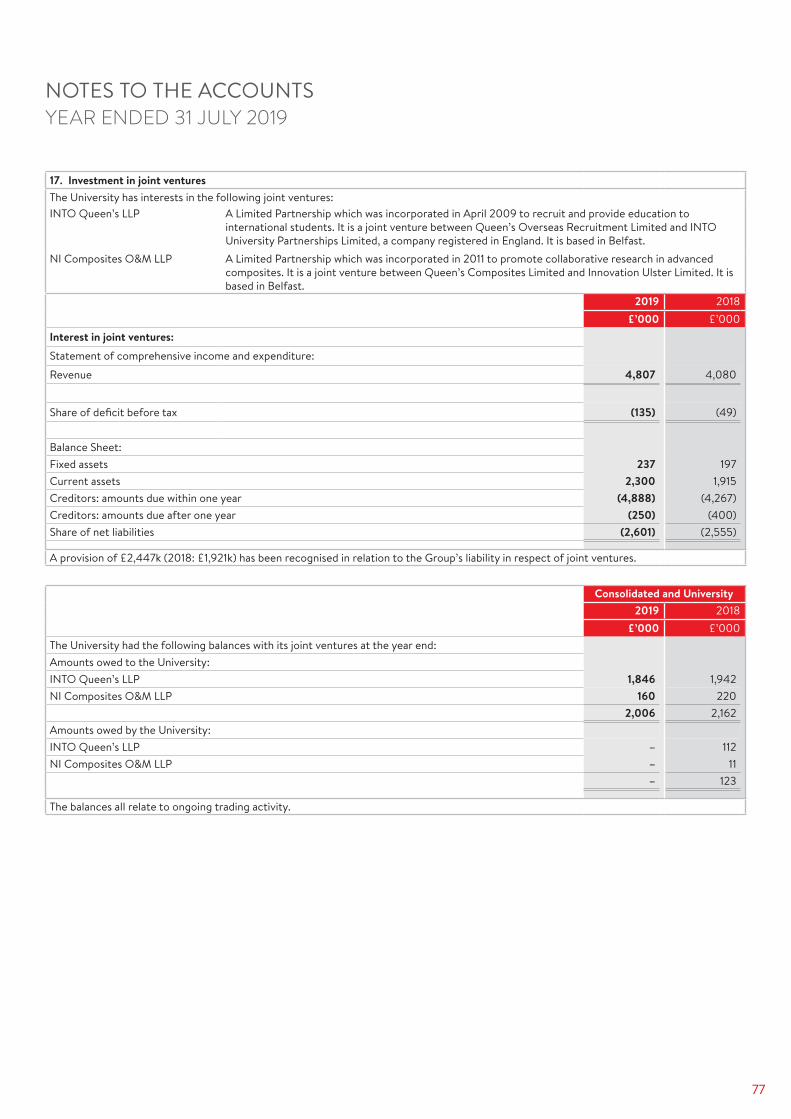
77
NOTES TO THE ACCOUNTSYEAR ENDED 31 JULY 2019
17. Investment in joint venturesThe University has interests in the following joint ventures: INTO Queen’s LLP A Limited Partnership which was incorporated in April 2009 to recruit and provide education to
international students. It is a joint venture between Queen’s Overseas Recruitment Limited and INTO University Partnerships Limited, a company registered in England. It is based in Belfast.
NI Composites O&M LLP A Limited Partnership which was incorporated in 2011 to promote collaborative research in advanced composites. It is a joint venture between Queen’s Composites Limited and Innovation Ulster Limited. It is based in Belfast.
2019 2018£’000 £’000
Interest in joint ventures:
Statement of comprehensive income and expenditure:Revenue 4,807 4,080
Share of deficit before tax (135) (49)
Balance Sheet:Fixed assets 237 197 Current assets 2,300 1,915 Creditors: amounts due within one year (4,888) (4,267)Creditors: amounts due after one year (250) (400)Share of net liabilities (2,601) (2,555)
A provision of £2,447k (2018: £1,921k) has been recognised in relation to the Group’s liability in respect of joint ventures.
Consolidated and University 2019 2018
£’000 £’000The University had the following balances with its joint ventures at the year end:Amounts owed to the University:
INTO Queen’s LLP 1,846 1,942 NI Composites O&M LLP 160 220
2,006 2,162 Amounts owed by the University: INTO Queen’s LLP – 112 NI Composites O&M LLP – 11
– 123
The balances all relate to ongoing trading activity.

78
INTEGRATED ANNUAL REPORT 2018–19
PROOF
NOTES TO THE ACCOUNTSYEAR ENDED 31 JULY 2019
18. Investment in associatesInvestments in associates in the year amounted to £2,252k (2018: £658k). Details of the group’s interests in associated undertakings are set out below. Each company is incorporated in Northern Ireland.
Consolidated% of
equityheld
2019
Valuation Valuation Principle activity2019 2018
£’000 £’000Acksen Limited 25% 22 35 Supply of instruments for monitoring electromagnetic radiationMarenco Limited 28% 13 10 Marine and environmental consultancy servicesBiocolor Limited 20% 125 112 Supply and development of assay kits for tissue laboratoriesExamenlab Limited 22% 278 67 Provision of infertility testing servicesProAxis Limited 24% – – Point care tests for cystic fibrosis and COPDMOF Technologies Limited 21% 219 207 Novel techniques for the synthesis of MOFsXenobics Limited 22% – 43 Development of antibodies and diagnostic solutions for food
safety and authenticityCognition Video Limited 50% – – Automatic intelligent video analyticsPhion Therapeutics Limited 25% – – Anionic drug deliveryGreen Lizard Technologies Limited
24% 198 184 Technological solutions
Analytics Engines Limited 20% 823 139 Bespoke data analysis solutionsPorous Liquids Technologies Limited
21% 14 – Production and development of porous liquids
Sonrai Analytics Limited 22% 560 – Provides discovery and validation of novel disease biomarkersThe directors believe that the carrying value of the investments in associates is supported by their underlying net assets.In addition to these associate interests the Group has shareholdings of less than 20% in 21 unlisted companies all of which are incorporated in the United Kingdom, and which are included at fair value of £5,566k at 31 July 2019 (2018: £4,042k).
20. Current investmentsCurrent investments comprise of deposits held with banks and building societies operating in the UK market, and licensed by the Financial Services Authority. The interest rates for these deposits are fixed for the duration of the deposit at time of placement. These short term deposits do not meet the definition of cash equivalents.
2019 2018Consolidated University Consolidated University
£’000 £’000 £’000 £’00019. Debtors Amounts falling due within one year:Research grant debtors 4,691 4,691 4,703 4,703 Other debtors 10,077 9,790 7,067 6,782 Amounts owed by associates 124 – 20 –Prepayments and accrued income 13,753 13,749 16,660 16,650 Amounts due from subsidiary companies:QUBIS Limited – 120 – 858 Queen's Overseas Recruitment Limited – 439 – 439 Queen's Composites Limited – 4 – 4 NIACE Limited – 151 – 233
28,645 28,944 28,450 29,669
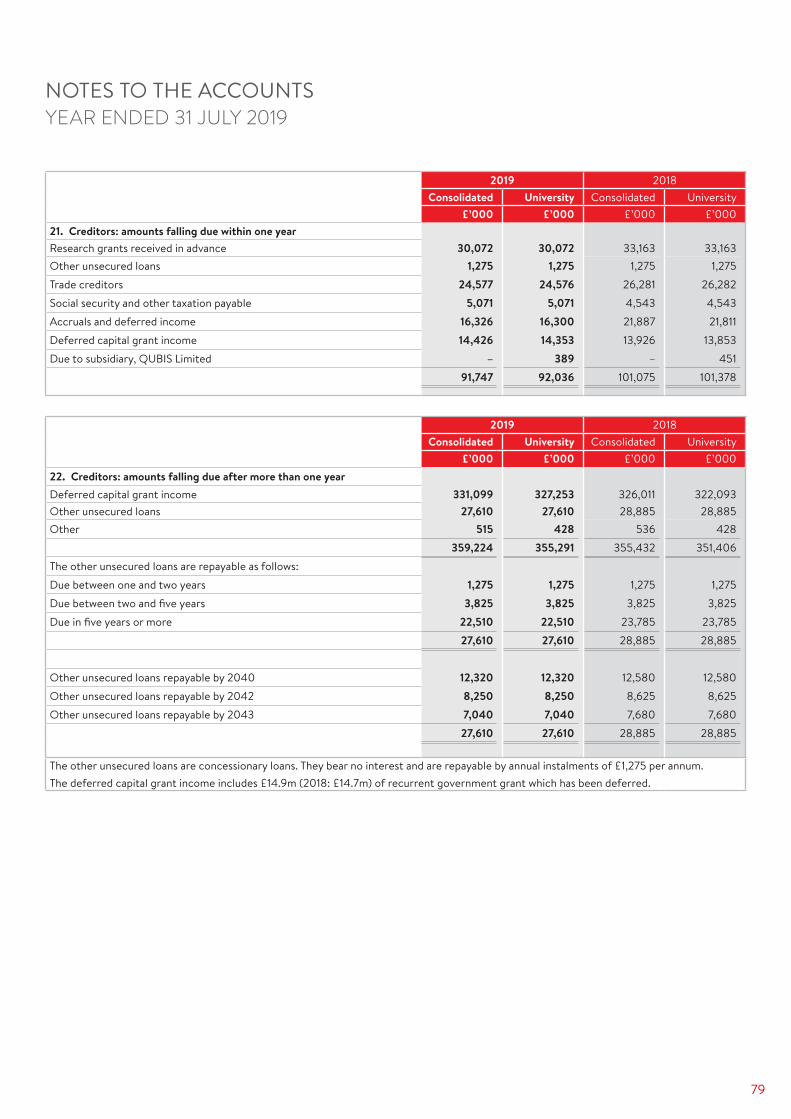
79
NOTES TO THE ACCOUNTSYEAR ENDED 31 JULY 2019
2019 2018Consolidated University Consolidated University
£’000 £’000 £’000 £’00021. Creditors: amounts falling due within one year Research grants received in advance 30,072 30,072 33,163 33,163 Other unsecured loans 1,275 1,275 1,275 1,275 Trade creditors 24,577 24,576 26,281 26,282 Social security and other taxation payable 5,071 5,071 4,543 4,543 Accruals and deferred income 16,326 16,300 21,887 21,811 Deferred capital grant income 14,426 14,353 13,926 13,853 Due to subsidiary, QUBIS Limited – 389 – 451
91,747 92,036 101,075 101,378
2019 2018Consolidated University Consolidated University
£’000 £’000 £’000 £’00022. Creditors: amounts falling due after more than one yearDeferred capital grant income 331,099 327,253 326,011 322,093 Other unsecured loans 27,610 27,610 28,885 28,885 Other 515 428 536 428
359,224 355,291 355,432 351,406 The other unsecured loans are repayable as follows:Due between one and two years 1,275 1,275 1,275 1,275 Due between two and five years 3,825 3,825 3,825 3,825 Due in five years or more 22,510 22,510 23,785 23,785
27,610 27,610 28,885 28,885
Other unsecured loans repayable by 2040 12,320 12,320 12,580 12,580 Other unsecured loans repayable by 2042 8,250 8,250 8,625 8,625 Other unsecured loans repayable by 2043 7,040 7,040 7,680 7,680
27,610 27,610 28,885 28,885
The other unsecured loans are concessionary loans. They bear no interest and are repayable by annual instalments of £1,275 per annum.The deferred capital grant income includes £14.9m (2018: £14.7m) of recurrent government grant which has been deferred.

80
INTEGRATED ANNUAL REPORT 2018–19
PROOF
NOTES TO THE ACCOUNTSYEAR ENDED 31 JULY 2019
Consolidated and UniversityDefinedbenefit
obligationsRBP pension
Otherpension
provision
Total
£’000 £’000 £’00023. Pension obligationsAt 1 August 2018 49,355 61 49,416 Movement 12,894 – 12,894 At 31 July 2019 62,249 61 62,310
Details of the RBP deficit are included at note 34.
Obligation re USS pension
deficit recovery plan
Provision for joint venture
losses
Provision for restructuring
Total other
provisions
£’000 £’000 £’000 £’00024. Other provisionsConsolidatedAt 1 August 2018 35,191 1,921 852 37,964 Utilised in year (1,739) – (23) (1,762)Additions 74,619 526 – 75,145 Unwinding of discount (note 10) 760 – – 760 At 31 July 2019 108,831 2,447 829 112,107
UniversityAt 1 August 2018 35,191 – 852 36,043 Utilised in year (1,739) – (23) (1,762)Additions 74,619 – – 74,619 Unwinding of discount (note 10) 760 – – 760 At 31 July 2019 108,831 – 829 109,660
The restructuring provision relates to a number of ongoing restructuring reviews.The provision for joint venture losses relates to the Group’s share of the net liabilities of its joint ventures as detailed in note 17.USS deficit The obligation to fund the past deficit on the Universities Superannuation Scheme (USS) arises from the contractual obligation with the pension scheme to fund deficit payments in accordance with the deficit recovery plan. Management have made estimates in relation to the number of future employees within the USS scheme and salary payment over the period of the contractual obligation, in assessing the value of this obligation. The adoption of the new deficit recovery plan following the 2017 actuarial valuation has given rise to a significant increase in the deficit provision which has increased from £35.2m to £108.8m. £74.6m of this increase is attributable to the change in the contractual commitment for deficit contributions. Further details relating to the USS pension scheme are laid out in note 34.
2019 2018The major assumptions used to calculate the obligation are: Discount rate 1.58% 2.16%Annual increase in sta! numbers for next five years 2.00% 2.00%Salary growth 3.00% 3.00%As outlined in note 34, there are a number of critical judgements made in estimating the obligation to fund the USS deficit. A review of the sensitivity of the principal assumptions used indicates that the approximate impact of a 0.5% pa decrease in the discount rate would have the e!ect of increasing the provision by £4.7m, a 0.5% increase in salary inflation over the period would increase the provision by £4.6m and a 0.5% increase in sta! over the period would increase the provision by £4.7m.Since the year end, following the completion of the 2018 actuarial valuation, a new deficit recovery plan has been agreed (see note 30). As at 31 July 2019 and with all other assumptions used to calculate the provision unchanged, this would have resulted in a revised provision of £62.9m, a decrease of £45.9m from the current year end provision.

81
NOTES TO THE ACCOUNTSYEAR ENDED 31 JULY 2019
Consolidated and University Restricted permanent
endowments
Unrestricted permanent
endowments
Expendable endowments
Undistributed investment
fund income
2019 Total
2018Total
£’000 £’000 £’000 £’000 £’000 £’00025. Endowment reservesBalances at 1 August 2018Capital 43,369 2,715 16,445 – 62,529 61,239 Accumulated income 2,380 – 1,864 312 4,556 4,187
45,749 2,715 18,309 312 67,085 65,426
New endowments (note 6) 335 – 11 – 346 182 Investment income (note 5) 1,437 66 516 21 2,040 2,035 Expenditure (1,280) (66) (444) – (1,790) (1,910)Transfer to unrestricted reserve – – – – – (83)(Decrease)/increase in market value of investments (414) (20) (147) – (581) 1,435
Total endowment comprehensive income for the year 78 (20) (64) 21 15 1,659
At 31 July 2019 45,827 2,695 18,245 333 67,100 67,085
Represented by:Capital 43,317 2,695 16,222 – 62,234 62,529 Accumulated income 2,510 – 2,023 333 4,866 4,556
45,827 2,695 18,245 333 67,100 67,085
2019 Total
2018Total
£’000 £’000Analysis by type of purpose:Chairs and lectureships 7,945 8,025 Scholarships, studentships, medal and prize funds 16,312 16,223 Research, directorate, school or faculty use 31,937 31,962 Public lectures 2,094 2,099 Travel 271 273 Student amenities and associated objects 2,015 1,996 Student assistance 1,612 1,628 Other restricted funds 1,886 1,853 General funds 2,695 2,714 Total endowments 66,767 66,773 Undistributed investment fund income 333 312
67,100 67,085
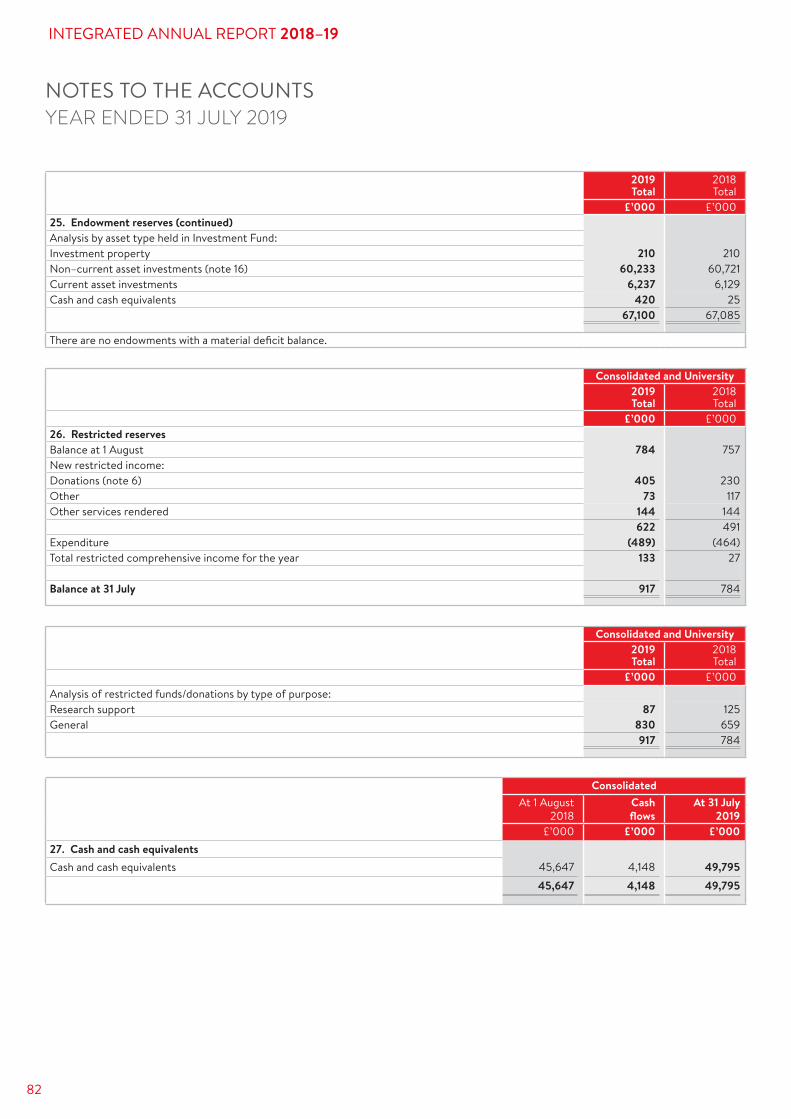
82
INTEGRATED ANNUAL REPORT 2018–19
PROOF
NOTES TO THE ACCOUNTSYEAR ENDED 31 JULY 2019
2019 Total
2018Total
£’000 £’00025. Endowment reserves (continued)Analysis by asset type held in Investment Fund:Investment property 210 210 Non–current asset investments (note 16) 60,233 60,721 Current asset investments 6,237 6,129 Cash and cash equivalents 420 25
67,100 67,085
There are no endowments with a material deficit balance.
Consolidated and University 2019 Total
2018 Total
£’000 £’00026. Restricted reservesBalance at 1 August 784 757New restricted income:Donations (note 6) 405 230 Other 73 117 Other services rendered 144 144
622 491 Expenditure (489) (464)Total restricted comprehensive income for the year 133 27
Balance at 31 July 917 784
Consolidated and University 2019 Total
2018Total
£’000 £’000Analysis of restricted funds/donations by type of purpose:Research support 87 125 General 830 659
917 784
ConsolidatedAt 1 August
2018Cash flows
At 31 July2019
£’000 £’000 £’00027. Cash and cash equivalentsCash and cash equivalents 45,647 4,148 49,795
45,647 4,148 49,795
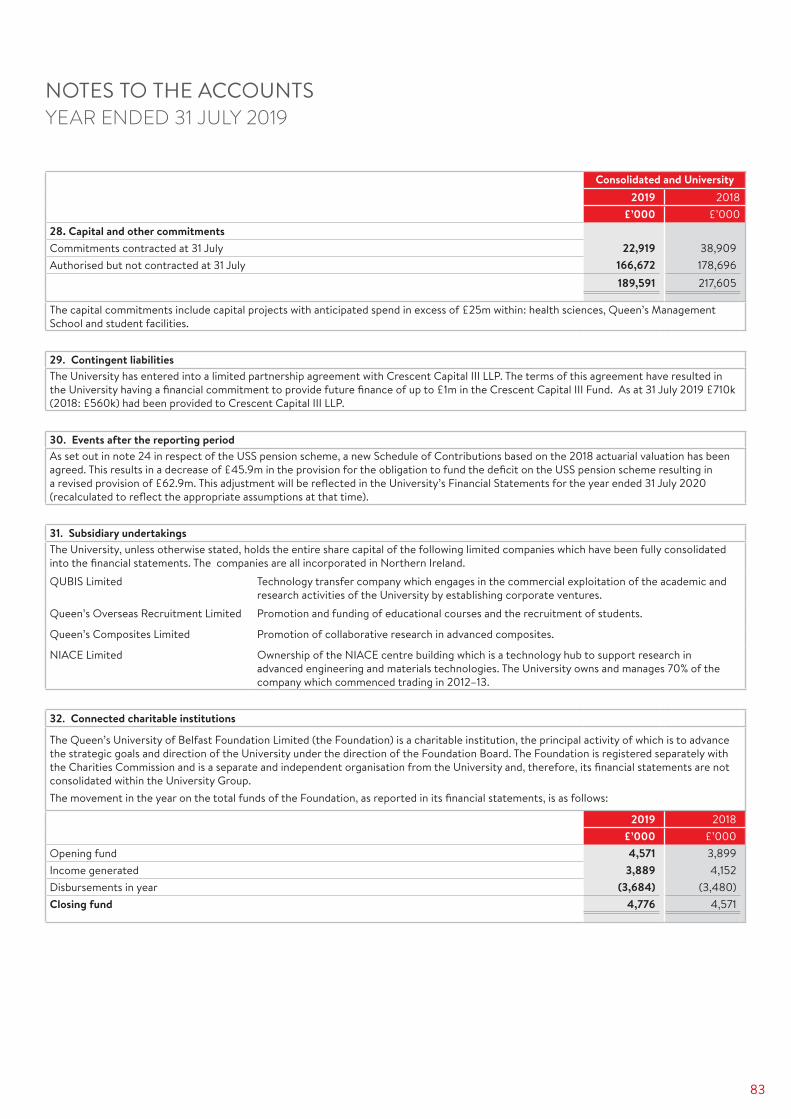
83
NOTES TO THE ACCOUNTSYEAR ENDED 31 JULY 2019
Consolidated and University2019 2018
£’000 £’00028. Capital and other commitmentsCommitments contracted at 31 July 22,919 38,909 Authorised but not contracted at 31 July 166,672
178,696
189,591 217,605
The capital commitments include capital projects with anticipated spend in excess of £25m within: health sciences, Queen’s Management School and student facilities.
32. Connected charitable institutions
The Queen’s University of Belfast Foundation Limited (the Foundation) is a charitable institution, the principal activity of which is to advance the strategic goals and direction of the University under the direction of the Foundation Board. The Foundation is registered separately with the Charities Commission and is a separate and independent organisation from the University and, therefore, its financial statements are not consolidated within the University Group.The movement in the year on the total funds of the Foundation, as reported in its financial statements, is as follows:
2019 2018£’000 £’000
Opening fund 4,571 3,899 Income generated 3,889 4,152 Disbursements in year (3,684) (3,480)Closing fund 4,776 4,571
29. Contingent liabilitiesThe University has entered into a limited partnership agreement with Crescent Capital III LLP. The terms of this agreement have resulted in the University having a financial commitment to provide future finance of up to £1m in the Crescent Capital III Fund. As at 31 July 2019 £710k (2018: £560k) had been provided to Crescent Capital III LLP.
30. Events after the reporting periodAs set out in note 24 in respect of the USS pension scheme, a new Schedule of Contributions based on the 2018 actuarial valuation has been agreed. This results in a decrease of £45.9m in the provision for the obligation to fund the deficit on the USS pension scheme resulting in a revised provision of £62.9m. This adjustment will be reflected in the University’s Financial Statements for the year ended 31 July 2020 (recalculated to reflect the appropriate assumptions at that time).
31. Subsidiary undertakingsThe University, unless otherwise stated, holds the entire share capital of the following limited companies which have been fully consolidated into the financial statements. The companies are all incorporated in Northern Ireland.QUBIS Limited Technology transfer company which engages in the commercial exploitation of the academic and
research activities of the University by establishing corporate ventures.Queen’s Overseas Recruitment Limited Promotion and funding of educational courses and the recruitment of students.
Queen’s Composites Limited Promotion of collaborative research in advanced composites.
NIACE Limited Ownership of the NIACE centre building which is a technology hub to support research in advanced engineering and materials technologies. The University owns and manages 70% of the company which commenced trading in 2012–13.
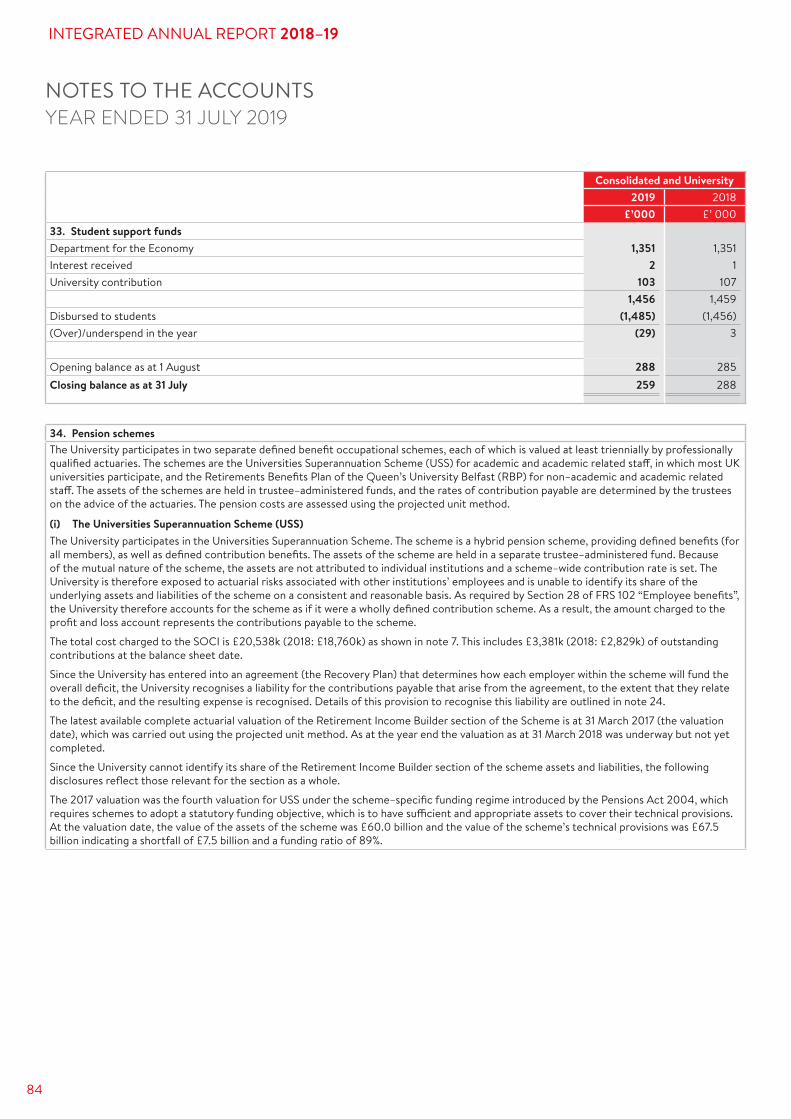
84
INTEGRATED ANNUAL REPORT 2018–19
PROOF
NOTES TO THE ACCOUNTSYEAR ENDED 31 JULY 2019
Consolidated and University 2019 2018
£’000 £’ 00033. Student support fundsDepartment for the Economy 1,351
1,351 Interest received 2 1 University contribution 103 107
1,456 1,459 Disbursed to students (1,485) (1,456)(Over)/underspend in the year (29) 3
Opening balance as at 1 August 288 285Closing balance as at 31 July 259 288
34. Pension schemes The University participates in two separate defined benefit occupational schemes, each of which is valued at least triennially by professionally qualified actuaries. The schemes are the Universities Superannuation Scheme (USS) for academic and academic related sta!, in which most UK universities participate, and the Retirements Benefits Plan of the Queen’s University Belfast (RBP) for non–academic and academic related sta!. The assets of the schemes are held in trustee–administered funds, and the rates of contribution payable are determined by the trustees on the advice of the actuaries. The pension costs are assessed using the projected unit method.
(i) The Universities Superannuation Scheme (USS)The University participates in the Universities Superannuation Scheme. The scheme is a hybrid pension scheme, providing defined benefits (for all members), as well as defined contribution benefits. The assets of the scheme are held in a separate trustee–administered fund. Because of the mutual nature of the scheme, the assets are not attributed to individual institutions and a scheme–wide contribution rate is set. The University is therefore exposed to actuarial risks associated with other institutions’ employees and is unable to identify its share of the underlying assets and liabilities of the scheme on a consistent and reasonable basis. As required by Section 28 of FRS 102 “Employee benefits”, the University therefore accounts for the scheme as if it were a wholly defined contribution scheme. As a result, the amount charged to the profit and loss account represents the contributions payable to the scheme.The total cost charged to the SOCI is £20,538k (2018: £18,760k) as shown in note 7. This includes £3,381k (2018: £2,829k) of outstanding contributions at the balance sheet date. Since the University has entered into an agreement (the Recovery Plan) that determines how each employer within the scheme will fund the overall deficit, the University recognises a liability for the contributions payable that arise from the agreement, to the extent that they relate to the deficit, and the resulting expense is recognised. Details of this provision to recognise this liability are outlined in note 24. The latest available complete actuarial valuation of the Retirement Income Builder section of the Scheme is at 31 March 2017 (the valuation date), which was carried out using the projected unit method. As at the year end the valuation as at 31 March 2018 was underway but not yet completed.Since the University cannot identify its share of the Retirement Income Builder section of the scheme assets and liabilities, the following disclosures reflect those relevant for the section as a whole.The 2017 valuation was the fourth valuation for USS under the scheme–specific funding regime introduced by the Pensions Act 2004, which requires schemes to adopt a statutory funding objective, which is to have su"cient and appropriate assets to cover their technical provisions. At the valuation date, the value of the assets of the scheme was £60.0 billion and the value of the scheme’s technical provisions was £67.5 billion indicating a shortfall of £7.5 billion and a funding ratio of 89%.
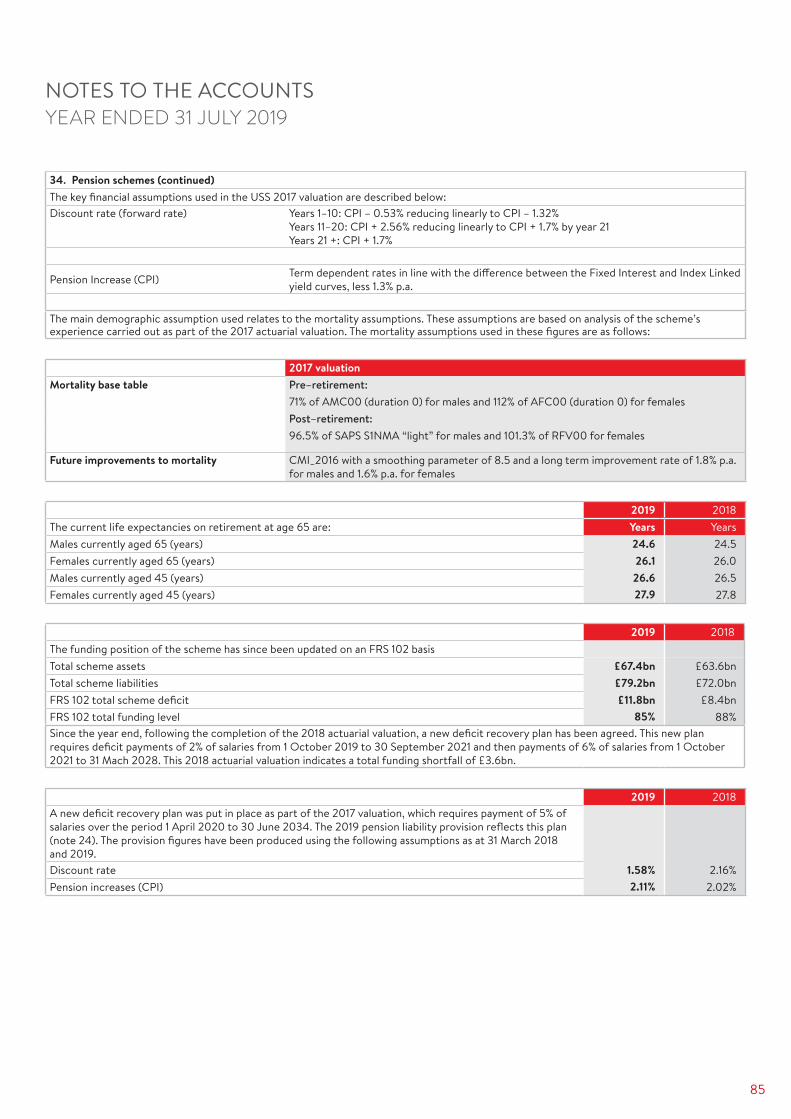
85
NOTES TO THE ACCOUNTSYEAR ENDED 31 JULY 2019
34. Pension schemes (continued)The key financial assumptions used in the USS 2017 valuation are described below:Discount rate (forward rate) Years 1–10: CPI – 0.53% reducing linearly to CPI – 1.32%
Years 11–20: CPI + 2.56% reducing linearly to CPI + 1.7% by year 21 Years 21 +: CPI + 1.7%
Pension Increase (CPI) Term dependent rates in line with the di!erence between the Fixed Interest and Index Linked yield curves, less 1.3% p.a.
The main demographic assumption used relates to the mortality assumptions. These assumptions are based on analysis of the scheme’s experience carried out as part of the 2017 actuarial valuation. The mortality assumptions used in these figures are as follows:
2019 2018The current life expectancies on retirement at age 65 are: Years YearsMales currently aged 65 (years) 24.6 24.5Females currently aged 65 (years) 26.1 26.0Males currently aged 45 (years) 26.6 26.5Females currently aged 45 (years) 27.9 27.8
2019 2018The funding position of the scheme has since been updated on an FRS 102 basisTotal scheme assets £67.4bn £63.6bnTotal scheme liabilities £79.2bn £72.0bnFRS 102 total scheme deficit £11.8bn £8.4bnFRS 102 total funding level 85% 88%Since the year end, following the completion of the 2018 actuarial valuation, a new deficit recovery plan has been agreed. This new plan requires deficit payments of 2% of salaries from 1 October 2019 to 30 September 2021 and then payments of 6% of salaries from 1 October 2021 to 31 Mach 2028. This 2018 actuarial valuation indicates a total funding shortfall of £3.6bn.
2017 valuationMortality base table Pre–retirement:
71% of AMC00 (duration 0) for males and 112% of AFC00 (duration 0) for femalesPost–retirement:96.5% of SAPS S1NMA “light” for males and 101.3% of RFV00 for females
Future improvements to mortality CMI_2016 with a smoothing parameter of 8.5 and a long term improvement rate of 1.8% p.a. for males and 1.6% p.a. for females
2019 2018A new deficit recovery plan was put in place as part of the 2017 valuation, which requires payment of 5% of salaries over the period 1 April 2020 to 30 June 2034. The 2019 pension liability provision reflects this plan (note 24). The provision figures have been produced using the following assumptions as at 31 March 2018 and 2019. Discount rate 1.58% 2.16%Pension increases (CPI) 2.11% 2.02%

86
INTEGRATED ANNUAL REPORT 2018–19
PROOF
NOTES TO THE ACCOUNTSYEAR ENDED 31 JULY 2019
The tables below outline the disclosures for the RBP scheme as recognised in these financial statements: 2019 2018
£’000 £’000Analysis of the amount shown in the Balance Sheets for the RBP scheme:Scheme assets 230,571 204,096 Scheme liabilities (292,820) (253,451)Deficit in the scheme – net pension liability recorded with pension provision (note 23) (62,249) (49,355)
Analysis of the amounts shown in the Statements of Comprehensive Income:Current service cost 8,769 7,235 Total operating charge (note 7) 8,769 7,235
Analysis of the amount charged to interest payable:Interest on liabilities 6,733 7,096 Expected return on assets (5,422) (4,749)Net charge to interest and other finance costs (note 10) 1,311 2,347
Analysis of other comprehensive income:Gain on assets 20,863 10,317 Loss on liabilities (30,115) 38,034 Total adjustment to other comprehensive income before deduction for tax (9,252) 48,351
34. Pension schemes (continued)(ii) Retirement Benefits Plan (RBP) The latest actuarial valuation of the RBP, for which final results were available as at 31 July 2019, was carried out at 31 March 2017 by a qualified independent actuary. The valuation has been projected forward as at 31 July 2019.The major assumptions used by the actuary for the purposes of these accounts are:
2019 2018Future salary increase: Under 40 3.40% 3.25% Over 40 2.65% 2.50%Pension increase 2.40% 2.25%Pension increase rate in deferment 2.40% 2.25%Discount rate 2.10% 2.65%Inflation assumption: Retail prices index 3.20% 3.05% Consumer prices index 2.40% 2.25%
2019 2018The weighted average life expectancies on retirement at age 65 used to determine benefit obligations are: Years YearsMember age 65 (current life expectancy) male 21.0 21.5
female 22.9 23.4Member age 40 (life expectancy at 65) male 22.8 23.3
female 24.9 25.3
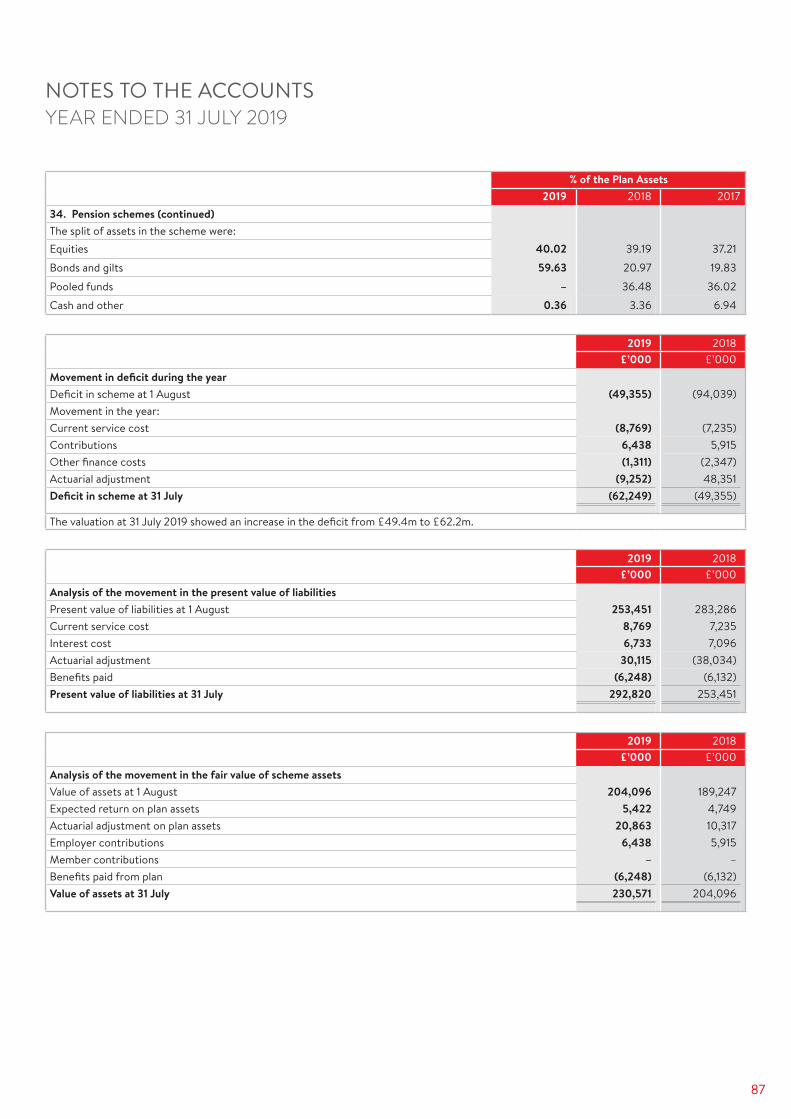
87
% of the Plan Assets2019 2018 2017
34. Pension schemes (continued)The split of assets in the scheme were: Equities 40.02 39.19 37.21Bonds and gilts 59.63 20.97 19.83Pooled funds – 36.48 36.02Cash and other 0.36 3.36 6.94
NOTES TO THE ACCOUNTSYEAR ENDED 31 JULY 2019
2019 2018£’000 £’000
Movement in deficit during the yearDeficit in scheme at 1 August (49,355) (94,039)Movement in the year:Current service cost (8,769) (7,235)Contributions 6,438 5,915 Other finance costs (1,311) (2,347)Actuarial adjustment (9,252) 48,351 Deficit in scheme at 31 July (62,249) (49,355)
The valuation at 31 July 2019 showed an increase in the deficit from £49.4m to £62.2m.
2019 2018£’000 £’000
Analysis of the movement in the present value of liabilitiesPresent value of liabilities at 1 August 253,451 283,286 Current service cost 8,769 7,235 Interest cost 6,733 7,096 Actuarial adjustment 30,115 (38,034)Benefits paid (6,248) (6,132)Present value of liabilities at 31 July 292,820 253,451
2019 2018£’000 £’000
Analysis of the movement in the fair value of scheme assetsValue of assets at 1 August 204,096 189,247 Expected return on plan assets 5,422 4,749 Actuarial adjustment on plan assets 20,863 10,317 Employer contributions 6,438 5,915 Member contributions – –Benefits paid from plan (6,248) (6,132)Value of assets at 31 July 230,571 204,096
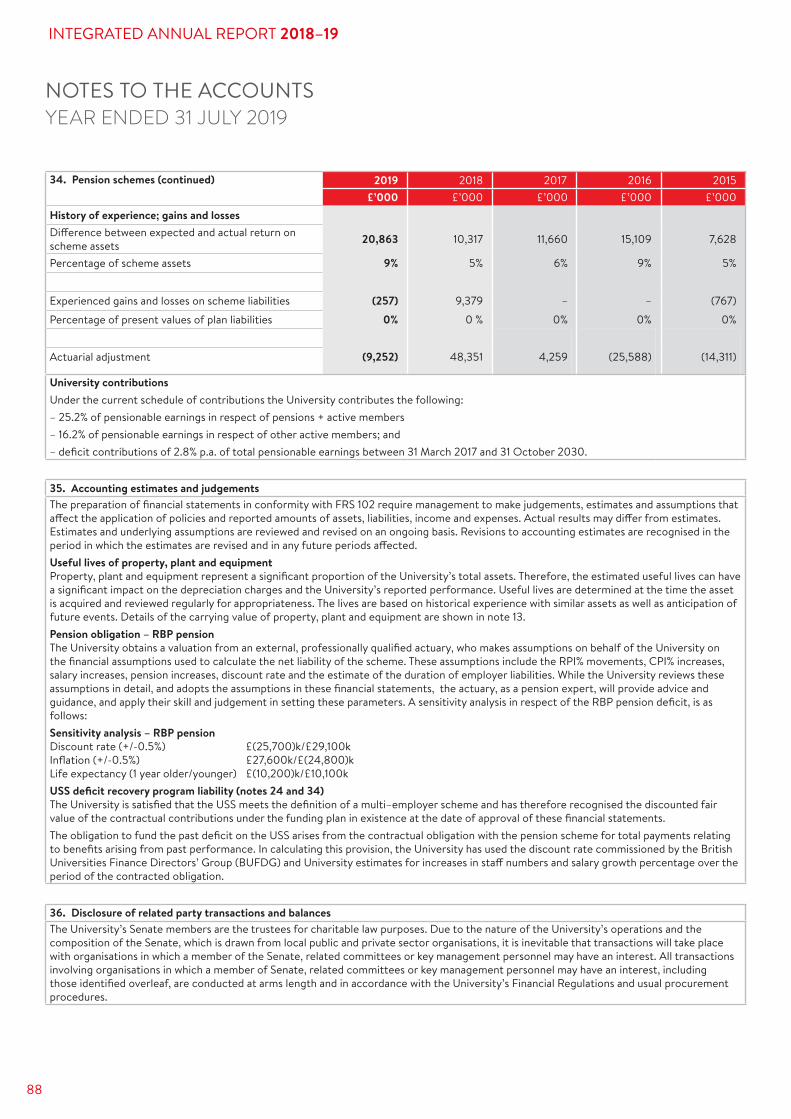
88
INTEGRATED ANNUAL REPORT 2018–19
PROOF
NOTES TO THE ACCOUNTSYEAR ENDED 31 JULY 2019
34. Pension schemes (continued) 2019 2018 2017 2016 2015£’000 £’000 £’000 £’000 £’000
History of experience; gains and lossesDi!erence between expected and actual return on scheme assets 20,863 10,317 11,660 15,109 7,628
Percentage of scheme assets 9% 5% 6% 9% 5%
Experienced gains and losses on scheme liabilities (257) 9,379 – – (767)Percentage of present values of plan liabilities 0% 0 % 0% 0% 0%
Actuarial adjustment (9,252) 48,351 4,259 (25,588) (14,311)
University contributions Under the current schedule of contributions the University contributes the following:– 25.2% of pensionable earnings in respect of pensions + active members– 16.2% of pensionable earnings in respect of other active members; and– deficit contributions of 2.8% p.a. of total pensionable earnings between 31 March 2017 and 31 October 2030.
35. Accounting estimates and judgementsThe preparation of financial statements in conformity with FRS 102 require management to make judgements, estimates and assumptions that a!ect the application of policies and reported amounts of assets, liabilities, income and expenses. Actual results may di!er from estimates. Estimates and underlying assumptions are reviewed and revised on an ongoing basis. Revisions to accounting estimates are recognised in the period in which the estimates are revised and in any future periods a!ected.Useful lives of property, plant and equipment Property, plant and equipment represent a significant proportion of the University’s total assets. Therefore, the estimated useful lives can have a significant impact on the depreciation charges and the University’s reported performance. Useful lives are determined at the time the asset is acquired and reviewed regularly for appropriateness. The lives are based on historical experience with similar assets as well as anticipation of future events. Details of the carrying value of property, plant and equipment are shown in note 13.Pension obligation – RBP pension The University obtains a valuation from an external, professionally qualified actuary, who makes assumptions on behalf of the University on the financial assumptions used to calculate the net liability of the scheme. These assumptions include the RPI% movements, CPI% increases, salary increases, pension increases, discount rate and the estimate of the duration of employer liabilities. While the University reviews these assumptions in detail, and adopts the assumptions in these financial statements, the actuary, as a pension expert, will provide advice and guidance, and apply their skill and judgement in setting these parameters. A sensitivity analysis in respect of the RBP pension deficit, is as follows:Sensitivity analysis – RBP pensionDiscount rate (+/-0.5%) £(25,700)k/£29,100k Inflation (+/-0.5%) £27,600k/£(24,800)kLife expectancy (1 year older/younger) £(10,200)k/£10,100kUSS deficit recovery program liability (notes 24 and 34) The University is satisfied that the USS meets the definition of a multi–employer scheme and has therefore recognised the discounted fair value of the contractual contributions under the funding plan in existence at the date of approval of these financial statements.The obligation to fund the past deficit on the USS arises from the contractual obligation with the pension scheme for total payments relating to benefits arising from past performance. In calculating this provision, the University has used the discount rate commissioned by the British Universities Finance Directors’ Group (BUFDG) and University estimates for increases in sta! numbers and salary growth percentage over the period of the contracted obligation.
36. Disclosure of related party transactions and balancesThe University’s Senate members are the trustees for charitable law purposes. Due to the nature of the University’s operations and the composition of the Senate, which is drawn from local public and private sector organisations, it is inevitable that transactions will take place with organisations in which a member of the Senate, related committees or key management personnel may have an interest. All transactions involving organisations in which a member of Senate, related committees or key management personnel may have an interest, including those identified overleaf, are conducted at arms length and in accordance with the University’s Financial Regulations and usual procurement procedures.
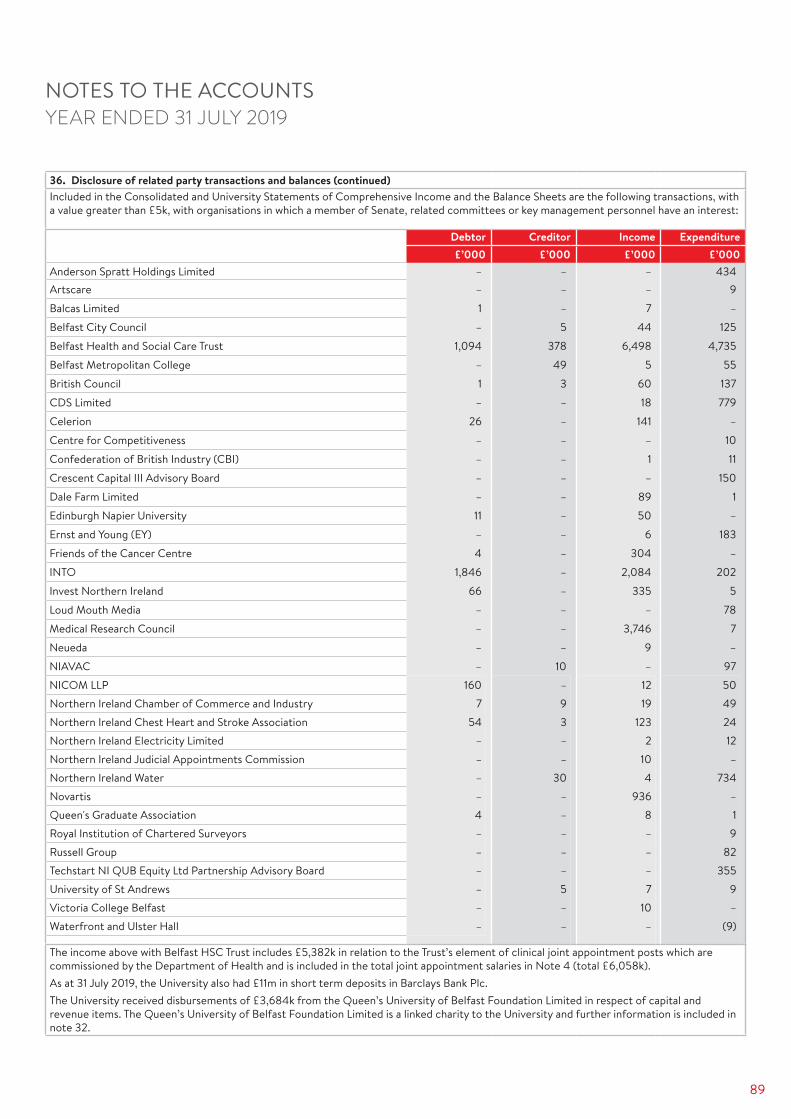
89
NOTES TO THE ACCOUNTSYEAR ENDED 31 JULY 2019
36. Disclosure of related party transactions and balances (continued)Included in the Consolidated and University Statements of Comprehensive Income and the Balance Sheets are the following transactions, with a value greater than £5k, with organisations in which a member of Senate, related committees or key management personnel have an interest:
Debtor Creditor Income Expenditure £’000 £’000 £’000 £’000
Anderson Spratt Holdings Limited – – – 434 Artscare – – – 9 Balcas Limited 1 – 7 – Belfast City Council – 5 44 125 Belfast Health and Social Care Trust 1,094 378 6,498 4,735 Belfast Metropolitan College – 49 5 55 British Council 1 3 60 137 CDS Limited – – 18 779 Celerion 26 – 141 – Centre for Competitiveness – – – 10 Confederation of British Industry (CBI) – – 1 11 Crescent Capital III Advisory Board – – – 150 Dale Farm Limited – – 89 1 Edinburgh Napier University 11 – 50 – Ernst and Young (EY) – – 6 183 Friends of the Cancer Centre 4 – 304 – INTO 1,846 – 2,084 202 Invest Northern Ireland 66 – 335 5 Loud Mouth Media – – – 78 Medical Research Council – – 3,746 7 Neueda – – 9 – NIAVAC – 10 – 97 NICOM LLP 160 – 12 50 Northern Ireland Chamber of Commerce and Industry 7 9 19 49 Northern Ireland Chest Heart and Stroke Association 54 3 123 24 Northern Ireland Electricity Limited – – 2 12 Northern Ireland Judicial Appointments Commission – – 10 – Northern Ireland Water – 30 4 734 Novartis – – 936 – Queen's Graduate Association 4 – 8 1 Royal Institution of Chartered Surveyors – – – 9 Russell Group – – – 82 Techstart NI QUB Equity Ltd Partnership Advisory Board – – – 355 University of St Andrews – 5 7 9 Victoria College Belfast – – 10 – Waterfront and Ulster Hall – – – (9)
The income above with Belfast HSC Trust includes £5,382k in relation to the Trust’s element of clinical joint appointment posts which are commissioned by the Department of Health and is included in the total joint appointment salaries in Note 4 (total £6,058k).As at 31 July 2019, the University also had £11m in short term deposits in Barclays Bank Plc.The University received disbursements of £3,684k from the Queen’s University of Belfast Foundation Limited in respect of capital and revenue items. The Queen’s University of Belfast Foundation Limited is a linked charity to the University and further information is included in note 32.
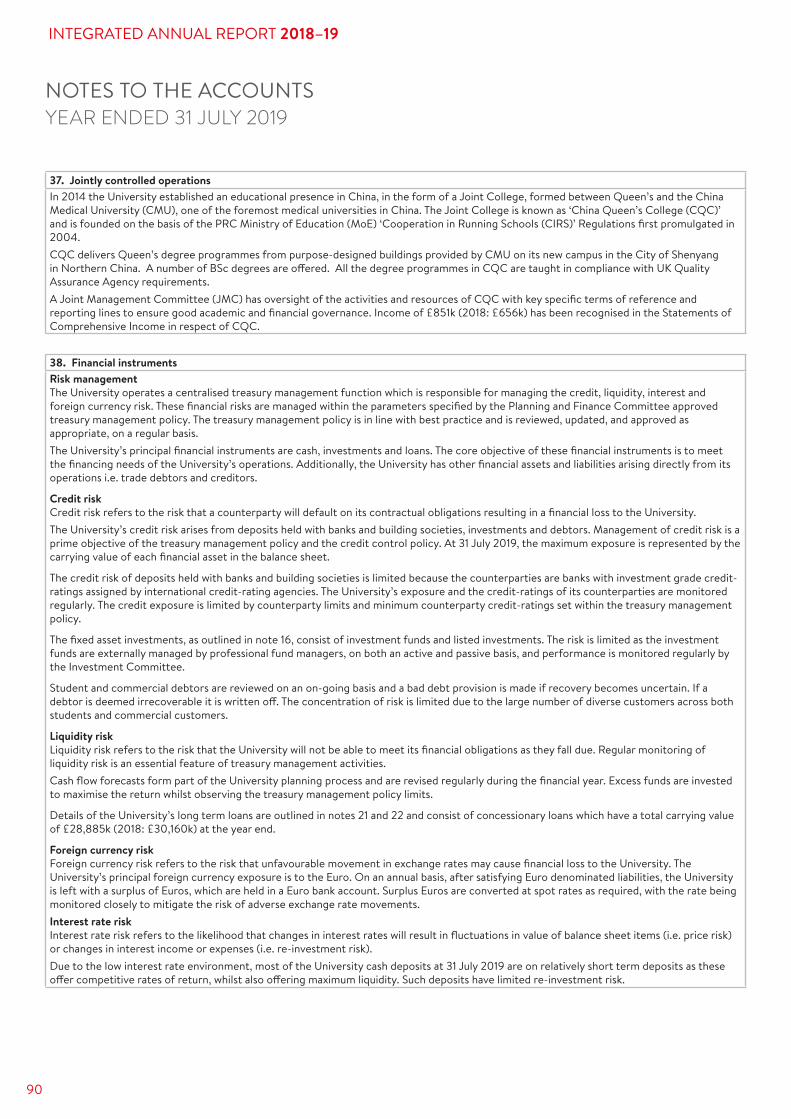
90
INTEGRATED ANNUAL REPORT 2018–19
PROOF
NOTES TO THE ACCOUNTSYEAR ENDED 31 JULY 2019
37. Jointly controlled operationsIn 2014 the University established an educational presence in China, in the form of a Joint College, formed between Queen’s and the China Medical University (CMU), one of the foremost medical universities in China. The Joint College is known as ‘China Queen’s College (CQC)’ and is founded on the basis of the PRC Ministry of Education (MoE) ‘Cooperation in Running Schools (CIRS)’ Regulations first promulgated in 2004.CQC delivers Queen’s degree programmes from purpose-designed buildings provided by CMU on its new campus in the City of Shenyang in Northern China. A number of BSc degrees are o!ered. All the degree programmes in CQC are taught in compliance with UK Quality Assurance Agency requirements.A Joint Management Committee (JMC) has oversight of the activities and resources of CQC with key specific terms of reference and reporting lines to ensure good academic and financial governance. Income of £851k (2018: £656k) has been recognised in the Statements of Comprehensive Income in respect of CQC.
38. Financial instrumentsRisk management The University operates a centralised treasury management function which is responsible for managing the credit, liquidity, interest and foreign currency risk. These financial risks are managed within the parameters specified by the Planning and Finance Committee approved treasury management policy. The treasury management policy is in line with best practice and is reviewed, updated, and approved as appropriate, on a regular basis.The University’s principal financial instruments are cash, investments and loans. The core objective of these financial instruments is to meet the financing needs of the University’s operations. Additionally, the University has other financial assets and liabilities arising directly from its operations i.e. trade debtors and creditors.
Credit risk Credit risk refers to the risk that a counterparty will default on its contractual obligations resulting in a financial loss to the University.The University’s credit risk arises from deposits held with banks and building societies, investments and debtors. Management of credit risk is a prime objective of the treasury management policy and the credit control policy. At 31 July 2019, the maximum exposure is represented by the carrying value of each financial asset in the balance sheet.
The credit risk of deposits held with banks and building societies is limited because the counterparties are banks with investment grade credit-ratings assigned by international credit-rating agencies. The University’s exposure and the credit-ratings of its counterparties are monitored regularly. The credit exposure is limited by counterparty limits and minimum counterparty credit-ratings set within the treasury management policy.
The fixed asset investments, as outlined in note 16, consist of investment funds and listed investments. The risk is limited as the investment funds are externally managed by professional fund managers, on both an active and passive basis, and performance is monitored regularly by the Investment Committee.
Student and commercial debtors are reviewed on an on-going basis and a bad debt provision is made if recovery becomes uncertain. If a debtor is deemed irrecoverable it is written o!. The concentration of risk is limited due to the large number of diverse customers across both students and commercial customers.
Liquidity risk Liquidity risk refers to the risk that the University will not be able to meet its financial obligations as they fall due. Regular monitoring of liquidity risk is an essential feature of treasury management activities.Cash flow forecasts form part of the University planning process and are revised regularly during the financial year. Excess funds are invested to maximise the return whilst observing the treasury management policy limits.
Details of the University’s long term loans are outlined in notes 21 and 22 and consist of concessionary loans which have a total carrying value of £28,885k (2018: £30,160k) at the year end.
Foreign currency risk Foreign currency risk refers to the risk that unfavourable movement in exchange rates may cause financial loss to the University. The University’s principal foreign currency exposure is to the Euro. On an annual basis, after satisfying Euro denominated liabilities, the University is left with a surplus of Euros, which are held in a Euro bank account. Surplus Euros are converted at spot rates as required, with the rate being monitored closely to mitigate the risk of adverse exchange rate movements.Interest rate risk Interest rate risk refers to the likelihood that changes in interest rates will result in fluctuations in value of balance sheet items (i.e. price risk) or changes in interest income or expenses (i.e. re-investment risk).Due to the low interest rate environment, most of the University cash deposits at 31 July 2019 are on relatively short term deposits as these o!er competitive rates of return, whilst also o!ering maximum liquidity. Such deposits have limited re-investment risk.

91
NOTES TO THE ACCOUNTSYEAR ENDED 31 JULY 2019
38. Financial instruments (continued)Market risk Market risk is the risk of changes to the fair value of the Group’s financial instruments. Market risk embodies the potential for both losses and gains and includes currency risk, interest rate risk and other price risk.Decisions in respect of investments are made on the recommendation of the Investment Committee in line with the University’s Treasury Management Policy. The Investment Committee monitors the performance of the University’s investments and meets fund managers on a regular basis with the aim of optimising the future long term return, guided by the University’s Responsible Investment Policy.

PROOFqub.ac.uk