shaun purcell psychiatric & neurodevelopmental genetics unit center for human genetic research...
Post on 19-Dec-2015
220 views
TRANSCRIPT

Shaun Purcell
Psychiatric & Neurodevelopmental Genetics UnitCenter for Human Genetic Research
Massachusetts General Hospital
http://pngu.mgh.harvard.edu/[email protected]
Gene-environment & gene-gene Gene-environment & gene-gene interaction in association studies: interaction in association studies:
a methodologic introductiona methodologic introduction

Finding disease-causing variation
The Human Genome
chromosome 4 DNA sequenceSNP (single nucleotide polymorphism)
…GGCGGTGTTCCGGGCCATCACCATTGCGGGCCGGATCAACTGCCCTGTGTACATCACCAAGGTCATGAGCAAGAGTGCAGCCGACATCATCGCTCTGGCCAGGAAGAAAGGGCCCCTAGTTTTTGGAGAGCCCATTGCCGCCAGCCTGGGGACCGATGGCACCCATTACTGGAGCAAGAACTGGGCCAAGGCTGCGGCGTTCGTGACTTCCCCTCCCCTGAGCCCGGACCCTACCACGCCCGACTA…
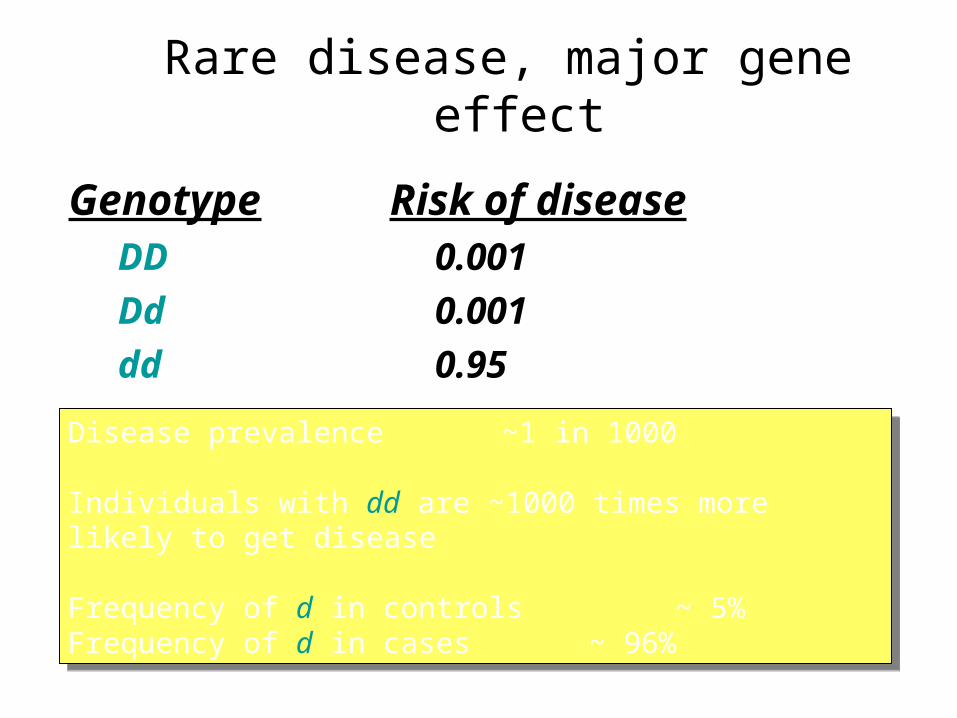
Rare disease, major gene effect
Genotype Risk of diseaseDD 0.001
Dd 0.001
dd 0.95
Disease prevalence ~1 in 1000
Individuals with dd are ~1000 times more likely to get disease
Frequency of d in controls ~ 5%Frequency of d in cases ~ 96%
Disease prevalence ~1 in 1000
Individuals with dd are ~1000 times more likely to get disease
Frequency of d in controls ~ 5%Frequency of d in cases ~ 96%
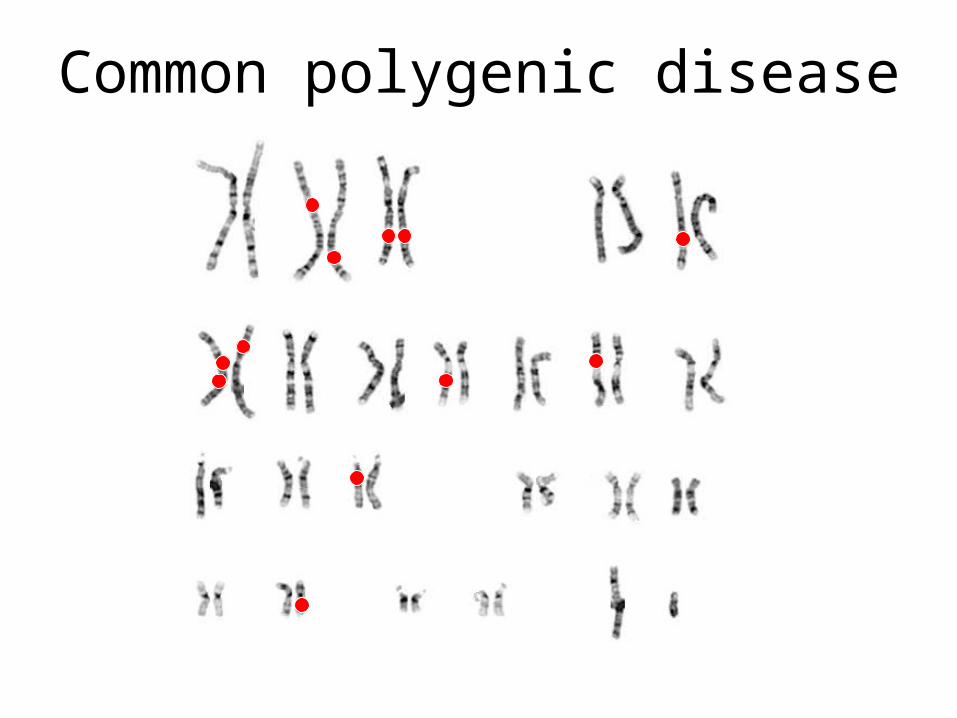
Common polygenic disease

Genotype Risk of diseaseDD 0.01
Dd 0.012
dd 0.0144
Common disease, polygenic effects
Disease prevalence ~1 in 100
Each extra d allele increases risk by ~1.2 times
Frequency of d in controls ~ 5%Frequency of d in cases ~ 6%
Disease prevalence ~1 in 100
Each extra d allele increases risk by ~1.2 times
Frequency of d in controls ~ 5%Frequency of d in cases ~ 6%
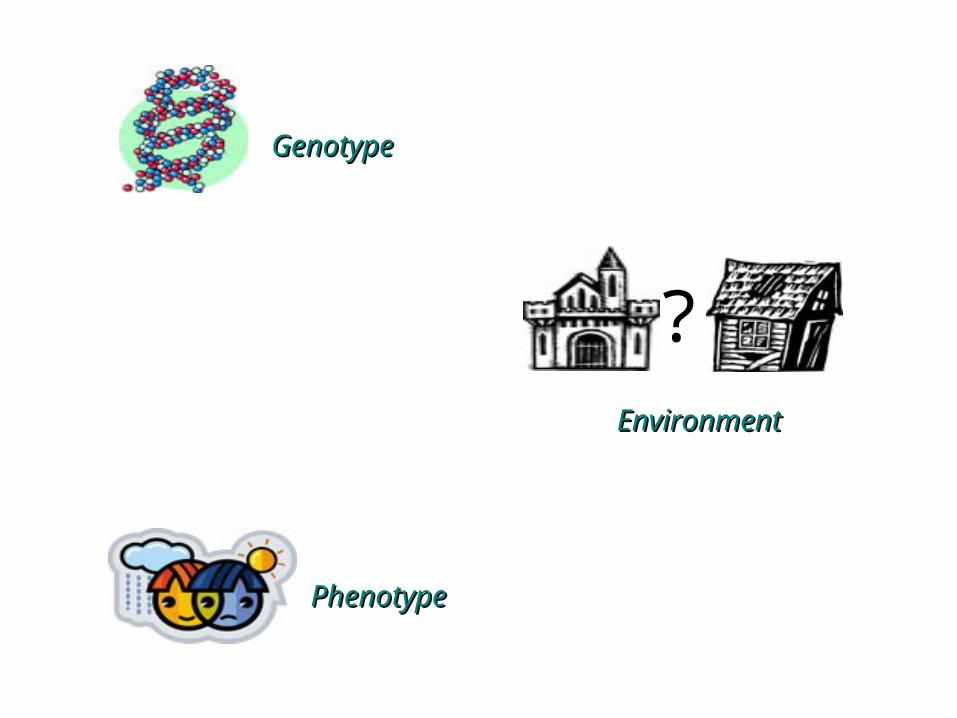
?
GenotypeGenotype
EnvironmentEnvironment
PhenotypePhenotype

?
Gene-environment correlation
Gen
e ef
fect
Environmental effect
The environment modifies the effect of a gene
A gene modifies the effect of an environment
G x E interactionG x E interaction
Gene-environment interaction

Linkage disequilibrium (LD)
Epistasis
Gene effect
Gen
e ef
fect
Epistasis: one gene modifies the effect of another
Gene Gene ×× gene interaction gene interaction

Classical definition of epistasis
The aa genotype masks the effect of the bb genotype
AA
Aa
aa
BB Bb bb

Separate analysis
• locus A shows an association with the trait
• locus B appears unrelated
AA Aa aa BB Bb bb
Marker A Marker B
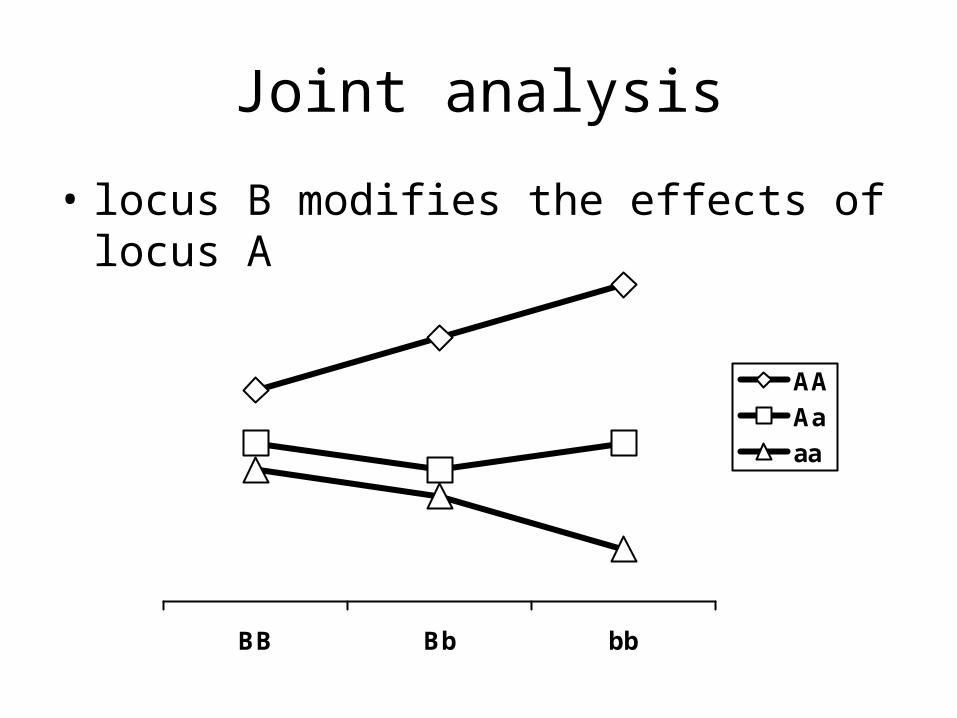
Joint analysis
• locus B modifies the effects of locus A
BB Bb bb
AA
Aa
aa

Two locus genotypes Locus A
Locus B AA Aa aa
BB AABB AaBB aaBB
Bb AABb AaBb aaBb
bb Aabb Aabb aabb
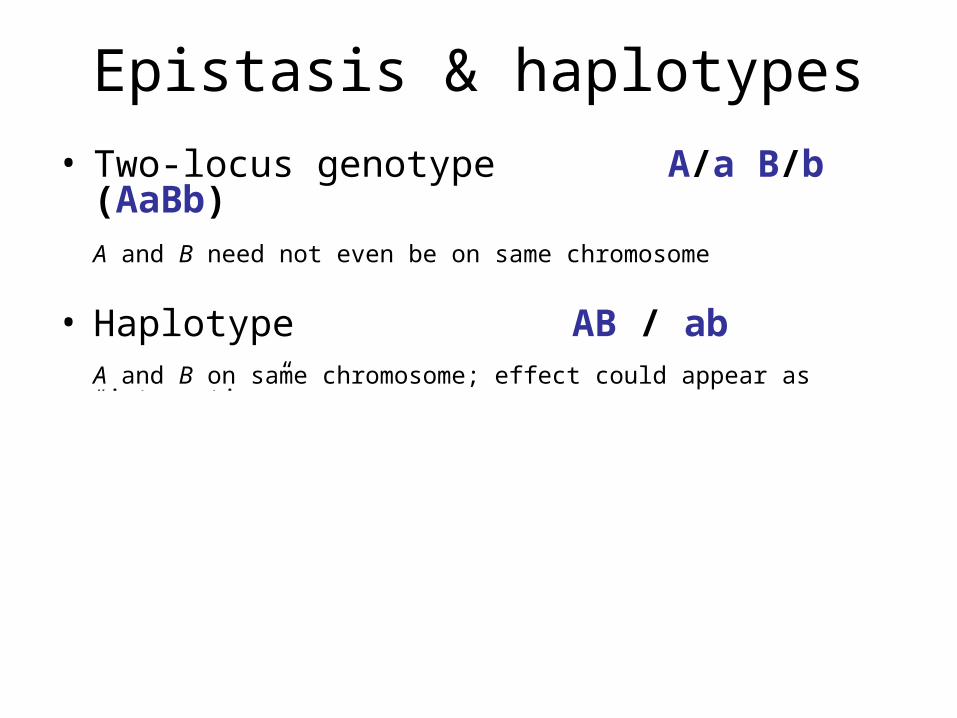
Epistasis & haplotypes
• Two-locus genotype A/a B/b (AaBb)A and B need not even be on same chromosome
• Haplotype AB / abA and B on same chromosome; effect could appear as “interaction”
• cis versus trans effectsAB haplotype causes disease A and B interact to cause disease
A
a
B
b
A
a
b
B
A
a
B
b
A
a
b
B
disease
no disease
disease
disease

Two locus genotypes Locus A
Locus B AA Aa aa
BB fAABB fAaBB faaBB
fBB
Bb fAABb fAaBb faaBb
fBb
bb fAabb fAabb faabb
fbb
fAA fAa faa f
“Penetrance” = probability of developing disease given genotype

Genotype Risk of diseaseDD 0.01
Dd 0.012
dd 0.0144
Common disease, polygenic effects
Disease prevalence ~1 in 100
Each extra d allele increases risk by ~1.2 times
Frequency of d in controls ~ 5%Frequency of d in cases ~ 6%
Disease prevalence ~1 in 100
Each extra d allele increases risk by ~1.2 times
Frequency of d in controls ~ 5%Frequency of d in cases ~ 6%

Small single SNP effectsmight represent larger epistatic effects
AA
Aa
aa
BB Bb bb
0.01
0.01
0.01
0.01
0.01
0.01
0.01
0.01
0.20
Risk of developing disease
0.01 0.01 0.012
Frequency a = b = 0.1

Interaction may be a common feature of genetic variation
• Brem et al (2005) Nature– gene expression phenotypes in yeast
– two-stage approach to find pairs of loci
• 65% of these pairs showed significant interaction
• many secondary loci would be missed by standard approaches though
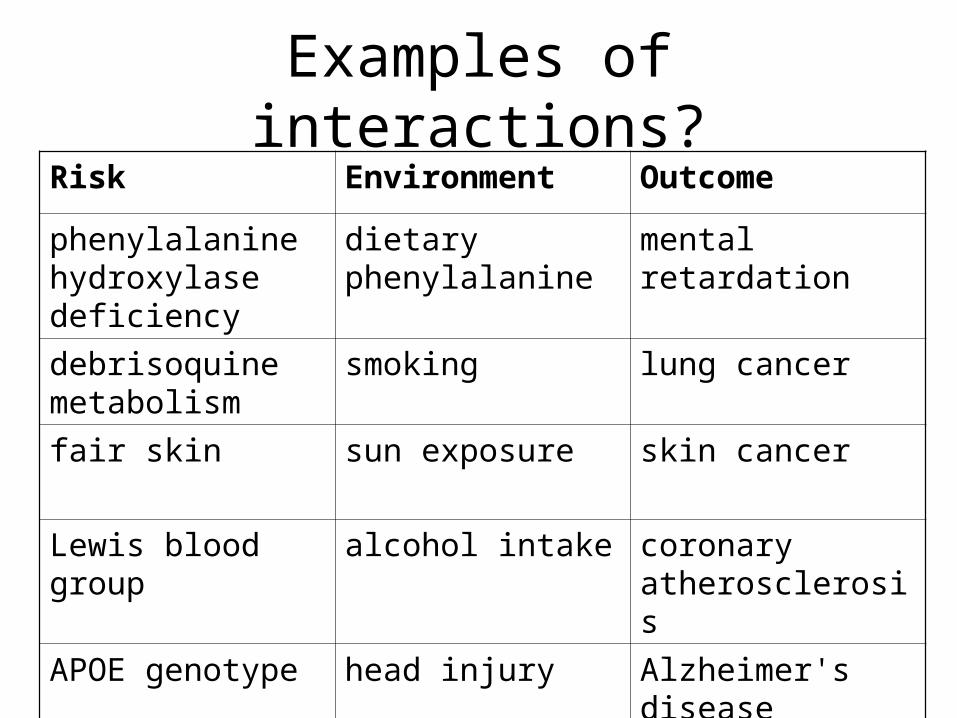
Examples of interactions?Risk Environment Outcome
phenylalanine hydroxylase deficiency
dietary phenylalanine
mental retardation
debrisoquine metabolism
smoking lung cancer
fair skin sun exposure skin cancer
Lewis blood group alcohol intake coronary atherosclerosis
APOE genotype head injury Alzheimer's disease

The rest of this talk…
• Statistical issues
• Study designs
• Examples

AA AC
AA CC AA
AA
AC
AA
AA AC CCAA
AA AA AA AC AA AC CC CC
Family-based transmission disequilibrium test (TDT)
Population-based case/control

Odds ratio: measure of association
A aCase a bControl c d
Odds of A in cases = a/bOdds of A in controls = c/d
Odds ratio = (a/b)/(c/d) = ad / bc

E- E+
A a A a
Case 80 20 60 40
Control 80 20 80 20
Odds ratio 1.00 0.375(80*20)/(80*20) (60*20)/(80*40)
Z = ( ln(ORE-) – ln(ORE+) ) / sqrt( VE- + VE+)
V( ln(OR) ) = 1/a + 1/b + 1/c + 1/d

Regression modeling of interaction
Y = bXX + e
Y = bXX + bZZ + bIXZ + e
Y = ( bX + bIZ )X + bZZ + e
interaction component
effect of X on Y is modified by Z

Y = b0 + b1G + b2E +b3G×E
Y
0 1 2
• Linear for continuous outcomes
• Logistic regression for yes/no outcomes
G = 0, 1, 2 copies of allele “A”
E = yes/no exposure (0/1)
continuous measure
E-
E+
Gene dosage

The “Interactome”

Definitions of epistasisBiological Statistical
Individual-levelphenomenon
Population-level phenomenon
BB Bb bb
AA
Aa
aa

BB Bb bb
AA
Aa
aa
Requires:1) Variation between individuals2) Effect on disease
BB Bb bb
AA
Aa
aa
Requires:1) Correct statistical definition of effect

What do interactions mean?
• TEST MAIN EFFECT – Null hypothesis straightforward
• TEST INTERACTION– Null hypothesis is a mathematical model describing
joint effects
A- A+
B- 1 a
B+ b ?

A- A+ RR(A)
B- 1 a a/1 = a
B+ b ab ab/b = a
Additive risk differencesAdditive risk differences
A- A+ RD(A)
B- 1 a a-1 = a-1
B+ b a+b-1 a+b-1-b = a-1
Multiplicative risk ratiosMultiplicative risk ratios

“…we defined interaction as departure from a multiplicative model…”
• Multiplicative model (a×b)– common, easy to implement, logistic
regression• additive on log-odds scale• multiplicative on risk scale
• Other common models (on risk)– additive (a + b)– heterogeneity model (a + b – ab )

A- A+
B-
B+
10
20
20
30
LENGTH = A + B

A- A+
B-
B+
100
400
400
900
AREA = A + B + A×B

Original Log-transform
0.1
.2.3
De
nsity
-5 0 5p0
0.5
11.
5D
ens
ity
-2 -1 0 1 2p1
0.0
2.0
4.0
6.0
8D
ens
ity
-100 -50 0 50 100 150p2
0.5
11.
52
De
nsity
0 1 2 3 4 5p3
0.1
.2.3
De
nsity
0 2 4 6 8p4
Cubic-transform Censored 7-point scale
G1
G2
G1G2
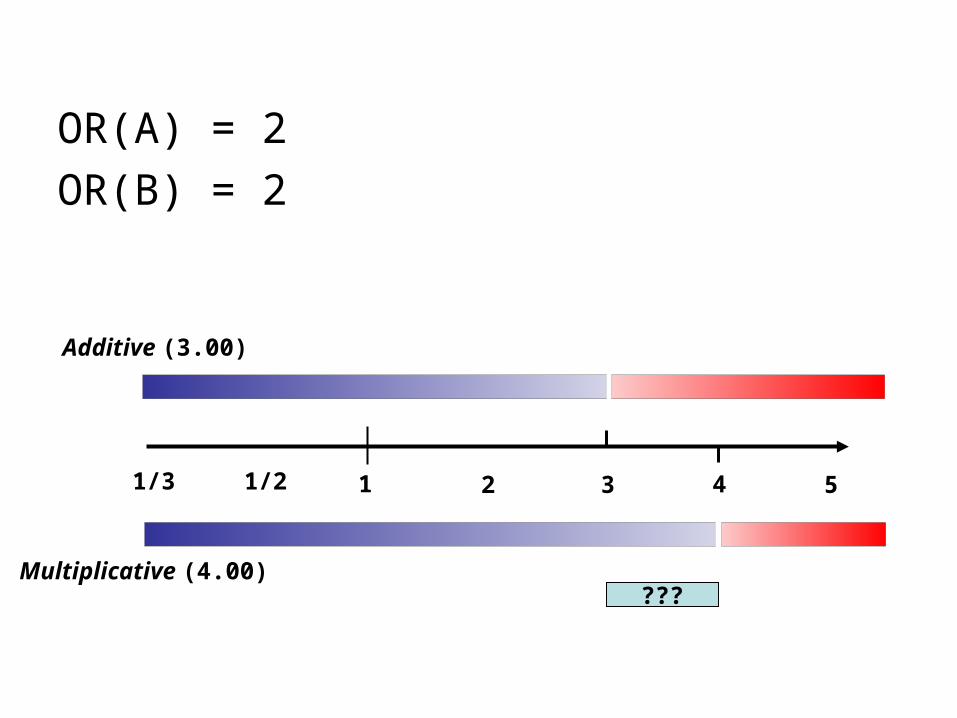
OR(A) = 2
OR(B) = 2
1 2 3 4 51/21/3
Additive (3.00)
Multiplicative (4.00)???
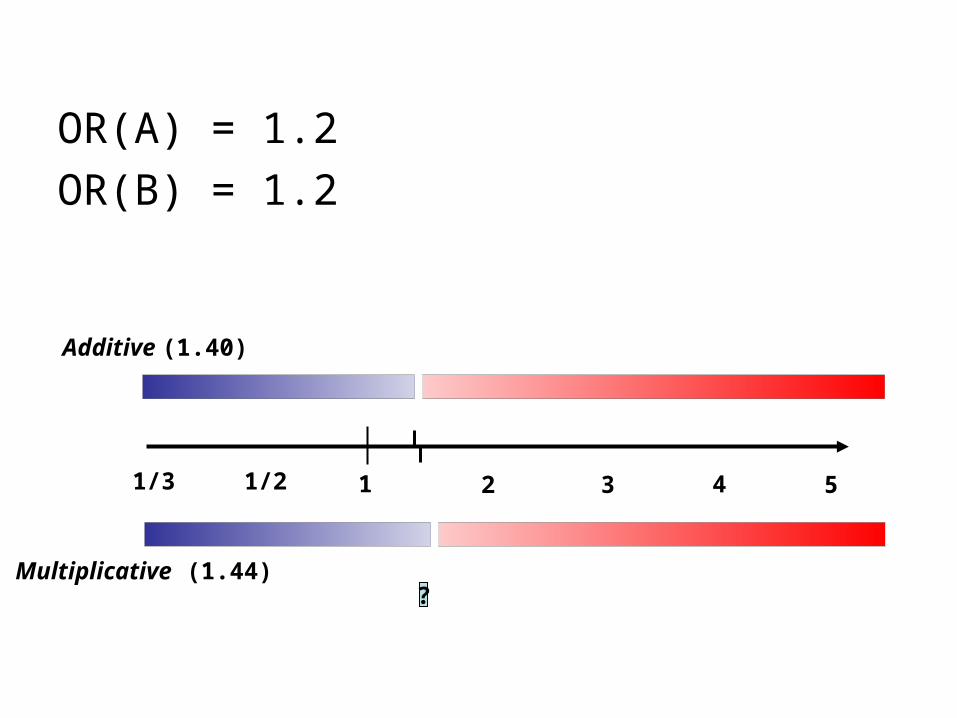
OR(A) = 1.2
OR(B) = 1.2
1 2 3 4 51/21/3
Additive (1.40)
Multiplicative (1.44)?

AA AA
AA AC
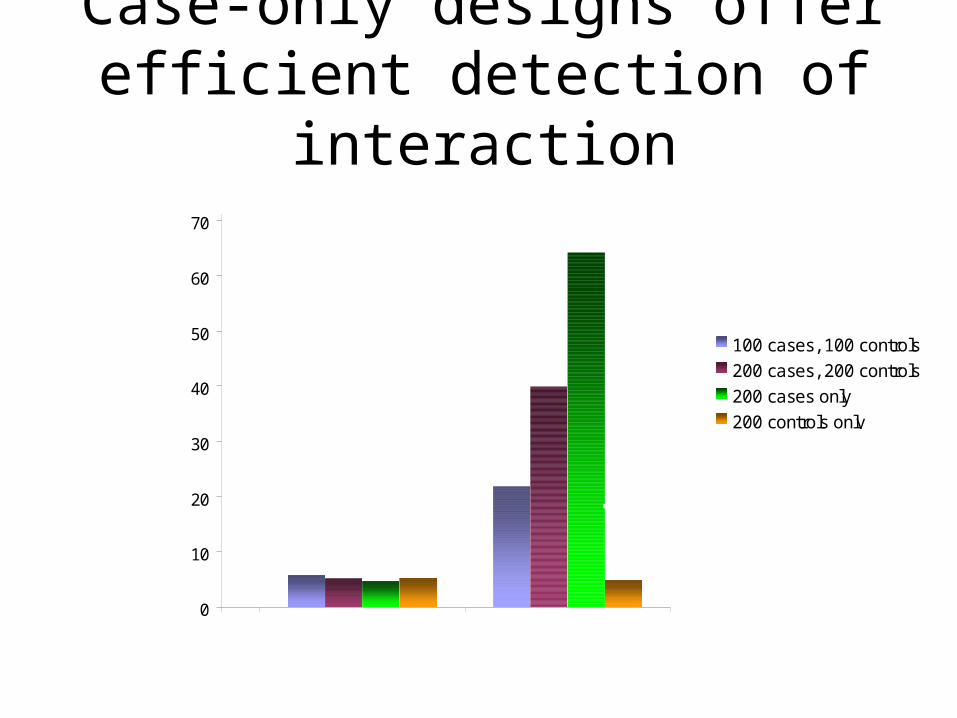
No controls(Case-only design)
Population-based controls
Family-based controls
More robust, fewer assumptions
More efficient, powerful
v.s.

Case-only design• Detect interaction only, no main effects
Risk factors Prevalence
G- E- p0
G+ E- pG
G- E+ pE
G+ E+ pGE = p0 ∙ pG /p0 ∙ pE /p0

Case-only design• Detect interaction only, no main effects
Risk factors Prevalence
G- E- p0
G+ E- pG
G- E+ pE
G+ E+ pGE = p0 ∙ pG /p0 ∙ pE /p0
Leads to ORINT = ORGE / (ORG ∙ ORE)
It turns out, ORINT = ORCase / ORControl
where ORCase is the association of G and E in cases
and ORControl is the association of G and E in controls
0
10
20
30
40
50
60
70
80
90
100
100 cases, 100 controls
200 cases, 200 controls
200 cases only
200 controls only
No interaction Interaction0
10
20
30
40
50
60
70
80
90
100
100 cases, 100 controls
200 cases, 200 controls
200 cases only
200 controls only
0
10
20
30
40
50
60
70
80
90
100
% r
epli
cate
s si
gnif
ican
t at p
=0.
05
Case-only designs offer efficient detection of interaction

Case-only design isn’t always valid
• Chromosomal proximity
• Multiple ethnicities in case sample
Gene A Gene B
Gene A Gene B
stratification

Epistasis:
LD in cases ≠ LD in controls

Cases(Scz)
Controls
Genes in 5q GABA cluster
Pamela SklarTracey PetryshenC&M Pato
Pamela SklarTracey PetryshenC&M Pato

TDT requires independence assumption
aa Aa
aa
aa Aa
Aa
AA Aa
Aa
AA Aa
AA
Stratify for bb probands Stratify for BB probands
→100% →0% → 0% →100%
If variants A and B are in LD (common haplotypes AB / ab)
→ false positive interactions (due to linkage or population stratification)

An “all pairs of SNPs” approach to epistasis does not scale well
# SNPs # pairs
5 10
10 45
50 1,225
100 4,950
500 124,750
500000 124,999,750,000

0
0.1
0.2
0.3
0.4
0.5
0.6
0.7
0.8
0.9
1
0 5 10 15 20 25 30 35 40 45 50
Multiple testing increases false positives
Number of independent tests performed
P(a
t lea
st 1
fals
e po
siti
ve) per test false positive
rate 0.05
per test false positive rate0.001 = 0.05/50

Tests for interaction have low power
0
0.1
0.2
0.3
0.4
0.5
0.6
0.7
0.8
0.9
1
Increasing sample N
Stat
isti
cal p
ower
Epistasis test
Standard association test

• DTNBP1 & 7 other genes encode proteins that make up the BLOC1 protein complex– biogenesis of lysosome-related organelles complex 1
• DTNBP1’s effect on Scz mediated via BLOC1?– if so, an analysis including all 8 genes
might help to resolve inconsistent studies
Dysbindin-1 (DTNBP1) & schizophrenia
Derek MorrisAiden CorvinMichael Gill
Derek MorrisAiden CorvinMichael Gill

DTNBP1 association studies
rs10
47
63
1
P1
32
8
P1
33
3
rs734129 P
12
87
rs38
29
89
3
P1
65
5
P1
63
5
rs26
19
54
2
P1
32
5
rs26
19
55
0
P1
76
5
P1
75
7
P1
32
0
P1
76
3
P1
57
8
P1
79
2
P1
79
5
P1
58
3
rs27
43
85
2
rs26
19
53
8
A A T
G G C
C C C
G C A A T C C
A C A T T
T G T C A
C A
C A T
C A T C T C
G G
G G
1 2 3 4 5 6 7 8 9 10
Exons
Straub et al. (2002)
SNPs
Schwab et al. (2003)
Van den Oord et al. (2003)
Van den Bogaert et al. (2003)
Tang et al. (2003)
Kirov et al. (2004)
Williams et al. (2004)
Funke et al. (2004)
Numakawa et al. (2004)
Li et al. (2005)

Types of interaction
G+
G-
G+
G-
G+
G-
Direction of effect Presence of effect Magnitude of effect

Duplicate gene action
Example: Kernel Color in Wheat
Only 1 dominant allele required, either A or B
A_B_ NormalA_bb NormalaaB_ Normalaabb No product
AA Aa aa
BB
Bb
bb

Complementary gene action
Example: Flower color in sweet pea
One recessive genotype at either gene would increase disease risk
i.e. genes A and B required
A_B_ NormalA_bb No productaaB_ No productaabb No product
AA Aa aa
BB
Bb
bb

AA Aa aa
BB
Bb
bb
Complementarygene action
Duplicategene action
Heterogeneity
model“Checkerboard”
model
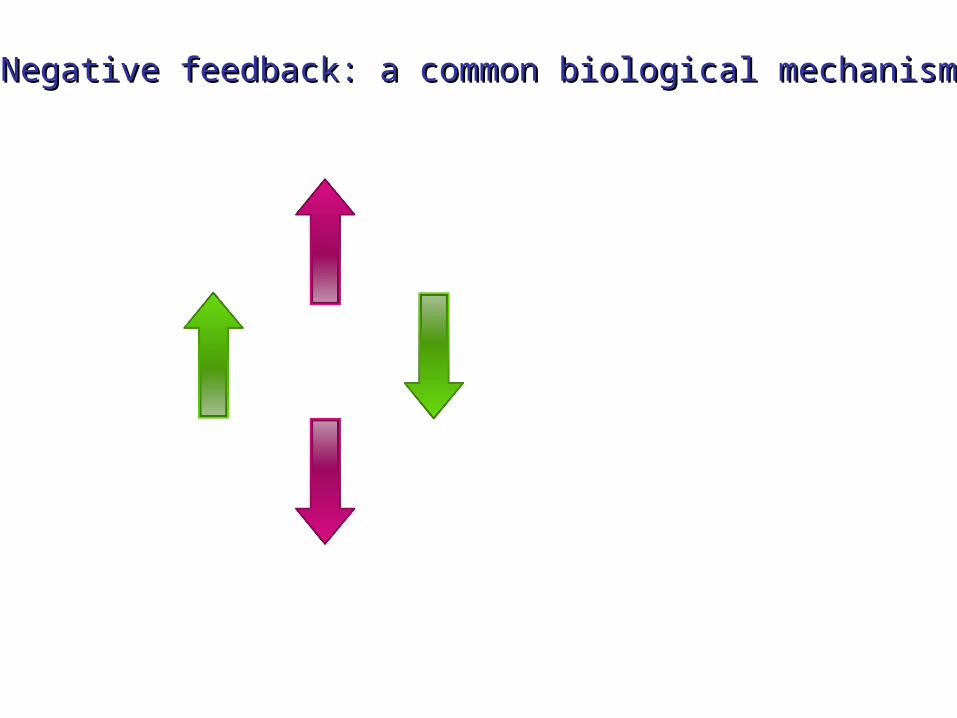
Negative feedback: a common biological mechanismNegative feedback: a common biological mechanism

-/- +/- +/+
-/-
+/-
+/+
Negative feedback: simple model of dysregulationNegative feedback: simple model of dysregulation

-/- +/- +/+
-/-
+/-
+/+0.1 0.2 0.3 0.4 0.5 0.6 0.7 0.8 0.9
0.2
0.4
0.6
0.8
1
1.2
1.4
1.6
1.8
2
2.2
2.4
2.6
Frequency of one locus(other locus fixed p=0.4)
Single markerrelative risk
Negative feedback: single marker analysis leads toNegative feedback: single marker analysis leads tothe “opposite allele” problemthe “opposite allele” problem

0
0.5
1
1.5
2
2.5
Standard single SNP analyses
DTNBP1 MUTED PLDN SNAPAP CNO BLOC1S1 BLOC1S2 BLOC1S3
-log
10(p
-val
ue)
p=0.05
Dysbindin-1 by itself shows no evidence of association with Scz
373 Irish schizophrenics
812 controls

ABCDEFGHIJ
12345678
A 1A 2A 3A 4A 5A 6A 7A 8B 1B 2B 3B 4B 5B 6B 7B 8
…….J 6J 7J 8
A single gene-based test
80 allele-based tests

0
0.5
1
1.5
2
2.5
MUTED genotype
DTNBP1 DTNBP1 DTNBP1
Odd
s ra
tio
An independent replication? DTNBP1 MUTED epistasis (Straub et al. WCPG meeting Oct 2005.)
An independent replication? DTNBP1 MUTED epistasis (Straub et al. WCPG meeting Oct 2005.)
DTNBP1
MUTED
BLOC1S2
CNO
PLDN
SNAPAPBLOC1S1
BLOC1S3
Known protein interactions in BLOC-1 complex
Gene-based p = 0.0009Correcting for multiple tests, p = 0.025
Gene-based p = 0.0009Correcting for multiple tests, p = 0.025
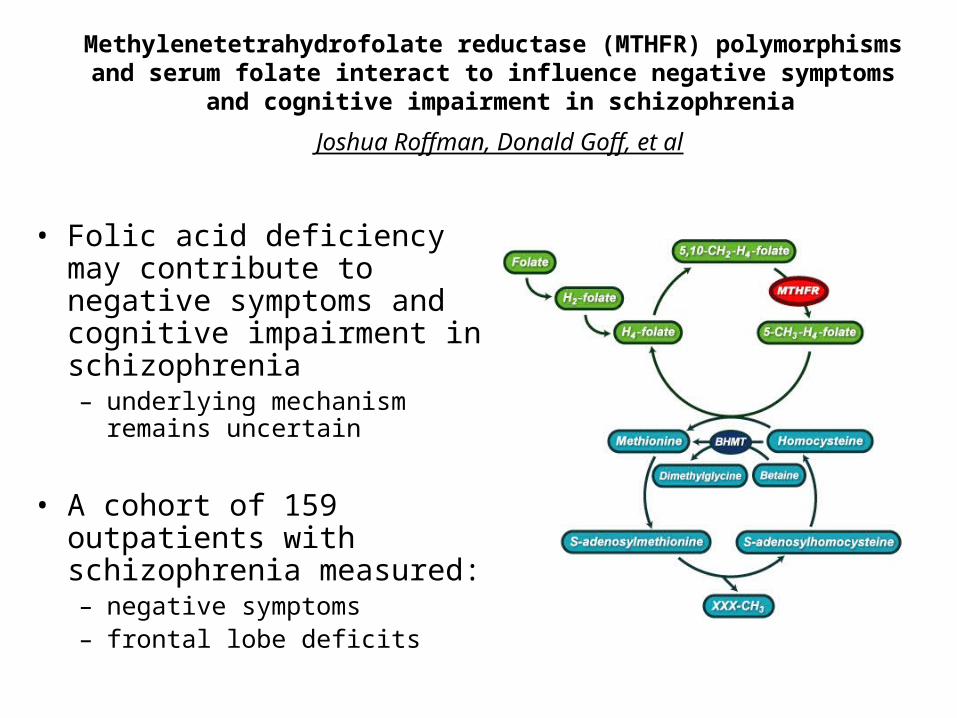
Methylenetetrahydrofolate reductase (MTHFR) polymorphisms and serum folate interact to influence negative symptoms
and cognitive impairment in schizophrenia
Joshua Roffman, Donald Goff, et al
• Folic acid deficiency may contribute to negative symptoms and cognitive impairment in schizophrenia– underlying mechanism remains
uncertain
• A cohort of 159 outpatients
with schizophrenia measured:– negative symptoms– frontal lobe deficits

0
5
10
15
20
25
30
35Low folate
High folate
PA
NS
S N
egat
ive
Sym
pto
ms
C/C & C/T
T/T
0
10
20
30
40
50
60
Low folate
High folate
C/C & C/T T/T
Ver
bal
Flu
ency
0
10
20
30
40
50
60
Low folate
High folate
C/C & C/T T/T
WC
ST
% P
erse
vera
tive
Err
ors
•Interaction of low serum folic acid and homozygosity for the MTHFR 677T allele confers risk.
•Patients homozygous for the MTHFR 677T allele may therefore benefit specifically from folic acid supplementation.

Further reading
• Cordell HJ (2002) Human Molecular Genetics 11: 2463-2468.
– a statistical review of epistasis, methods and definitions
• Clayton D & McKeigue P (2001) The Lancet, 358, 1357-60.
– a critical appraisal of GxE research
• Marchini J, Donnelly P & Cardon LR (2005) Nature Genetics, 37, 413-417
– epistasis in whole-genome association studies