shining cities 2018 - environmentamerica.org · installed in the extraterritorial jurisdictions of...
TRANSCRIPT

Shining Cities 2018How Smart Local Policies Are Expanding
Solar Power in America

Written by:
Abi Bradford, Frontier Group
Bret Fanshaw, Environment America Research & Policy Center
Shining Cities 2018How Smart Local Policies Are Expanding
Solar Power in America
April 2018

Environment America Research & Policy Center is a 501(c)(3) organization. We are dedicated to protecting our air, water and open spaces. We investigate problems, craft solutions, educate the public and decision-makers, and help the public make their voices heard in local, state and national debates over the quality of our
environment and our lives. For more information about Environment America Research & Policy Center or for additional copies of this report, please visit www.environmentamericacenter.org.
Environment America Research & Policy Center sincerely thanks Nathan Phelps with Vote Solar, Zachary Greene with The Solar Foundation, and Nicholas Kasza with National League of Cities, for their review of drafts of this document, as well as their insights and suggestions. Thanks to everyone who went out of their way to provide us with data for this report. Thanks to Gideon Weissman, Judee Burr, Jordan Schneider, Lindsey Hallock and Kim Norman for laying the groundwork by authoring previous editions of this report. Thanks also to Tony Dutzik and Elizabeth Berg of Frontier Group for editorial support and to ESRI for their grant of ArcGIS software that we used for the data analysis in this report.
Environment America Research & Policy Center thanks Arntz Family Foundation, Barr Foundation, Bullitt Foundation, Energy Foundation, Footprint Foundation, The Fund for New Jersey, John Merck Fund, McCune Charitable Foundation, Park Foundation, Scherman Foundation, The Cricket Foundation, The Cynthia & George Mitchell Foundation, Turner Foundation, and Wardlaw Charitable Trust for making this report possible.
The authors bear responsibility for any factual errors. The recommendations are those of Environment America Research & Policy Center. The views expressed in this report are those of the authors and do not necessarily reflect the views of our funders or those who provided review.
2018 Environment America Research & Policy Center. Some Rights Reserved. This work is licensed under a Creative Commons Attribution Non-Commercial No Derivatives 3.0 Unported License. To view the terms of this license, visit creativecommons.org/licenses/by-nc-nd/3.0.
Frontier Group provides information and ideas to help citizens build a cleaner, healthier and more democratic America. Our experts and writers deliver timely research and analysis that is accessible to the public, applying insights gleaned from a variety of disciplines to arrive at new ideas for solving pressing problems. For more information about Frontier Group, please visit www.frontiergroup.org.
Layout: To The Point Collaborative, tothepointcollaborative.com
Cover photos (clockwise from top): Solar panels at the Denver Museum of Nature and Science, Executive Office of the President of the United States, public domain (photo has been cropped); children with a solar panel in Seattle, Environment America Solar Photo Contest finalist, Steven; rooftop solar panels in Berkeley, California, Alfred Twu via Wikipedia, CC BY 1.0.
Acknowledgments

Table of ContentsExecutive Summary . . . . . . . . . . . . . . . . . . . . . . . . . . . . . . . . . . . . . . . . . . . . . . . . . . . . . 4
Introduction . . . . . . . . . . . . . . . . . . . . . . . . . . . . . . . . . . . . . . . . . . . . . . . . . . . . . . . . . . . 9
Solar Power Is Good for Cities . . . . . . . . . . . . . . . . . . . . . . . . . . . . . . . . . . . . . . . . . . . 10
Solar Energy Reduces Harmful Carbon Pollution . . . . . . . . . . . . . . . . . . . . . . . . . . . . . . . . . . . . . . . . . . . . . . 10
Solar Energy Reduces Air Pollution, Improving Public Health . . . . . . . . . . . . . . . . . . . . . . . . . . . . . . . . . . . . 10
Solar Energy Makes Cities More Resilient to Severe Weather . . . . . . . . . . . . . . . . . . . . . . . . . . . . . . . . . . . 10
Solar Energy Benefits Consumers . . . . . . . . . . . . . . . . . . . . . . . . . . . . . . . . . . . . . . . . . . . . . . . . . . . . . . . . . . 11
America’s Top Solar Cities Are Building a Clean Energy Future . . . . . . . . . . . . . . 12
The Top 20 Solar Cities Have 2 Gigawatts of Installed Solar Energy Capacity . . . . . . . . . . . . . . . . . . . . . . . 13
Leading Cities Continue to Grow in Solar Capacity Per Capita . . . . . . . . . . . . . . . . . . . . . . . . . . . . . . . . . . . 15
Every Region of the United States Has Leading Solar Cities . . . . . . . . . . . . . . . . . . . . . . . . . . . . . . . . . . . . . 18
Smaller Cities and Towns Are Going Big on Solar Energy . . . . . . . . . . . . . . . . . . . . . . . . . . . . . . . . . . . . . . . 20
Fossil Fuel Interests and Utilities Are Dimming the Promise of Solar Energy . . . . . . . . . . . . . . . . . . . . . . . 22
The Promise of Solar Power for U.S. Cities Is Enormous . . . . . . . . . . . . . . . . . . . . . . . . . . . . . . . . . . . . . . . . 23
Policy Recommendations. . . . . . . . . . . . . . . . . . . . . . . . . . . . . . . . . . . . . . . . . . . . . . . . 24
Methodology . . . . . . . . . . . . . . . . . . . . . . . . . . . . . . . . . . . . . . . . . . . . . . . . . . . . . . . . . . 29
Appendix A: Solar Energy in Major U.S. Cities . . . . . . . . . . . . . . . . . . . . . . . . . . . . . 31
Appendix B: Detailed Sources and Methodology by City. . . . . . . . . . . . . . . . . . . . . 34
Notes . . . . . . . . . . . . . . . . . . . . . . . . . . . . . . . . . . . . . . . . . . . . . . . . . . . . . . . . . . . . . . . . 43
4 SHINING CITIES 2018
Executive Summary
Solar power is expanding rapidly. The United States now has over 53 gigawatts (GW) of solar photovoltaic (PV) capacity installed –
enough to power 10.1 million homes and 26 times as much capacity as was installed at the end of 2010.1 Hundreds of thousands of Americans have invested in solar energy and millions more are ready to join them.
America’s major cities have played a key role in the clean energy revolution and stand to reap
tremendous benefits from solar energy. As popu-lation centers, they are major sources of electricity demand and, with millions of rooftops suitable for solar panels, they have the potential to be major sources of clean energy as well.
Solar power can allow cities to curb emissions that contribute to global warming, become more resilient to severe weather, help residents stabi-lize their energy bills, and improve public health through reduced air pollution.
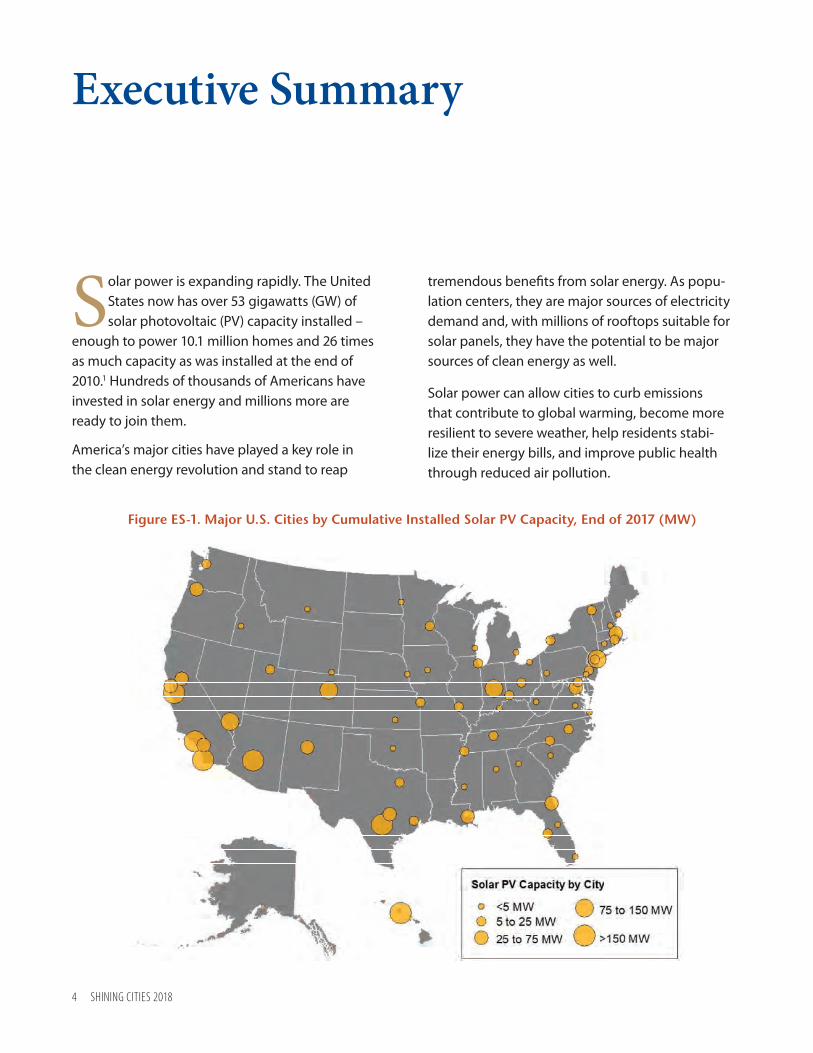
Figure ES-1. Major U.S. Cities by Cumulative Installed Solar PV Capacity, End of 2017 (MW)
Executive Summary 5
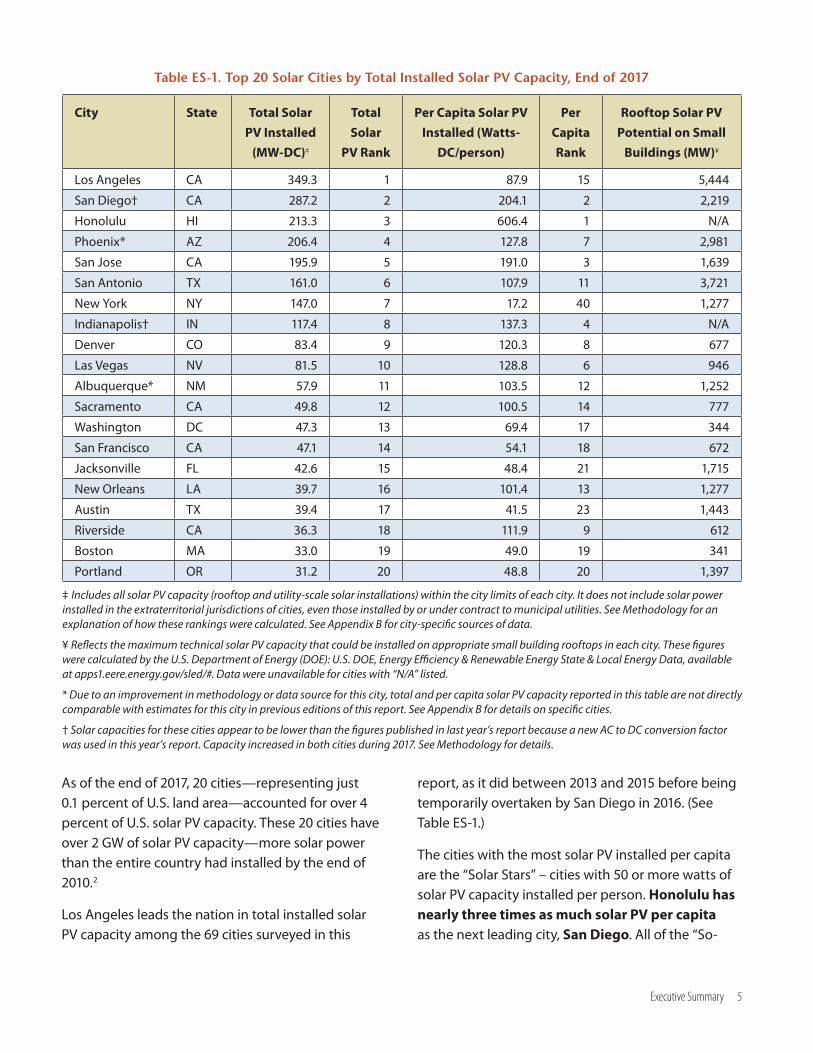
Table ES-1. Top 20 Solar Cities by Total Installed Solar PV Capacity, End of 2017
As of the end of 2017, 20 cities—representing just 0.1 percent of U.S. land area—accounted for over 4 percent of U.S. solar PV capacity. These 20 cities have over 2 GW of solar PV capacity—more solar power than the entire country had installed by the end of 2010.2
Los Angeles leads the nation in total installed solar PV capacity among the 69 cities surveyed in this
report, as it did between 2013 and 2015 before being temporarily overtaken by San Diego in 2016. (See Table ES-1.)
The cities with the most solar PV installed per capita are the “Solar Stars” – cities with 50 or more watts of solar PV capacity installed per person. Honolulu has nearly three times as much solar PV per capita as the next leading city, San Diego. All of the “So-
City State Total Solar PV Installed
(MW-DC)‡
Total Solar
PV Rank
Per Capita Solar PV Installed (Watts-
DC/person)
Per Capita Rank
Rooftop Solar PV Potential on Small
Buildings (MW)¥
Los Angeles CA 349.3 1 87.9 15 5,444
San Diego† CA 287.2 2 204.1 2 2,219
Honolulu HI 213.3 3 606.4 1 N/A
Phoenix* AZ 206.4 4 127.8 7 2,981
San Jose CA 195.9 5 191.0 3 1,639
San Antonio TX 161.0 6 107.9 11 3,721
New York NY 147.0 7 17.2 40 1,277
Indianapolis† IN 117.4 8 137.3 4 N/A
Denver CO 83.4 9 120.3 8 677
Las Vegas NV 81.5 10 128.8 6 946
Albuquerque* NM 57.9 11 103.5 12 1,252
Sacramento CA 49.8 12 100.5 14 777
Washington DC 47.3 13 69.4 17 344
San Francisco CA 47.1 14 54.1 18 672
Jacksonville FL 42.6 15 48.4 21 1,715
New Orleans LA 39.7 16 101.4 13 1,277
Austin TX 39.4 17 41.5 23 1,443
Riverside CA 36.3 18 111.9 9 612
Boston MA 33.0 19 49.0 19 341
Portland OR 31.2 20 48.8 20 1,397
‡ Includes all solar PV capacity (rooftop and utility-scale solar installations) within the city limits of each city. It does not include solar power installed in the extraterritorial jurisdictions of cities, even those installed by or under contract to municipal utilities. See Methodology for an explanation of how these rankings were calculated. See Appendix B for city-specific sources of data.
¥ Reflects the maximum technical solar PV capacity that could be installed on appropriate small building rooftops in each city. These figures were calculated by the U.S. Department of Energy (DOE): U.S. DOE, Energy Efficiency & Renewable Energy State & Local Energy Data, available at apps1.eere.energy.gov/sled/#. Data were unavailable for cities with “N/A” listed.
* Due to an improvement in methodology or data source for this city, total and per capita solar PV capacity reported in this table are not directly comparable with estimates for this city in previous editions of this report. See Appendix B for details on specific cities.
† Solar capacities for these cities appear to be lower than the figures published in last year’s report because a new AC to DC conversion factor was used in this year’s report. Capacity increased in both cities during 2017. See Methodology for details.
6 SHINING CITIES 2018
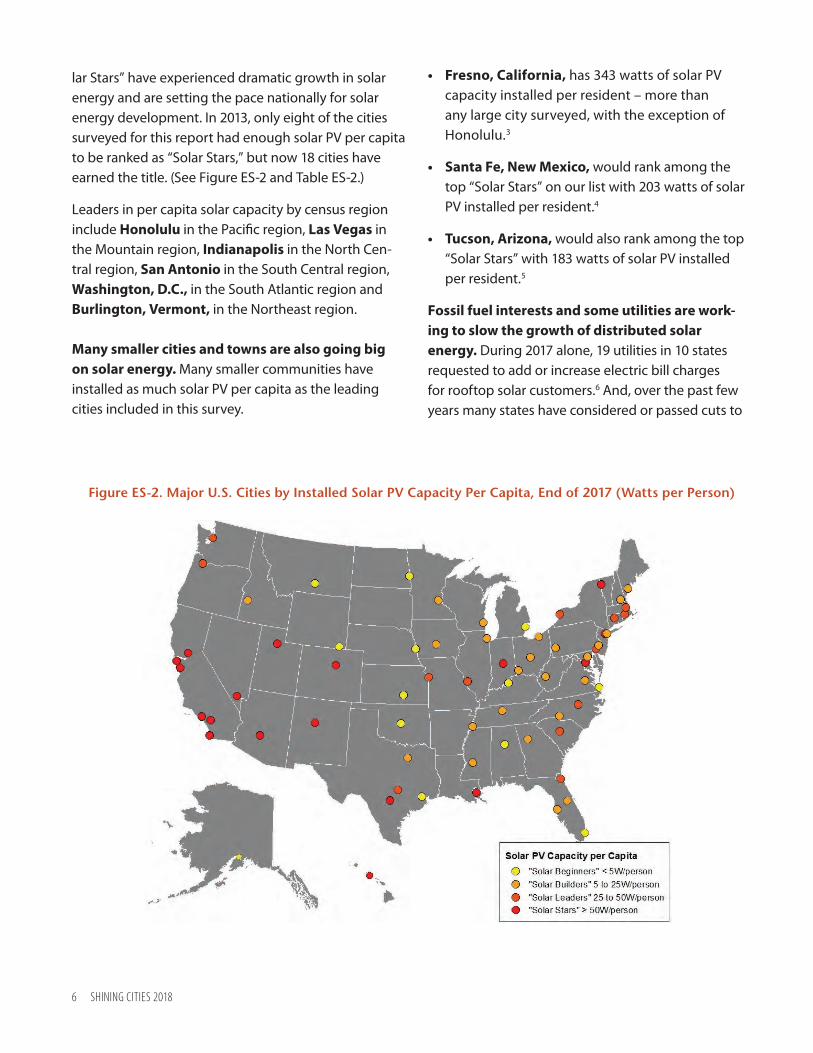
lar Stars” have experienced dramatic growth in solar energy and are setting the pace nationally for solar energy development. In 2013, only eight of the cities surveyed for this report had enough solar PV per capita to be ranked as “Solar Stars,” but now 18 cities have earned the title. (See Figure ES-2 and Table ES-2.)
Leaders in per capita solar capacity by census region include Honolulu in the Pacific region, Las Vegas in the Mountain region, Indianapolis in the North Cen-tral region, San Antonio in the South Central region, Washington, D.C., in the South Atlantic region and Burlington, Vermont, in the Northeast region.
Many smaller cities and towns are also going big on solar energy. Many smaller communities have installed as much solar PV per capita as the leading cities included in this survey.
• Fresno, California, has 343 watts of solar PV capacity installed per resident – more than any large city surveyed, with the exception of Honolulu.3
• Santa Fe, New Mexico, would rank among the top “Solar Stars” on our list with 203 watts of solar PV installed per resident.4
• Tucson, Arizona, would also rank among the top “Solar Stars” with 183 watts of solar PV installed per resident.5
Fossil fuel interests and some utilities are work-ing to slow the growth of distributed solar energy. During 2017 alone, 19 utilities in 10 states requested to add or increase electric bill charges for rooftop solar customers.6 And, over the past few years many states have considered or passed cuts to
Figure ES-2. Major U.S. Cities by Installed Solar PV Capacity Per Capita, End of 2017 (Watts per Person)

Executive Summary 7
Table ES-2. The “Solar Stars” (Cities with 50 or More Watts of Solar PV per Person, End of 2017)
net metering – the critical practice of crediting solar energy customers for the excess energy they supply to the grid.7
U.S. cities have only begun to tap their solar en-ergy potential. Some of the cities on this list could generate hundreds of times more solar power, and the majority could generate at least 50 times more solar power than they currently do on the rooftops of small buildings alone, according to a National
Renewable Energy Laboratory (NREL) analysis.8
Cities can go even farther by encouraging solar installations on large buildings and stand-alone utility-scale installations.
To take advantage of that potential and move America toward an economy powered by 100 percent renewable energy, city, state and federal governments should adopt a series of pro-solar policies.
City State Total Solar PV Installed
(MW-DC)
Total Solar PV
Rank
Per Capita Solar PV Installed
(Watts-DC/person)
Per Capita Rank
Change in Per Capita Rank from
2016 to 2017¥
Honolulu HI 213.3 3 606.4 1 0
San Diego† CA 287.2 2 204.1 2 0
San Jose CA 195.9 5 191.0 3 0
Indianapolis† IN 117.4 8 137.3 4 0
Burlington VT 5.6 39 132.2 5 +6
Las Vegas NV 81.5 10 128.8 6 0
Phoenix* AZ 206.4 4 127.8 7 N/A
Denver CO 83.4 9 120.3 8 N/A
Riverside CA 36.3 18 111.9 9 -1
Salt Lake City UT 21.7 22 111.9 10 +4
San Antonio TX 161.0 6 107.9 11 +1
Albuquerque* NM 57.9 11 103.5 12 N/A
New Orleans LA 39.7 16 101.4 13 -4
Sacramento CA 49.8 12 100.5 14 -4
Los Angeles CA 349.3 1 87.9 15 0
Newark NJ 24.4 21 86.5 16 -3
Washington DC 47.3 13 69.4 17 +4
San Francisco CA 47.1 14 54.1 18 -1
* Due to an improvement in methodology or data source for this city, total and per capita solar PV capacity reported in this table are not directly comparable with estimates for this city in previous editions of this report. See Appendix B for details on specific cities.
† Solar capacities for these cities appear to be lower than the figures published in last year’s report because a new AC to DC conversion factor was used in this year’s report. Capacity increased in both cities during 2017. See Methodology for details.
¥ “N/A” is listed for cities where 2017 data is not directly comparable with 2016 data, either because 2016 data were unavailable or due to an improvement in methodology. See Appendix B for details on specific cities.
8 SHINING CITIES 2018
Local governments should, among other things:
• Implement solar access ordinances to protect residents’ right to generate solar energy on their own property.
• Make permitting, zoning and inspection processes easy, quick and affordable.
• Expand access to solar energy to apartment dwellers, low-income residents, small businesses, and nonprofits through low-interest financing programs, power purchase agreements (PPAs), collective purchasing programs, and community solar projects.
• Support and push for strong state-level solar policies, especially by combining efforts with other communities.
State governments should, among other things:
• Set or increase renewable energy targets for utilities and adopt specific requirements for solar energy adoption.
• Adopt and preserve strong statewide interconnec-tion and net metering policies.
• Ensure that electric rate designs encourage solar adoption.
• Establish public benefits charges on utility bills or other sustainable financing mechanisms for solar energy.
The federal government should, among other things:
• Continue and expand financing support for solar energy, particularly the Investment Tax Credit.
• Support research to drive solar power innovations, such as the U.S. Department of Energy’s Solar Energy Technologies Office.
• Defend and strengthen the requirements of the Clean Power Plan.

Introduction 9
Introduction
Solar power is an American success story. A rarity just a decade ago, the United States now has enough solar energy installed to power one in
14 American homes – nearly 1.6 million solar installa-tions.9 After a year of rapid growth in 2017, U.S. solar photovoltaic (PV) capacity now exceeds 53 gigawatts (GW), enough to power 10.1 million homes.10 Im-provements in solar technology and rapidly declining costs are making solar energy more attractive with each passing year.
The rise of solar power over the past decade has been largely driven by cities. In these densely-popu-lated areas, solar power is helping to clean the air and reduce carbon pollution.
Some cities have demonstrated exceptional leader-ship in adopting solar power. The key difference between these leaders and cities that are lagging is effective public policy.
State and local policies are core ingredients of a suc-cessful solar market. Cities where solar homeowners are paid a fair price for the energy they supply to the grid, where installing solar panels is easy and hassle-free, where there are attractive options for solar financing, and where there has been a strong com-mitment to support solar energy development, are cities where solar energy is taking off.
Solar energy adoption in every city, meanwhile, is affected by federal policies. Federal tax credits for renewable energy are making an important contribu-
tion to fueling growth in solar power, but the resi-dential credits are scheduled to phase out in 2022.11
American solar energy is at a tipping point. We are nearing the threshold, called “grid parity,” where solar power is equivalent in price to electricity generated by fossil fuels and the conditions are in place for mass adoption of solar energy. In fact, over half of all U.S. states have reached grid parity and Greentech Media predicts that 42 states will achieve it by 2020.12
The rapid spread of low-cost solar power has posed a threat to the business models of fossil fuel inter-ests and some utilities, who have united in an effort to slow the progress of solar energy. In 2017 alone, 19 utilities in 10 states requested to add or increase electric bill charges for rooftop solar customers specifically.13 And, over the past few years, many states have considered or passed cuts to net meter-ing – the critical practice of crediting solar energy customers for the excess energy they supply to the grid.14 The outcome of those battles will determine how rapidly our cities and the rest of the nation can reap the benefits of the solar revolution.
Cities continue to lead the way in the transition to a clean energy system powered by renewable energy. With tremendous unmet potential for solar energy in every city, now is the time for cities, as well as state and federal governments, to recommit to the policies that are bringing that clean energy future closer to reality.

10 SHINING CITIES 2018
Solar Power Is Good for Cities
Solar energy helps cities in many ways, includ-ing by combating global warming, reducing air pollution, strengthening the electric grid, and
stabilizing energy costs for residents.
Solar Energy Reduces Harmful Carbon PollutionAmerica can limit the future impact of global warm-ing by slashing its use of the dirty energy sources that cause it.15 Unlike fossil fuel power plants, solar energy systems produce no carbon emissions. Even when emissions from manufacturing, transportation and installation of solar panels are included, solar power generation produces 96 percent fewer greenhouse gas emissions than electricity from coal over its entire life cycle, and 91 percent fewer greenhouse gas emis-sions than electricity from gas-fired power plants.16 By replacing electricity from fossil fuels with solar power, we can dramatically cut carbon pollution and reduce global warming.
Solar Energy Reduces Air Pollution, Improving Public HealthPollution from fossil fuel combustion causes major health problems in American cities. According to the World Health Organization, outdoor air pollution is linked to stroke, heart disease, acute respiratory disease, asthma and lung cancer.17 These conditions can lead to disability, prolonged absences from work or school, and even death.18 One study found that
pollution from electric power plants is responsible for about 50,000 U.S. deaths per year.19 Cities in the Mid-west and Mid-Atlantic, such as Baltimore, Cleveland, St. Louis and Washington, D.C., bear a particularly heavy health burden from power plant pollution.20
Solar energy reduces the need for polluting, fossil fuel-generated electricity. Given the high social and economic costs of air pollution-related illnesses, solar energy is a smart investment in human health and the economy.
Solar Energy Makes Cities More Resilient to Severe WeatherSolar energy helps cities conserve water in times of drought. Nationally, electricity production accounts for about 40 percent of freshwater withdrawals.21 Unlike the fossil fuel-fired power plants that currently generate the bulk of American electricity, solar PV systems do not require high volumes of water for cooling.22 In fact, solar PV systems consume 500 times less water than coal power plants over their life-cycle and 80 times less than natural gas plants, per unit of electricity produced.23
During periods of hot weather, solar power, which is most available when it is sunny, helps meet demand for electric power for air conditioning. The close alignment of power supply and power demand at these times helps cities avoid the need to turn on – and sometimes even build – “peaker” power plants,
Solar Power Is Good for Cities 11
which tend to be highly expensive and polluting.24 Because the impact of air pollution is most harmful when temperatures are high, relying on solar power during hot weather also helps improve public health.25
Solar energy can even help to protect cities in the face of severe storms. If transmission lines are dis-rupted, solar microgrids can help prevent blackouts by going temporarily “off the grid” and providing power directly to the facilities where they are gen-erating electricity.26
Solar Energy Benefits ConsumersCities that make solar energy accessible and afford-able provide direct and indirect economic benefits to their residents. These benefits are enjoyed by both solar energy customers and other members of the community.
Home and business owners who install solar panels on their buildings, known as distributed solar PV systems, can generate their own electricity. Because energy from the sun is free once the system is installed, these solar consumers are protected from the volatile prices of fossil fuel markets.
In states with net metering, when solar panel own-ers generate more energy than they need at a given point in time, they can export this energy to the grid in exchange for credit. They can then use that credit to pay for electricity they receive from the grid later, when their solar panels aren’t generating enough energy. On average, about 20 to 40 percent of a solar energy system’s output is exported back to the electric grid, serving nearby customers.27 The credits collected by system owners can help them recoup initial investments made in PV systems over time.
Distributed Solar Electricity Provides Benefits to the Broader Electric GridThe benefits of solar energy extend beyond the buildings on which PV panels are installed. Distribut-ed solar energy provides additional electric generat-ing capacity during periods of peak demand and can replace expensive and dirty peaker power plants.28 Generating more electricity closer to the locations where it is used also reduces the need to construct or upgrade expensive transmission capacity. Local-ized electricity generation minimizes the amount of energy lost during transmission, improving electric system efficiency too.29
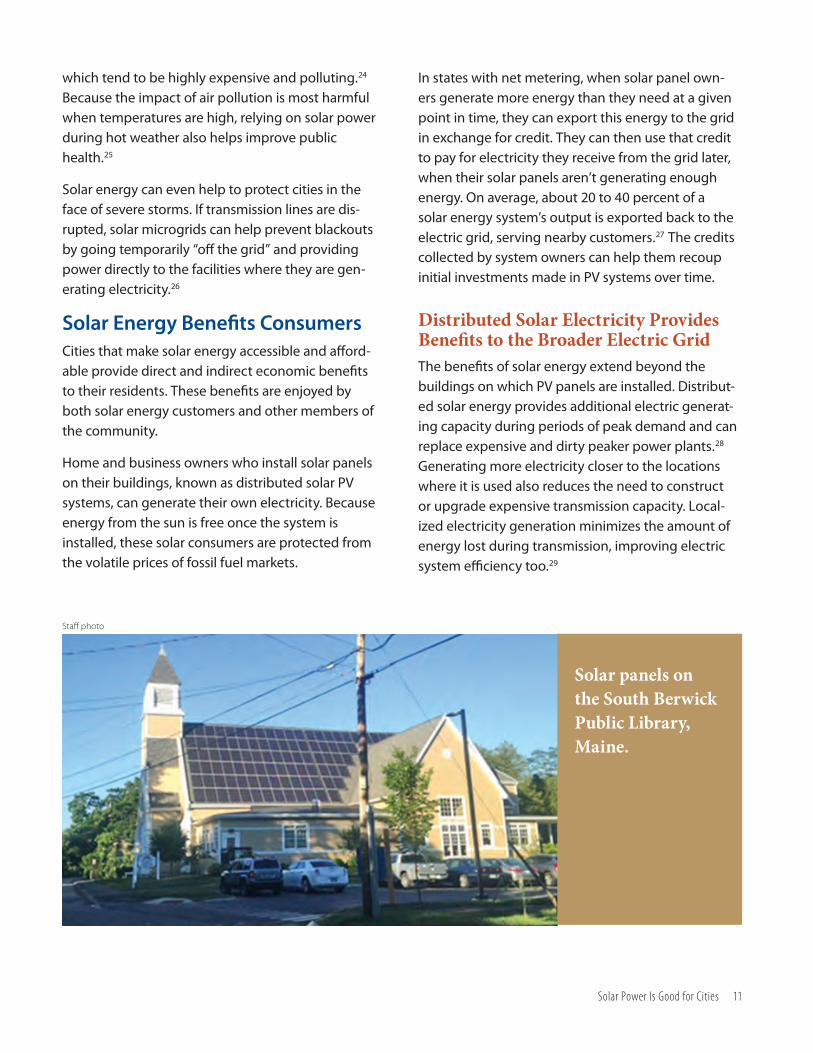
Staff photo
Solar panels on the South Berwick Public Library, Maine.
12 SHINING CITIES 2018
America’s Top Solar Cities Are Building a Clean Energy Future
City leaders and residents are taking advan-tage of the significant opportunities offered by solar energy as the U.S. solar energy
boom continues.
In leading cities, officials are setting ambitious goals for solar energy adoption, putting solar panels on city buildings, and working with utilities to up-grade the electric grid and offer electric custom-ers incentives to invest in solar energy systems. In these cities, permitting departments are taking steps to reduce fees and processing times for solar installation applications. As a result, city residents, individually and with their neighbors, are cutting
their electricity bills and contributing to a cleaner environment by purchasing solar energy.
This report is our fifth review of installed solar PV capacity in U.S. cities. This year, the list of cities to be surveyed started with the primary cities in the top 50 most populous Metropolitan Statisti-cal Areas in the United States according to the U.S. Census Bureau.30 If a state did not have a city included in that list, its most populous city was added to the list to be surveyed. For a complete list of cities, see Appendix B. We were unable to find reliable data for Little Rock, Arkansas, so the city was dropped from the list. Also, Sioux Valley
With tremendous unmet potential for solar energy in every city, now is the time for cities, as well as state and federal governments, to recommit to the policies that are
bringing that clean energy future closer to reality.
America’s Top Solar Cities Are Building a Clean Energy Future 13
Energy, the utility that serves Sioux Falls, South Dakota, reported that there is no solar capacity installed in Sioux Falls’ city limits connected to their grid.31
There is no uniform and comprehensive national data source that tracks solar energy capacity by municipality, so the data for this report come from a variety of sources. (See Methodology.) This may lead to variation among cities in how solar capac-ity is quantified and in the comprehensiveness of the data. While we endeavored to correct for many of these inconsistencies, readers should be aware that some discrepancies may remain. In some cas-es, more precise methods were found for measur-ing solar capacity for this year’s report, meaning that comparisons with data reported in previous
reports may not be valid. Such cases are noted in Appendix B. An updated alternating current (AC) to direct current (DC) conversion factor was used in this report, so all figures involving an AC to DC conversion are not directly comparable with previ-ously reported figures. Cases where this change in methodology led to an artificial decrease in capac-ity are noted in Appendix B.
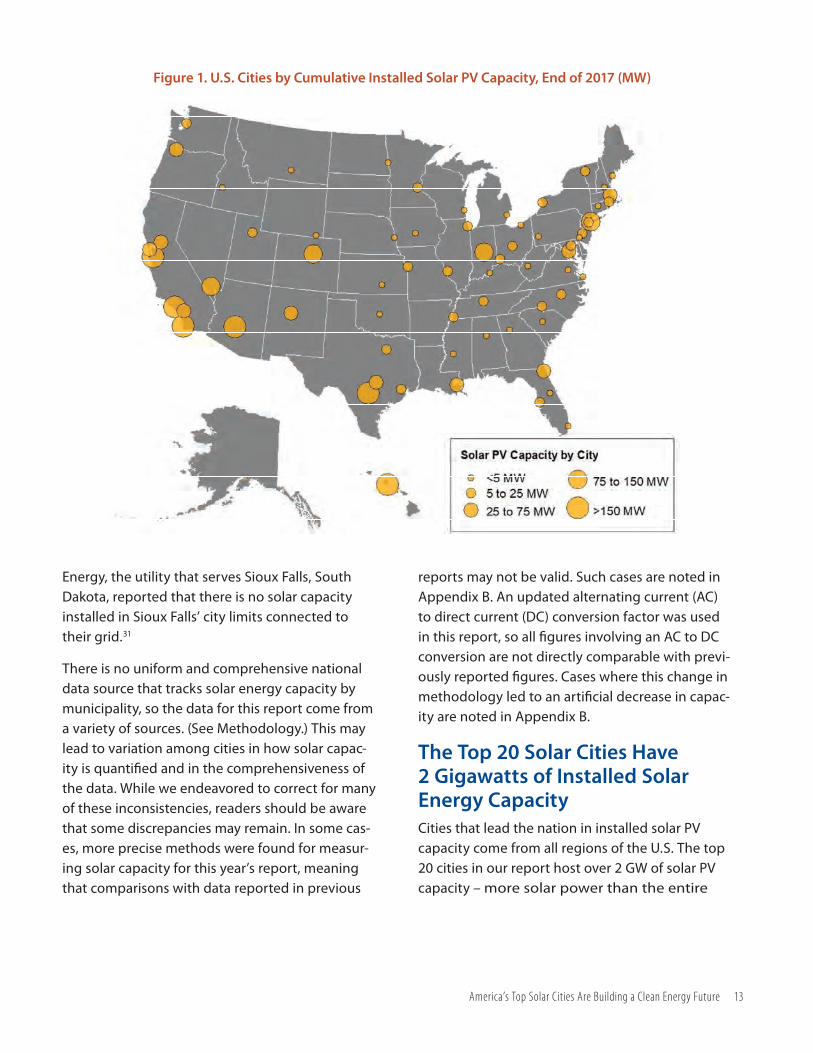
The Top 20 Solar Cities Have 2 Gigawatts of Installed Solar Energy CapacityCities that lead the nation in installed solar PV capacity come from all regions of the U.S. The top 20 cities in our report host over 2 GW of solar PV capacity – more solar power than the entire
Figure 1. U.S. Cities by Cumulative Installed Solar PV Capacity, End of 2017 (MW)
14 SHINING CITIES 2018
country had installed at the end of 2010.32 Despite making up only 0.1 percent of the nation’s land area, these cities contain over 4 percent of U.S. solar PV capacity.33
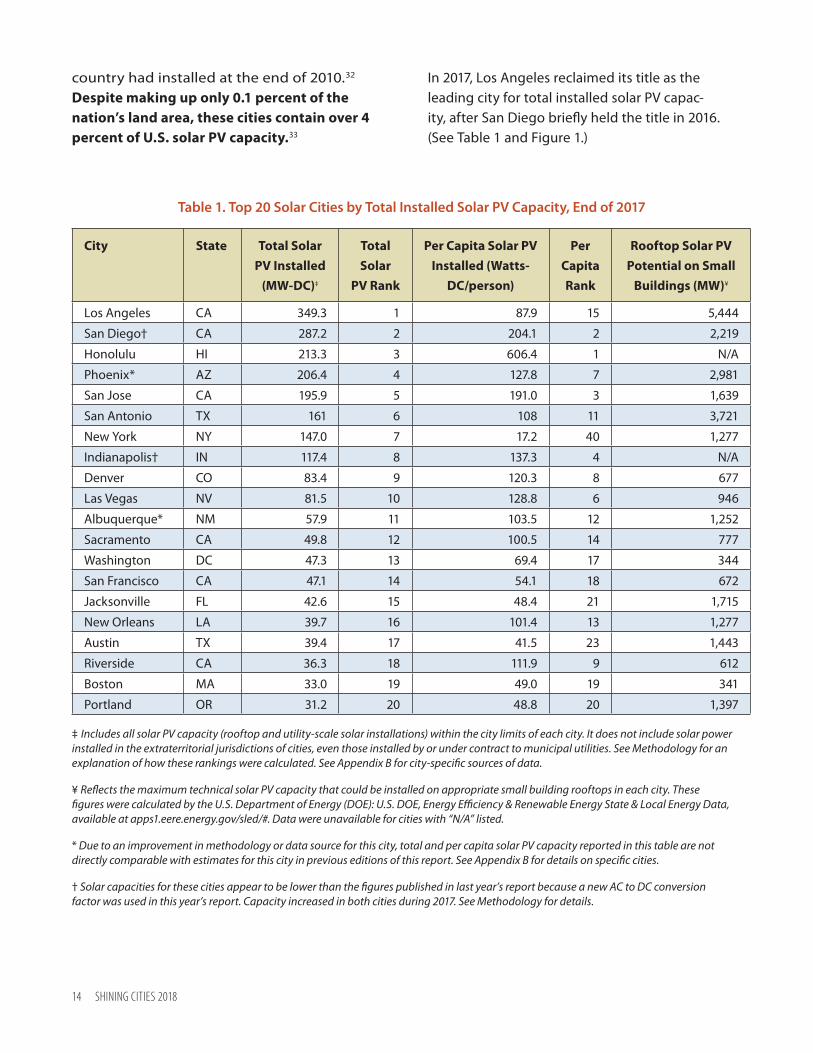
In 2017, Los Angeles reclaimed its title as the leading city for total installed solar PV capac-ity, after San Diego briefly held the title in 2016. (See Table 1 and Figure 1.)
Table 1. Top 20 Solar Cities by Total Installed Solar PV Capacity, End of 2017
City State Total Solar PV Installed
(MW-DC)‡
Total Solar
PV Rank
Per Capita Solar PV Installed (Watts-
DC/person)
Per Capita Rank
Rooftop Solar PV Potential on Small
Buildings (MW)¥
Los Angeles CA 349.3 1 87.9 15 5,444
San Diego† CA 287.2 2 204.1 2 2,219
Honolulu HI 213.3 3 606.4 1 N/A
Phoenix* AZ 206.4 4 127.8 7 2,981
San Jose CA 195.9 5 191.0 3 1,639
San Antonio TX 161 6 108 11 3,721
New York NY 147.0 7 17.2 40 1,277
Indianapolis† IN 117.4 8 137.3 4 N/A
Denver CO 83.4 9 120.3 8 677
Las Vegas NV 81.5 10 128.8 6 946
Albuquerque* NM 57.9 11 103.5 12 1,252
Sacramento CA 49.8 12 100.5 14 777
Washington DC 47.3 13 69.4 17 344
San Francisco CA 47.1 14 54.1 18 672
Jacksonville FL 42.6 15 48.4 21 1,715
New Orleans LA 39.7 16 101.4 13 1,277
Austin TX 39.4 17 41.5 23 1,443
Riverside CA 36.3 18 111.9 9 612
Boston MA 33.0 19 49.0 19 341
Portland OR 31.2 20 48.8 20 1,397
‡ Includes all solar PV capacity (rooftop and utility-scale solar installations) within the city limits of each city. It does not include solar power installed in the extraterritorial jurisdictions of cities, even those installed by or under contract to municipal utilities. See Methodology for an explanation of how these rankings were calculated. See Appendix B for city-specific sources of data.
¥ Reflects the maximum technical solar PV capacity that could be installed on appropriate small building rooftops in each city. These figures were calculated by the U.S. Department of Energy (DOE): U.S. DOE, Energy Efficiency & Renewable Energy State & Local Energy Data, available at apps1.eere.energy.gov/sled/#. Data were unavailable for cities with “N/A” listed.
* Due to an improvement in methodology or data source for this city, total and per capita solar PV capacity reported in this table are not directly comparable with estimates for this city in previous editions of this report. See Appendix B for details on specific cities.
† Solar capacities for these cities appear to be lower than the figures published in last year’s report because a new AC to DC conversion factor was used in this year’s report. Capacity increased in both cities during 2017. See Methodology for details.

America’s Top Solar Cities Are Building a Clean Energy Future 15
Leading Cities Continue to Grow in Solar Capacity Per CapitaThe cities ranked in this report vary in size, popula-tion and geography. Measuring solar PV capacity installed per city resident, in addition to comparing total installed solar PV capacity, can provide an idea of how densely developed solar energy is in a city.
“Solar Stars” are cities with 50 or more watts of installed solar PV capacity per person. These are
cities that have experienced dramatic growth in solar energy in recent years and are setting the pace nationally for solar energy development. Honolulu has nearly three times as much solar PV per capita as the next highest ranked city, San Diego. San Jose, Indianapolis and Burlington are also in the top five cities in the nation for installed solar PV capacity per person. In 2013, only eight of the cities surveyed for this report had enough solar PV per capita to be ranked as “Solar Stars,” but now 18 cities have earned the title.
City State Total Solar PV Installed
(MW-DC)
Total Solar PV
Rank
Per Capita Solar PV Installed
(Watts-DC/person)
Per Capita Rank
Change in Per Capita Rank from
2016 to 2017¥
Honolulu HI 213.3 3 606.4 1 0
San Diego† CA 287.2 2 204.1 2 0
San Jose CA 195.9 5 191.0 3 0
Indianapolis† IN 117.4 8 137.3 4 0
Burlington VT 5.6 39 132.2 5 +6
Las Vegas NV 81.5 10 128.8 6 0
Phoenix* AZ 206.4 4 127.8 7 N/A
Denver CO 83.4 9 120.3 8 N/A
Riverside CA 36.3 18 111.9 9 -1
Salt Lake City UT 21.7 22 111.9 10 +4
San Antonio TX 161.0 6 107.9 11 +1
Albuquerque* NM 57.9 11 103.5 12 N/A
New Orleans LA 39.7 16 101.4 13 -4
Sacramento CA 49.8 12 100.5 14 -4
Los Angeles CA 349.3 1 87.9 15 0
Newark NJ 24.4 21 86.5 16 -3
Washington DC 47.3 13 69.4 17 +4
San Francisco CA 47.1 14 54.1 18 -1
* Due to an improvement in methodology or data source for this city, total and per capita solar PV capacity reported in this table are not directly comparable with estimates for this city in previous editions of this report. See Appendix B for details on specific cities.
† Solar capacities for these cities appear to be lower than the figures published in last year’s report because a new AC to DC conversion factor was used in this year’s report. Capacity increased in both cities during 2017. See Methodology for details.
¥ “N/A” is listed for cities where 2017 data is not directly comparable with 2016 data, either because 2016 data were unavailable or due to an improvement in methodology. See Appendix B for details on specific cities.
Table 2. The “Solar Stars” (Cities with 50 or More Watts of Solar PV per Person, End of 2017)
16 SHINING CITIES 2018
City State Total Solar PV Installed (MW-DC)
Total Solar PV Rank
Per Capita Solar PV Installed (Watts-DC/person)
Per Capita Rank
Change in Per Capita Rank from 2016 to 2017¥
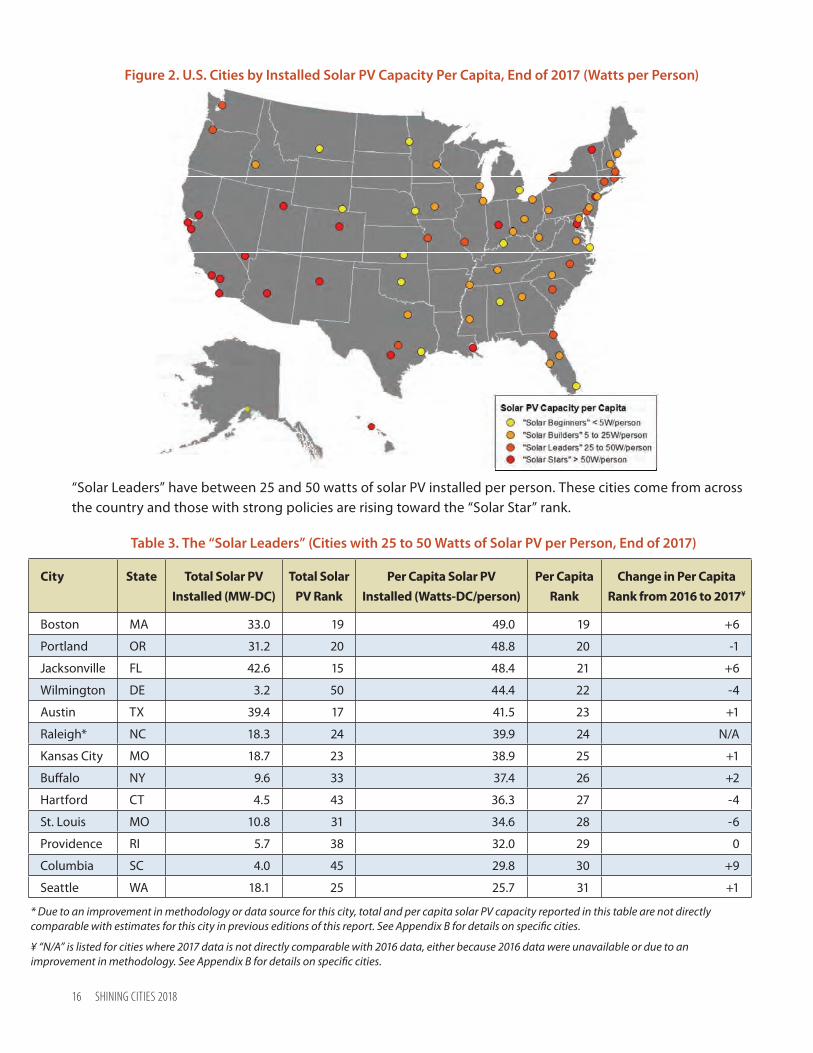
Boston MA 33.0 19 49.0 19 +6
Portland OR 31.2 20 48.8 20 -1
Jacksonville FL 42.6 15 48.4 21 +6
Wilmington DE 3.2 50 44.4 22 -4
Austin TX 39.4 17 41.5 23 +1
Raleigh* NC 18.3 24 39.9 24 N/A
Kansas City MO 18.7 23 38.9 25 +1
Buffalo NY 9.6 33 37.4 26 +2
Hartford CT 4.5 43 36.3 27 -4
St. Louis MO 10.8 31 34.6 28 -6
Providence RI 5.7 38 32.0 29 0
Columbia SC 4.0 45 29.8 30 +9
Seattle WA 18.1 25 25.7 31 +1
Table 3. The “Solar Leaders” (Cities with 25 to 50 Watts of Solar PV per Person, End of 2017)
* Due to an improvement in methodology or data source for this city, total and per capita solar PV capacity reported in this table are not directly comparable with estimates for this city in previous editions of this report. See Appendix B for details on specific cities.
¥ “N/A” is listed for cities where 2017 data is not directly comparable with 2016 data, either because 2016 data were unavailable or due to an improvement in methodology. See Appendix B for details on specific cities.
“Solar Leaders” have between 25 and 50 watts of solar PV installed per person. These cities come from across the country and those with strong policies are rising toward the “Solar Star” rank.
Figure 2. U.S. Cities by Installed Solar PV Capacity Per Capita, End of 2017 (Watts per Person)
America’s Top Solar Cities Are Building a Clean Energy Future 17
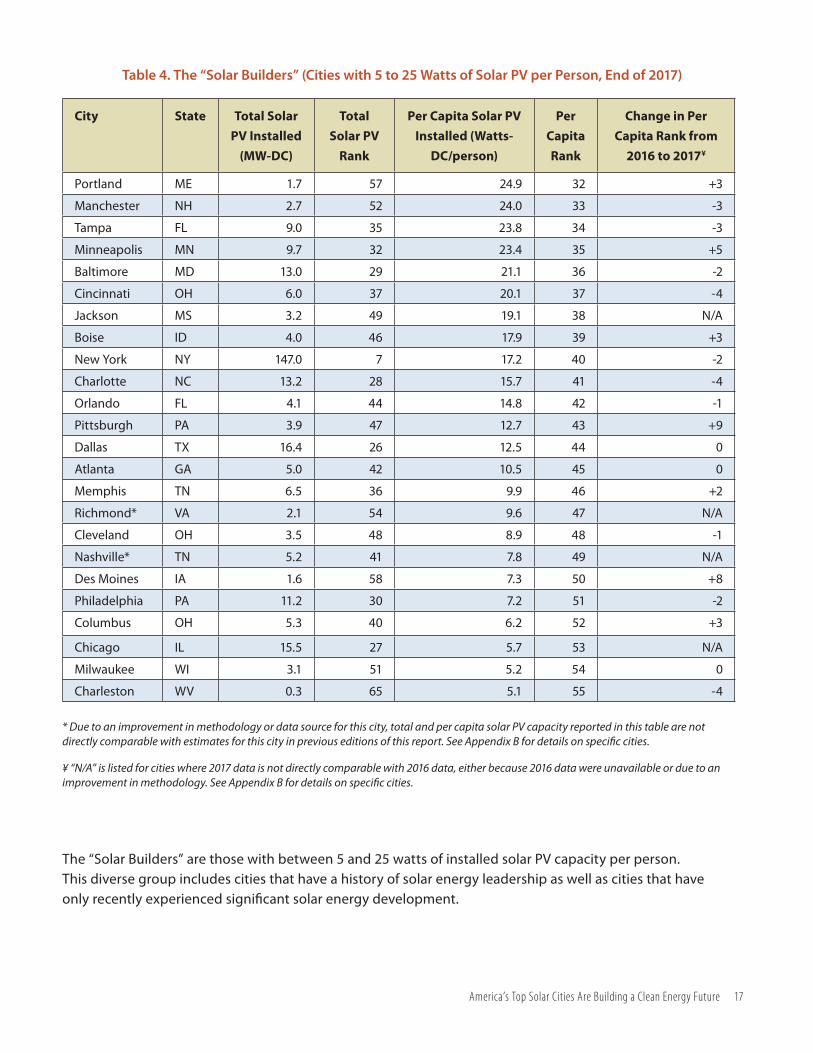
The “Solar Builders” are those with between 5 and 25 watts of installed solar PV capacity per person. This diverse group includes cities that have a history of solar energy leadership as well as cities that have only recently experienced significant solar energy development.
Table 4. The “Solar Builders” (Cities with 5 to 25 Watts of Solar PV per Person, End of 2017)
* Due to an improvement in methodology or data source for this city, total and per capita solar PV capacity reported in this table are not directly comparable with estimates for this city in previous editions of this report. See Appendix B for details on specific cities.
¥ “N/A” is listed for cities where 2017 data is not directly comparable with 2016 data, either because 2016 data were unavailable or due to an improvement in methodology. See Appendix B for details on specific cities.
City State Total Solar PV Installed
(MW-DC)
Total Solar PV
Rank
Per Capita Solar PV Installed (Watts-
DC/person)
Per Capita Rank
Change in Per Capita Rank from
2016 to 2017¥
Portland ME 1.7 57 24.9 32 +3
Manchester NH 2.7 52 24.0 33 -3
Tampa FL 9.0 35 23.8 34 -3
Minneapolis MN 9.7 32 23.4 35 +5
Baltimore MD 13.0 29 21.1 36 -2
Cincinnati OH 6.0 37 20.1 37 -4
Jackson MS 3.2 49 19.1 38 N/A
Boise ID 4.0 46 17.9 39 +3
New York NY 147.0 7 17.2 40 -2
Charlotte NC 13.2 28 15.7 41 -4
Orlando FL 4.1 44 14.8 42 -1
Pittsburgh PA 3.9 47 12.7 43 +9
Dallas TX 16.4 26 12.5 44 0
Atlanta GA 5.0 42 10.5 45 0
Memphis TN 6.5 36 9.9 46 +2
Richmond* VA 2.1 54 9.6 47 N/A
Cleveland OH 3.5 48 8.9 48 -1
Nashville* TN 5.2 41 7.8 49 N/A
Des Moines IA 1.6 58 7.3 50 +8
Philadelphia PA 11.2 30 7.2 51 -2
Columbus OH 5.3 40 6.2 52 +3
Chicago IL 15.5 27 5.7 53 N/A
Milwaukee WI 3.1 51 5.2 54 0
Charleston WV 0.3 65 5.1 55 -4

18 SHINING CITIES 2018
The “Solar Beginners” are cities with less than 5 watts of installed solar PV capacity per person. Many of these cities are just beginning to experience significant development of solar energy, while a few have yet to experience much solar energy development.
City State Total Solar PV Installed
(MW-DC)
Total Solar PV
Rank
Per Capita Solar PV Installed (Watts-
DC/person)
Per Capita Rank
Change in Per Capita Rank from
2016 to 2017¥
Wichita KS 1.9 55 4.9 56 -6
Billings MT 0.5 63 4.2 57 -1
Houston TX 9.5 34 4.1 58 -1
Cheyenne WY 0.3 64 4.1 59 N/A
Louisville KY 2.3 53 3.8 60 +1
Miami* FL 1.3 60 2.9 61 N/A
Oklahoma City OK 1.7 56 2.6 62 -3
Anchorage AK 0.7 61 2.2 63 0
Detroit MI 1.4 59 2.1 64 -4
Omaha* NE 0.5 62 1.1 65 N/A
Fargo ND 0.1 68 1.0 66 0
Birmingham AL 0.2 67 0.8 67 -2
Virginia Beach VA 0.2 66 0.4 68 -4
Every Region of the United States Has Leading Solar CitiesCities in every region of the country have taken leadership in adopting solar energy. Table 6 lists the top two cities in each region with the most installed solar PV capacity per city resident. For this analysis, we used regional designations from the U.S. Census, grouping some regions together for more logical comparisons.34 We compared cities in the follow-ing regions: Pacific, Mountain, North Central, South Central, South Atlantic and the Northeast.
Table 5. The “Solar Beginners” (Cities with Less than 5 Watts of Solar PV per Person, End of 2017)
* Due to an improvement in methodology or data source for this city, total and per capita solar PV capacity reported in this table are not directly comparable with estimates for this city in previous editions of this report. See Appendix B for details on specific cities.
¥ “N/A” is listed for cities where 2017 data is not directly comparable with 2016 data, either because 2016 data were unavailable or due to an improvement in methodology. See Appendix B for details on specific cities.
In the Pacific region, Honolulu leads with 606.4 watts of solar PV capacity installed per person. Other regional leaders include Indianapolis for the North Central region (137.3 watts/person), Las Vegas for the Mountain region (128.8 watts/person), San Antonio for the South Central region (107.9 watts/person), Burlington, Vermont, for the Northeast region (132.2 watts/person) and Washington, D.C. for the South Atlan-tic region (69.4 watts/person).

America’s Top Solar Cities Are Building a Clean Energy Future 19
Figure 3. Top Two Cities in Each Region Ranked by Solar PV Capacity Installed per Person, End of 2017
* Due to an improvement in methodology or data source for this city, total and per capita solar PV capacity reported in this table are not directly comparable with estimates for this city in previous editions of this report. See Appendix B for details on specific cities.
† Solar capacities for these cities appear to be lower than the figures published in last year’s report because a new AC to DC conversion factor was used in this year’s report. Capacity increased in both cities during 2017. See Methodology for details.
City State Region Total Solar PV Installed
(MW-DC)
Regional Total PV
Rank
Per Capita Solar PV Installed
(Watts-DC/person)
Regional Per Capita
Rank
Las Vegas NV Mountain 81.5 3 128.8 1
Phoenix* AZ Mountain 206.4 1 127.8 2
Indianapolis† IN North Central 117.4 1 137.3 1
Kansas City MO North Central 18.7 2 38.9 2
Burlington VT Northeast 5.6 7 132.2 1
Newark NJ Northeast 24.4 3 86.5 2
Honolulu HI Pacific 213.3 3 606.4 1
San Diego† CA Pacific 287.2 2 204.1 2
Washington DC South Atlantic 47.3 1 69.4 1
Jacksonville FL South Atlantic 42.6 2 48.4 2
San Antonio TX South Central 161.0 1 107.9 1
New Orleans LA South Central 39.7 2 101.4 2
Table 6. Top Two Cities in Each Region Ranked by Solar PV Capacity Installed per Person, End of 2017
20 SHINING CITIES 2018
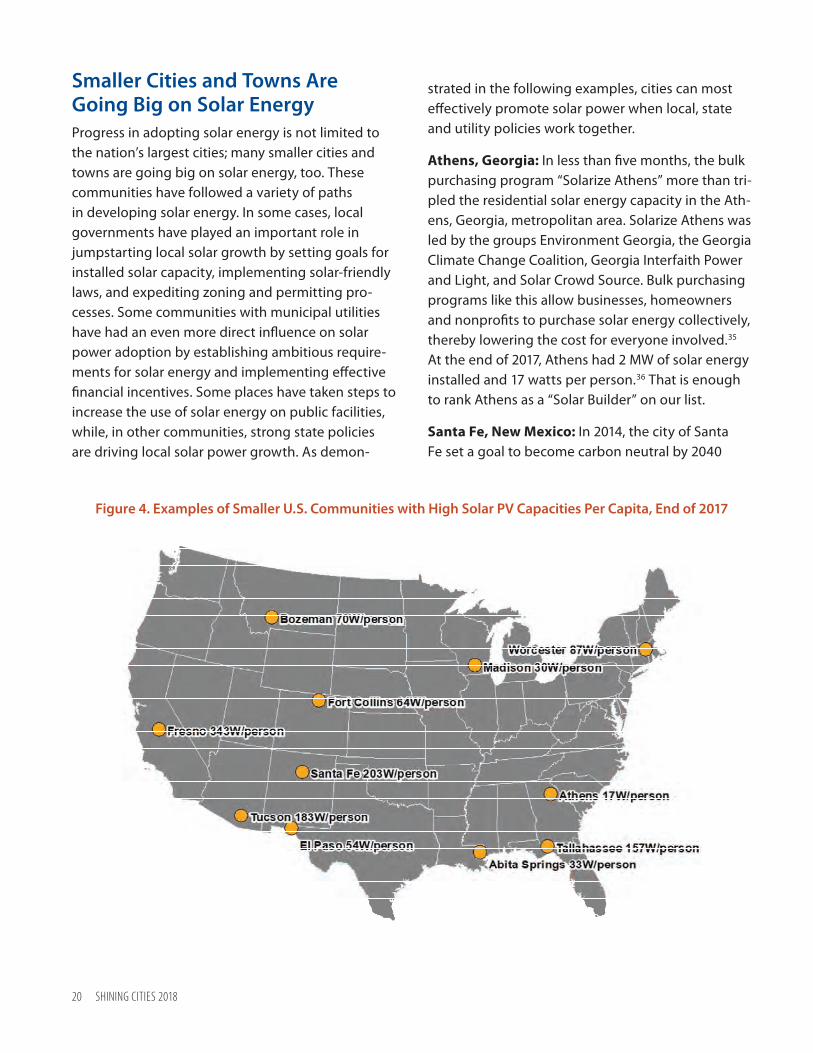
Smaller Cities and Towns Are Going Big on Solar EnergyProgress in adopting solar energy is not limited to the nation’s largest cities; many smaller cities and towns are going big on solar energy, too. These communities have followed a variety of paths in developing solar energy. In some cases, local governments have played an important role in jumpstarting local solar growth by setting goals for installed solar capacity, implementing solar-friendly laws, and expediting zoning and permitting pro-cesses. Some communities with municipal utilities have had an even more direct influence on solar power adoption by establishing ambitious require-ments for solar energy and implementing effective financial incentives. Some places have taken steps to increase the use of solar energy on public facilities, while, in other communities, strong state policies are driving local solar power growth. As demon-
strated in the following examples, cities can most effectively promote solar power when local, state and utility policies work together.
Athens, Georgia: In less than five months, the bulk purchasing program “Solarize Athens” more than tri-pled the residential solar energy capacity in the Ath-ens, Georgia, metropolitan area. Solarize Athens was led by the groups Environment Georgia, the Georgia Climate Change Coalition, Georgia Interfaith Power and Light, and Solar Crowd Source. Bulk purchasing programs like this allow businesses, homeowners and nonprofits to purchase solar energy collectively, thereby lowering the cost for everyone involved.35 At the end of 2017, Athens had 2 MW of solar energy installed and 17 watts per person.36 That is enough to rank Athens as a “Solar Builder” on our list.
Santa Fe, New Mexico: In 2014, the city of Santa Fe set a goal to become carbon neutral by 2040
Figure 4. Examples of Smaller U.S. Communities with High Solar PV Capacities Per Capita, End of 2017

America’s Top Solar Cities Are Building a Clean Energy Future 21
and the city government is leading by example in achieving this goal.37 The city has installed enough renewable energy on city facilities to provide 25 percent of its electricity needs, including over 4.6 MW of solar energy.38 The city as a whole has 17 MW of solar PV capacity installed as of the end of 2017 and 203 watts per person – that’s more solar PV per capita than any city on our list other than Honolulu and San Diego.39
Abita Springs, Louisiana: In 2017, Abita Springs be-came the first community in Louisiana to commit to providing its residents with 100 percent renewable energy by 2030.40 This commitment put this Louisi-ana town on the map as one of at least 58 communi-ties in the U.S. to commit to 100 percent renewable energy.41 The utility Cleco Power and Washinton-St. Tammany Electric Cooperative collectively estimate that 82 kilowatts of solar PV capacity are installed in Abita Springs.42 At 33 watts per person, Abita Springs has enough solar PV installed to be ranked as a “Solar Leader” in our report.43
Bozeman, Montana: In 2011, the city of Bozeman set a goal to reduce its greenhouse gas emissions to 10 percent below 2008 levels by 2025.44 As part of their plan to achieve this goal, the city has invested in its own solar energy systems and has changed its city code to remove barriers to installing rooftop solar.45 At the end of 2017, Bozeman had 2.95 MW of grid-tied solar PV capacity installed, equivalent to 70 watts per person, which is enough to rank Bozeman as a “Solar Star” on our list.46
El Paso, Texas: In 2017, El Paso was awarded the SolSmart Gold designation by the U.S. Department of Energy (DOE) Solar Energy Technologies Office (SETO) (formerly known as the SunShot Initiative), which helps states lower barriers to installing solar energy systems .47 El Paso received the award for creating an online checklist to guide residents through the process of switching to solar energy; for streamlin-ing its permitting process to the point that permit applications for small solar PV systems are now
turned around in just 24 hours; and for consolidating the number of inspections required for new solar installations.48 At the end of 2017, 37 MW of solar PV capacity were tied to El Paso Electric’s grid, which serves the city.49 That is 54 watts per person, enough to rank El Paso a “Solar Star” on our list.50
Worcester, Massachusetts: During the summer of 2017, Worcester opened the largest municipally-owned solar farm in New England on top of a former landfill.51 The city expects the project will pay for itself in six years and save the city $60 mil-lion over the 30 years it is expected to operate.52 Multiple nonprofits in Worcester have also invested in solar energy systems to save money, stabilize their costs, and put more of their funding toward their core work.53 In total, Worcester has 16 MW of solar PV capacity installed and 87 watts per person, enough to be ranked as a “Solar Star.”54
Fort Collins, Colorado: In 2015, the city of Fort Col-lins set a goal to be carbon neutral by 2050 and has taken many steps to achieve that goal.55 The city of-fers considerable rebates to residents and businesses that install solar energy systems and low-interest financing options are also available in the city.56 For these and other reasons, Fort Collins was among the first U.S. cities to earn the SolSmart Gold designa-tion for making it easier for residents to install solar energy systems.57 The city has 10.5 MW solar PV capacity installed as of the end of 2017, enough to be ranked as a “Solar Star” with 64 watts installed per resident.58
Fresno, California, has set and achieved many goals to help increase the use of solar energy, in-cluding streamlining and standardizing its permit-ting process.59 Thanks to these efforts, Fresno has 18 MW of solar PV capacity installed and 343 watts per person – that’s more than any city on our list other than Honolulu.60
Madison, Wisconsin, is one of nearly 60 communi-ties in the U.S. that has committed to getting 100

22 SHINING CITIES 2018
percent of its energy needs from renewable resourc-es.61 As part of this effort, the city government of Madison runs a program called MadiSUN that helps residents purchase solar energy collectively, lower-ing costs for participants.62 The program also pro-vides free information sessions, conducts a bidding process with installers to get the lowest price for participants, and helps participants take advantage of low-interest financing options, tax credits and rebates.63 Thanks in part to this program, Madison is a SolSmart Gold designee.64 RENEW Wisconsin, a nonprofit promoting renewable energy in the state, estimates that 7.5 MW of solar PV capacity is installed within Madison.65 This would mean that the city has 30 watts per person installed, enough to be ranked as a “Solar Leader” on our list.66
Tucson, Arizona, began promoting solar energy early on and was recognized as one of the 25 Solar America Cities by the U.S. DOE in 2008.67 Through that program, the City of Tucson created a Clean Renewable Energy Bonds program that allows residents and businesses to borrow money for solar energy installations with no interest. In lieu of inter-est payments, the lenders receive tax credits.68 Tuc-son also passed a “Solar Ready Homes” ordinance requiring new single-family homes and duplexes to include solar energy systems or to be pre-outfitted to easily incorporate solar PV or solar hot water systems later.69 Thanks to all of this work Tucson has an estimated 97 MW of solar PV capacity installed and 183 watts per person – enough to be a high-ranking “Solar Star” on our list.70
Tallahassee, Florida, has enough solar PV capacity installed (30 MW total, or 157 watts per person) to be ranked as a leading “Solar Star.”71 This is thanks in large part to the 28 MW solar farm contracted by the city. Through the Tallahassee Solar program, resi-dents and businesses were allowed to enroll to pur-chase their electricity from the solar farm at a fixed rate for the next 20 years. The 2,000 slots for this program filled up so quickly that the city is continu-
ing it for another solar farm it plans to build.72 The City of Tallahassee also offers low interest loans for a variety of energy efficiency measures and clean energy systems, including solar PV.73
Fossil Fuel Interests and Utilities Are Dimming the Promise of Solar EnergyThe rapid growth of solar energy is seen as a threat to the fossil fuel industry and is changing how utili-ties operate. In resistance to these changes, fossil fuel interests and some utilities are pushing to slow solar energy’s growth across the country through various measures, such as rolling back net metering and implementing solar-specific charges on electric bills. During 2017 alone, 19 utilities in 10 different states requested to add or increase charges for rooftop solar customers specifically.74 The follow-ing are some examples of cities that currently have thriving solar energy markets that may be hurt go-ing forward by recent attacks.
Indianapolis: In May 2017, the state of Indiana passed a law that will gradually reduce the length of time that solar customers can participate in net metering, based on when they enrolled in the program.75 The law will also decrease the net metering compensation rate for new customers starting in 2022, and will allow utilities to stop accepting new net metering customers once they make up 1.5 percent of the utility’s summer peak load.76 The City of Indianapolis has supported the growth of solar energy for many reasons, citing that it improves public and environmental health and reduces the burden of household energy costs for its residents.77 Indianapolis has been one of the top cities, both in terms of total and per capita solar PV capacity, in all five editions of this report. But, according to solar energy business owners, the state’s recent law regarding net me-tering will hurt this thriving solar energy market going forward.78
America’s Top Solar Cities Are Building a Clean Energy Future 23
Boston: In January 2018, the Massachusetts De-partment of Public Utilities approved the utility Eversource’s request to impose demand charges on its solar energy customers, including in Bos-ton.79 Demand charges can cause solar energy customers to pay almost as much on their energy bills as traditional customers, even though they de-mand far less energy from the grid over the course of a month.80 This structure limits the financial ben-efits of switching to solar energy, so the solar advo-cacy organization Vote Solar has said it will appeal the decision in court.81 The City of Boston has set goals to reduce its greenhouse gas emissions by 25 percent by 2020 and to be carbon neutral by 2050.82 One way the city is working to meet these goals is through solar energy adoption. Boston has been in the top 25, both for total and per capita solar PV capacity in every edition of this report, but this solar energy progress could be impeded by Massachusetts’ recent decision.83
Jacksonville, Florida: The Jacksonville Electric Au-thority, which provides power to Jacksonville and other areas of Florida, made some big changes to its solar energy policies in 2017 to deter grid-tied distributed solar energy. The utility has committed to install a large amount of its own solar PV capac-ity, but is also rolling back net metering, which will deter homeowners and businesses from adopting solar energy systems themselves.84
The Promise of Solar Power for U.S. Cities Is EnormousWhile the exponential growth of solar power has already delivered enormous benefits to commu-
nities across the U.S., America is still far from tap-ping its full solar potential. A National Renewable Energy Laboratory (NREL) study estimated that rooftop solar power on small buildings alone is technically capable of contributing 1,118 GW of generating capacity to the national electric grid.85 That is enough solar energy to cover the annual electricity needs of more than 135 mil-lion homes.86 Cities also have the potential to develop solar energy on larger buildings and in utility-scale installations on open land – adding significantly to the clean energy they can pro-vide to the grid.
Even the nation’s leading solar cities have im-mense untapped solar energy potential. The NREL study found that this year’s leading city, Los Angeles, could host up to 9,000 MW of solar PV ca-pacity on the rooftops of its small buildings alone. That’s over 25 times the solar power capacity the city currently has installed in total and could produce 60 percent of the city’s current electricity consumption. Newark, New Jersey has developed more of its solar PV potential than any other city on the list and its total solar PV capacity is only 16 percent of what the city could accommodate on its small building rooftops alone. Most cities on this list could install 50 times as much solar PV as they currently have installed in total on their small building rooftops. San Antonio and Chicago, for example, could each accommodate more than 6,000 MW of solar PV capacity on city rooftops and Baltimore, New York, Charlotte, Detroit, Mil-waukee, New Orleans, Philadelphia and Portland, Oregon could all install at least 2,000 MW of solar PV capacity.87
24 SHINING CITIES 2018
Policy Recommendations
U.S. cities, as centers of population growth and energy consump-tion, must lead the way in build-
ing a grid powered by clean, renewable energy. Many cities have already experienced the havoc that global warming can cause through severe weather, drought, increased heavy precipitation and intense heat waves. Increasing solar energy capacity, encouraging innovation, and expanding access to PV systems will be critical tools for creating a clean electricity system and addressing global warming.
Research shows that solar energy policies – more than the availability of sunshine – dictate which states have successful solar industries and which do not.88 The most effective policies facilitate the wide-scale adoption of small-scale solar energy systems on homes, businesses, and other institutions, while also speeding up solar energy development with large projects. Policy-makers at every level of gov-ernment – federal, state and local – have an impor-tant role to play in making solar energy in American cities a reality.
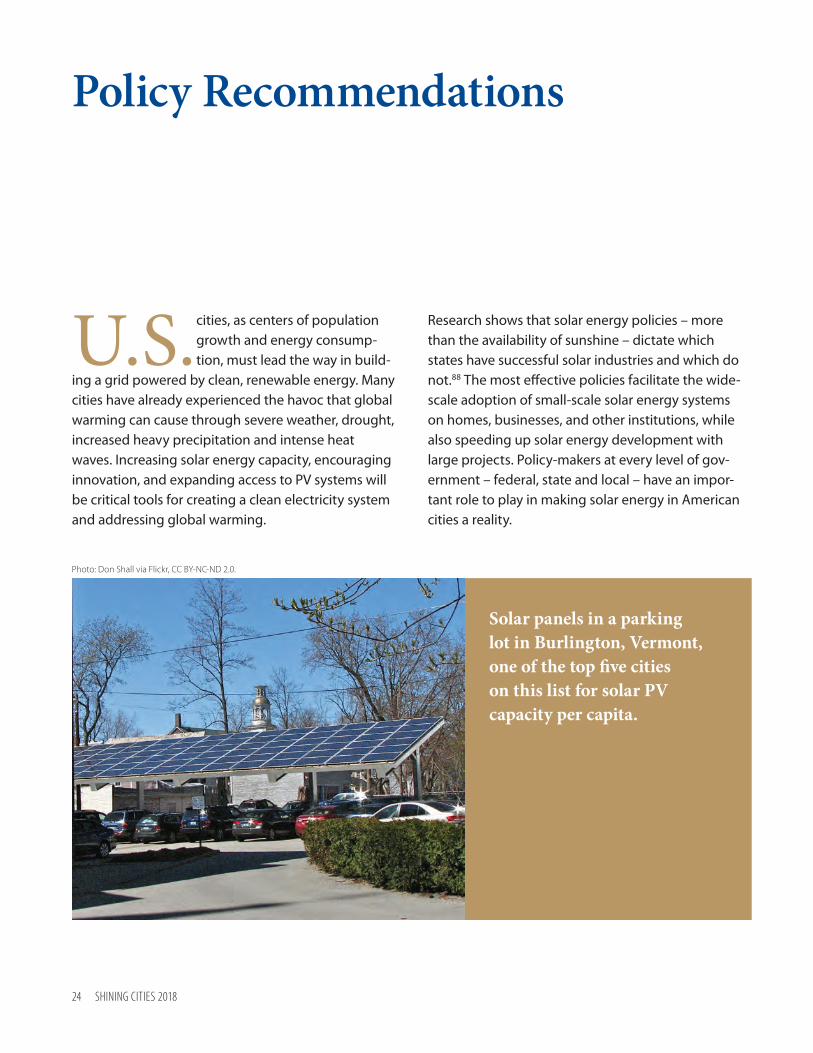
Photo: Don Shall via Flickr, CC BY-NC-ND 2.0.
Solar panels in a parking lot in Burlington, Vermont, one of the top five cities on this list for solar PV capacity per capita.
Policy Recommendations 25
Local governments should:
• Set ambitious goals for solar energy adoption – The cities that are leading in solar energy adoption are not doing so by chance. The second highest-ranked city for total installed solar PV capacity, San Diego, has set the ambitious goal of generating 100 percent of its energy from renewable sources by 2035.89 A large part of the city’s plan to achieve this goal is implementing programs that promote solar energy.90 Seven other cities on our list – St. Louis, San Francisco, Salt Lake City, Orlando, Atlanta, San Jose, and Portland, Oregon – have set goals to receive 100 percent of their energy from renew-able sources and Burlington, Vermont – one of the top-ranked cities for solar capacity per capita – is one of five communities in the U.S. that have already achieved this goal.91
• Implement solar access ordinances – These critical protections guard homeowners’ right to generate electricity from the sunlight that hits their property, regardless of the actions of neighbors or homeown-ers’ associations. Local governments should also offer clear zoning regulations that allow solar energy installations on residential and commercial rooftops by right, which will help unlock new solar markets in communities.92 The Delaware Valley Regional Planning Commission in the Philadelphia area offers a model ordinance guide that cities can apply to their own local laws.93
• Adopt policies to promote or require “solar ready” or zero net energy homes – Solar energy is most efficient and cost-effective when it is designed into new construction from the start. State and local governments have adopted policies to require new homes or commercial buildings to have solar power or to be designed so that solar energy can be easily installed.94 The City of San Francisco now requires that all new buildings be constructed with solar energy systems installed and the state of California is considering a similar proposal.95 The City of Tucson requires that new
single-family homes or duplexes either include a solar energy system or be pre-outfitted so that future solar PV and hot water systems can be easily installed.96 Other jurisdictions set goals for new zero net energy homes that employ energy efficiency and renewable energy technologies such that they produce as much energy as they consume.
• Make permitting, zoning and inspection process-es easy, quick and affordable – The “soft” costs of switching to solar energy – such as costs related to zoning and permitting – now make up about two-thirds of the total price of residential solar energy systems.97 Reducing fees, making permitting rules clear and readily available, speeding up the permitting process, and making inspections conve-nient for property owners can significantly lower the barriers for residents to switch to solar energy.98 Making sure that permitting and inspection staff are properly trained is key to achieving these goals. The U.S. DOE helps cities fund programs that work toward these goals, such as Kansas City’s work to make its solar energy permitting process available online and to update its building code to be friend-lier to solar energy.99 Vote Solar has also laid out a series of best practices that local governments can follow to ensure that their permitting process is solar-friendly.100 Cities should also strive to lower the “soft costs” associated with energy storage systems, which are often associated with solar energy systems, and make sure there aren’t any barriers in local zoning ordinances to installing them.
• Expand access to solar energy – Statewide and citywide financing programs, can make solar energy available to low-income households, nonprofits and small businesses. “Solarize” bulk purchasing programs, like “Solarize Athens,” lower the costs of solar energy so that more residents can participate.101 Community solar programs and practices like the Power Purchase Agreements (PPA) utilized in New York and elsewhere can allow apartment occupants and others who cannot install their own solar systems to purchase and benefit
26 SHINING CITIES 2018
from solar energy, too. The Property Assessed Clean Energy Program (PACE) allows local and state governments to loan money to home and business owners for energy improvements. This program includes an option to tie a loan for a solar installation to the property itself so that it is trans-ferred to the new owner if the property is sold. This program has been key for property owners who are concerned that they may move before they recoup their investment in a solar installation.
• Consider creating a municipal utility or commu-nity choice aggregation system in communities where investor-owned utilities are unwilling to cooperate to promote solar power – Municipally-owned utilities have been among the nation’s leaders in promoting solar power. While many investor-owned utilities have been willing partners with cities in promoting solar energy, cities served by less supportive utilities may want to consider forming a municipal utility in order to gain greater control over their local electric grids. The City of Minneapolis, for example, recently partnered with the two investor-owned utilities serving the city in order to meet their goal of reducing emissions by 30 percent by 2025. However, the partnership came only after there was a push for municipal-ization in Minneapolis that drove the utilities to consider a more aggressive approach to renew-able energy.102 Community choice aggregation is another option in which the city, rather than the utility, is responsible for purchasing power, but unlike a municipal utility, the private utility still maintains the transmission lines and provides customer services.103
• Install solar panels on public buildings – Local governments can promote solar energy by install-ing solar panels and signing solar PPAs for public buildings. For example, there are about 5,500 K-12 schools across the country that have installed solar energy systems with a combined capac-ity of 910 MW.104 In 2016, the city government of
Albuquerque committed to generate 25 percent of its energy needs from solar energy by 2025 and the city government of Las Vegas now gets 100 percent of its energy from renewable sources.105 Not only do solar installations on public buildings save governments money on their electricity bills, but they also serve as a public example of a smart, clean energy investment.
• Support and push for strong state policies – State policies can have a large impact on a city’s ability to expand solar energy, so it is important that cities push their state governments to enact the policies recommended below. These efforts are particularly effective when multiple communities work together.
• Implement policies that support energy storage, electric vehicle smart charging and microgrids – Technological advances are enabling solar energy to be used in new ways, including to charge electric vehicles and to be integrated with energy storage technologies and other energy resources in microgrids. Local governments should alter their ordinances to allow these technologies to be easily adopted.
State governments should:
• Set or increase renewable energy targets for utilities and adopt specific requirements for solar energy adoption – States should adopt or increase mandatory “renewable energy standards” (RES) with solar carve-outs that require a signifi-cant and growing share of that state’s electricity to come from the sun. States should also ensure that utilities implement solar power wherever it is a beneficial solution for meeting electricity needs, including as part of utilities’ long-term resource plans. Honolulu, the current leader for per capita solar PV capacity, benefits from Hawaii’s law that requires utilities to generate 100 percent of the energy they sell from renewable resources by 2045.106

Policy Recommendations 27
• Adopt and preserve strong statewide intercon-nection and net metering policies – These critical policies ensure that individuals and businesses are appropriately compensated for the electricity that they export to the grid and allow them to move seamlessly between producing their own electric-ity and using electricity from the grid. In states without strong net metering programs, carefully implemented CLEAN contracts (also known as feed-in tariffs) and value-of-solar payments can play an important role in ensuring that consumers receive a fair price for solar energy, so long as the payments fully account for the benefits of solar energy and are sufficient to spur participation in the market.
• Ensure that electric rate designs encourage solar adoption – Many utilities are now propos-ing rate designs that add or increase charges to electric bills in ways that would harm solar adoption, including adoption of demand charges and increases in fixed charges. Structures like these limit the benefits of adopting solar energy, as they cause solar customers to pay almost as much on their energy bills as traditional custom-ers, despite using far less energy from the utility over the course of a month.107 Some utilities are also beginning to assign monthly charges to solar customers specifically or to charge them a higher monthly rate than other customers.108 State governments should reject unfair proposals like this that discourage customers from switching to solar energy.
• Establish policies that expand solar energy access to all residents – According to NREL, 49 percent of Americans don’t own a home, have shading on their homes, or cannot afford a solar energy system.109 Policies such as virtual or aggre-gate net metering and community solar allow low-income households, renters and apartment dwellers to collectively own solar energy systems and share in the net metering credits they gener-
ate. Enabling PACE financing can also expand access to solar power.
• Establish public benefits charges on utility bills or other sustainable financing mechanisms for solar energy – These practices help fund solar energy for low-income households, non-profits, small businesses, and local municipalities to ensure that all categories of customers have access to the benefits of solar power.
• Enable third-party sales of electricity – Financing rooftop solar energy systems through third-party electricity sales significantly lowers the up-front cost of installing solar PV systems for commercial and residential consumers. States should allow companies that install solar panels to sell electric-ity to their customers without subjecting them to the same regulations as large utilities.
• Implement or maintain tax credits, rebates and grants for solar energy installations. Tax credits are a powerful incentive that have made solar energy a financial option for many more Americans. In 2015, six of the 10 states with the most solar capacity per capita offered tax credits for solar installations, and four offered rebates or grants.110
• Implement policies that support energy storage, electric vehicle smart charging and microgrids – State governments should design policies that facilitate the transition from a power grid reliant on large, centralized power plants to a “smart” grid where electricity is produced at thousands of locations and shared across an increasingly nimble and sophisticated infrastructure. Such state policies should support the expansion of energy storage technologies, electric vehicle smart charg-ing networks and microgrids.
Strong and thoughtful federal policies can promote solar power, make it more accessible, and lay an important foundation on which state and local policy

28 SHINING CITIES 2018
initiatives can be built. Among the key policy ap-proaches that the federal government should take are the following:
• Continue and expand financing support for solar energy – In December 2015, the federal govern-ment extended the Investment Tax Credit, a key incentive program for solar energy, with a gradual phase down after 2019.111 The federal govern-ment should maintain federal tax credits for solar energy, but add provisions as necessary to enable nonprofit organizations, housing authorities and others who are not eligible for tax credits to benefit from those incentives.
• Support research to drive solar power innova-tions – The U.S. DOE’s Solar Energy Technologies Office (SETO) (formerly the SunShot Initiative) has served as a rallying point for federal efforts to encourage the expansion of solar energy.112 SETO and similar initiatives facilitate solar energy adoption by investigating the best ways to integrate solar energy into the grid, deliver solar energy more efficiently and cost-effectively, and lower market barriers to solar energy. The federal government should also invest in research and development of energy storage to ease the integration of renewable energy into the grid, to strengthen cities’ electric grids in the face of extreme weather, and for many more reasons.
• Lead by example – The federal government consumes vast amounts of energy and manages thousands of buildings. If the federal government were to put solar installations on every possible
rooftop, it would set a strong example for what can be done to harness the limitless and pollu-tion-free energy of the sun. The U.S. military has committed to getting one-quarter of its energy from renewable sources by 2025 and had already installed more than 130 megawatts of solar energy capacity by 2013.113
• Expand access to solar energy – Federal agencies such as the Department of Housing and Urban Development and the Department of Education should work to expand access to solar energy for subsidized housing units and schools by install-ing solar power on those facilities or enabling community solar projects. Programs designed to provide fuel assistance to low-income customers, such as the Low-Income Home Energy Assistance Program, should be expanded to include solar energy.
• Defend and strengthen the requirements of the Clean Power Plan – In October 2017, the Environmental Protection Agency (EPA) submit-ted a proposal to repeal and rescind the Clean Power Plan.114 The agency will accept comments on the proposal until April 26, 2018.115 The federal government should reject this proposal and protect a strong Clean Power Plan to reduce greenhouse gas emissions by at least 30 percent below 2005 levels by 2030 and protect Americans from the worst impacts of climate change. Renew-able energy sources such as solar PV can play a dominant role in helping the U.S. achieve these pollution reductions.
Methodology 29
Methodology
There is no uniform national data source that tracks solar energy by municipality and there are only a handful of states that compile this
information in a comparable format. As a result, the data for this report come from a variety of sources – municipal and investor-owned utilities, city and state government agencies, operators of regional elec-tric grids and non-profit organizations. These data sources have varying levels of comprehensiveness, with varying levels of geographic precision, and often use different methods of quantifying solar PV capac-ity (e.g., AC versus DC capacity).
We have worked to obtain data that are as compre-hensive as possible, resolve discrepancies in various methods of estimating solar PV capacity, limit the solar facilities included to only those within the city limits of the municipalities studied, and where precise geographic information could not be obtained, to use reasonable methods to estimate the proportion of a given area’s solar energy capacity that exists within a particular city. Much of the data is provided by utili-ties, the majority of which only track grid-tied solar energy systems, so many cities lack data for non-grid-tied installations. The data are sufficiently accurate to provide an overall picture of a city’s adoption of solar power and to enable comparisons with its peers. Readers should note, however, that inconsistencies in
the data can affect individual cities’ rankings. The full list of sources of data for each city is provided in Appendix B along with the details of any data analyses performed.
For some cities, our most recent solar capacity estimates are not directly comparable to previous estimates listed in earlier editions of Shining Cities. This is because some solar energy systems installed toward the end of the year were not reported by the time we collected data. Also, for some cities, we were able to obtain more specific and reliable data this year. In a few cases, our current estimate is lower than previous estimates for the same city, due either to inconsistencies in the data reported to us by the cities, improved precision in methods for assigning solar installations to cities, or the change in the AC to DC conversion factor used this year. For an explanation of individual discrepancies, see Appendix B.
Selecting the CitiesThe cities in this report consist of the principal cities in the top 50 most populous Metropolitan Statisti-cal Areas in the United States according to the U.S. Census Bureau and the most populous cities in each state not represented on that list.116 For a complete list of cities, see Appendix A. We were unable to find
30 SHINING CITIES 2018
reliable data for Little Rock, Arkansas. Also, Sioux Valley Energy, the utility that serves Sioux Falls, South Dakota, reported that there is no solar capacity installed in Sioux Falls’ city limits connected to their grid.117
Converting from AC Watts to DC WattsJurisdictions and agencies often use different meth-ods of quantifying solar PV capacity (e.g., alternating current (AC) and direct current (DC)). Solar PV panels produce energy in DC, which is then converted to AC in order to power a home or business or enter the electric grid. Solar capacity reported in AC watts ac-counts for the loss of energy that occurs when DC is converted to AC.118
We attempted to convert all data to DC watts for the sake of accurate comparison across cities. When we could not determine whether the data were reported in AC watts or DC watts, we made the conservative estimate that the data were in DC watts. To convert the numbers from AC to DC megawatts (MW), we used the default DC to AC Ratio in NREL’s PV Watts Calculator of 1.2.119 This is a change from the conver-
sion factor used in previous reports and has caused San Diego and Indianapolis’ capacities to appear to have decreased, though both increased during 2017.
Using Data on Solar PV Installations by Zip Code to Estimate Capacity within City LimitsIn some cases, we were unable to obtain specific data on solar PV capacity, but we were able to find data on solar PV capacity installed by zip code in an urban area. Zip codes do not necessarily conform to city boundaries; in many cases, a zip code will fall partially inside and partially outside of a city’s boundaries. For these cities, we used ArcGIS software and U.S. Cen-sus Bureau cartographic boundary files for Zip Code Tabulation Areas to determine the share of the area in each zip code that fell within municipal boundaries. We then multiplied the total solar PV capacity within each zip code by that portion to approximate solar capacity installed within city limits. Details of calcu-lations for cities for which a geospatial analysis was performed are given in Appendix B.

Appendices 31
Appendix A: Solar Energy in Major U.S. Cities
Continued on page 32
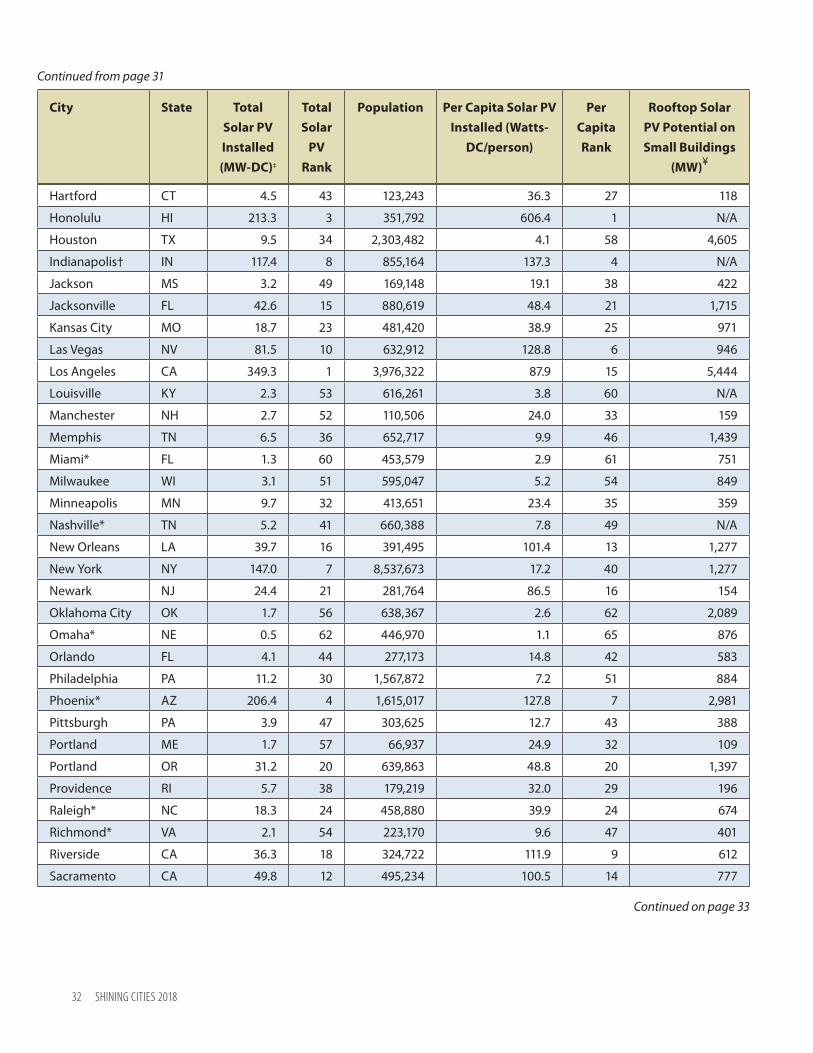
City State Total Solar PV Installed (MW-DC)‡
Total Solar
PV Rank
Population Per Capita Solar PV Installed (Watts-
DC/person)
Per Capita Rank
Rooftop Solar PV Potential on Small Buildings
(MW)¥
Albuquerque* NM 57.9 11 559,277 103.5 12 1,252
Anchorage AK 0.7 61 298,192 2.2 63 N/A
Atlanta GA 5.0 42 472,522 10.5 45 496
Austin TX 39.4 17 947,890 41.5 23 1,443
Baltimore MD 13.0 29 614,664 21.1 36 460
Billings MT 0.5 63 110,323 4.2 57 229
Birmingham AL 0.2 67 212,157 0.8 67 537
Boise ID 4.0 46 223,154 17.9 39 428
Boston MA 33.0 19 673,184 49.0 19 341
Buffalo NY 9.6 33 256,902 37.4 26 512
Burlington VT 5.6 39 42,417 132.2 5 44
Charleston WV 0.3 65 49,138 5.1 55 153
Charlotte NC 13.2 28 842,051 15.7 41 1,356
Cheyenne WY 0.3 64 64,019 4.1 59 150
Chicago IL 15.5 27 2,704,958 5.7 53 2,775
Cincinnati OH 6.0 37 298,800 20.1 37 510
Cleveland OH 3.5 48 385,809 8.9 48 734
Columbia SC 4.0 45 134,309 29.8 30 252
Columbus OH 5.3 40 860,090 6.2 52 1,905
Dallas TX 16.4 26 1,317,929 12.5 44 2,083
Denver CO 83.4 9 693,060 120.3 8 677
Des Moines IA 1.6 58 215,472 7.3 50 351
Detroit MI 1.4 59 672,795 2.1 64 1,256
Fargo ND 0.1 68 120,762 1.0 66 151
32 SHINING CITIES 2018
Continued from page 31
Hartford CT 4.5 43 123,243 36.3 27 118
Honolulu HI 213.3 3 351,792 606.4 1 N/A
Houston TX 9.5 34 2,303,482 4.1 58 4,605
Indianapolis† IN 117.4 8 855,164 137.3 4 N/A
Jackson MS 3.2 49 169,148 19.1 38 422
Jacksonville FL 42.6 15 880,619 48.4 21 1,715
Kansas City MO 18.7 23 481,420 38.9 25 971
Las Vegas NV 81.5 10 632,912 128.8 6 946
Los Angeles CA 349.3 1 3,976,322 87.9 15 5,444
Louisville KY 2.3 53 616,261 3.8 60 N/A
Manchester NH 2.7 52 110,506 24.0 33 159
Memphis TN 6.5 36 652,717 9.9 46 1,439
Miami* FL 1.3 60 453,579 2.9 61 751
Milwaukee WI 3.1 51 595,047 5.2 54 849
Minneapolis MN 9.7 32 413,651 23.4 35 359
Nashville* TN 5.2 41 660,388 7.8 49 N/A
New Orleans LA 39.7 16 391,495 101.4 13 1,277
New York NY 147.0 7 8,537,673 17.2 40 1,277
Newark NJ 24.4 21 281,764 86.5 16 154
Oklahoma City OK 1.7 56 638,367 2.6 62 2,089
Omaha* NE 0.5 62 446,970 1.1 65 876
Orlando FL 4.1 44 277,173 14.8 42 583
Philadelphia PA 11.2 30 1,567,872 7.2 51 884
Phoenix* AZ 206.4 4 1,615,017 127.8 7 2,981
Pittsburgh PA 3.9 47 303,625 12.7 43 388
Portland ME 1.7 57 66,937 24.9 32 109
Portland OR 31.2 20 639,863 48.8 20 1,397
Providence RI 5.7 38 179,219 32.0 29 196
Raleigh* NC 18.3 24 458,880 39.9 24 674
Richmond* VA 2.1 54 223,170 9.6 47 401
Riverside CA 36.3 18 324,722 111.9 9 612
Sacramento CA 49.8 12 495,234 100.5 14 777
Continued on page 33
City State Total Solar PV Installed (MW-DC)‡
Total Solar
PV Rank
Population Per Capita Solar PV Installed (Watts-
DC/person)
Per Capita Rank
Rooftop Solar PV Potential on Small Buildings
(MW)¥

Appendices 33
‡ Includes all solar PV capacity (rooftop and utility-scale solar installations) within the city limits of each city. It does not include solar power installed in the extraterritorial jurisdictions of cities, even those installed by or under contract to municipal utilities. See Methodology for an explanation of how these rankings were calculated. See Appendix B for city-specific sources of data.
¥ Reflects the maximum technical solar PV capacity that could be installed on appropriate small building rooftops in each city. These figures were calculated by the U.S. DOE: U.S. DOE, Energy Efficiency & Renewable Energy State & Local Energy Data, available at apps1.eere.energy.gov/sled/#. Data were unavailable for cities with “N/A” listed.
* Due to an improvement in methodology or data source for this city, total and per capita solar PV capacity reported in this table are not directly comparable with estimates for this city in previous editions of this report. See Appendix B for details on specific cities.
† Solar capacities for these cities appear to be lower than the figures published in last year’s report because a new AC to DC conversion factor was used in this year’s report. Capacity increased in both cities during 2017. See Methodology for details.
Salt Lake City UT 21.7 22 193,744 111.9 10 276
San Antonio TX 161.0 6 1,492,510 107.9 11 3,721
San Diego† CA 287.2 2 1,406,630 204.1 2 2,219
San Francisco CA 47.1 14 870,887 54.1 18 672
San Jose CA 195.9 5 1,025,350 191.0 3 1,639
Seattle WA 18.1 25 704,352 25.7 31 1,081
St. Louis MO 10.8 31 311,404 34.6 28 632
Tampa FL 9.0 35 377,165 23.8 34 783
Virginia Beach VA 0.2 66 452,602 0.4 68 860
Washington DC 47.3 13 681,170 69.4 17 344
Wichita KS 1.9 55 389,902 4.9 56 803
Wilmington DE 3.2 50 71,442 44.4 22 72
Continued from page 32
City State Total Solar PV Installed (MW-DC)‡
Total Solar
PV Rank
Population Per Capita Solar PV Installed (Watts-
DC/person)
Per Capita Rank
Rooftop Solar PV Potential on Small Buildings
(MW)¥
34 SHINING CITIES 2018
Albuquerque, New MexicoThe Public Service Company of New Mexico (PNM), which serves the city of Albuquerque, provided us with total solar PV capacity installed within Albu-querque as of December 31, 2017 in DC watts.120 Last year, PNM provided data for their entire service area, which extends beyond Albuquerque city limits. This year’s figure is, therefore, not directly comparable with last year’s figure.
Anchorage, AlaskaThe two electric utilities serving the city of Anchor-age, Chugach Electric and Anchorage Municipal Light and Power, provided us with summary infor-mation on the solar PV capacity installed in Anchor-age’s city limits as of the end of 2017 in AC watts, which we converted to DC watts.121
Atlanta, GeorgiaSouthface (www.southface.org) provided us with a list of solar PV installations in DeKalb and Fulton counties through December 31, 2017 with latitude and longitude coordinates for each installation.122 This information allowed us to map the installations using ArcGIS, and isolate solar capacity within the city limits of Atlanta. Southface maintains a map of “Georgia Energy Data” at www.GeorgiaEnergyData.org. Some data were provided in AC watts, which we converted to DC watts and some were provided in DC watts.
Austin, TexasAustin Energy, the municipal utility serving Austin, provided us with a spreadsheet of solar PV installa-tions in the Austin area with capacities listed in DC watts.123 For installations with zip code information, we multiplied the listed solar PV capacity figure by the proportion of that zip code located within the city of Austin. For installations without zip code infor-mation, we multiplied the listed solar capacity figure by the portion of all included zip code areas within Austin city limits. We note that our final figure does not account for solar power generated by the 30 MW Webberville solar farm, which is located in the village of Webberville.124 While the Webberville Solar Farm supplies solar energy to Austin residents through a PPA with Austin Energy, the facility is located outside of city limits and therefore did not meet criteria for inclusion in Austin city estimates.
Baltimore, MarylandData for solar PV installations in Baltimore, as of December 2017, were downloaded in a spreadsheet called “Renewable Generators Registered in GATS” through the Generation Attribute Tracking System (GATS), an online database administered by the PJM regional transmission organization.125 To focus on solar PV installations within Baltimore city limits, we filtered by primary fuel type “SUN” for “Baltimore City.” Data were assumed to be in DC watts. The GATS database was updated after we collected data for last
Appendix B: Detailed Sources and Methodology by City

Appendices 35
year’s report. The solar PV capacity in Baltimore as of December 31, 2016 was 12 MW, not 11 MW as reported in last year’s report.
Billings, MontanaNorthwestern Energy, the utility serving Billings, provided the known amount of solar PV capac-ity installed within the city limits of Billings in DC watts, as of December 31, 2017.126
Birmingham, AlabamaAlabama Power, the electric utility serving the city, provided an estimate of installed solar PV capac-ity in Birmingham through the end of 2017 in AC watts, which we converted to DC watts.127 This figure is for Birmingham zip codes, some of which extend outside of city limits, so it is possible that projects outside of city limits are included.
Boise, IdahoIdaho Power, the electric utility serving Boise, provided the total solar PV capacity of net-metered installations tied to their grid within Boise as of December 31, 2017 in DC watts.128
Boston, MassachusettsA spreadsheet of solar PV installations in Massachu-setts, the “Solar PV Systems in MA Report,” was ac-cessed via the Massachusetts Clean Energy Center online Product Tracking System.129 We filtered this list to only installations in the city of Boston. This list may be incomplete because it only includes systems that are fully registered with the Produc-tion Tracking System. The total solar PV capacity installed within Boston may, therefore, be higher than the reported figure. This spreadsheet was not fully updated when we collected data last year. Boston had 26 MW-DC solar PV capacity installed at the end of 2016, not 20 MW-DC as reported in last year’s report.
Buffalo, New YorkData on solar PV installations in the city of Buffalo were obtained from the Open NY Database titled “Solar Electric Programs Reported by NYSERDA: Be-ginning 2000.”130 We summed the capacities, which are listed in DC watts, for installations completed before December 31, 2017 in the city of Buffalo.
Burlington, VermontA list of solar PV installations in Burlington at the end of 2017 was provided by the City of Burling-ton’s Electric Department.131 Capacity figures were listed in AC watts, which we converted to DC watts.
Charleston, West VirginiaAmerican Electric Power Company, the utility serv-ing Charleston, West Virginia, provided us with the total solar PV capacity installed within Charleston through the end of 2017 in AC watts, which we converted to DC watts.132
Charlotte, North CarolinaA list of solar PV installations in North Carolina was compiled by the North Carolina Sustainable Energy Association.133 We filtered these data for installations within the city of Charlotte. Figures were listed in both AC and DC watts, so we con-verted all AC figures into DC units. These data were only complete through 2016. Duke Energy, the utility serving Charlotte, provided a figure for solar PV capacity added in Mecklenburg County, North Carolina, during 2017 in AC watts, which we converted to DC watts.134 We multiplied this by the portion of Mecklenburg County housing units that fall within Charlotte to estimate solar PV capacity added in Charlotte during 2017.135 We then added this figure to the cumulative capacity in Charlotte at the end of 2016.

36 SHINING CITIES 2018
Cheyenne, WyomingBlack Hills Corporation, the electric utility serving Cheyenne, Wyoming, provided us with total solar PV capacity installed within Cheyenne as of December 31, 2017 in AC watts, which we converted to DC watts.136
Chicago, IllinoisCommonwealth Edison, the electric utility serving the city of Chicago, provided us with the total solar PV capacity tied to their grid within Chicago as of December 31, 2017 in AC watts, which we converted to DC watts.137
Cincinnati, OhioDuke Energy, the electric utility serving Cincinnati, provided the total solar PV capacity added in Cincin-nati during 2017 in AC watts, which we converted to DC watts.138 We added this figure to the cumulative solar PV capacity installed within Cincinnati as of December 31, 2016.
Cleveland, OhioWe downloaded a spreadsheet of approved renew-able energy generating facilities in Ohio from the Public Utilities Commission of Ohio’s (PUCO) web-page.139 We filtered this spreadsheet for solar PV installations approved in 2017 in Cuyahoga County, Ohio. To determine which systems were installed in Cleveland, we looked up the corresponding Case Ref-erence numbers on PUCO’s website, which included addresses associated with the installations.140 The Cuyahoga County Department of Sustainability pro-vided us with the total solar PV capacity of residential co-op systems installed within Cleveland during 2017 in DC watts.141 These installations did not include the Cleveland systems on the PUCO list installed during 2017, so we added both figures to the cumulative capacity installed within Cleveland at the end of 2016 to estimate the total, cumulative capacity at the end of 2017. Neither data source is comprehensive, so it is possible that solar PV capacity in Cleveland at the end of 2017 is higher than the figure listed.
Columbia, South CarolinaWe estimated the amount of solar PV capacity in Columbia based on county-level data provided by the South Carolina Energy Office.142 We multiplied the total capacity of solar PV installations within Richland County by the 2010 proportion of Richland County housing units located in Columbia to estimate what percentage of this capacity fell in Columbia.143 Data were provided in AC watts, which we converted to DC watts. Data were only available through July 31, 2017, so it is likely that systems were added after that date and, thus, that solar PV capacity in Columbia was higher by December 31, 2017.
Columbus, OhioThe City of Columbus Department of Public Utilities provided solar PV capacity installed in Columbus as of December 31, 2017 in AC watts, which we convert-ed to DC watts.144
Dallas, TexasThe office of State Representative Rafael Anchia provided us with the grid-tied solar PV capacity installed within Dallas as of December 31, 2017 in AC watts, which we converted to DC watts.145 This data was supplied to them by Oncor, the transmission and distribution operator in Dallas.
Denver, ColoradoThe Denver Public Health & Environment department provided us with data on the installed solar PV capac-ity within Denver as of the end of 2016, which was compiled by Xcel Energy, the utility serving Denver.146 These data were listed in AC watts, which we con-verted to DC watts. The City and County of Denver Community Planning and Development Department provided us with a spreadsheet of all permits issued in the city relating to solar PV systems, with capacities listed in DC watts.147 We filtered these data for new solar PV installation permits completed during 2017. Not all permits contained capacity information, so we multiplied the number of permits without capacity
Appendices 37
data by the median capacity of all installations with capacity data listed. We added the estimated total ca-pacity of installations added during 2017 to the 2016 cumulative capacity to estimate the cumulative solar PV capacity installed within Denver as of December 31, 2017.
Des Moines, IowaMidAmerican Energy, the energy company that serves Des Moines, provided us with the total solar PV capacity installed within the city limits of Des Moines as of December 31, 2017 in AC watts.148 We converted this figure to DC watts.
Detroit, MichiganTotal solar PV capacity added within the city of Detroit during 2017 was provided by DTE Energy, the electric utility serving the city.149 Data were provided in AC watts, which we converted to DC watts and added to the cumulative solar PV capacity in Detroit as of December 31, 2016.
Fargo, North DakotaAn estimate of solar PV capacity in Fargo as of De-cember 31, 2017 was provided in DC watts by Cass County Electric Cooperative, which serves part of the city.150 Xcel Energy, which serves the other part of Fargo, did not have any known solar PV capacity installed in its service area to report.151
Hartford, ConnecticutThe Connecticut Public Utilities Regulatory Author-ity provided a spreadsheet listing solar facilities approved under Connecticut’s Renewable Portfolio Standard in both AC and DC MW.152 We totaled all solar PV capacity installed in the city of Hartford through December 31, 2017 and converted all AC figures to DC units.
Honolulu, HawaiiWe estimated the amount of solar PV capacity in Ho-nolulu from county-level data released by Hawaiian
Electric, the company serving the County of Honolulu (which is coterminous with the island of O’ahu).153 Within the island of O’ahu, the census designated place “Urban Honolulu CDP” is the area most com-parable with other U.S. cities. We multiplied the total capacity of solar PV installations within Honolulu County by the portion of its land area that falls within Urban Honolulu CDP to estimate the solar PV capac-ity in Honolulu. Solar PV capacity figures are reported to Hawaiian Electric in a combination of AC and DC watts and we were unable to determine which values were given in which units, so we made the conserva-tive assumption that all data were listed in DC watts.
Houston, TexasCumulative installed solar PV capacity within Hous-ton city limits as of December 31, 2017 was provided by CenterPoint Energy, the electric utility serving the city, in AC watts, which we converted to DC watts.154
Indianapolis, IndianaIndianapolis Power and Light, the electric utility serv-ing the Indianapolis provided total installed solar PV capacity within the city limits of Indianapolis as of December 31, 2017 in AC watts, which we converted to DC watts.155 The 2017 solar PV capacity published in this report is lower than the figure published in last year’s report due to the change in the AC/DC conver-sion factor used. In reality, solar PV capacity increased in Indianapolis during 2017.
Jackson, MississippiEntergy Mississippi, the electric utility serving Jack-son, provided us with the total installed solar PV capacity in Jackson, Mississippi as of December 31, 2017.156
Jacksonville, FloridaThe Jacksonville Electric Authority (JEA), the utility serving Jacksonville, provided us with a spreadsheet of net-metered solar PV installations within their service area through December 31, 2017.157 We filtered

38 SHINING CITIES 2018
these data for installations within the city of Jack-sonville. Capacities were provided in DC watts.
Kansas City, Missouri Kansas City Power & Light, the electric utility serv-ing the city provided total installed solar PV capac-ity at the end of 2017 in DC watts.158
Las Vegas, NevadaThe City of Las Vegas’ Office of Sustainability provided us with a spreadsheet of solar PV instal-lations within the city of Las Vegas through De-cember 31, 2017.159 The capacities were listed in AC watts, which we converted to DC watts. Las Vegas receives a significant amount of solar energy from its larger metro area, which is not included in the totals of this report. Our totals include the approxi-mately 8,100 systems currently installed within the city limits of Las Vegas, but NV Energy, the utility serving Las Vegas, has over 17,000 systems in-stalled in its southern service territory.160
Los Angeles, CaliforniaTotal installed solar PV capacity in Los Angeles as of December 31, 2017 was provided by the Los Angeles Department of Water and Power, the city’s municipal electric utility, in AC watts, which we converted to DC watts.161
Louisville, KentuckyLouisville Gas & Electric, the electric utility serv-ing Louisville, provided the total solar PV capacity installed in the city as of December 31, 2017 in DC watts.162
Manchester, New HampshireEversource Energy, the electric utility serving Man-chester, provided the solar PV capacity installed within the city limits of Manchester through De-cember 31, 2017 in AC watts, which we converted to DC watts.163
Memphis, TennesseeMemphis Light, Gas and Water, the city’s municipal electric utility, provided total solar PV capacity installed in Memphis as of December 31, 2017 in DC watts.164
Miami, FloridaFlorida Power & Light (FPL), the municipality serving the city, provided the total solar PV capacity installed within Miami city limits as of December 31, 2017 in DC watts.165 Last year, FPL provided data for the Miami metro area, not the city of Miami. This year’s figure is, therefore, not comparable with the figure published in last year’s report.
Milwaukee, Wisconsin An estimate of the total capacity of solar PV systems installed in Milwaukee during 2017 was provided by the City of Milwaukee’s Environmental Collabora-tion Office in DC watts.166 We added this total to the cumulative capacity at the end of 2016 published in last year’s report.
Minneapolis, Minnesota Xcel Energy, the electric utility serving the city of Minneapolis, provided us with total solar PV capacity installed within the city as of the end of 2017.167 These data were reported in DC watts.
Nashville, TennesseeThe total solar PV capacity installed within Davidson County as of December 31, 2017 was provided by Nashville Electric Service in DC watts.168 To estimate the capacity within Nashville, we multiplied this ca-pacity by the portion of Davidson County households that fall within the U.S. Census Bureau designated place of Nashville-Davidson (balance), the area most comparable with other U.S. cities.169 In previous years, Nashville Electric Service provided data for their entire service area, not for the city of Nashville. This year’s figure is, therefore, not directly comparable with figures published for Nashville in previous edi-tions of this report.

Appendices 39
New Orleans, LouisianaEntergy New Orleans, the electric utility serv-ing the city of New Orleans, provided us with an estimate of total installed solar PV capacity within New Orleans’ city limits as of December 31, 2017 in DC watts.170
New York, New YorkData on solar PV capacity installed within the city limits of New York as of December 31, 2017 were provided by Consolidated Edison, the utility serv-ing the city in AC watts, which we converted to DC watts.171
Newark, New JerseyThe solar PV installations supported by New Jersey’s Clean Energy Program (NJCEP) are made available online in the “NJCEP Solar Activity Re-port” with city and zip code information, updated through December 31, 2017.172 Within the Projects List tab, we filtered for solar installations registered in the city of Newark. Data were assumed to be in DC watts.
Oklahoma City, OklahomaThe Oklahoma City Office of Sustainability pro-vided us with the total solar PV capacity of net-me-tered solar installations in Oklahoma City, which was provided in DC watts by the Oklahoma Gas & Electric, the utility serving the city.173 To this total, we added 1 MW for an installation at a Veteran’s Hospital within city limits.174
Omaha, NebraskaOmaha Public Power District (OPPD), the electric utility serving the city of Omaha, provided us with the total capacity of solar PV systems tied to their grid within Omaha city limits at the end of 2017 in DC watts.175 In previous years, OPPD provided data for their entire service area, not for the city of Omaha. This year’s figure is, therefore, not directly comparable with previously published figures.
Orlando, FloridaTotal solar PV capacity installed within the city of Orlando, as of December 31, 2017 and serviced by the Orlando Utilities Commission (OUC) was provided by OUC in DC watts.176
Philadelphia, PennsylvaniaData were downloaded from the Solar Renewable Energy Certificates PJM-GATS registry, administered by regional electric transmission organization PJM.177 These data include installations through December 2017 and were filtered for Primary Fuel Type “SUN” and County “Philadelphia,” which is coterminous with the city of Philadelphia. Capacities were listed in DC watts.
Phoenix, ArizonaPhoenix is served by two electric utilities, Arizona Public Service (APS) and Salt River Project (SRP). Data from both service territories were provided by the City of Phoenix as of December 31, 2017 in DC watts.178
Pittsburgh, PennsylvaniaData for solar PV installations in Allegheny County, Pennsylvania, were downloaded in a spreadsheet called “Renewable Generators Registered in GATS” through the online GATS database administered by PJM.179 To focus on solar PV installations, we filtered by primary fuel type “SUN.” To estimate the amount of solar capacity installed within the city of Pittsburgh only, we looked up the number of solar installation permits within Pittsburgh completed between 1/1/13 – 12/31/17 (395 installations) on a city website.180 Based on the PJM data, 1519 installations were com-pleted in Allegheny County during the same time span. This yields that 26 percent of Allegheny County solar projects were installed in Pittsburgh during this time. Based on this, we estimated that 26 percent of the total solar PV capacity installed within Allegheny County as of December 31, 2017 was installed within Pittsburgh.
40 SHINING CITIES 2018
Portland, MaineCentral Maine Power Company, the utility company serving central and southern areas of Maine, pro-vided us with the total solar PV capacity connected to their grid in Portland through the end of 2017 in DC watts.181
Portland, OregonThe city of Portland is served in part by Portland General Electric and in part by Rocky Mountain Power, which operates as Pacific Power in the state of Oregon. Data on solar PV capacity installed by these utilities within Portland city limits through December 31, 2017 were provided by the City of Portland’s Bureau of Planning and Sustainability in DC watts.182
Providence, Rhode Island
Total solar PV capacity within Providence city limits as of December 31, 2017 was provided by the Rhode Island Office of Energy Resources.183 Figures were given in AC watts, which we converted to DC watts.
Raleigh, North CarolinaThe North Carolina Sustainable Energy Association (NCSEA) provided us with a spreadsheet listing solar PV installations in the state of North Carolina with capacities in DC watts.184 We filtered these data for installations within the city of Raleigh. These data were not complete through 2017, so the City of Raleigh provided us with a list of solar PV projects that were permitted in Raleigh during 2017.185 We conservatively assumed figures were in DC watts. Some of these permits did not include capacity information. For those, we assumed the median capacity of permits that did include capacity information. Last year the data provided by NCSEA included a 2 MW system with incorrect location in-formation that appeared to be in Raleigh but is not. The figure reported in last year’s report is, therefore, 2 MW too high.
Richmond, VirginiaThe Virginia Department of Mines, Minerals and En-ergy (DMME) provided us with a spreadsheet listing all net metered solar PV and wind energy installations in Virginia through 2016 in AC watts, which we converted to DC watts.186 We used ArcGIS to determine which installations fell within Richmond city limits. This figure is lower and not comparable with previously pub-lished figures for Richmond because in previous years, we simply filtered the spreadsheet for installations registered to addresses with a “City Name” of “Rich-mond” and/or Richmond zip codes, some of which fall partially outside of the city. Data were only complete through 2016, so Dominion Energy, the utility serv-ing Richmond, provided us with the total PV capacity added in the Richmond metro area during 2017 in AC watts, which we converted to DC watts.187 To estimate what portion of this capacity fell within the city limits of Richmond, we multiplied the figure by the portion of the Richmond metro area that falls within Richmond city limits.188 We added a non-net-metered, 60 kilowatt system at Virginia Union University to our total. This system was installed and is owned by Dominion Vir-ginia Power under their Solar Partnership program.
Riverside, CaliforniaThe total installed solar PV capacity for Riverside as of December 31, 2017 was provided in DC watts by River-side Public Utilities.189
Sacramento, CaliforniaSolar PV installation data were provided in a spread-sheet compiled by the Sacramento Municipal Utility District, the city’s publicly-owned electric utility.190 Capacity was given in AC watts, which we converted to DC watts.
Salt Lake City, UtahThe total year-end 2017 capacity of residential and non-residential net-metered solar PV installations within Salt Lake City limits was provided by the Salt Lake City Office of Sustainability in DC watts.191
Appendices 41
San Antonio, TexasData for total installed solar PV capacity within San Antonio through the end of 2017 were provided in DC watts by CPS Energy, the utility serving San Antonio.192
San Diego, CaliforniaSan Diego Gas & Electric, the electric utility serv-ing the city, provided us with a figure of total solar PV capacity installed within San Diego city limits as of December 31, 2017 in AC watts, which we converted to DC watts.193 The 2017 solar PV capac-ity published in this report is lower than the figure published in last year’s report due to the change in the AC/DC conversion factor used. In reality, solar PV capacity increased in San Diego during 2017.
San Francisco, CaliforniaPacific Gas & Electric, the electric utility serving the city, provided us with a figure of total solar PV capacity installed within San Francisco city limits as of December 31, 2017 in AC watts, which we con-verted to DC watts.194
San Jose, CaliforniaPacific Gas & Electric, the electric utility serving the city, provided us with total solar PV capacity installed within the city limits of San Jose as of De-cember 31, 2017 in AC watts, which we converted to DC watts.195
Seattle, Washington
Seattle City Light, Seattle’s municipal utility, pro-vided us with the total installed solar PV capacity within Seattle city limits as of December 31, 2017 in DC watts.196
St. Louis, MissouriAmeren Missouri, the utility serving the city of St. Louis, provided us with total solar PV capacity in St. Louis as of December 31, 2017 in DC watts.197 The
utility company totaled installed solar PV capac-ity in the following St. Louis zip codes to estimate how much solar PV fell within the city limits: 63101, 63102, 63103, 63104, 63106, 63107, 63108, 63109, 63110, 63111, 63112, 63113, 63115, 63116, 63118, 63139, 63147.
Tampa, FloridaWe were unable to secure data for Tampa through 2017, so the figure listed is only through 2016. Therefore, the current solar PV capacity in Tampa is likely higher than the figure listed. TECO Energy, the electric utility serving the city of Tampa, pro-vided us with the total installed solar PV capacity in Tampa as of December 31, 2016, in DC watts.198
Virginia Beach, VirginiaDominion Energy, the electric utility serving Vir-ginia Beach, was only able to provide capacity infor-mation for the greater Virginia Beach metropolitan area at the end of 2017. Because of this, we used the figure the utility previously reported for Virginia Beach at the end of 2015.199 This figure was reported in AC watts, which we converted to DC watts. Because this figure is not up-to-date, it is likely that solar PV capacity installed in Virginia Beach is higher than the figure listed.
Washington, D.C.Pepco, the utility serving Washington, D.C., pro-vided us with total solar PV capacity installed within the city as of the end of 2017 in AC watts, which we converted to DC watts.200
Wichita, KansasWestar Energy, the electric utility serving Wichita, provided us with solar PV capacity data for Wichita as of December 31, 2017 in AC watts, which we con-verted to DC watts.201

42 SHINING CITIES 2018
Wilmington, DelawareThe Delaware Public Service Commission maintains a List of Certified Eligible Energy Resources. We down-loaded the most updated version of this spread-sheet and filtered the list for Fuel Type “SUN” and all Generation Units Locations containing “Wilm.”202 We conservatively assumed the capacities were listed in DC watts. Not all Wilmington postal code addresses fall within the city limits of Wilmington, so we multi-plied each installation’s capacity by the portion of its zip code area that falls within Wilmington. For instal-lations without zip code information or with incorrect zip code information, we multiplied the listed solar capacity figure by the total portion of all included zip code areas that fell within Wilmington city limits.

Notes 43
1. Solar Energy Industries Association (SEIA), U.S. Solar Market Insight, 15 March 2018, archived at http://web.archive.org/web/20180315181116/seia.org/us-solar-market-insight; David Hart and Kurt Birson, Schar School of Policy and Government, George Mason University, Deployment of Solar Photovoltaic Generation Capacity in the United States, Prepared for Office of Energy Policy and Systems Analysis, U.S. Department of Energy (DOE), June 2016.
2. David Hart and Kurt Birson, Schar School of Policy and Government, George Mason University, Deployment of Solar Photovoltaic Generation Capacity in the United States, Prepared for Office of Energy Policy and Systems Analysis, U.S. DOE, June 2016.
3. Jose Gonzalez, City of Fresno, personal communica-tion, 8 February 2018; 1 July 2016 Population Estimate - 522,053 people: U.S. Census Bureau, QuickFacts: Fresno City, California, accessed 8 February 2018, archived at http://web.archive.org/web/20180208202535/census.gov/quick-facts/fact/table/fresnocitycalifornia/PST045217.
4. Meaghan Cavanaugh, Public Service Company of New Mexico, personal communication, 23 January 2018; 1 July 2016 Population Estimate - 83,875 people: U.S. Census Bureau, QuickFacts, Santa Fe City, New Mexico, accessed 7 February 2018, archived at http://web.archive.org/web/20180207182012/census.gov/quickfacts/fact/table/santafecitynewmexico,US/PST045216.
5. Tom Gillman, Solar Coordinator, Utility Services, City of Tallahassee, personal communication, 23 January 2018; 1 July 2016 Population Estimate - 190,894 people: U.S. Census Bureau, QuickFacts, Tallahassee City, Florida, accessed 16 February 2018, archived at http://web.archive.org/web/20180216210448/census.gov/quickfacts/fact/table/tallahasseecityflorida,US/PST045216.
6. NC Clean Energy, 50 States of Grid Modernization, Q4 2017 Quarterly Report & 2017 Annual Review, January 2018.
7. Hye-Jin Kim and Rachel J. Cross, Frontier Group, and Bret Fanshaw, Environment America Research & Policy Center, Blocking the Sun: Utilities and Fossil Fuel In-terests That Are Undermining American Solar Power, 2017 Edition, November 2017.
8. Pieter Gagnon et al., National Renewable Energy Laboratory (NREL), Rooftop Solar Photovoltaic Technical Potential in the United States: A Detailed Assessment, Janu-ary 2016.
9. SEIA, Solar Industry Data: Solar Industry Growing at a Record Pace, accessed 12 February 2018, archived at http://web.archive.org/web/20180212205020/seia.org/solar-industry-data.
10. SEIA, U.S. Solar Market Insight, 15 March 2018, archived at http://web.archive.org/web/20180315181116/seia.org/us-solar-market-insight.
11. U.S. DOE, Residential Renewable Energy Tax Credit, accessed 23 January 2018, archived at http://web.archive.org/web/20180123222314/energy.gov/savings/residential-renewable-energy-tax-credit.
12. SEIA, Solar Market Insight Report 2017 Q4, ac-cessed 15 March 2018, archived at http://web.archive.org/save/seia.org/research-resources/solar-market-insight-report-2017-q4; Mike Munsell, “GTM Research: 20 US States at Grid Parity for Residential Solar,” Greentech Media (GTM), 10 February 2016, archived at http://web.archive.org/web/20180316011050/greentechmedia.com/articles/read/gtm-research-20-us-states-at-grid-parity-for-residential-solar.
Notes

44 SHINING CITIES 2018
13. See note 6.
14. See note 7.
15. U.S. National Academy of Sciences and The Royal Society, Climate Change Evidence & Causes, 27 Febru-ary 2014, available at https://royalsociety.org/~/media/Royal_Society_Content/policy/projects/climate-evidence-causes/climate-change-evidence-causes.pdf.
16. Based on the median of harmonized data for all energy sources other than natural gas (for which pub-lished data were used) from NREL, LCA Harmonization, available at https://www.nrel.gov/analysis/life-cycle-assessment.html.
17. World Health Organization, Ambient (Outdoor) Air Quality and Health (fact sheet), March 2014, archived at http://web.archive.org/web/20180319222304/http://www.who.int/mediacentre/factsheets/fs313/en/.
18. U.S. EPA, The Plain English Guide to The Clean Air Act, April 2007.
19. Fabio Caiazzo et al., “Air Pollution and Early Deaths in the United States. Part I: Quantifying the Impact of Ma-jor Sectors in 2005,” Atmospheric Environment, 79: 198–208, November 2013.
20. Earth Justice, Meet the Power Plants, accessed 11 February 2016, available at earthjustice.org/features/map-meet-the-power-plants; Fabio Caiazzo et al., “Air Pollution and Early Deaths in the United States. Part I: Quantifying the Impact of Major Sectors in 2005,” Atmospheric Environ-ment, 79: 198–208, November 2013.
21. Molly A. Maupin et al., U.S. Geological Survey, Estimated Use of Water in the United States in 2010, Circular 1405, 2014, available at dx.doi.org/10.3133/cir1405.
22. Union of Concerned Scientists, The Energy-Water Collision: 10 Things You Should Know, September 2010.
23. Judee Burr and Lindsey Hallock, Frontier Group and Rob Sargent, Environment America Research & Policy Center, Star Power: The Growing Role of Solar Energy in America, November 2014, available at www.environmen-
tamerica.org/reports/ame/star-power-growing-role-solar-energy-america.
24. For relationship between heat and electricity demand: U.S. DOE, Energy Efficiency & Renewable Energy State & Local Energy Data, available at apps1.eere.energy.gov/sled/#; For “peaker” plant information: Jeff St. John, “Dueling Charts of the Day: Peaker Plants vs. Green Power,” GTM, 17 January 2014, archived at http://web.archive.org/web/20180316011155/greentechmedia.com/articles/read/dueling-charts-of-the-day-peaker-plants-vs-green-power.
25. Natural Resources Defense Council, Air Pol-lution: Smog, Smoke and Pollen (fact sheet), accessed 15 March 2018, archived at http://web.archive.org/web/20180316012124/nrdc.org/stories/air-pollution-everything-you-need-know.
26. Robert G. Sanders and Lewis Milford, Clean Energy Group, Clean Energy for Resilient Communities: Expanding Solar Generation in Baltimore’s Low-Income Neighborhoods, February 2014.
27. SEIA, Net Metering, accessed 9 February 2016, available at www.seia.org/policy/distributed-solar/net-metering.
28. Keyes, Fox and Wiedman, LLP, Interstate Renew-able Energy Council, Unlocking DG Value: A PURPA-Based Approach to Promoting DG Growth, May 2013.
29. Ibid.
30. 2016 Estimates of Metropolitan Statistical Areas Populations: U.S. Census Bureau, Data, Metropolitan and Micropolitan Statistical Areas: 2010-2016, Annual Estimates of the Resident Population: April 1, 2010 to July 1, 2016, Met-ropolitan Statistical Area; and for Puerto Rico, downloaded 5 January 2018, available at https://www.census.gov/programs-surveys/metro-micro.html.
31. Reggie Gassman, Manager of Customer Electrical Services, Sioux Valley Energy, personal communication, 3 January 2018.
Notes 45
32. See note 2.
33. Land area was calculated using the city land areas provided by the United States Census Bureau’s City QuickFacts. They define land area as the size of all areas designated as land in the Census Bureau’s national geographic database: U.S. Census Bureau, Land Area and Persons per Square Mile, accessed 3 March 2015, available at https://www.census.gov/quickfacts/fact/table/US/LND110210.
34. U.S. Census Bureau, U.S. Department of Com-merce Economics and Statistics Administration, Census Regions and Divisions of the United States, accessed 19 March 2018, archived at http://web.archive.org/web/20180319223254/www2.census.gov/geo/pdfs/maps-data/maps/reference/us_regdiv.pdf.
35. Solar CrowdSource, Solarize Athens, GA, accessed 19 March 2018, archived at http://web.archive.org/web/20180319223553/solarcrowdsource.com/campaign/athens-ga/.
36. Solar PV Capacity – see Atlanta, Georgia meth-odology, the same was used for Athens; 1 July 2016 Pop-ulation Estimate – 123,371 people: U.S. Census Bureau, QuickFacts, Athens-Clarke County (Balance), Georgia, ac-cessed 28 February 2018, archived at http://web.archive.org/web/20180228154848/census.gov/quickfacts/fact/table/athensclarkecountybalancegeorgia,US/PST045217.
37. The City of Santa Fe, Energy Efficiency and Renew-able Energy, accessed 24 January 2018, archived at http://web.archive.org/web/20180124203859/santafenm.gov/energy_efficiency_and_renewable_energy.
38. Ibid.
39. Meaghan Cavanaugh, Public Service Company of New Mexico, personal communication, 23 January 2018; 1 July 2016 Population Estimate - 83,875 people: U.S. Census Bureau, QuickFacts, Santa Fe City, New Mexico, ac-cessed 7 February 2018, archived at http://web.archive.org/web/20180207182012/census.gov/quickfacts/fact/table/santafecitynewmexico,US/PST045216.
40. Town of Abita Springs, Renewable Energy in Abita Springs, accessed 24 January 2018, available at https://www.townofabitasprings.com/readyfor100.
41. Sierra Club, 100% Commitments in Cities, Counties, & States, accessed 24 January 2018, archived at http://web.archive.org/web/20180124203749/sierraclub.org/ready-for-100/commitments.
42. John Bruhl, Washington-St. Tammany Electric Co-operative, Inc., personal communication, 8 February 2018; Scott Biggers, Cleco Power, personal communication, 19 February 2018.
43. 2016 Population Estimate – 2,529 people: U.S. Census Bureau, Abita Springs Town, Louisiana, accessed 28 February 2018, archived at https://www.census.gov/search-results.html?q=Abita+Springs+town%2C+LA&search.x=0&search.y=0&search=submit&page=1&stateGeo=none&searchtype=web.
44. Bozeman, MT, History of Climate Action in Bozeman, accessed 24 January 2018, archived at http://web.archive.org/web/20180124205219/bozeman.net/government/sustainability-climateprotect/climate.
45. City of Bozeman, Climate Action Report, 2011-2012.
46. Pamela Hanson, DSM Specialist, NorthWestern Energy, personal communication, 26 January 2018; 1 July 2016 Population Estimate - 45,250 people: U.S. Census Bureau, QuickFacts, Bozeman City, Montana, accessed 6 February 2018, archived at http://web.archive.org/web/20180207003817/census.gov/quickfacts/fact/table/bozemancitymontana/PST045216.
47. U.S. DOE SunShot Initiative, Soft Costs, accessed 19 March 2018, archived at http://web.archive.org/web/20180319234721/energy.gov/eere/solar/soft-costs.
48. Staff Report, “City of El Paso Receives ‘SolSmart Gold’ Award,” El Paso Herald-Post, 25 October 2017.
49. Angie Rodriguez, MBA, PMP, Renewable and Emergent Technologies Staff, El Paso Electric Company, personal communication, 15 March 2018.
46 SHINING CITIES 2018
50. 1 July 2016 Population Estimate - 683,080 people: U.S. Census Bureau, QuickFacts, El Paso City, Texas, ac-cessed 15 March 2018, archived at http://web.archive.org/web/20180316003400/census.gov/quickfacts/fact/table/elpasocitytexas,US/PST045216.
51. Cyrus Moulton, “Worcester Flips Switch on Solar Field at Old Landfill,” telegram.com (Worcester), 17 August 2017.
52. Ibid.
53. Ben Hellerstein, Environment Massachusetts, Central Mass. Should Move to 100% Renewable Energy, Local Leaders Say (press release), 7 September 2017.
54. Robert Kievra, Strategic Communications, National Grid, personal communication, 29 January 2018; 1 July 2016 Population Estimate - 184,508 people: U.S. Census Bureau, QuickFacts, Worcester City, Massachusetts, accessed 8 February 2018, archived at http://web.archive.org/web/20180209023721/census.gov/quickfacts/fact/table/worcestercitymassachusetts/PST045216.
55. City of Fort Collins, What is the City’s Commitment to Climate Action?, accessed 31 January 2018, archived at http://web.archive.org/web/20180131205431/fcgov.com/climateaction/.
56. City of Fort Collins, Solar Rebates, accessed 31 January 2018, archived at http://web.archive.org/web/20180131205831/fcgov.com/utilities/residential/re-newables/solar-rebates/.
57. The Solar Foundation, Fourteen Communities Desig-nated “SolSmart Gold” for Encouraging Solar Market Growth, accessed 15 March 2018, archived at http://web.archive.org/save/thesolarfoundation.org/fourteen-communities-designated-solsmart-gold-for-encouraging-solar-market-growth/.
58. Leland Keller, Energy Services Engineer, Fort Col-lins Utilities, personal communication, 22 January 2018; 1 July 2016 Population Estimate - 164,207 people: U.S. Census Bureau, QuickFacts, Fort Collins City, Colorado, ac-cessed 6 February 2018, archived at http://web.archive.
org/web/20180207011156/census.gov/quickfacts/fact/table/fortcollinscitycolorado,US/PST045216.
59. City of Fresno, Roadmap Goals and Progress, ac-cessed 31 January 2018, archived at http://web.archive.org/web/20180131212302/http://my.cleanenergyroadmap.com/partner/city-of-fresno-ca/roadmap.
60. See note 3.
61. See note 41.
62. MadiSUN Solar, Group Buy for Rooftop Solar, ac-cessed 31 January 2018, archived at http://web.archive.org/web/20180131213650/madisunsolar.com.
63. Ibid.
64. SolSmart, SolSmart Designees, accessed 23 January 2018, archived at http://web.archive.org/web/20180123155949/solsmart.org/our-communities/designee-map/.
65. Tyler Huebner, Executive Director, RENEW Wiscon-sin, personal communication, 22 February 2018.
66. 1 July 2016 Population Estimate – 252,551 people: U.S. Census Bureau, QuickFacts, Madison City, Wisconsin, accessed 28 February 2018, archived at http://web.archive.org/web/20180228164026/census.gov/quickfacts/fact/table/madisoncitywisconsin/PST045217.
67. U.S. DOE, Solar America Cities, Solar in Action, Tuc-son, Arizona, October 2011.
68. Ibid.
69. City of Tucson, Tucson City Solar Installations, ac-cessed 10 February 2016, available at www.tucsonaz.gov/gs/tucson-city-solar-installations.
70. We used ArcGIS to determine what zip codes fell within the city limits of Tucson and what portion of each of their areas fell within city limits. U.S. Census Bureau, Car-tographic Boundary Shapefiles – Places (Incorporated Places and Census Designated Places, 2016, Arizona, available for download at https://www.census.gov/geo/maps-data/data/cbf/cbf_place.html; U.S. Census Bureau, Cartographic
Notes 47
Boundary Shapefiles – ZIP Code Tabulation Areas (ZCTAs), 2016, available for download at https://www.census.gov/geo/maps-data/data/cbf/cbf_zcta.html. We used the Ari-zonaGoesSolar.org, Arizona Solar Map (available at http://arizonagoessolar.org/SolarMap.aspx) to determine the so-lar PV capacity installed within each Tucson zip code. We multiplied each zip code’s capacity by the portion of that zip code’s area that falls within Tucson and summed these figures to estimate the total solar PV capacity installed within Tucson. We conservatively assumed capacities were listed in DC watts. 2016 Population estimate – 530,706 people: U.S. Census Bureau, QuickFacts, Tucson City, Arizona, accessed 1 March 2018, archived at http://web.archive.org/web/20180301223909/census.gov/quickfacts/fact/table/tucsoncityarizona/PST045217.
71. See note 5.
72. City of Tallahassee, Tallahassee Solar Program, accessed 1 February 2018, archived at http://web.archive.org/web/20180201135029/http://www.talgov.com/you/solar.aspx.
73. U.S. DOE, City of Tallahassee Utilities – Solar Loans, accessed 1 February 2018, archived at http://web.archive.org/web/20180201135303/energy.gov/savings/city-talla-hassee-utilities-solar-loans.
74. See note 6.
75. Robert Walton, “Indiana Will Phase Out Retail Rate Net Metering,” Utility Dive, 4 May 2017, archived at http://web.archive.org/web/20180201153328/utilitydive.com/news/indiana-will-phase-out-retail-rate-net-meter-ing/441932/.
76. Sarah Bowman and Emily Hopkins, “New Indiana Solar Law Could Cripple Small Businesses and Customer Savings,” IndyStar, 5 November 2017.
77. City of Indianapolis, Solar Energy, accessed 1 February 2018, archived at http://web.archive.org/web/20180201154444/http://www.indy.gov/eGov/City/DPW/SustainIndy/Energy/Pages/Solar.aspx.
78. See note 76.
79. Frank Andorka, “Vote Solar to Challenge Massa-chusetts’ Demand Charge Ruling in Court,” pv magazine, 12 January 2018.
80. SEIA, Rate Design for a Distributed Grid, 21 July 2016.
81. See note 79.
82. City of Boston, Climate Action Plan, accessed 2 February 2018, archived at http://web.archive.org/web/20180202173707/boston.gov/departments/environ-ment/climate-action-plan.
83. SolSmart, SolSmart Designees, accessed 23 January 2018, archived at http://web.archive.org/web/20180123155949/solsmart.org/our-communities/des-ignee-map/; City of Boston, Climate Action Plan, accessed 2 February 2018, archived at http://web.archive.org/web/20180202173707/boston.gov/departments/environ-ment/climate-action-plan.
84. Will Robinson, “JEA Shakes up Solar Policies,” Jack-sonville Business Journal, 18 October 2017.
85. See note 8.
86. U.S. EPA, Greenhouse Gas Equivalency Calculator, accessed at www.epa.gov/energy/greenhouse-gas-equiv-alencies-calculator, 24 February 2016.
87. U.S. DOE, Energy Efficiency & Renewable Energy State & Local Energy Data, available at apps1.eere.energy.gov/sled/#.
88. Elizabeth Doris and Rachel Gelman, NREL, State of the States 2010: The Role of Policy in Clean Energy Market Transformation, January 2011; Jordan Schneider, Frontier Group, and Rob Sargent, Environment America Research & Policy Center, Lighting the Way: The Top Ten States that Helped Drive America’s Solar Energy Boom in 2013, August 2014.
89. Lisa Halverstadt, “California Has Aggressive Solar Goals,” Voice of San Diego, 11 May 2015.
90. Ibid.
48 SHINING CITIES 2018
91. See note 41.
92. North Carolina Sustainable Energy Association and North Carolina Solar Center, Template Solar Energy Devel-opment Ordinance for North Carolina: Executive Summary, accessed 10 July 2014, available at www.ncsc.ncsu.edu.
93. Delaware Valley Regional Planning Commission, Renewable Energy Ordinance Framework, Solar PV, ac-cessed 15 March 2018, archived at http://web.archive.org/web/20180316020419/dvrpc.org/EnergyClimate/ModelO-rdinance/Solar/pdf/2016_DVRPC_Solar_REOF_Reformat-ted_Final.pdf.
94. A “solar ready” ordinance is laid out in Appendix U of the 2015 International Residential Code, archived at http://web.archive.org/web/20180323141903/https://codes.iccsafe.org/public/document/IRC2015/appendix-u-solar-ready-provisions-detached-one-and-two-family-dwellings-multiple-single-family-dwellings-townhouses.
95. Camila Domonoske, “San Francisco Requires New Buildings to Install Solar Panels,” NPR, April 2016.
96. See note 69.
97. SolSmart, FAQs, What are Solar “Soft Costs” and How Do They Relate to SolSmart?, available at https://www.solsmart.org/faqs/.
98. Vote Solar Initiative and Interstate Renewable Energy Council, Project Permit: Best Practices in Solar Permit-ting, May 2013.
99. See note 47.
100. See note 93.
101. Linda Irvine, Alexandra Sawyer and Jennifer Grover, Northwest Sustainable Energy for Economic De-velopment, The Solarize Guidebook: A Community Guide to Collective Purchasing of Residential PV Systems, May 2012.
102. Karlee Weinmann, “At the Two-Year Mark, a Few Lessons from the Minneapolis Clean Energy Partnership – Episode 40 of Local Energy Rules Podcast,” Institute for Local Self-Reliance, 16 September 2016.
103. Benjamin Mow, “Community Choice Aggre-gation (CCA) Helping Communities Reach Renewable Energy Goals,” NREL, 19 September 2017, archived at http://web.archive.org/web/20180313144926/nrel.gov/technical-assistance/blog/posts/community-choice-ag-gregation-cca-helping-communities-reach-renewable-energy-goals.html.
104. The Solar Foundation, SEIA and Generation 180, Brighter Future: A Study on Solar in U.S. Schools, 29 Novem-ber 2017.
105. Joe Cardillo, “ABQ’s City Council Just Approved a Big Solar Energy Goal — Here’s What’s Next,” Albuquer-que Business First, 20 September 2016; Marco N. Velotta, MS, AICP, LEED Green Assoc., Office of Sustainability, Planning Department - Long Range Planning, City of Las Vegas, personal communication, 24 January 2017.
106. Governor of the State of Hawai’i, Press Release: Governor Ige Signs Bill Setting 100 Percent Renewable En-ergy Goal in Power Sector (press release), 8 June 2015.
107. SEIA, Rate Design for a Distributed Grid, 21 July 2016.
108. See note 7.
109. David Feldman et al., NREL, Shared Solar: Current Landscape, Market Potential, and the Impact of Federal Securities Regulation, April 2015; See Vote Solar’s Low Income Solar Policy Guidebook for more policy ideas at www.votesolar.org.
110. See note 7.
111. Chris Mooney, “The Budget Bill Will Unleash Wind and Solar. Here’s What That Means for the Climate,” The Washington Post, 17 December 2015.
112. More information about the U.S. DOE SETO available at https://www.energy.gov/eere/solar/solar-energy-technologies-office.
113. SEIA, Enlisting the Sun: Powering the U.S. Military with Solar Energy, 17 May 2013.
Notes 49
114. U.S. EPA, Electric Utility Generating Units: Repeal-ing the Clean Power Plan, accessed 24 January 2018, archived at http://web.archive.org/web/20180124154221/epa.gov/stationary-sources-air-pollution/electric-utility-generating-units-repealing-clean-power-plan.
115. U.S. EPA, Clean Power Plan Proposed Repeal: How to Comment, available at https://www.epa.gov/station-ary-sources-air-pollution/clean-power-plan-proposed-repeal-how-comment.
116. U.S. Census Bureau, Population Division, Annual Estimates of the Resident Population: April 1, 2010 to July 2015, May 2016.
117. See note 31.
118. Aron P. Dobros, NREL, PVWatts Version 5 Manual, 4 September 2014, available at http://pvwatts.nrel.gov/downloads/pvwattsv5.pdf.
119. NREL, PVWatts Calculator, accessed 5 Feb-ruary 2018, archived at http://web.archive.org/web/20180205174112/http://pvwatts.nrel.gov.
120. Alaric J. Babej, Technical Program Manager, Renewables, Public Service of New Mexico, personal communication, 19 February 2018.
121. Brad Jackson, Planning Engineer, Distribution Engineer, Chugach Electric Association, Inc., personal communication, 8 January 2018; Steve McElroy, Line Extension Coordinator & Service Design, Anchorage Municipal Light & Power, personal communication, 9 January 2018.
122. Shan Arora, Southface, personal communica-tion, 13 February 2018.
123. Tim Harvey, Environmental Program Coordina-tor, Solar Programs, Austin Energy, personal communica-tion, 12 January 2018.
124. Webberville Solar Farm, Project Overview, ac-cessed 24 February 2016, available at webbervillesolar.com/ProjectOverview.html.
125. PJM, Environmental Information Services, Generation Attribute Tracking System (GATS), downloaded 2 February 2018, available at https://gats.pjm-eis.com/gats2/PublicReports/RenewableGeneratorsRegistered-inGATS.
126. Pamela Hanson, Northwestern Energy, personal communication, 9 January 2018.
127. Liz Philpot, Forecasting & Resource Planning, Alabama Power, personal communication, 17 January 2018.
128. Bryan J. Wewers, Community Relations, Idaho Power, personal Communication, 8 January 2018.
129. Mass CEC’s Product Tracking System, Solar PV Systems in MA Report, downloaded 15 February 2018, available at www.masscec.com/get-clean-energy/pro-duction-tracking-system.
130. Data.NY.Gov, Solar Electric Programs Reported by NYSERDA: Beginning 2000, available at https://data.ny.gov/Energy-Environment/Solar-Electric-Programs-Reported-by-NYSERDA-Beginn/3x8r-34rs.
131. Chris Burns, Director of Energy Services, Burl-ington Electric Department, City of Burlington, personal communication, 8 January 2018.
132. Terry Hemsworth, Senior Cust. Program Service Analyst, American Electric Power Company, personal communication, 2 January 2018.
133. Jerry Carey, North Carolina Sustainable Energy Association, personal communication, 4 January 2018.
134. Randy Wheeless, APR, Duke Energy, personal communication, 19 January 2018.
135. April 1, 2010 Housing Units - 319,918 in Char-lotte/398,510 in Mecklenburg County: U.S. Census Bureau, QuickFacts, Mecklenburg County, North Carolina; Charlotte City, North Carolina, accessed 4 March 2018, ar-chived at http://web.archive.org/web/20180305002449/census.gov/quickfacts/fact/table/mecklenburgcountynorthcarolina,charlottecitynorthcarolina/PST045216.

50 SHINING CITIES 2018
136. Alan Stoinski, Program Manager Energy Ef-ficiency, Black Hills Corporation, personal communica-tion, 15 January 2018.
137. Ana Manzanares, Interconnection Services Department, ComEdison, personal communication, 1 March 2018.
138. Nancy Connelly, Lead Engineer, Duke Energy, personal communication, 17 January 2018.
139. Ohio Public Utilities Commission, Ohio’s Renewable Energy Portfolio Standard, List of Approved Cases (Excel format), downloaded 2 February 2018, available at www.puco.ohio.gov/puco/index.cfm/industry-information/industry-topics/ohioe28099s-renewable-and-advanced-energy-portfolio-standard.
140. Ohio Public Utilities Commission, Docketing Information System, Case Record, accessed 2 February 2018, available at dis.puc.state.oh.us/CaseRecord.aspx.
141. Mike Foley, Director, Department of Sustainability, Cuyahoga County, Ohio, personal com-munication, 2 March 2018.
142. Stacey Washington, Energy Specialist, South Carolina Energy Office, personal communication, 19 January 2018.
143. 1 April 2010 Housing Units - 52,471 in Co-lumbia/161,725 in Richland County: U.S. Census Bureau, QuickFacts, Richland County, South Caro-lina and Columbia City, South Carolina, accessed 17 February 2018, archived at http://web.archive.org/web/20180217200806/census.gov/quickfacts/fact/table/richlandcountysouthcarolina,columbiacitysouthcarolina/HSG010216.
144. David R. Celebrezze, GreenSpot Coordina-tor, Department of Public Utilities, City of Columbus, personal communication, 13 February 2018.
145. Abel Mulugheta, General Counsel and Leg-islative Director, Office of State Representative Rafael Anchia, personal communication, 28 February 2018.
146. Thomas Herrod and Elizabeth Babcock, Denver Public Health and Environment, City and County of Denver, personal communication, 5 February 2018.
147. Charles Bartel, P.E., Plans Review Engineer, Commu-nity Planning and Development, City and County of Denver, personal communication, 13 February 2018.
148. Adam Jacobi, Project Analyst, MidAmerican Energy Company, personal communication, 19 February 2018.
149. Terri Schroeder, Renewable Energy – Business Development, DTE Energy, personal communication, 6 February 2018.
150. Troy Knutson, Manager of Technical Services, Cass County Electric Cooperative, Prairie Sun Community Solar, personal communication, 2 January 2018.
151. Mark Nisbet, Principal Manager, Xcel Energy, per-sonal communication, 2 January 2018.
152. Donna Devino, Associate Rate Specialist, State of Connecticut Public Utilities Regulatory Authority, personal communication, 18 January 2018.
153. Hawaiian Electric Company, Quarterly Installed PV Data, 4th Quarter, 2017, downloaded 5 February 2018, avail-able at https://www.hawaiianelectric.com/clean-energy-hawaii/going-solar/quarterly-installed-solar-data.
154. Jason Hulbert, P.E., Supervising Engineer, Distribu-tion System Protection, CenterPoint Energy, personal com-munication, 12 January 2018.
155. Jon E. Haselden, Principal Engineer, Indianapolis Power & Light, personal communication, 15 January 2018.
156. Joey Lee, Manager, Communications, Entergy Mis-sissippi, personal communication, 10 January 2018.
157. Edgar Gutierrez, Manager Customer Solutions, Jacksonville Electric Authority, personal communication, 25 January 2018.
158. Drew Robinson, Sustainability Products Manager, Kansas City Power and Light, personal communication, 4 January 2018.
Notes 51
159. Marco N. Velotta, MS, AICP, LEED Green Assoc., Office of Sustainability, Planning Department Long Range Planning, City of Las Vegas, personal communication, 17 January 2018.
160. Ibid.
161. Yamen Nanne, P.E., Supervisor of Solar Programs Development, Los Angeles Department of Water and Power, personal communication, 9 March 2018.
162. Timothy Melton, Manager, Customer Commit-ment, Louisville Gas & Electric, personal communication, 9 January 2018.
163. Richard C. Labrecque, Manager, Distributed Generation, Eversource Energy, personal communication, 5 January 2018.
164. Becky Williamson, Strategic Marketing Coordina-tor, Memphis Light, Gas and Water Division, personal com-munication, 3 January 2018.
165. Devaney Iglesias, Florida Power & Light, personal communication, 8 February 2018.
166. Elizabeth Hittman, Sustainability Program Coor-dinator, City of Milwaukee Environmental Collaboration Office, personal communication, 19 February 2018.
167. Diana Naatz, Associate Product Portfolio Manag-er, Xcel Energy, personal communication, 3 January 2018.
168. Marie Anderson, Engineering Supervisor, Nash-ville Electric Service, personal communication, 14 February 2018.
169. 1 April 2010 Housing Units - 272,622 Nashville-Davidson (balance)/283,978 Davidson County: U.S. Census Bureau, QuickFacts, Davidson County, Tennessee; Nashville-Davidson (balance), Tennessee, accessed 15 February 2018, archived at http://web.archive.org/web/20180215212411/census.gov/quickfacts/fact/table/davidsoncountytennessee,nashvilledavidsonbalancetennessee/PST045217.
170. Andrew Owens, Director of Regulatory Research, Entergy Corporation, personal communication, 14 Febru-ary 2018.
171. Allan Drury, Public Affairs Manager, Con Edison, personal communication, 9 January 2018.
172. New Jersey’s Clean Energy Program, Solar Activity Reports: Full Installation Project List, 31 December 2017, downloaded 7 February 2018, available at http://www.njcleanenergy.com/renewable-energy/project-activity-reports/project-activity-reports.
173. T.O. Bowman, LEED Green Associate, Sustainability Manager, Office of Sustainability, Planning Department, City of Oklahoma City, personal communica-tion, 4 January 2018.
174. Darla Shelden, “VA Funds Solar Energy Project in Oklahoma City,” The City Sentinel, 15 November 2012.
175. Russell Baker, OPPD, personal communication, 9 February 2018.
176. Tyler McKinnon, REA, Program Support Specialist, Orlando Utilities Commission, personal communication, 17 January 2018.
177. PJM, Environmental Information Services, Gen-eration Attribute Tracking System (GATS), downloaded 5 January 2018, available at gats.pjm-eis.com/gats2/Pub-licReports/RenewableGeneratorsRegisteredinGATS.
178. Dimitrios Laloudakis, Energy Manager, City of Phoenix Office of Sustainability, personal communication, 8 February 2018.
179. PJM, Environmental Information Services, Genera-tion Attribute Tracking System (GATS), downloaded 8 Febru-ary 2018, available at gats.pjm-eis.com/gats2/PublicRep-orts/RenewableGeneratorsRegisteredinGATS.
180. City of Pittsburgh, Building Eye, filtered for keyword “solar” and “Process Complete” from 1/1/13 – 12/31/17, accessed 8 February 2018, available at https://pittsburghpa.buildingeye.com/building.
181. Richard Hevey, Senior Counsel, Central Maine Power Company, personal communication, 6 January 2018.
52 SHINING CITIES 2018
182. Kyle Diesner, Bureau of Planning and Sustainability, City of Portland, personal communica-tion, 1 March 2018.
183. Danny Musher, Chief, Program Development, Rhode Island Office of Energy Resources, personal communication, 27 February 2018.
184. Jerry Carey, North Carolina Sustainable En-ergy Association, personal communication, 4 January 2018.
185. Robert C. Hinson, Renewable Energy Coor-dinator and Project Manager, City of Raleigh Office of Sustainability, personal communication, 5 January 2018.
186. Ken Jurman, Renewable Energy Program Manager, Virginia Department of Mines, Minerals and Energy, personal communication, 26 January 2018.
187. Derek Wenger, New Technology and Renew-able Programs, Dominion Virginia Power, personal communication, 20 February 2018.
188. Land Area 2010 – City of Richmond 59.81 mi2/Richmond Metropolitan Statistical Area 62.51 mi2: U.S. Census Bureau, QuickFacts, Richmond City, Virginia, accessed 1 March 2018, archived at http://web.archive.org/web/20180301233631/census.gov/quickfacts/fact/table/richmondcityvirginia/PST045217.
189. Gerald Buydos, Solar Program Administrator, Riverside Public Utilities, personal communication, 8 January 2018.
190. Jonathon Tudor, Sacramento Municipal Util-ity District, personal communication, 7 February 2018.
191. Tyler Poulson, Sustainability Program Manager, Salt Lake City, personal communication, 1 February 2018.
192. Ricardo Luna, CPS Energy, personal commu-nication, 17 January 2018.
193. Joe Britton, Communications Manager, San Diego Gas & Electric, personal communication, 5 January 2018.
194. Ari Vanrenen, Corporate Relations, Pacific Gas & Electric, personal communication, 11 January 2018.
195. Ibid.
196. Jake Wade, Renewable Energy Program Manager, Seattle City Light, personal communication, 12 March 2018.
197. Missy Henry, Program Specialist Renewable Energy, Ameren Missouri, personal communication, 19 January 2018.
198. Shelly A. Whitworth, Renewable Energy Program Manager, Tampa Electric Company, TECO Energy, personal communication, 3 February 2017.
199. Cullen Wallace, Associate Business Process Ana-lyst, Dominion Virginia Power, personal communication, 10 February 2016.
200. Dave Wilson, Pepco, personal communication, 19 January 2018.
201. Tammie Rhea, Consumer Services Account Manag-er, Westar Energy, personal communication 8 January, 2018.
202. Delaware.gov, Delaware’s Renewable Portfolio Stan-dard and Green Power Products, accessed 15 February 2018, archived at http://web.archive.org/web/20180215233943/depsc.delaware.gov/delawares-renewable-portfolio-stan-dard-green-power-products/.