shiri sauday, b.sc. hon - connecting repositories · 4.6 stu expression in wine yeast fermenting...
TRANSCRIPT

The role of Stllp in glycerol accumulation in osmotically stressed Icewine yeast Saccharomyces cerevisiae Kl V1116
Shiri Sauday, B.Sc. Hon
Submitted to the Center for Biotechnology
May 6th 2010
Brock University St. Catharines, Ontario
© Shiri Sauday, 2010
..

ABSTRACT
The high sugar concentration in Icewine juice exerts hyperosmotic stress in the
wine yeast causing water loss and cell shrinkage. To counteract the dehydration,
yeast synthesize and accumulate glycerol as an internal osmolyte. In a laboratory
strain of S. cerevisiae, STLl encodes for Stllp, an H+ /glycerol symporter that is
glucose inactivated, but induced upon hyperosmotic stress.
STLl, was found to be a highly upregulated gene in Icewine fermenting cells
and its expression was 25-fold greater than in yeast cells fermenting diluted Icewine
juice, making it one of the most differentially expressed genes between the two
fermentation conditions. In addition, Icewine fermenting cells showed a two-fold
higher glycerol production in the wine compared to yeast fermenting diluted
Icewine juice.
We proposed that Stllp is (1) active during Icewine fermentation and is not
glucose inactivated and (2) its activity contributes to the limited cell growth
observed during Icewine fermentation as a result of the dissipation of the plasma
membrane proton gradient.
To measure the contribution ofStl1p in active glycerol transport (energy
dependent) during Icewine fermentation, we first developed an Stllp-dependent
(14C]glycerol uptake assay using a laboratory strain of S. cerevisiae (BY 4742 and
LiSTLl) that was dependent on the plasma membrane proton gradient and therefore
energy-dependent. Wine yeast K1-Vll16 was also shown to have this energy
dependent glycerol uptake induced under salt stress.
1

The expression of STLl and Stllp activity were compared between yeast cells
harvested from Icewine and diluted Icewine fermentations. Northern blot analysis
revealed that STLl was expressed in cells fermenting Icewine juice but not
expressed under the diluted juice conditions. Glycerol uptake by cells fermenting
Icewine juice was not significantly different than cells fermenting diluted Icewine
juice on day 4 and day 7 of Vidal and Riesling fermentations respectively, despite
encountering greater hyperosmotic stress. Furthermore, energy- dependent
glycerol uptake was not detected under either fermentation conditions.
Because our findings show that active glycerol uptake was not detected in
yeast cells harvested from Icewine fermentation, it is likely that Stllp was glucose
inactivated despite the hyperosmotic stress induced by the Icewine juice and
therefore did not playa role in active glycerol uptake during Icewine fermentation.
2

ACKNOWLEDGMENTS
I would like to thank my supervisor Dr. Debbie Inglis who showed me great support
during the completion of this project. Thank you for opening the doors of your lab
and allowing me to explore my research skills. I would also like to thank the
committee members of my project, Dr. Atkinson and Dr. Despres for reviewing my
thesis and for their insightful comments. Great thanks for all of my friends in IH 210
lab: Ailin, Stephanie, Fei and Eric. We shared great moments together. Special thanks
to Dr. Ailin Beh and Dr. Stephanie Martin who have been a great support for me. I
will always appreciate you. A big thanks to Matilda and Wendy who shared our lab
and were always smiling. Last thanks is to the CCOVI team.
3

Table of Contents
ABSTRACT .................................................................................................................... 1
ACKNOWLEDGMENTS .................................................................... , ............................. 3
LIST OF TABLES ..................•...............•........... , ............•.•.....•.......•.•............................... 6
LIST OF FIGURES ...................•...........................•.............•............................................ 7
ABBREVIATION LIST ..................................................................................................... 9
1 INTRODUCTION .................................................................................................... 10 1.1 INTRODUCTION TO THE PROBLEM ................................................................................................... 10 1.2 OBJECTIVES ................................................................................................................................................... 13 1.3 EXPERIMENTAL DESIGN ......................................................................................................................... 14
2 LITERATURE REVIEW ............................................................................................ 17 2.1 Icewine: Production and challenges .................................................................. : ................................ 17 2.2 Yeast response to hyperosmotic stress ............................................................................................. 20
2.2.1 The effect of changes in environment osmolarity on yeast turgor pressure and water potential ............................................................................................................................................................ 22
2.2.2 The role of glycerol as an internal osmolyte in S. cerevisiae ................................................ 24 2.3 Yeast response to hyperosmotic stress during Icewine fermentation ................................ 38
2.3.1 The effect of lcewine juice on wine yeast Kl-Vll16 glycerol production and cell growth38
2.4 Stl1p H+jglycerol symporter .................................................................................................................. 42 2.4.1 Stl1p glucose inactivation ..................................................................................................................... 45
2.5 Differences in osmotic stress response are strain, solute and time dependent .............. 47 2.6 The interest in Stl1p H+jglycerol symporter in relation to glycerol uptake during
Icewine fermentation ................................................................................................................................ 50
3 MATERIALS AND METHODS .................................................................................. 52 3.1 Yeast Strains .................................................................................................................................................. 52 3.2 Yeast media for maintaining cultures ................................................................................................ 52 3.3 Yeast media and stress conditions for STLl induction ............................................................... 52 3.4 Optimizing the conditions for glycerol uptake assay .................................................................. 53 3.5 Preparation of cells for [14C]glycerol uptake assay ...................................................................... 54 3.6 (14C]glycerol stock solutions .................................................................................................................. 54 3.7 (14C]glycerol uptake assays ..................................................................................................................... 55 3.8 Data analysis of (14C]glycerol uptake assays ................................................................................... 57 3.9 Icewine juice preparation ........................................................................................................................ 58 3.10 Perpetration of starter culture for Icewine and dilute Icewine fermentations ............. 58 3.11 Stl1p [14C]glycerol uptake assay ofK1-V1116 fermenting Icewine and diluted Icewine juice ............................................................................................................................................................. 59 3.12 STLl expression analysis using Northern blots .......................................................................... 60
3.12.1 STLl Probe amplification and purification for Northern analysis ................................. 60 3.12.2 RNA extraction ....................................................................................................................................... 61 3.12.3 Membrane preparation for northern hybridization .............................................................. 62 3.12.4 STLl probe labeling and hybridization ....................................................................................... 62
3.13 Sequencing the STLl gene in S. cerevisiae strains ...................................................................... 63
4
4 RESULTS ............................................................................................................... 65
Part 1-Development of Stllp-dependent glycerol uptake assay ................................. 65 4.1 Stl1p induction in wine and laboratory yeast strains ................................................................. 66 4.2 [14C]glycerol uptake at 4 mM glycerol... ............................................................................................. 68 4.3 [14C]glycerol uptake 10 mM glycerol.. ................................................................................................ 73 4.4 (14C]glycerol uptake at 65 mM glycerol.. ........................................................................................... 77 4.5 [14C]glycerol uptake by wine yeast strain at 4 and 65 mM glycerol ..................................... 82
Part 2- Stllp activity in Icewine and dilute Icewine juice fermentations ..................... 87 4.6 STU expression in wine yeast fermenting Riesling and Vidal Icewine juices ................. 87 4.7 Stl1p activity in wine yeast during Icewine fermentation ........................................................ 89
Part 3-STLl sequencing .............................................................................................. 93 4.8 STLl sequence alignment ........................................................................................................................ 93
5 DISCUSS·ION ......................................................................................................... 95
Part 1-Development of Stllp-dependent glycerol uptake assay ................................. 95 5.1 STU is induced in response to saline stress in wine and laboratory yeast strains but
not in control strain ASTLl ..................................................................................................................... 95 5.2 The effect of glycerol concentration on Stl1p-dependent active [14C]glycerol uptake
measurements .............................................................................................................................................. 96
Part 2- Stllp activity in cells fermenting Icewine and dilute Icewine juice ................ 102 5.3 STLl was expressed in yeast during Icewine fermentation ................................................... l02 5.4 Hyperosmotically stressed cells fermenting Icewine did not present active glycerol
uptake ............................................................................................................................................................. 104
Part 3-STLl sequencing ............................................................................................ 108 5.5 Glucose inactivation and Stl1p activity in wine and laboratory yeast strains ................ 108
6 FUTURE DIRECTIONS .......................................................................................... 110 6.1 Optimization ofStl1p induction .......................................................................................................... 110 6.2 Further investigation of wine yeast Stllp glucose inactivation ............................................ ll1
7 CONCLUSiONS .................................................................................................... 114
8 LITERATURE CITED ............................................................................................. 115
9 APPENDIX .......................................................................................................... 125 9.1 STLl sequence alignment ...................................................................................................................... 125 9.2 Optimization of glycerol uptake assay ............................................................................................. 127
5

LIST OF TABLES
Table 3.9.1: The initial concentrations of sugars and glycerol in Riesling and Vidal Icewine juice ..................................................................................................... 57
Table 3.12.1: The Primer sequences used for STU sequencing .................................... 63 Table 4.7.1: Glycerol concentration in Riesling and Vidal fermentations media .... 89 Table 4.8.2: Codon variations in STU sequence of laboratory
and wine yeast strains ............................................................................................. 93
6

LIST OF FIGURES
Figure 1.3.1: Experimental design of [14C]glycerol uptake assays ................................ 15 Figure 2.2.1: Yeast response to hyperosmotic stress in S. cerevisiae ........................... 20 Figure 2.2.1.1: A schematic representation of the effect of changes in
environmental osmolarity on yeast size and turgor pressure .......... 22 Figure 2.2.2.2.1: Glycerol synthesis and ethanol production pathway during
alcoholic fermentation ................................................................................... 27 Figure 2.2.2.3.1: The HOG pathway in S. cerevisiae controls glycerol
homeostasis ........................................................................................................ 28 Figure 2.2.2.5.1: Glycerol transport mechanisms in S. cerevisiae .................................. 33 Figure 2.6.1: A schematic representation of thesis hypothesis ...................................... 50 Figure 3.7.1: Temperature-regulated chamber ..................................................................... 55 Figure 3.7.2: A schematic representation of [14C]-glycerol uptake assay .................. 55 Figure 4.1.1: Northern analysis of STLl expression ............................................................ 65 Figure 4.2.1: (14C]glycerol uptake at 4 mM glycerol by BY4742 and .t1STL1 ............. 67 Figure 4.2.2: [14C]glycerol uptake and initial glycerol uptake rate at 4 mM
glycerol in BY4742 and .t1STLl ........................................................................... 68 Figure 4.2.3: [14C]glycerol accumulation in BY4742 and .t1STLl at 4 mM
glycerol with and without the incubation with CCCP .............................. 69 Figure 4.2.4: The % decrease from control in [14C]glycerol accumulation
at 4 mM glycerol following the incubation with CCCP ............................. 70 Figure 4.3.1: [14C]glycerol uptake and initial glycerol uptake rate at 10 mM
glycerol in BY 4742 and .t1STLl ........................................................................... 72 Figure 4.3.2: [14C]glycerol accumulation in BY4742 and .t1STLl cells
at 10 mM glycerol with and withoutthe incubation with CCCP .......... 73 Figure 4.3.3: The % decrease from control in [14C]glycerol accumulation
at 10 mM glycerol following the incubation with CCCP ......................... 74 Figure 4.3.4: Induction of [14C]glycerol initial uptake in BY4742
following saline stress ........................................................................................... 75 Figure 4.4.1: [14C]glycerol uptake and initial glycerol uptake rate
at 65 mM glycerol in BY 4742 and .t1STLl ...................................................... 77 Figure 4.4.2: [14C]glycerol accumulation in BY4742 and .t1STLl
at 65 mM glycerol with and without the incubation with CCCP ......... 78 Figure 4.4.4: Comparison of [14C]glycerol initial uptake of BY4742 and .t1STLl
at 65 mM and 4 mM in cells harvested from the same growth batch ............................................................................................................... 79
Figure 4.4.5: The effect of glycerol concentration on glycerol initial uptake rate in BY4742 and .t1STLl cells .......................................................... 81
Figure 4.5.1: [14C]glycerol accumulation in wine yeast (Kl-Vll16) and laboratory strain (BY4742) with and without the incubation with CCCP at 65 mM
. and 4 mM glycerol. ................................................................................................... 82
7

Figure 4.5.2: Comparison of [14C]glycerol initial uptake rate in K1-Vll16 and strain BY4742 at 4 mM and 65 mM glycerol... .................................... 83
Figure 4.5.3: Comparison of glycerol uptake in stressed and non-stressed K1-Vll16 ..................................................................................................................... 84
Figure 4.6.1: Expression of STLl in K1-Vll16 during Riesling/Vidal Icewine and dilute Icewine fermentations using Northern analysis ......................................................................................................................... 87
Figure 4.7.1: [14C]glycerol uptake at 4 mM glycerol in K1-Vll16 fermenting Icewine and diluted Icewine juices .......................................... 89
Figure 4.7.2: [14C]glycerol uptake in K1-Vll16 during Riesling and Vidallcewine and diluted Icewine fermentations in the presence and absence of CCCP ............................................................................................................................... 90
Figure 4.8.1: The predicted 3D structure of Stllp ................................................................ 92 Figure 9.1.1: Sequence alignment ofK1-Vll16 and BY4742 STLl gene ....... 124-125 Figure 9.2.1: The effect of washing solution on the level of radio labeled
glycerol retained on the filter .......................................................................... 127
8

ABBREVIATION LIST
STL 1- Sugar transport like
HOG MAPK- high osmolarity glycerol mitogen activated protein kinase
CCCP- carbonylcyanide-m-chlorophenylhydrazone
GPD- glyceraldehyde-3-phosphate dehydrogenase
GPP- glycerol-3-phosphat phosphatase
S. cerevisiae- Saccharomyces cerevisiae
SGD- Saccharomyces cerevisiae database
9

1 INTRODUCTION
1.1 INTRODUCTION TO THE PROBLEM
Production of glycerol by yeast in response to hyperosmotic stress is an
important adaptation mechanism during Icewine fermentation. Glycerol is an
important osmolyte that allows yeast cells to adapt to the hyperosmotic stress.
Glycerol concentration has been reported to be 4.85 giL in Riesling Icewine juice
and 1.9 giL in Vidallcewine juice (Pigeau and Inglis, 2005; Pigeau and Inglis, 2007;
Pigeua, et al., 2007; Martin, 2008). In addition, wine yeast cells synthesize glycerol
during Icewine fermentation to act as an internal osmolyte. Surprisingly, the cells
release the glycerol early in the fermentation (Pigeau and Inglis, 2005; Martin,
2008).
Interestingly, STL1 encoding Stllp, an active glycerol transporter (energy
dependent), was found to be a highly upregulated gene in Icewine fermenting cells
and its expression was 25-fold greater than in yeast cells fermenting diluted Icewine
juice, making it one of the most differentially expressed genes between the two
fermentation conditions (Martin, 2008).
STLl encodes for the sugar-like transport protein (Stl1p) and was recently
characterized as an H+ Iglycerol membrane symporter in laboratory yeast strains
(Ferreria et al., 2005). It is one of the most highly induced genes during the response
to hyperosmotic stress (Rep et al., 2000; Posas and Saito, 1997; Yale and Bohnert,
2001). Under non-hyperosmotic stress conditions Stllp is glucose inactivated,
10

however this inactivation is overcome upon exposure to saline hyperosmotic stress
(Ferreria et al., 2005).
Because STLl expression is a dynamic process that depends on the yeast strain
and the environmental conditions the cells are exposed to, it is possible that Stl1p is
induced in Icewine fermenting cells to actively uptake glycerol from the fermenting
media. If this is true, increased active transport of glycerol into the yeast cell by
Stl1p may lead to the dissipation of the proton gradient across the plasma
membrane and thus eliminate the driving force of nutrient entry into the cell
(reviewed by Boulton et al., 1998; Horak, 1986). These events may direct ATP
utilization within the yeast cell toward reestablishment of the proton gradient,
rather than cell growth. Thus, the limited cell growth observed during Icewine
fermentation may be a result of reduced nutrient uptake due to high induction of
Stl1p.
Analysis of Icewine juices from the Niagara Region of Ontario, Canada shows an
average assimilable nitrogen content of 555 mg NjL for 297 Vidal Icewine juices and
461 mg NjL for 24 Riesling Icewine juices (Ziraldo and Kaiser, 2007). Even though a
sufficient amount of nitrogen is present in the Icewine juice, still nitrogen uptake is
reduced during Icewine fermentation (Martin, 2008)
In previous studies, wine yeast only used 112 mg jL of nitrogen during Icewine
fermentation, even though 389 mgjL was available in the initial juice (Pigeau and
Inglis, 2005). Despite the fact that nitrogen and sugar concentrations are not
limiting in Icewine fermentation, cells were only reported to double 2-3 times
11

during fermentation as opposed to 7-8 times during a table wine fermentation
(Kontkanen et al., 2004).
The role that Stl1p plays in wine yeast during Icewine fermentation is still
unknown. Thus, the goal of this research is to characterize the function of Stl1 p in
hyperosmotically stressed Icewine fermenting cells and determine if Stl1 P actively
uptakes glycerol into the cell during Icewine fermentation.
IfStllp indeed contributes to the limited cell growth observed during Icewine
fermentation, the induction of this protein in wine yeast may not be desirable given
that it slows down the fermentation process. However, active Stl1p may provide an
advantage to wine yeast fermenting Icewine if it is found to be active during
fermentation and assisting the yeast to overcome the stress of the environment.
Since there is no commercial yeast strain that has been specifically selected for
Icewine fermentation in the wine industry, the expression of STU could be used as a
biomarker for strain screening purposes depending on its contribution to wine
yeast during Icewine fermentation. The findings of this project may assist in this
selection process for strains that may potentially ferment Icewine juice with
improved efficiency.
12

1.2 OBJECTIVES
The goal of this project was to investigate if Stl1p H+ jglycerol symporter
actively transports glycerol into wine yeast cells in response to hyperosmotic stress
induced by Icewine fermentation. To pursue this goal, first it was necessary to
design a glycerol uptake assay that measures energy dependent glycerol transport
specific for Stl1 p, often referred to in this thesis as "Stl1 p-dependent active glycerol
uptake" and second, to use this assay to compare Stl1p-dependent glycerol uptake in
wine yeast fermenting Icewine and diluted Icewine juice.
13

1.3 EXPERIMENTAL DESIGN
To investigate if Stll P H + / glycerol symporter actively uptakes glycerol into wine
yeast during Icewine fermentation, it was necessary to design a glycerol uptake
assay specific for Stllp. For this purpose, two laboratory S. cerevisiae strains were
used: the laboratory mutant strain L1STLl where the STLl gene is not expressed and
its parental strain BY 4742. Both strains were subjected to salt stress and STLl
induction was confirmed in the parent strain using Northern blot analysis. Under
the same induction conditions, cells of both parent and mutant yeast strains were
harvested to measure glycerol uptake in response to hyperosmotic stress. To follow
the level of glycerol uptake and accumulation in the cell, radiolabeled glycerol
([14C]glycerol) was used.
In order to determine the optimal ([14C]glycerol assay conditions that show
specificity for Stllp activity, [14C]glycerol uptake was compared under three
different glycerol concentrations (4, 10 and 65 mM). The low glycerol
concentrations are published concentratios under which Stllp activity was
measured (Ferreria, et al., 2005). The 65 mM glycerol concentration was chosen to
determine if Stllp activity is measurable using the glycerol assay in the presence of
higher glycerol concentration. Martin (2008) showed that at day 4 of Icewine
fermentation, the glycerol concentration in the Icewine juice reached 65 mM, and at
the same timepoint, STLl expression peaked.
To determine if glycerol uptake depends on the presence of Stllp, glycerol initial
uptake rates were compared between L1STLl and its parent strain. To investigate if
14

Stl1p glycerol uptake is energy dependent, glycerol uptake was measured in the
presence of carbonylcyanide-m-chlorophenylhydrazone (CCCP). This uncharged
lipid-soluble weak acid is able to cross the yeast membrane and release a proton in
the cytosol, thus leading to the dissipation of the proton gradient across the plasma
membrane (reviewed in Spencer and Spencer, 1997; Figure 1.3.1 C). If glycerol
transport by the Stl1p depends on the proton motive force, then in the presence of
CCCP, Stllp-dependent glycerol uptake should be inhibited in the parent strain. To
investigate if wine yeast displays Stllp-dependent glycerol uptake, cells were
subjected to the same saline stress conditions in order to induce Stllp and
harvested to measure glycerol accumulation in the presence and absence of CCCP
(Figure 1.3.1 A).
Once the optimal assay conditions were determined to show Stll p-dependent
active glycerol uptake in wine yeast, Stl1p activity was compared between yeast
cells fermenting Icewine and cells fermenting diluted Icewine juice in the presence
and absence of the protonophore (Figure 1.3.1 B).
15

Laboratory strain ,1STL 1 knockout Wine strain (BY4742) (control) (K1N1116)
i Grow cells and Induce Stl1 p by
Salt stress
! Harvest cells
~ Measure 14C-glycerol
accumulation +/ -CCCp
I
"l)'''"=C:' (eep
Icewine 37 °Brix
I
dilute Ice wine 18.5 °Br ix
Harvest wine yeast (Kl-V1116) at the peak of STLl differential expression between the
two fermentation conditions
Measure 14C-glycerol accumulation + /- CCCP
Figure 1.3.1: Experimental design of [14C]glycerol uptake assays. (A) [14C]glycerol uptake by BY4742, L!STLl knockout and wine yeast K1-Vll16 was measured upon exposure to saline stress in the presence and absence of CCCP. (B) Stllp-dependent [14C]glycerol uptake was measured in wine yeast during Icewine and dilute Icewine fermentations in the presence and absence of CCCP.(C) CCCP as indicator for glycerol active uptake. CCCP dissipates the yeast plasma membrane proton gradient by crossing the membrane and releasing a proton in the cytosol, thus inhibiting active glycerol uptake via Stllp.
16

2 LITERATURE REVIEW
2.1 Icewine: Production and challenges
Icewine (Eiswein in German) is a sweet dessert wine made from the juice of
naturally frozen grapes. In Canada, the wine is named Icewine only if the grapes are
picked and immediately pressed at temperatures lower than -8°C (VQA, 1999).
During the pressing, water ice crystals are trapped in the grape and therefore not
transferred to the extracted juice. The substantial reduction in water content results
in juice that is highly concentrated with soluble solids such as sugars, acids and
nitrogenous compounds. The concentration of soluble solids in Canadian Icewine
juice commonly falls within the range of 38°Brix to 42°Brix with a minimum allowed
limit of 35°Brix (VQA, 1999).
Canada is the world's largest producer of Icewine, with the majority of
production originating from the Niagara Peninsula region in the southern portion of
the province of Ontario. In 2007, it was reported that Ontario produced
approximately 1.25 million liters, an increase of 123% in volume produced from the
previous year (VQA, 2008).
Icewine producers face different challenges throughout the production process
of Icewine. Annual yields of Icewine may vary each year depending on the weather
conditions, a factor which eventually determines the time point of grape harvest.
The longer the grapes are left on the vine, the more they are susceptible to damage
by bird feeding on the crop and continued dehydration (VQA, 2008). More
challenges are introduced during the fermentation process. Because of the
17

concentrated nature of the Icewine juice, fermentations are often sluggish, taking
months to reach the desired ethanol levels (10% v/v) and usually end with high
levels of residual sugar with an average of 214.7 g L-l (Nurgel et aI., 2004).
The complex composition of the Icewine must is the major contributor to the
lengthy fermentation and the lower levels of ethanol. Wine yeast fermenting Icewine
juice experiences hyperosmotic stress induced by the high concentration of soluble
solids found in the must. Once inoculated to the hypertonic environment of the
Icewine must, yeast cells loose water content due to osmosis and therefore shrink.
Within minutes yeast cells activate an initial stress response to counteract the
dehydration effect of the hyperosmotic stress. Within hours, yeast cells activate the
high osmolarity glycerol (HOG) pathway, a signaling pathway that eventually leads
to the upregulation of glycerol synthesis genes (Erasmus et aI., 2003). Following the
initial response, cells turn on an adaptive response that requires changes in sugar
metabolism. Cells fermenting Icewine experience reduced growth rates and
therefore only double 2-3 times throughout the course of the fermentation in
comparison to table wine where cells double at least 7 -8 times (Pigeau and Inglis,
2005). Studies show that during Icewine fermentation, a higher portion of sugar
energy is directed towards the production of glycerol and acetic acid rather than cell
growth (Pigeau and Inglis, 2005; Pigeau et aI., 2007; Martin, 2008).
The production and accumulation of glycerol during the yeast response to
hyperosmotic stress is an important adaptation mechanism against the dehydration
effect of Icewine juice on wine yeast. The accumulation of glycerol is necessary for
18

the continuation of biochemical processes in the cell, even when water content in
the cell is low, and thereby allowing the cell to survive (Reviewed by Hohmann et al.,
2007). A survey of 50 Canadian Icewines reported that the average concentration of
glycerol in Canadian Icewines is 12.4 g L-l, where as reported values of table wine
ranges from 1.4 to 10.6 g L-l (Nurgel et al., 2004).
Commercial yeast strains were selectively chosen to ferment wine due to their
tolerance to different stresses introduced during fermentation. It is possible that
some of these strains are better suited to ferment Icewine juice with greater
efficiency, however no biomarkers have been identified to select for these strains. It
is essential to investigate the role of Stl1 p in commercial wine yeast strains during
Icewine fermentation to better understand yeast adaptation mechanisms and
perhaps use STLl as a biomarker to select for strains that can manage Icewine
fermentation processes more efficiently and consequently increase Icewine quality.
19

2.2 Yeast response to hyperosmotic stress
An increase in environmental osmolarity evokes different response mechanisms
in S. cerev;s;ae to adapt to the hyperosmotic stress. This response has been
extensively studied in laboratory yeast strains of S. cerev;s;ae (reviewed by
Hohmann, 2009). Due to excessive water efflux, yeast lose membrane turgor
pressure and therefore the cells shrink. As a result, cells will increase glycerol
retention due to its role as an internal osmolyte. Within minutes, the glycerol
diffusion rate decreases in yeast cells and they shut down the glycerol efflux channel
Fps1p to prevent glycerol loss from the cell (Figure 2.2.1.a and .b, Tamas et al.,
1999).
At the same time yeast activates the high osmolarity glycerol (HOG) pathway
(Figure 2.2.1.c) (reviewed by Hohmann, 2009). This MAP kinase mediated signaling
transduction pathway controls the expression of many stress responsive genes,
among them GPD1, to control glycerol synthesis and STL1, to control glycerol uptake
(Figure 2.2.1.c, Ferreria et al., 2005). After approximately 15 minutes, cells initiate
energy dependent uptake of extracellular glycerol through the induction of Stl1p, an
H+jglycerol symporter (Ferreri a et al., 2005). All of these events lead to the cells
adaptation and survival.
20

CIa Reduction In glycerol passive diffusion rate
E·.OH OH OH
e Shut down of glycerol channel
[Ht-] high
lHyperosmotic stress
Glycerol production and accumulation
Figure 2.2.1: Yeast response to hyperosmotic stress in S. cerevisiae. Hyperosmotic stress results in ( a) the reduction of glycerol passive diffusion out of the cell, (b) shut down ofFps1p glycerol channel and (c) activation of the high osmolarity glycerol (HOG) pathway to upregulate the expression of glycerol synthesis genes. At the same time, yeast induces active glycerol uptake ofStllp (d). (Hohmann, 2009).
21

2.2.1 The effect of changes in environment osmolarity on yeast turgor pressure and
water potential
The semipermeable membrane of yeast allows water molecules to freely flow
into or out of the cell in order to reach water equilibrium with the environment
(reviewed by Blomberg and Adler, 1992). Besides passive diffusion, water can also
cross the membrane via facilitated diffusion mediated by different aquaporins
(Pettersson et al., 2005) which act as regulators for water movement across the
plasma membrane. This water flow phenomena, named osmosis, directly depends
on the solute concentrations the cells are exposed to. Since active cellular processes
occur in aqueous solutions, changes in the cellular osmotic balance must trigger
changes in cell physiology. These changes are critical for cell survival and growth in
the new environmental conditions.
Water will always flow across the semi-permeable membrane towards the
higher solute concentration, where the potential of water is lower (Hohmann and
Mager, 2003). At hypertonic conditions (low water potential in environment), where
the concentration of solutes in the surrounding media is higher than the
intracellular concentration, water flows out of the yeast cell to reach
thermodynamic water equilibrium. As a result, the cells dehydrate and shrink
(Figure 2.2.1.1). Conversely, at hypotonic conditions (high water potential in
environment), when the concentration of solutes in the outside environment is
lower than the intracellular concentration, water flows into the cell and therefore
the cells swell.
22
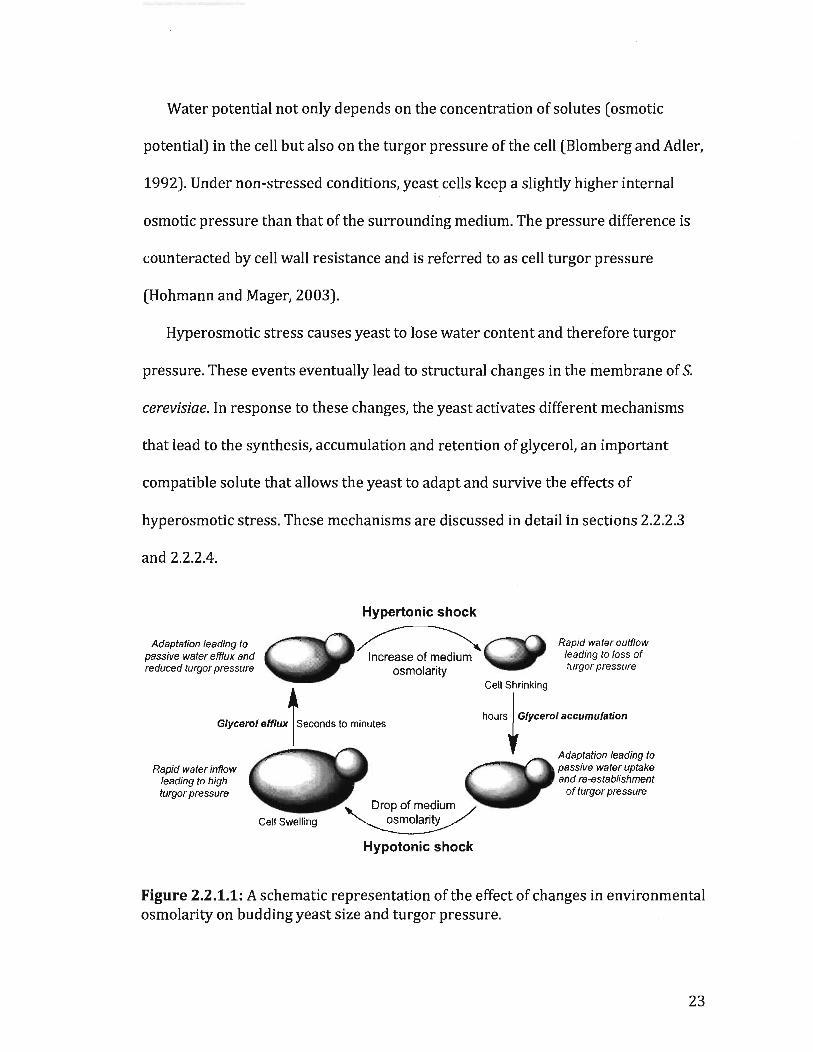
Water potential not only depends on the concentration of solutes (osmotic
potential) in the cell but also on the turgor pressure of the cell (Blomberg and Adler,
1992). Under non-stressed conditions, yeast cells keep a slightly higher internal
osmotic pressure than that of the surrounding medium. The pressure difference is
counteracted by cell wall resistance and is referred to as cell turgor pressure
(Hohmann and Mager, 2003).
Hyperosmotic stress causes yeast to lose water content and therefore turgor
pressure. These events eventually lead to structural changes in the membrane of S.
cerevisiae. In response to these changes, the yeast activates different mechanisms
that lead to the synthesis, accumulation and retention of glycerol, an important
compatible solute that allows the yeast to adapt and survive the effects of
hyperosmotic stress. These mechanisms are discussed in detail in sections 2.2.2.3
and 2.2.2.4.
Adaptation leading to passive water efflux and reduced turgor pressure
Rapid water inflow leading to high turgor pressure
Cell Swelling
Hypertonic shock
~ Increase of medium
osmolarity
'-. Dr~~,,7!,:;~i,um ./ ~ Hypotonic shock
Cell Shrinking
Rapid water outflow leading to loss of turgor pressure
hows i OJy..,-", "cumu"".
Adaptation leading to passive water uptake and re-establishment
of turgor pressure
Figure 2.2.1.1: A schematic representation ofthe effect of changes in environmental osmolarity on budding yeast size and turgor pressure.
23

2.2.2 The role of glycerol as an internal osmolyte in s. cerevisiae
In order to understand yeast response to hyperosmoticstress, it is necessary to
investigate the role glycerol plays as an internal osmolyte when yeast is exposed to
hypertonic environments such as Icewine juice.
A general mechanism by which microorganisms counteract the dehydration
effects of hyperosmotic stress is through the uptake and production of one or more
specific solutes called osmolytes or osmoprotectants (Yancey et al., 1982).
Osmolytes are accumulated in microorganisms in order to control and balance
water levels in the cell. These solutes are also referred to as compatible solutes
because cells can accumulate osmolytes in high concentration without giving rise to
appreciable enzyme inhibition or inactivation, thus allowing cellular processes to
continue even though water availability is low in the cell. Osmolytes can be
accumulated in a microorganism either through synthesis or through uptake from
the surrounding medium (Pollard and Wyn Jones, 1979).
Glycerol is the main compatible solute of fungi among other polyhydroxy
alcohols such as arabinitol and erythritol (Blomberg and Adler, 1992) and the sole
compatible solute in S. cerevisiae during response to hyperosmotic stress (Hohmann
and Mager, 2003).
What is the role that glycerol plays during response to hyperosmotic stress?
Glycerol is accumulated in the yeast cell to increase the internal osmolarity and
induce water flow back into the shrunken cells. The increase in water content
24

reestablishes turgor pressure, which is required for normal membrane function
(Hohmann and Mager, 2003; Blomberg and Adler, 1992).
2.2.2.1 Glycerol synthesis during hyperosmotic stress
Blomberg and Adler (1989) demonstrated that S. cerevisiae cells accumulated
higher levels of glycerol with increased saline osmolarity (up to 1.4 M NaCI) and that
increase was directly related to enhanced activity of the enzyme responsible for
glycerol synthesis under hyperosmotic stress, Gpd1p. In addition, GPD1.1 mutants
were shown to produce less than half of the glycerol produced by their wild type
counterparts, and were shown to be sensitive to high saline osmolarity (Ansell et al.,
1997; Albertyn et al., 1994). This evidence suggests that glycerol is an important
metabolite for yeast to survive hypertonic environments, and therefore yeast induce
specific glycerol synthesis genes to increase intracellular levels of glycerol to
survive.
25

2.2.2.2 Glycerol synthesis pathways under different environmental conditions
In S. cerevisiae, glycerol is synthesized from the glycolytic intermediate
dihydroxyacetone phosphate in two steps (Figure 2.2.2.2.1): Reduction of
dihydroxyacetone phosphate (DHAP) to glycerol-3-phosphate (G3P) by glycerol-3-
phosphate dehydrogenase and dephosphorylation of glycerol-3-phosphate to yield
glycerol by glycerol-3-phosphate phosphatase. The reduction of DHAP to glycerol-3-
phosphate is the rate-limiting step in osmotically induced glycerol formation
(Remize, et al. 2003). It is catalyzed by two NAD-dependent enzymes encoded by
two isogenes: GPDl and GPD2. The hydrolysis of glycerol-3-phosphate to glycerol is
catalyzed by two phosphatases encoded by two isogenes: GPPl and GPP2 (Larsson
et al., 1993; Albertyn et al., 1994; Ansell et al., 1997; Pahlman et al., 2001). Each of
these dehydrogenases and phosphatases are differentially expressed depending on
the metabolic state of the cell.
The expression of GPDl is stimulated under hyperosmotic stress and considered
to be the major isoform responsible for glycerol production during hyperosmotic
stress (Larsson et al., 1993; Albertyn et al., 1994). Contrary to GPD1, the expression
of GPD2 is not upregulated in response to hyperosmotic stress and its mRNA levels
actually drops (Ansell et al., 1997). GPD2 is expressed in yeast for the purpose of
maintaining intracellular redox balance for the NAD+ jNADH co-factor system. Even
though only GPDl was found to be the isoform responsible for glycerol production
in response to hyperosmotic stress, mutations in either GPDl or GPD2 results in
26
sensitivity to hyperosmotic stress, indicating that both isoforms are required for the
yeast to survive a hypertonic environment.
The second reaction of glycerol synthesis involves two phosphatases encoded by
GPPl and GPP2. The expression of both isoforms is induced under hyperosmotic
stress conditions, however, GPP2 is expressed to a greater degree than GPPl
(Pahlman et al., 2001; Hirayama et al., 1995; Norbeck et al., 1996).
It appears that the Gpd1p-Gpp2p pair forms the major pathway for glycerol
production in S. cerevisiae during response to hyperosmotic stress under aerobic
conditions.
When yeast is grown under anaerobic and hyperosmotic stress conditions, the
production of glycerol is required not only to increase intracellular glycerol
concentration but also to maintain redox balance. The reoxidization of nicotinamide
adenine dinucleotide (NADH) during glycerol synthesis allows the cell to balance the
redox potential and inorganic phosphate recycling (Ansell et al., 1997). Unlike
aerobic conditions where Gpd1p-Gpp2p forms the major pathway for glycerol
production in S. cerevisiae (Pahlman et al., 2001), under anaerobic conditions
glycerol production is prominently controlled by the Gpd2p-Gpp1p isoforms (Ansell
et al., 1997).
During wine fermentation, wine yeast is exposed to osmotic stress under
anaerobic conditions. In contrast to previous findings where anaerobic conditions
induced the expression of GPD2, in wine fermentation GPDl plays a major role in
glycerol formation, specifically during the first few hours of exposure to high sugar
27

concentration (Remize et al., 2003). Similarly, Pigeau and Inglis (2005) showed that
the elevated production of glycerol in Icewine fermenting yeast cells corresponds to
an increase in expression of GPDl but not GPD2. Therefore, during Icewine
fermentation glycerol production appears to be mainly controlled by Gpdlp-Gpp2p
isoforms (Martin, 2008; Pigeau and Inglis, 2007).
Glucose
Dihydrox);;K~etone-P
NAD' -{ GPDI.l
Glvcerol-3-P • 1
I ..• rl)/1l ') p .....-1 v .~ ( + Glycerol
EOH OH OH
• : t A
Glyei:taldehydc-3-P
• NADH ·-1
t t • pYr1JVi!!C l Acetaldehyde l Ethanol
CO: Ni\O"
Figure 2.2.2.2.1: Glycerol synthesis and ethanol production pathway during alcoholic fermentation. Glucose is oxidized through glycolysis into two intermediates, glycerol-3-phosphate that is further oxidized to ethanol and dihydroxyacetone phosphate that is eventually converted to glycerol. Glycerol synthesis from DHAP is a two-step process that involves two pair of enzymes: Glycerol-3-phosphate dehydrogenase 1 or 2 (encoded by GPDl or GPD2) and glycerol-3-phosphatase 1 or 2 (encoded by GPPl or GPP2). (Nevoigt and Stahl,
28

2.2.2.3 Activation of the HOG pathway for glycerol synthesis
The high osmolarity glycerol (HOG) mitogen activated protein kinase (MAPK)
pathway mediates the immediate transcriptional response to hyperosmotic stress in
S. cerevisiae to allow cell adaptation and survival under high osmolarity conditions.
The architecture of the MAPK signaling pathway is conserved in eukaryotes and is
based on the sequential phosphorylation of three levels of mitogen activated protein
kinases: a MAP kinase kinase kinase (MAPKKK), a MAP kinase kinase (MAPKK) and
a MAP kinase (MAPK) (Figure 2.2.2.3.1, reviewed in Hohmann, 2007).
Sholp
H+/Glycerol
Hotlp
HYPEROSMOTIC STRESS
'Hog J GPDlIGPPl
Hotlp --~.~
Slnlp
Cytosol
Figure 2.2.2.3.1: The HOG pathway in S. cerevisiae controls glycerol homeostasis. The activation of Hotl p transcription factor initiates the transcription of osmotolerant related gene, GPD1/GPP2 that control glycerol synthesis and STL1 that is responsible for glycerol uptake. (Hohmann, 2009).
29

The MAPKs are important signal transduction protein kinases that are involved
in many facets of cellular regulation such as cell proliferation, cell differentiation,
cell movement and cell death.
The presence of the appropriate stimuli will induce the phosphorylation of the
MAP KKK which phosphorylates the MAPKK on its serine and threonine residues
and that in turn phosphorylates the threonine/serine and tyrosine residues of the
terminal kinase, the MAPK. The latter is translocated into the nucleus to activate
gene expression in response to the stimuli. The Hog1p is the ultimate MAPK of the
Hog1 pathway in S. cerevisiae (reviewed by Hohmann, 2007).
The activation of the HOG pathway in response to hyperosmotic stress is
initiated by special proteins embedded in the plasma membrane of S. cerevisiae that
are able to sense changes in osmolarity. Also known as osmosensors, Sho1p and
Sln1p control the two parallel branches of the HOG pathway that converge on the
MAPKK Pbs2p. The activation of the Sho1 branch is not fully understood, but it has
been suggested that changes in the cell shape and/or cell surface conditions may be
sensed by Sho1p, which in turn activates the MAPK signaling cascade. Sho1p can
interact with downstream signaling elements in the HOG pathway through its C
terminal SH3 domain that can bind and activate Pbs2p (Raitt et al., 2000; Maeda et
al.,1995).
In response to osmotic stress, Sho1p forms a transient protein complex at the
yeast plasma membrane. Sho1p recruits Pbs2p to the cell surface together with its
regulators Ste20p, Ste50p and Cdc42p proteins (Maeda et al., 1995; Posas and Saito
30

1997; Raitt et al., 2000; Reiser et al., 2000). Ste20p activates the first kinase in line,
Stellp (MAPKKK), and the latter phosphorylates Pbs2p MAPK. Pbs2p
phosphorylates the ultimate MAPK Hoglp on both Thr174 and Tyr176 residues.
Once in the nucleus, Hoglp is recruited to target promoters by Hotlp, Skolp, and
Msn2pjMsn4p transcription factors (Alepuz et al., 2004; de Nadal et al., 2004;
Pokholok et al., 2006).
The Slnl branch negatively controls the HOG pathway. The SLNl gene encodes
an enzyme with histidine kinase and aspartate phosphotransferase activities and
functions as a plasma membrane sensor. Under non-stressed conditions, Slnlp
actively transfers a phosphate to Ypdlp, which in turn phosphorylates Ssklp (Darin
and Gorman, 1999). This phosphorylation inactivates Ssklp and therefore inhibits
the downstream activation of elements in the HOG pathway. Under hyperosmotic
stress, Ssklp is dephosphorylated and therefore can activate the Ssk22p and Ssk2p.
These MAPKKK's phosphorylates Pbs2 MAPK to induce the osmoadaptation
response through the HOG pathway. The MAPK signaling pathway is also negatively
controlled by additional phosphotransferases such as Ptp and Ptc which can
deactivate Hoglp (Young et al., 2002).
The expression of STL1 in response to hyperosmotic stress was shown to be
strictly Hoglp-dependent (Westfall et al., 2008). STLl encodes for a membrane
H+ jglycerol symporter that actively uptakes glycerol into the cell during response to
hyperosmotic stress (Ferreria et al., 2005). Alepuz et al. (2001) showed that when S.
cerevisiae cells were exposed to 0.4 M NaCI, Hoglp kinase was delocalized to the
31

nucleus to interact with Hotl p transcription factor on the promoter region of the
STLl gene (Figure 2.2.2.3.1). This association occurs only under hyperosmotic stress
conditions (Alepuz et al., 2001). Hotlp is a nuclear protein that seems to control a
set of less than 10 genes, including the glycerol synthesis gene, GPDl and glycerol
transport gene, STL1. Deletion of HOTl completely abolishes the induction of STL1
and therefore STLl expression directly depends on the activation of the HOG
pathway and Hoglp MAPK (Rep et al., 2000; Westfall et al., 2008).
2.2.2.4 Glycerol uptake during hyperosmotic stress
In addition to glycerol synthesis, yeast can also modulate the transport of
glycerol across the membrane to increase the level of intracellular glycerol.
Evidence shows that hyperosmotic stress results in a decreased rate of glycerol
passive diffusion across the plasma membrane, to increase glycerol retention. In
addition, yeast can control glycerol transport proteins located in the yeast plasma
membrane, Fpslp and Stllp (Figure 2.2.2.2.5.1) to regulate glycerol efflux and
uptake. Fpslp is an aquaporin channel that transports glycerol into or out of the cell
via facilitated diffusion. This channel is mainly responsible for the regulation of
glycerol efflux and is controlled by gating mechanism and also directly involves the
regulation of the N loop which keeps Fpslp in a conformation that allows it to
readily restrict glycerol transport in the presence and absence of osmotic stress. In
the absence of this domain, transmembrane glycerol flux is too high to allow
32

efficient accumulation of glycerol by the cell, hence sensitivity to high hyperosmotic
stress (Tamas et al., 1999; Tamas et al.,2003).
Under hyperosmotic stress conditions, this channel is shut down within minutes
to prevent glycerol leakage (Tamas et al., 1999). In parallel to that, the Stl1 p
H+jglycerol symporter is induced, to uptake glycerol in an energy dependent
manner, by using the proton gradient across the plasma membrane (Ferreria et al.,
2005).
2.2.2.5 Controlling the activity of glycerol transport proteins Fpslp and Stllp
Glycerol can enter S. cerevisiae cells using three known mechanisms: passive
diffusion, facilitated diffusion via the Fps1p channel and active transport by Stl1p
H+jglycerol symporter (Figure 2.2.2.2.5.1). Each of these mechanisms is used
depending on the environmental conditions the cells are exposed to.
Glycerol is an uncharged small molecule with a liposoluble nature that can
readily cross the plasma membrane of S. cerevisiae via passive diffusion (Blomberg
and Adler,1992). Glycerol transport studies with hyperosmotically stressed yeast
show a reduction in glycerol simple diffusion rate out of the cell (Sutherland et al.,
1997). It appears that yeast limits glycerol permeability across the plasma
membrane to facilitate glycerol retention.
In addition to passive diffusion, S. cerevisiae uses two membrane transporters to
control the glycerol transmembrane flux. These are the Fps1p aquaglyceroporin
channel and Stl1p H+ jglycerol symporter. Both of these proteins play an important
33

role in glycerol accumulation and retention in yeast during response to
hyperosmotic stress.
Passive diffusion rate is reduced during hyperosmotic stress
HO""("OH
OH ~4 I. Passive dllfussion ~
Fpsl p closes in response to hyperosmotic stress and opens
during hypo-osmotic stress
HO~OH .... ~~==~~ OH .---2. Facilitated diffussion
St11p is induced in response to hyperosmotic stress
HO-y"OH OH ~
H+'J
H+ H+
3. Active glycerol uptake
HO~OH OH
Figure 2.2.2.5.1: Glycerol transport mechanisms in S. cerevisiae. Glycerol can enter yeast cell by either (1) passive diffusion, (2) facilitated diffusion mediated by the Fps1p channel and (3) through Stllp H+jglycerol symporter. (Hohmann, 2009).
34

Fps1p aquaglyceroporin, encoded by FPSl gene, belongs to the Major Intrinsic
Protein (MIP) family, which comprise water channels and glycerol facilitators. It is
required for glycerol uptake by facilitated diffusion but the major role of Fps1 p is
controlling glycerol efflux in response to hypo-osmotic shock (Luyten et al., 1995;
Tamas et al., 1999). During hypo-osmotic shock, water flows into the yeast cell and
causes the cells to swell. Within seconds, cells open the Fps1p channel to allow the
release of glycerol. The majority of glycerol accumulated in laboratory strains of S.
cerevisiae during hyperosmotic shock (80%) is later exported from the cell through
Fps1p (Tamas et al., 1999). Conversely, during hyperosmotic stress, the Fps1p
channel closes within seconds, to allow glycerol retention (Tamas et al., 2003). The
cytosolic N-terminal extension of Fps1p is required for channel closure and its
deletion results in unregulated glycerol transport activity (Karlgren et al., 2005).
Studies have shown that strains lacking FPSl can retain more glycerol than their
wild-type counterparts upon salt induced osmotic stress (Luyten et al., 1995; Tamas
et al., 2003). Unlike STL1, the expression of FPSl is not in-fluenced by hyperosmotic
stress and therefore is not controlled by the HOG signaling pathway. It is still not
clear how FPSl transcription is regulated.
STLl is one of the most upregulated genes in S. cerevisiae during response to
hyperosmotic stress (Rep et al., 2000; Yale and Bohnert 2001; Posas et al., 2000;
Erasmus et al., 2003; Melamed et al., 2008; Martin, 2008). The product ofthis gene,
Stl1p, is an H+ jglycerol symporter that actively uptakes glycerol into the cell during
hyperosmotic stress in laboratory strains of S. cerevisiae (Ferreria et al., 2005). In
35

the glycerol-proton symport uptake system, one glycerol molecule is co-transported
against its concentration gradient with one proton into the cell. Therefore, glycerol
active uptake in yeast will occur only if the proton gradient across the plasma
membrane is established.
This symport activity is inhibited in the presence of chemical protonophores
such as carbonylcyanide-m-chlorophenylhydrazone (CCCP) and carbonyl cyanide p
(trifluoromethoxy) phenylhydrazone (FCCP). These are uncharged lipid-soluble
weak acids that can cross the yeast membrane, release a proton in the cytosol, and
thereby dissipate the proton gradient across the plasma membrane (van Zyl et aI.,
1990; Lages and Lucas, 1995)
Induction of Stllp depends on the transcriptional state of STL1. Expression of
STLl is not only induced by hyperosmotic stress in a Hotl p-dependent manner, but
also by non-fermentative carbon sources such as glycerol, ethanol and acetate. Yeast
can alternate between metabolic pathways in order to utilize these carbon sources
when glucose is exhausted in the cell. This phenomenon is also referred to as diauxic
shift. Under non-stressed aerobic conditions, glucose represses the expression of
STLl at the RNA level along with 36 other genes related to ethanol utilization. When
glucose is exhausted, cells enter diauxic shift and STLl is de-repressed and induced
in a Cat8p transcription factor dependent manner (Haurie et aI., 2001).
Ferreira et al (2005) were the first to show that Stl1p H+ jglycerol symporter was
induced in response to hyperosmotic stress in the aerobically glucose-grown
laboratory strain of S. cerevisiae. These cells were first grown to the exponential
36

phase and right after incubated with 0.7 M NaCl. Stllp induction was detected 30
min after incubation with the salt and peaked after 1.5 hours. Interestingly, Stl1p
induction time-line was directly correlated with the level of glycerol uptake rate and
accumulation, which also peaked after 1.5 hours of salt stress.
Unlike the rapid induction of Stl1p observed in exponentially grown cells in
response to abrupt hyperosmotic stress conditions, cells grown aerobically on
glucose and at the same time continually subjected to salt stress (0.7 M NaCI) did
not present a rapid induction of Stll p. Stll P was detected only after 25.5 hours, at
the time point of diauxic shift where glucose was almost exhausted (Ferreria et al.,
2005). Therefore, It appears that induction of Stllp by hyperosmotic stress is
detected only when the stress is introduced abruptly after the cells have reached the
exponential growth phase (Ferreria et al., 2005).
Interestingly, cells subjected to hyperosmotic stress induced by the high sugar
concentration during Icewine fermentation upregulated STLl between days 2 to 4 of
the fermentation, when glucose levels remain high, yet it is not known what is the
role of the product ofthis gene, Stl1p, in glycerol transport under these anaerobic
hyperosmotic stress conditions (Martin, 2008).
37

2.3 Yeast response to hyperosmotic stress during Icewine fermentation
2.3.1 The effect of Icewine juice on wine yeast K1-V1116 glycerol production and cell growth
Wine yeast fermenting Icewine juice is subjected to hyperosmotic stress due to
the high concentration of soluble solids found in the Icewine must. Similar to
previous studies with laboratory S. cerevisiae strains subjected to salt and sugar
stress, Icewine fermenting yeast experiences rapid dehydration, lose membrane
turgor pressure and shrink within a few hours upon inoculation. These events
eventually lead to slow fermentations and thereby limited cell growth (Kontkanen
et al., 2004; Pigeau and Inglis, 2005).
Pigeau and Inglis (2005) studied the response of the wine yeast Kl-Vll16 to
hyperosmotic stress during Vidal Icewine fermentations. To that end, two
fermentation conditions were set up, one with Icewine juice containing 400Brix of
soluble solids and the other with diluted Icewine juice containing 200Brix of soluble
solids, comparable to juice used for table wine production. Yeast fermenting Icewine
juice experienced greater hyperosmotic stress compared to cells fermenting diluted
Icewine juice. This stress resulted in an extended lag phase and a reduced growth
rate. Through the course of Icewine fermentation cells doubled only 2-3 times and
exhibited a delay in budding. After 48 hours from the time point of inoculation, the
cell number in Icewine fermentation media was 3-times lower than the cell number
measured in diluted Icewine juice which had already reached mid-exponential
growth phase (Pigeau and Inglis, 2005; Martin, 2008). Cells fermenting Icewine juice
38

accumulated only half of the biomass accumulated by diluted Icewine fermenting
cells, even though both cells consumed approximately the same amount of glucose.
It appears that during Icewine fermentation, yeast cells are required to re-direct
sugar energy towards adaptation to high osmotic stress, rather than utilizing this
energy for cell division and growth.
One of the first lines of defense against the dehydration effect of hyperosmotic
stress in S. cerevisiae is the accumulation and production of glycerol. Yeast cells
subjected to hyperosmotic stress can produce glycerol by re-directing a portion of
glucose energy from ethanol production to glycerol synthesis. This is also observed
during Icewine fermentation. For the same amount of sugar consumed, Icewine cells
produce approximately twice as much glycerol compared to cells in the diluted juice
fermentations (Pigeau and Inglis, 2005, Pigeau and Inglis, 2007). Interestingly, both
Icewine and diluted Icewine fermenting cells release the glycerol to the
fermentation media at the onset of fermentation, as observed through monitoring
the increase in glycerol concentration in the fermentation media. These results are
in contrast to laboratory yeast strain under hyperosmotic stress conditions (Tamas
et al., 1999).
39

2.3.1.1 Transcriptional response of wine yeast K1-V1116 to hyperosmotic stress and the STU gene
When wine yeast is inoculated into Icewine juice, it remains in lag phase for
more than 48 hours. This extended lag phase is required for the yeast to change its
metabolism in order to adapt to the hyperosmotic stress through modulating the
transcriptional state of osmotolerant related genes. Microarrayanalysis of the
transcriptional response of wine yeast K1-Vll16, during Icewine and diluted
Icewine fermentation revealed that 2-5% of the genes in the yeast genome were
differentially expressed between days 2-5 of the fermentation (Martin, 2008). These
include genes that are induced during osmotic stress, among them glycerol
synthesis and transport related genes.
Surprisingly, FPS1, the gene that encodes for glycerol export protein channel,
Fps1p, was not differentially expressed at day 2 of either Icewine or diluted Icewine
fermentations and its mRNA transcript could not be detected following that day
(Martin, 2008). These results are in contrast with Tamas et al. (1999) who showed
that FPSl is continually expressed in either saline stressed or non-stressed
laboratory yeast cells, thus, its expression is not hyperosmotically stress dependent.
It is also interesting to note that when FPSl was not expressed, cells were better
able to respond to hyperosmotic stress. The same study also found that even though
FPSl expression is not controlled or induced by hyperosmotic stress, the product of
this gene, Fps1p, closes immediately upon exposure to hyperosmotic stress to
prevent glycerol leakage from the cell (Tamas et al., 1999).
40

In the Icewine versus dilute juice fermentation study, STU, the gene that
encodes for Stl1p H+ /glycerol symport was found to be the most highly differentially
expressed gene between the two fermentation conditions, showing a 25.6 fold
difference in expression by day five (Martin, 2008). Furthermore, Northern analysis
of STLl expression supported micro array results and further revealed that STU
was up regulated during the first five days of Icewine fermentation, and its
expression peaked on day four for both fermentation conditions (Martin, 2008).
Interestingly, STLl appeared in global expression analysis as the most strongly
osmostress-induced gene in S. cerev;s;ae when laboratory and wine strains were
subjected to different hyperosmotic stress conditions (Rep et aL, 2000; Yale and
Bohnert, 2001; Posas et aL, 2000; Erasmus et aL, 2003; Melamed et aL, 2008). Sugar
induced osmotic stress upregulated wine yeast STU expression by approximately
87-fold after two hours of exposure to the stress (Erasmus et aL, 2003). In
laboratory strains of S. cerev;s;ae, STLl was the most or one of the most strongly
upregulated genes in response to salt-induced osmotic stress showing 89-fold
increase after 10 minutes of treatment with 0.4 M NaCI (Posas et aL, 2000). In
addition, global analysis of yeast translational response to high salinity revealed that
salt stress induced STLl mRNA translation (Melamed et aL, 2008).
Why do wine yeast fermenting Icewine induce the expression of STL1? It is
possible that the product of STL1, Stl1p H+ /glycerol symporter, has a role in the
uptake of glycerol that was present in Icewine juice and continually released to the
Icewine fermentation media throughout the fermentation.
41

2.4 St/lp H+/glycerol symporter
STL1 is predicted to encode a protein (63.5 kDa) comprised of 569 amino acids
with 11 transmembrane domains (SGD). It was first predicted to encode a putative
sugar transport-like protein since it displays greatest homology (28% identity) to
the products of other sugar transport genes in S. cerev;s;ae such as HXT2 and GAL2
(Zhao et al., 1994). The 34 members of this sugar permease protein family include
hexose and inositol transporters that transport these metabolites via facilitated
diffusion, and members that transport maltose and glycerol using a symport system
(Nelissen et al., 1997; Ferreria et al., 2005).
The sugar permease family is part of the Major Facilitator Superfamily (MFS)
that include membrane transport proteins with a length of 500-600 amino acids and
predicted to comprise 12 transmembrane spanning segments (Nelissen et al., 1997).
Stl1p acts as a H+jglycerol symporter. In this transport system, glycerol uptake
completely depends on the proton gradient across the plasma membrane. Glycerol
is transported into the cell against its concentration gradient along with one proton
molecule. This co-transport system eventually requires the cell to pump protons out
of the cell through a membrane ATPase in order to maintain the proton gradient and
is therefore considered to be energy consuming. This transport system operates
independently of the Fpslp-mediated diffusion (Sutherland et al., 1997).
Active glycerol uptake is differentiated from passive diffusion using a group of
chemicals called protonophores. Protonophores, also known as uncouplers, are
weak acids that can cross the yeast plasma membrane due to their lipophilic nature
42

and release a proton in the cytosol (Figure 1.3.1.C). Therefore, chemicals uncouplers
such as CCCP can dissipate the proton gradient, and therefore eliminate the energy
dependent glycerol entry into the cell.
Lages and Lucas (1997) were first to detect active glycerol uptake in S. cerevisiae
cells grown on non-fermentative carbon sources such as glycerol, acetate and
ethanol. In contrast, fermentative carbon sources such as glucose inhibits active
glycerol uptake. Ethanol grown cells shifted to glucose-based media lost their ability
to actively uptake glycerol, therefore glucose repressed H+ Jglycerol uptake in S.
cerevisiae, however, only under non-hyperosmotically stressed conditions (Lages
and Lucas, 1997). Interestingly, Ferreira et al. (2005) showed that inhibition of
active glycerol uptake by glucose is overcome once cells are exposed to
hyperosmotic stress. It is not known if cells fermenting Icewine juice induce active
glycerol uptake due to the extreme hyperosmotic stress conditions, despite the high
concentration of glucose found in the fermentation media.
Kinetic studies of glycerol transport in S. cerevisiae revealed that glycerol
transport involves two different systems that differ kinetically, one with a high and
one with a low Michaelis-Menten values (Km). Glycerol transport measured in cells
exposed to concentrations below 10 mM produce low Km values, indicating high
affinity to glycerol. This type of saturated kinetics represents the active glycerol
transport system. On the other hand, cells suspended in glycerol concentrations
higher than 10 mM did not follow saturation kinetics, characteristics of simple
diffusion (Lages and Lucas, 1997).
43

STL1 shows high homology to other proton symporter proteins of the MFS in
plant and yeast. These include mannitol symporter in Apium graveolans (N oiraud et
al., 2001) and sorbitol proton symporter in Prunus cerasus (Gao et al., 2003).
Homologues to STL1 were also found in other yeast species with proton symport
activity, these include: Debaryomces hansenii (Lucas et al., 1990), the osmotolerant
yeast Zygosaccharomyces rouxii (van Zyl et al., 1990), Candida versatilis (syn.
Candida halophila) (Silva-Gra~aa and Lucasa, 2006), and the halotolerant yeast
Pichia sorbitophila (Lages and Lucas, 1997). What is the role of these Stl1p-like
proteins in these strains?
Recently, Kayingo et al. (2009) demonstrated that a homologue of STLl in
Candida albicans is required for active glycerol uptake. Unlike glucose-inactivated
Stl1p of S. cerevisiae, the activity of C. albicans glycerol symporter is unaffected by
carbon source (Kayingo et al., 2009). Furthermore, STL1 deletion mutant of C.
albicans was no more sensitive to salt stress than wild type controls when they were
grown in the presence of 1 M NaCl. It is possible that active glycerol transport in C.
albicans is not the major mechanism used during hyperosmotic stress for glycerol
accumulation (Kayingo et al., 2009).
44

2.4.1 Stl1p glucose inactivation
Under non-hyperosmotically stressed conditions, glucose inhibits active glycerol
uptake in S. cerevisiae cells. Accordingly, the glycerol symport activity has been
described to be under glucose inactivation and can be re-activated when cells are
grown on non-fermentable carbon sources (Lages and Lucas, 1997). A study with
Stl1p-GFP fusion protein shows that when ethanol-grown cells were shifted to
glucose-based medium, plasma membrane Stl1p-GFP was endocytosed and
translocated into the vacuole for degradation. The fluorescent signal was no longer
detected 1.5 hours after the addition of glucose. Therefore, in the absence of
hyperosmotic stress, fermentative carbon source such as glucose activates the
degradation of Stl1 p, since glycerol is no longer required to be used as a carbon
source. This process is achieved by ubiquitination of Stl1P in an END3 dependent
manner (Ferreria et al., 2005). END3 gene encodes for a protein that is required for
the internalization step of proteins during endocytosis. Mutation in the N-terminus
of end3p eliminates Stl1p degradation. On the other hand, Stl1p inactivation was not
observed in cells grown on glucose and subjected to saline stress. On the contrary,
exponentially growing cells induced Stl1p in response to abrupt exposure to 0.7 M
NaCI, despite the presence of glucose (Ferreira et al., 2005). It appears that glucose
inactivation of Stl1p is overcome when exponentially growing cells are exposed to
hyperosmotic stress (Ferreria et al., 2005).
High temperatures also overcome Stl1p-glucose inactivation in S. cerevisiae.
Ferreira et al (2007) measured active glycerol uptake in yeast grown on glucose at
45

37°C and 30°C. Even though cells were grown on glucose-based media, active
glycerol uptake was still measurable in cells grown at 3rC but not in cells grown on
30°C. Accordingly, Stllp was not induced at 30°C and was only induced at 37°C.
These findings further emphasize that the regulation of Stllp -dependent active
glycerol uptake in yeast is a dynamic process that depends on the environmental
conditions the cells are exposed to. Although cells fermenting Icewine are grown in
high glucose and fructose concentration, STL1 is highly expressed. This expression
may lead to Stllp induction to actively uptake glycerol into the hyperosmotically
stressed cells. Therefore we hypothesized that Stllp glucose inactivation is
overcome by the hyperosmotic stress of Icewine fermentation to induce active
glycerol uptake.
46

2.5 Differences in osmotic stress response are strainl solute and time
dependent
Yeast stress responses are strain specific and may vary under different types of
hyperosmotic stress, therefore leading to different metabolic responses (Borneman
et al., 2008). These strain differences may influence the response to hyperosmotic
stress, specifically in relation to the induction of glycerol transport systems.
The majority of osmotic stress research in yeast has focused on the response of
laboratory strains to salt-induced osmotic stress. Laboratory yeast strains exhibit
differences in their ability to cope with osmotic stress. Differences are observed in
the ability ofthese strains to ferment sugar. Generally, laboratory strains are unable
to effectively ferment wine, in contrast, commercial wine strains are known for their
tolerance to ethanol and osmotic stress induced by high sugar concentration I
(Carrasco et al., 2001). The efficiency to utilize sugar and metabolite production I
during wine fermentation also varies between commercial strains depending on the
level of osmotic stress the cells are exposed to (Carrasco et al., 2001).
Response may also vary depending on the type of solute used to induce the
stress. Albertyn et al. (1994) reported that the activity of the glycerol synthesis
enzyme Gpdlp in yeast containing the cloned version of GPDl was lower in
response to salt stress compared to the same level of sugar stress. After three hours
of stress, yeast exposed to salt stress produced twice as much glycerol compared to
sugar stressed yeast.
47

Differences in response to hyperosmotic stress are also time-dependent. That is
to say, there is variation between short-term and long-term responses. Global
transcriptional analysis of a laboratory strain exposed to salt stress show differing
expression profiles during the first 10 min, 30 minutes and 90 min of the stress
(Yale and Bohnert, 2001). Here, the number of induced genes increased with time
from 107 at 10 minutes, to 243 at 30 minutes, then 354 at 90 minutes. Another
study shows different results, instead of correlated increase between gene
expression and time, the mRNA level of 7% ofthe upregulated genes in the first 10
minutes of the stress decreased after 20 minutes (Posas et al., 2000). These
differences emphasize that gene regulation during early response to hyperosmotic
stress is different from that of an adapted response.
The majority of research related to yeast response to hyperosmotic stress has
focused on the response oflaboratory strains, since their genome has been fully
sequenced and knock-out mutants are readily available. Few studies have
investigated the transcriptional response of wine yeast during wine fermentation
since the genome of a wine yeast strain was not fully sequenced up until 2008
(Borneman et al., 2008), and therefore knockout strains were not available.
Martin (2008) studied the transcriptional response of the wine yeast (K1-
Vll16) in Icewine and diluted Icewine fermentations. They found that only 28 out
of the 186 genes induced in laboratory yeast strain briefly exposed (30-45 minutes)
to aerobic salt and sorbitol stress (Rep et al., 2000) were found to be similarly
48

induced in wine yeast during the first five days of Icewine juice fermentation
relative to table wine fermentation.
In 2008, the complete genome of the wine yeast, AWRI1631, was sequenced and
compared to the laboratory strain (S288c) (Borneman et al., 2008). It was found
that 0.6% of the whole genome and 0.4% of predicted proteome differ between the
two studied strains. More specifically, a higher mutation rate was found in
sequences coding for proteins that are predicted to be part of the cell wall or
signaling transduction pathways (Borneman et al., 2008). Yeast transcriptional
response to hyperosmotic stress is mainly regulated through the HOG signaling
pathway that upregulates the expression of osmoresponsive genes. Variation in
genes related to this pathway may result in different transcriptional response to
hyperosmotic stress in wine and lab strains.
These differences may lead to variation between the response of wine yeast and
laboratory strains in the glucose repression and inactivation of active glycerol
uptake.
49

2.6 The interest in Stllp H+/glycerol symporter in relation to glycerol uptake
during /cewine fermentation
STLl is highly expressed in wine yeast during Icewine fermentation, however, it
is still not known ifthe product of this gene, the Stllp H+ jglycerolsymporter is
active during Icewine fermentation or subjected to glucose inactivation as
previously observed in laboratory strains (Ferreria et al., 2005). Because response
to hyperosmotic stress may differ depending on yeast strain, solute and duration of
the stress, we hypothesize in this project that that wine yeast Stl1p possibly
overcomes glucose inactivation during Icewine fermentation. This may be
advantageous for yeast adaptation to hyperosmotic stress, since Stllp may be used
to uptake glycerol in order to increase intracellular glycerol levels.
Assuming that Stll p is not inactivated during Icewine fermentation and actively
uptakes glycerol into the cell, can this symport activity lead to the dissipation of the
proton gradient across the plasma membrane? Many amino acid transport systems
found in yeast are proton symporters, therefore any dissipation of the proton
gradient across the cell membrane may reduce amino acid uptake. If this is true,
yeast will have to invest energy in order to re-establish the proton gradient and this
may lead to limited cell growth. Therefore, the goal of this project is to investigate if
Stllp transports glycerol into the yeast cell during Icewine fermentation in an
energy dependent manner. A schematic represenation of the thesis hypothesis is
presented in figure 2.6.1.
50
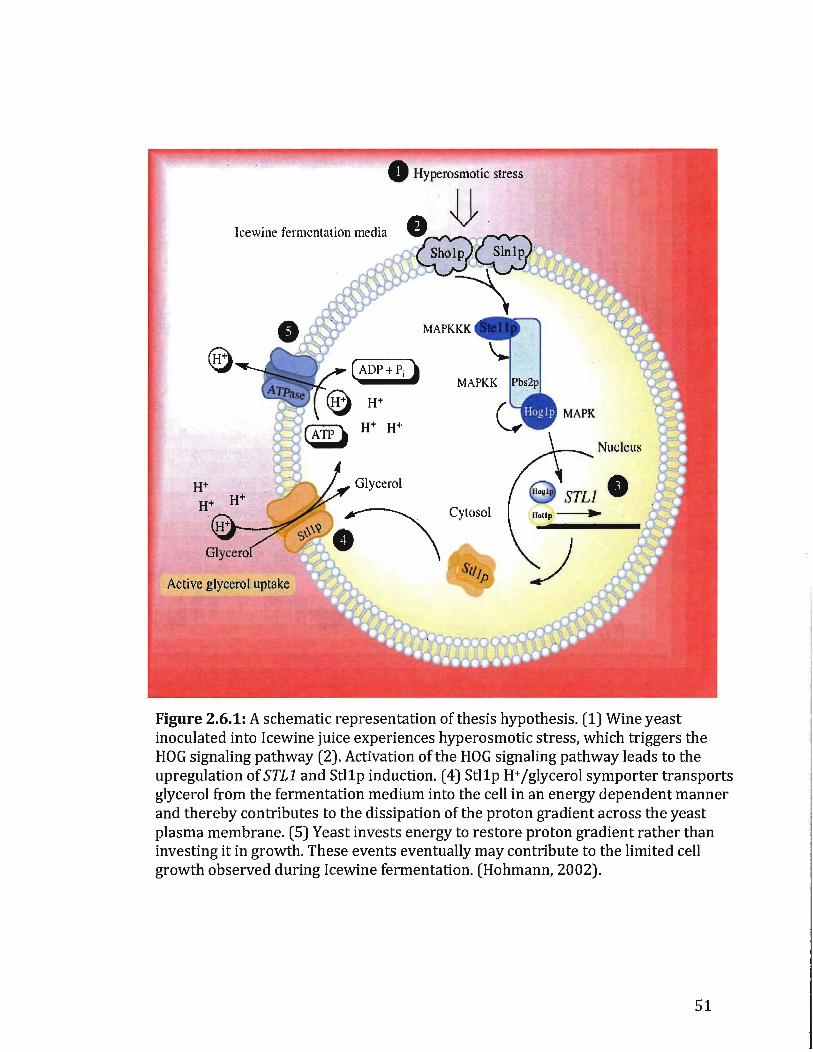
o Hyperosmotic stress
Icewine fermentation media
Cytosol
Active glycerol uptake
Figure 2.6.1: A schematic representation of thesis hypothesis. (1) Wine yeast inoculated into Icewine juice experiences hyperosmotic stress, which triggers the HOG signaling pathway (2). Activation of the HOG signaling pathway leads to the upregulation of STLl and Stl1p induction. (4) Stl1p H+ /glycerol symporter transports glycerol from the fermentation medium into the cell in an energy dependent manner and thereby contributes to the dissipation of the proton gradient across the yeast plasma membrane. (5) Yeast invests energy to restore proton gradient rather than investing it in growth. These events eventually may contribute to the limited cell growth observed during Icewine fermentation. (Hohmann, 2002).
51

3 MATERIALS AND METHODS
3.1 Yeast Strains
Three yeast strains of Saccharomyces cerevisiae were used in this project. The
laboratory mutant strain L!STLl and its parental strain S228C BY4742 (MATa:
his3Dl1eu2DO lys2DO ura3DO) obtained from Open Biosystems (Huntsville, AL,
USA). The commercial wine yeast strain KI-Vll16 was provided by Lallemand Inc.
(Montreal, QC, Canada).
3.2 Yeast media for maintaining cultures
S. cerevisiae strains were grown on YPD (2% peptone, 1% yeast extract and 2%
dextrose) agar for 3 days at 30°C. The deletion mutant strain, L!STLl was grown on
YPD agar supplemented with 200 ~g/mL geneticin (G418) for screening purposes
(Sigma; Oakville, ON, Canada). A single colony was inoculated into 3 mL YPD liquid
media and grown aerobically for 24 hours at 30°C, 150 rpm to develop the starter
cultures for each strain.
3.3 Yeast media and stress conditions for STL1 induction
The starter culture of each strain (300 ~L) was inoculated into 100 mL ofYEPE
medium (2% peptone, 1% yeast extract, 2% ethanol, w Iv) supplemented with 0.5%
of dextrose. Cells were grown aerobically for 13 hours at 30°C, 150 rpm to an O.D600
of 1.5. Hyperosmotic stress was induced by the addition of 25 mL of 5M NaCI to
52

reach a final concentration of 1M NaCI in the growth media. After 1.5 hours of salt
stress, cells were harvested for either Northern analysis or for [14C]glycerol uptake
assay.
3.4 Optimizing the conditions for glycerol uptake assay
Throughout the design of glycerol uptake assay different variables had to be
adjusted in order to achieve an assay that could produce accurate and reproducible
results.
The cell concentration in the reaction mixture was set to 60 mg cells jml (dry
weight) for each reaction. The specific activity (hot glycerol to cold glycerol ratio)
for glycerol stock solutions was set to 900, 300 and 53.5 dpmjnmol at 4, 10 and 65
mM glycerol respectively.
The temperature of the reaction was set to 30°C with slow speed stirring to
prevent cells from precipitating to the bottom of the reaction tube. In addition,
filters were pre-wet to improve water flow during the washing procedure.
A volume of 10 uL of the reaction mixture was removed at specific time points
throughout the assay for filtration and the residual extracellular [14C]glycerol was
removed by washing the filter with 5 mL of Ice-cold water.
To make certain that the [14C]glycerol was not stuck on the membrane due to its
liposoluble nature, the wash step was also tested with a glycerol solution as opposed
to water. Results for this optimization procedure appear in appendix 9.2.
53

3.5 Preparation of cells for [14Clglycerol uptake assay
Cells from the salt induced cultures were collected (125 mL) after 90 minutes of
stress and pelleted at 3800 g for 5 min at 4°C using Sorvall RC 5C plus centrifuge
with SS-34 rotor (Sorvall; Newtown, CT, USA). Pelleted cells were then washed twice
with 5 mL of ice-cold 100 mM Tris-citrate buffer (pH 5.0) to remove residual growth
media and salt. Cells were harvested in a pre-weighed 2 mL eppendorf tube by
centrifugation at 16000 g for 5 min at 4°C using Sorvall RMC-14 centrifuge. The
pellet was suspended in 100 mM ice-cold Tris-citrate buffer to a final wet weight
concentration of 675 mg of cellsjmL (150 mg cellsjmL dry weight) and kept on ice
until it was used for the [14C]glycerol uptake assay. A volume of 110 ul of this cell
suspension was used in the reaction mixture of [14C]glycerol uptake asay to reach a
final concentration of 60 mg cellsjmL (dry weight).
3.6 [14Clglycerol stock solutions
[14C]glycerol uptake was measured using three different glycerol stock solutions:
80 mM (900 dpmjnmol), 200 mM (300 dpmjnmol) and 1.3 M (53.5 dpmjnmol).
[14C]glycerol stock solutions were prepared by mixing [14C]glycerol (145
mCijmmol, GE healthcare, Buckinghamshire, England) and non labeled glycerol
(cold glycerol). The volume ratio oflabeled and non-labeled glycerol was
determined according to the desired specific activity and glycerol concentration of
the stock solution.
54

3.7 [14Cjglycerol uptake assays
To measure glycerol uptake in hyperosmotically stressed cells, 80 ilL of stock
cell suspension was mixed with 110 ilL of 100 mM Tris-citrate buffer (pH 5) in a 2
mL eppendorf tube to reach a final concentration of 60 mg cells/mL (dry weight) in
the final reaction mixtures. A special temperature controlled chamber was designed
(Figure 3.7.1) to hold the tubes above a stirring plate in order to control the speed of
stirring. The mixture was incubated at 30°C with gentle magnetic stirring for 2
minutes (Figure 3.7.2). Cells were then incubated with either 1 % ethanol (control)
or 25 11M of carbonyl cyanide m-chlorophenylhydrazone (CCCP, 1.25 mM stock
solution, 50% ethanol) to prevent accumulation of glycerol through glycerol/proton
symport activity (Figure 1.3.1 C). After 1 minute [14C]glycerol assay was started by
the addition of 10 ilL [14C]glycerol of either 80 mM (900 dpm/nmol), 200 mM (300
dpm/nmol) or 1.3 M (53.5 dpm/nmol) stock solutions to reach a final glycerol
concentration of 4 mM, 10 mM or 65 mM respectively in the final reaction mixture
(200 ilL final volume). At specific time intervals, 10 ilL aliquots were removed and
filtered through Whatman GF /C filters (25 mm diameter). The cells were then
washed twice while still on the filter with 5 ml ice-cold water to remove residual
extracellular glycerol and then the filters were transferred to glass vials containing 5
ml scintillation fluid (Econo Safe, Fisher). [14C]glycerol was counted using a
Beckman Coulter scintillation system (LS 6500) and the level of glycerol taken up by
the cells was inferred from the amount of [14C]glycerol retained on the filter. Counts
55

of [14C]glycerol were converted to umoles of glycerol using the next equation:
(Counter efficiency (92%) * Counts per minute) / Specific activity.
Figure 3.7.1: Temperature-regulated chamber that was designed for [14C]glycerol assay in order to hold the reaction tubes.
Figure 3.7.2: A schematic representation of [14C]-glycerol uptake assay. (1) Hyperosmotically stressed cells were washed twice and resuspended in 100 mM Tris-citrate buffer to a final concentration of 60 mg cells/ml (dry weight) in reaction mixture and stirred for 2 min at at 30°C. (2) cells were incubated with either 1 % ethanol (control) or 25uM CCCP for 1 minute. (3) The reaction was started by the addition of 10 ilL of the 14C-glycerol stock solution. (4) At specific time points 10 ilL of reaction mixture was aliquoted out and diluted in 5 mL icecold water to stop the reaction. (5) Cells were immediately filtered and washed twice with 5 mL ice-cold water to wash off excess [14C]-glycerol. (6) The radioactive glycerol retained on the membrane was counted using scintillation counter. The amount of glycerol up-taken by the cells was inferred from the level of radioactivity retained on the filter.
56
I ",

3.8 Data analysis of [14Cjglycerol uptake assays
Glycerol initial uptake rate was determined by calculation of the initial slope of
glycerol uptake curve using the first three data points. The level of glycerol
accumulation was determined at the time point where the glycerol uptake curve
begun to plateau. The % decrease in glycerol accumulation was determined using
the following equation:
% decrease = Glycerol-<:ccp - GlyceroLcccp
GlyceroLcccp
Each assay was done in triplicate or more and subjected to two-tailed unpaired
t-test to determine statistical significant differences in glycerol initial uptake rates
and glycerol accumulation (Prism v.3, GraphPad; CA, USA). The results oft-test
analysis were presented as either extremely significant (***, P<O.OOl), very
significant (**, O.OOl<P<O.Ol), significant (*, O.Ol<P<O.05) or not significant (NS,
P>O.05), at the 95% confidence interval.
57

3.9 Ice wine juice preparation
Riesling Icewine was kindly provided by Niagara Vintage Harvesters (Virgil, ON.
Canada). The juice was filtered through a series of coarse, medium and fine pore-
size pads using a Bueno Vino Mini Jet Filter system (Vineco; St. Catharines, ON,
Canada). The juice was then sterile-filtered through a 0.22 !lm membrane cartridge
filter (Millipore; Etobicoke, ON, Canada) into sterile lL bottles. The sterile juice was
stored at -40°C prior to the fermentation experiments.
Table 3.9.1: The initial concentrations of sugars and glycerol in Riesling and Vidal Icewine juice
Parameter Vidal 38°Brix Riesling 37°Brix
~ h .. _' Icewine Juice Dilute Juice
Glycerol (gIL) 2.201 ± 0.05 1.031 ± 0.023 92.45 ± 0.89 Glucose (gIL)
Fructose (gIL)
= Icewine Juice 1.75 ± 0.10
172.03 ± 4.62 214 ± 3.3
. Dilute Il,lice 1.102 ± 0.02
· 81.70 ± 3.201 108.5 ± 4. 702
198.67 ± 2.65 255.12 ± 4.51
~'~ .• __ -i
130.05 ± 3.75
3.10 Perpetration of starter culture for Ice wine and dilute Icewine
fermentations
Starter cultures were prepared with the commercial wine yeast Saccharomyces
cerevisiae Kl-Vll16 by using a step-wise acclimatization method. In a sterile 250
mL Erlenmeyer flask, 5.0 g of dehydrated yeast was rehydrated with 50 mL of sterile
distilled water, at 40°C for 15 min with gentle swirling every 5 min to encourage
aeration. Then after, 50 mL of sterile diluted Icewine juice (18.5°Brix Riesling or
19°Brix Vidal) was added aseptically to the rehydrated yeast and the starter culture
was incubated at 25°C for 1 hour in a water bath, swirling every 30 min. Next, 50 mL
58

of undiluted Icewine juice (37 °Brix Riesling or 38°Brix Vidal) was introduced to the
starter culture to reach a final concentration of approximately 18.5°Brix (150 mL).
The starter culture was incubated at 20°C for 2 h and the culture was aerated by
periodically swirling the flask every 30 min. A sample of the starter culture was
examined for actively budding yeast cells under 40x magnification using a light
microscope prior to inoculation.
To measure the activity of Stl1p in hyperosmotically stressed Icewine cells, two
fermentations were set up: one with undiluted Icewine juice of (37 °Brix Riesling or
38°Brix Vidal), and the control fermentation of diluted Icewine juice (18.5°Brix
Riesling or 19°Brix Vidal). The starter culture (7.5 mL) of the starter culture was
used to inoculate 0.5 L each of Icewine juice and diluted juice reaching a final yeast
inoculation rate of 0.5 g (dry weight) L-l. Fermentations were carried out in sterile
fermentation vessels that were fitted with air locks at 1 rc. Icewine and diluted
Icewine juice fermentations were performed in triplicate.
3.11 Stl1p [14C]glycerol uptake assay of K1-Vll16 fermenting Icewine and
diluted Ice wine juice
Wine yeast cells (Kl-Vll16) from both fermentation conditions were harvested
for Stl1p [14C]glycerol uptake assay at the peak of STLl expression in Icewine
fermenting cells, as previously determined by northern analysis (Martin, 2008).
Fermentation medias were pelleted at 3800 g for 5 min at 4°C using Sorvall RC 5C
59

plus centrifuge with SS-34 rotor (Sorvall; Newtown, CT, USA). Cells were washed
twice with 5 mL of Ice-cold 100 mM tris-cirtrate buffer (pH 5) to remove
fermentation media. Cells were then concentrated to 126 mg cellsjmL in 100 mM
ice-cold Tris-citrate buffer (pH 5.0). 190 ~L of cell suspension were incubated at
30°C for two min with stirring and the assay continued as described in section 2.6 at
4 mM glycerol (900 dpmjnmol) in the final reaction mixture. Each assay was
performed in triplicate.
3.12 STU expression analysis using Northern blots
The expression of STLl was analyzed using northern analysis under different
stress conditions: (1) in BY4742 and L!STLllaboratory strains and wine yeast
K1Vll16 grown on 2% ethanol based media and stressed with 1M NaCI for 1.5
hours, and in (2) Kl-Vll16 fermenting Icewine and diluted Icewine juice.
Expression of STLl in Kl-Vll16 fermenting Riesling juice was analyzed from
days 4 to day 7 and cells fermenting Vidal juice from days 2 to 5.
3.12.1 STL1 Probe amplification and purification for Northern analysis
The forward and reverse primers of the STLl DNA probe were designed by
Martin (2008). The forward primer, 5'-TCAAAGGCAAATTTATAAGCAGAAC-3' and
reverse primer, 5'-CCAAAATCAATCCAATAAGCAATCA-3' were used to amplify a 550
pb fragment of the STLl gene using polymerase chain reaction (PCR). PCR was
60

carried out in PTC-200 DNAEngine thermocycler (MJ Research; Waltham, MA, USA)
using the following parameters: 30 cycles of94QC for 40 s, 55QC for 60 sand 72QC
for 90 s. The PCR product was run on 1 % (w Iv) agarose gelto verify probe size and
was visualized under UV light using BioRad Gel-doc 1000 system. The probe was
then purified with a Qiagen QIAquick (Mississauga, ON, Canada) gel extraction kit.
3.12.2 RNA extraction
The RNA of BY 4742, ASTLl and Kl-V1116 were extracted using the method of
Pigeau and Inglis (2005). RNA was extracted from BY4742, ASTLl and KI-Vll16
grown on ethanol based media (YEP supplemented with 2% ethanol) and from Kl
Vll16 fermenting Icewine and diluted Icewine juice.
Approximately 50 mL of yeast cells grown on ethanol-based media were
removed for RNA extraction. Volumes of 20 to 80 mL were removed from Icewine
fermentation media and diluted Icewine fermentation media for RNA extraction of
wine yeast KI-V1116.
Removed volumes of both fermentation media and ethanol-based media were
supplemented with 0.01 mg mL-l cycJohexamide. Cells were immediately pelleted at
3800 9 for 5 min at 4°C using a Sorvall RC 5C plus centrifuge (Sorvall; Newtown, CT,
USA). The cells were resuspended in 10 mL of cold Diethylpyrocarbonate (DEPC)
treated distilled water and were pelleted as before. While still on ice, cells were
resuspended in 375 ~L of extraction buffer (0.1 M NaCl, 10 mM Tris-Cl (pH 8.0), 1
mM EDTA (pH 8.0) and 5% Triton X-I00) and 250 ~L phenol/chloroform/isoamyl
61

alcohol (PCI, 25:24:1). Following the addition of 300 mg of glass beads, the
suspension was vortexed at 2500 rpm for 6 min to lyse the cells. After vortexing, 6
~L of 20% SDS was added and the mixture was left to stand on ice for 1 h. The
mixture was centrifuged at 16000 g in a Sorvall RMC-14 centrifuge for 20 min at
4QC. To precipitate the RNA, 15 ~L of 5 M NaCI and 1250 ~L absolute ethanol was
added to the supernatant. The solution was allowed to sit at -30QC for 2 h prior to
centrifugation at 16000 g for 20 min at 4°C. The resulting RNA pellet was
resuspended in 50 ~L of DEPC-treated distilled water and stored at-80QC until use.
RNA concentration was determined spectrophotometrically at 260 nm.
3.12.3 Membrane preparation for northern hybridization
Extracted RNA samples (30 ~g) were separated on 1.25 % agarose gel
containing 18% (vjv) formaldehyde and blotted onto positively charged nylon
membrane (Roche; Basel, Switzerland) using capillary transfer. The RNA was cross
linked to the membrane using Hoefer UVC 500 crosslinker for 4 min, for each side of
the membrane (Hoefer, Inc.; CA, USA).
3.12.4 STL1 probe labeling and hybridization
The STLl probe was labeled with [a32P]-ATP (perkin Elmer) using a Roche
random primed labeling kit (Roche; Basel, Switzerland) and 20 ng of the labeled
probe was hybridized to the bound RNA following an overnight incubation at 42°C
62

in 50 mL of hybridization solution containing 5X SSC, 5X Denhardfs solution, 1%
SDS, 50% (v/v) formamide and 0.1 mg mL-l sheared salmon sperm DNA (Ambion).
The membrane was washed twice with 50 mL 2X SSC containing 0.1 % (v Iv) SDS for
20 min at room temperature and then washed twice with 50 mL 0.2X SSC, also
containing 0.1 % (v Iv) SDS, for 15 min at 50°C. The probe membrane was exposed to
a Fujifilm phosphorimaging screen for up to seven days and the screen was scanned
with Fujifilm FLA-3000 phosphorimager (663 nm helium-neon laser) and personal
molecular imagerTM (PMFM, 635 nm). The subsequent images were quantified with
Fujifilm Image Gauge software (v.4.0) and Quantity One software (v.4.6.7). Gene
expression levels were normalized to the signal intensities derived from a rDNA
region spanning the 5.8S rRNA gene and flanking internal transcribed spacers (ITS)
1 and 2.
3.13 Sequencing the STU gene in S. cerevisiae strains
The STLl encoding region of BY4742 and Kl-Vll16 was amplified by PCR using
forward 5'-ATGAAGGATTTAAAATTATCGAATT-3' and reverse primer 5'
TCAACCCTCAAAATTTGCTTTATCG-3' and carried out as described in section 2.10.1.
The PCR product was run on 1 % (w Iv) agarose gel to verify gene size and was
visualized under UV light using BioRad Gel-doc 1000 system. Amplification products
were then purified with a Qiagen QIAquick PCR purification kit.
The purified STLl PCR (approximately 1700 pb) product was run on 1% agarose
gel and quantified using HighRanger 1 kb DNA Ladder (Norgen Biotek, St.
63
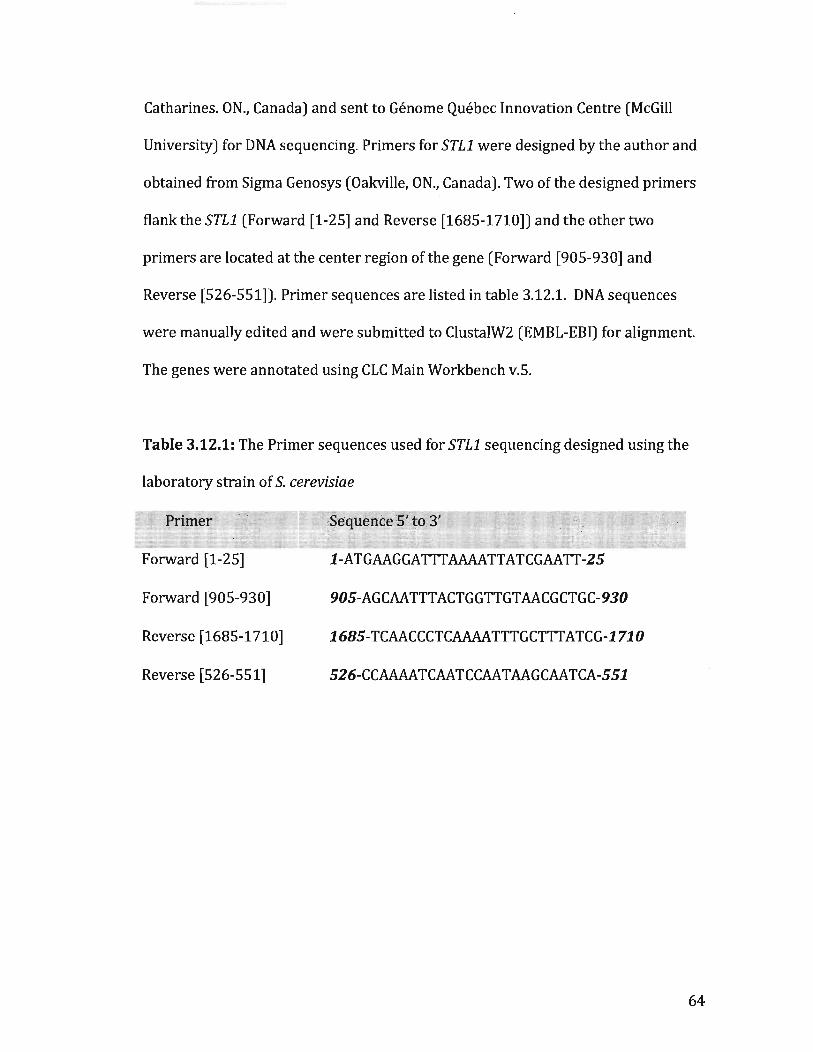
Catharines. ON., Canada) and sent to Genome Quebec Innovation Centre (McGill
University) for DNA sequencing. Primers for STLl were designed by the author and
obtained from Sigma Genosys (Oakville, ON., Canada). Two ofthe designed primers
flanktheSTLl (Forward [1-25] and Reverse [1685-1710]) and the other two
primers are located at the center region of the gene (Forward [905-930] and
Reverse [526-551]). Primer sequences are listed in table 3.12.1. DNA sequences
were manually edited and were submitted to ClustalW2 (EMBL-EBI) for alignment.
The genes were annotated using CLC Main Workbench v.5.
Table 3.12.1: The Primer sequences used for STL1 sequencing designed using the
laboratory strain of S. cerevisiae
Forward [1-25]
Forward [905-930]
Reverse [1685-1710]
Reverse [526-551]
1-ATGAAGGATTT AAAATTATCGAATT -25
905-AGCAA TTTACTGGTTGT AACGCTGC-930
1685-TCAACCCTCAAAA TTTGCTTT ATCG-171 0
526-CCAAAA TCAA TCCAA T AAGCAA TCA-551
64

4 RESULTS
Part i-Development of Stlip-dependent glycerol uptake assay
To develop a glycerol uptake assay that is specifically dependent on Stl1p
activity it was first necessary to determine the induction conditions under which
STLl gene is expressed in parent and wine strain of S. cerevisiae. To do that, the
expression of STLl was investigated under saline stress using Northern blot analysis
(section 4.1). Once STLl gene expression was confirmed, the same stress conditions
were used to induce StIlp and measure the level of [14C] glycerol uptake in wine and
laboratory yeast strains (Section 4.2). Glycerol uptake was measured in saline
stressed cells incubated with either 4 mM, 10 mM or 65 mM glycerol in the reaction
mixture. The first two concentrations were adapted from a previously published
study (Ferreria, et al., 2005) and the latter is the glycerol concentration that was
found in Icewine fermentation media at the time point when STL1 expression
peaked. After completing the design of the assay, the assay was applied to measure
glycerol uptake in hyperosmotically stressed wine yeast cells, harvested from
Icewine fermentation.
65

4.1 Stl1p induction in wine and laboratory yeast strains
To induce Stllp in laboratory and wine yeast strain, cells were grown on 2%
ethanol (Section 3.2) since it was previouslydemonstrated that active glycerol
uptake is highly induced in S. cerevisiae by non-fermentative carbon sources such as
ethanol (Lages & Lucas, 1997).
Exponentially growing cells were subjected to 1 M salt stress for 1.5 hours
(Section 3.2) and the level of STLl expression was compared between
hyperosmotically stressed and non-stressed cells using Northern blot analysis
(Section 3.11).
Northern blots of STL1 revealed that the gene was slightly expressed in wine and
laboratory yeast strains under non-stressed conditions when grown on 2% ethanol
(Figure 4. loLA). Upon incubation with 1M NaCl, STLl was induced in both parent
and wine strains however at different expression levels.
(A) (B)
<0 ~ ::::
.:J ~~ ~ ~~ 4)
STU
rRNA
1 M NaCI + + +
Figure 4.1.1: (A) Northern analysis of STLl expression in ethanol grown wine (K1Vll16) and laboratory yeast strains (BY4742 and ASTL1) before and after 1.5 hours of hyper osmotic stress using 1 M NaCl. (B) Relative expression of STL1.
66

The laboratory strain showed an approximately l1.7-fold increase in STLl
expression compared to a 3.4 fold increase in the wine strain (Figure 4.4.1.B). As
expected, STLl was not expressed in L1STLl knockout under either stressed or non
stressed conditions.
These results first confirm that the Northern blot expression signal is specific for
STLl since a signal is only present in the parent strain and lacking in the L1STL1.
Secondly, the chosen hyperosmotic stress conditions are adequate to induce STLl
and therefore could be used for (14C]glycerol uptake assay.
67

4.2 [14Cjglycerol uptake at 4 mM glycerol
Glycerol uptake by parent and L1STLl strains was first measured at 4 mM
glycerol concentration in the reaction mixture using the assay outlined in section
3.7, over a 10 minutes time course (Figure 4.2.1).
(A) 350
j 300
::J ~ i 250
l:l ~ 200 t'II 0> e ~ 150
l!100
~ 50 ......
• BY4742
2.5 5.0 7.5
Time (min)
(B)
10.0
350 • BY4742
12.5
o+-4-~~-r~-T~~~~~ o 1 2 3 4 5 6 7 8 9 10 11
Time (min)
(C) c: 350 .2 1! 300 ::J
§ 1 250
tl ~ 200 ftI ...
e -1 '50
~ ___ 100
"6> .. .IS 50
• BY4742
4 L1STLt
~ O+---~--r-~~~r-~ 0.0 2.5 S.O 7.S
Time (min) 10.0 12.S
Figure 4.2.1: [14C]glycerol uptake at 4 mM glycerol by BY 4742 and L1STLl from three different cell preparations (A, Band C). Cells were grown on 2% ethanol and stressed for 1.5 hours with 1 M NaCl.
68

All three separate experiments under 4 mM glycerol conditions presented
similar glycerol uptake trends. The parent strain accumulated higher levels of
glycerol compared to the .t1STLl knockout. In addition, the kinetics of glycerol
uptake by the parent strain was different than that of the knockout strain (Figure
4.2.1). The initial glycerol uptake rate in the parent strain plateaued after
approximately 7 minutes. Therefore, glycerol accumulation in parent strains follows
a biphasic kinetics.
On the contrary, .t1STLl did not display changes in glycerol transport rate over
the 10 minutes of the assay and presented rather a constant glycerol uptake rate,
hence, the knockout strain displayed a monophasic kinetics of glycerol uptake.
Comparison between the initial uptake rates of glycerol transport between the
two strains revealed that the parent strain was able to transport glycerol into the
cell at an initial rate that was 2.6-fold greater than that of .t1STLl (Figure 4.2.2.B).
c .2 1ii 30
'3 E "":" 25 ::sJ ~ .a 20 _tJ)
~ =a 15 B ~ >.-10 m $> ......
[A)
• BY4742
... LlSTL1
1 2 3 4 5 6 7 8 9 10 11
Time (min)
[B)
BY4742 LiSTL 1
Figure 4.2.2: (14C]glycerol uptake and initial glycerol uptake rate at 4 mM glycerol in BY4742 and .t1STL1. (A) Average of (14C]glycerol uptake (n=3). (B) Comparison of initial glycerol uptake rate. *** The difference between the means was extremely significant at the 95% confidence interval determined by unpaired ttest (n=5, P=O.00041.
69

These results suggest that the absence of STLl reduces the rate of glycerol
uptake and therefore the expression of this gene positively contributed to rapid
glycerol uptake in hyperosmotically stressed cells.
To examine if glycerol uptake depends on the proton gradient across the yeast
plasma membrane, the assay was repeated in the presence of the protonophore
CCCP.
Figure 4.2.3: [14C]glycerol accumulation in BY4742 and LlSTLl at 4 mM glycerol after 7 minutes with and without the incubation with CCCP. * The difference between the means was significant at the 95% confidence interval as determined by unpaired t-test (n=3, P=O.018). NS- means are not significantly different as determined bv unpaired t-test.
70

Incubation with CCCP significantly lowered glycerol accumulation in the parent
strain compared to control conditions where no CCCP was added (Figure 4.2.3),
indicating the glycerol accumulation in the presence of CCCP was not significantly
different to than that measured in the STLl strain. Therefore, CCCP inhibited
energy-dependent glycerol uptake through Stl1p. In contrast, the level of glycerol
accumulation in t1STLl cells did not significantly change in the presence of CCCP
compared to control conditions and therefore did not show energy dependency.
The decrease in glycerol accumulation in the parent strain with CCCP constitutes
about 50% of the glycerol that was accumulated under control conditions for the
parent strain and therefore represents the contribution of Stl1p in glycerol
accumulation in hyperosmotically stressed cells (Figure 4.2.4).
BY4742 t1STL1
Figure 4.2.4: The % decrease from control in [14C]glycerol accumulation at 4 mM glycerol following the incubation with CCCP after 7 minutes. * % decrease in glycerol accumulation was significantly different than parent strain at 95% confidence interval as determined by unpaired t-test (n=3, P=O.0459).
71
I I I

Since the parent strain exhibited a significantly greater reduction in glycerol
accumulation in the presence of CCCP compared to L1STL1, it is inferred that Stl1p
positively contributes to energy dependent glycerol uptake in hyperosmotically
stressed cells at 4 mM glycerol.
72

4.3 [14Cjglycerol uptake 10 mM glycerol
The second [14C]glycerol uptake assay was carried out at 10 mM glycerol
(Ferreria, et al., 2005) in the reaction mixture, for 60 minutes (section 3.7).
At 10 mM glycerol, the parent strain and the LlSTLl knockout presented glycerol
uptake trends that were similar to the 4 mM glycerol assay results. The parent strain
exhibited fast glycerol uptake for the first 10 minutes of the assay that begun to
decrease after approximately 15 minutes. On the other hand, glycerol uptake by
LlSTLl knockout maintained the same rate throughout the course of the assay and
therefore represents the passive diffusion rate (Figure 4.3.1.A).
(A (B
• BY4742 e .2 ... ,1STLt 19 1000 "5-"':-E. J ~ ~ 750 U "0 .!! 01 o -~ "0 500
~§. m-
$S 't...
10 20 30 40 50 60 70 BY4742 ~STL 1 Time (min)
Figure 4.3.1: [14C]glycerol uptake and initial glycerol uptake rate at 10 mM glycerol in BY4742 and .t1STL1. (A) Average [14C]glycerol uptake (n=3). (B) Comparison of initial glycerol uptake rate. ** The difference between the means was very significant at the 95% confidence interval as determined by unpaired t-test (n=5, P=O.0066).
73
I
I

Incubation with CCCP significantly reduced the level of glycerol accumulation after
10 minutes in the parent strain (Figure 4.3.2) thereby inhibiting active glycerol
uptake, however CCCP also significantly reduced glycerol accumulation in the
knockout strain, suggesting that active glycerol uptake was inhibited in a strain
lacking the Stl1p symporter. These results may imply the existence of other
potential glycerol symporters in S. cerev;s;ae that have yet to be discovered in the
known genome.
**
Figure 4.3.2: (14C]glycerol accumulation in BY4742 and J1STLl cells at 10 mM glycerol after 10 minutes with and without the incubation with CCCP. *** The difference between the means was extremely significant at the 95% confidence interval as determined by unpaired t-test (n=5, P<O.OOOl). ** The difference between the means was very significant at the 95% confidence interval as determined by unpaired t-test (n=5, P=O.0065).
74

It is induced from these results that glycerol accumulated in ASTLl represents
background levels of glycerol, that is to say, glycerol that entered the cell through
passive diffusion or other unidentified glycerol transport proteins and therefore
could not be attributed to Stl1p activity.
Both parent and ASTLl displayed the same % of glycerol reduction upon
incubation with CCCP, hence, sharing similar sensitivity to the protonophore at 10
mM glycerol (Figure 4.3.3). It appears that at concentrations higher than 4 mM
glycerol, uptake becomes less Stllp specific due to increased background levels of
glycerol.
BY4742 ~STL1
Figure 4.3.3: The % decrease from control in (14C]glycerol accumulation at 10 mM glycerol following the incubation with CCCP after 10 minutes.
75

To further investigate the degree of Stl1p contribution to glycerol accumulation
during the yeast response to hyperosmotic stress, glycerol accumulation was
compared between stressed and non-stressed parent strain cells (Figure 4.3.4).
BY4742 Stressed
1 Stressed
Figure 4.3.4: Induction of (14C]glycerol uptake in BY 4742 following saline stress at 10 mM glycerol. BY 4742 were either stressed by 1 M NaCI for 1.5 hours or not subjected to saline stress (n=I).
Parent strain cells showed an increase in glycerol accumulation upon exposure
to saline stress. This increase was directly correlated to the increase in STLl
expression as shown in figure 4.1.1. Saline-stressed parent yeast cells accumulated
about 2.3 times more than non-stressed parent cells and twice as much glycerol
compared to the knockout strain. Once again, it appears that the background levels
of non Stl1p-specific glycerol entry into the cell constitute approximately half of the
glycerol measured in the hyperosmotically stressed parent cells under the 10 mM
glycerol conditions, similar to the results observed under the 4 mM glycerol assay.
76

These results put further emphasis on the degree of Stl1p contribution for
glycerol accumulation in hyperosmotically stressed cells. Stllp induction by saline
stress increases glycerol accumulation by approximately 2-fold.
4.4 [14Cjglycerol uptake at 65 mM glycerol
To be able to measure the activity of Stl1 p in cells suspended in Icewine
fermentation media, it was first necessary to test if the designed (14C]glycerol
uptake assay still shows specificity for Stllp at higher glycerol concentrations as
observed in the starting glycerol concentration in Icewine juice and throughout the
fermentation. Therefore, the competency of glycerol uptake assay to measure Stl1p
dependent uptake at 65 mM was investigated under the same growth and stress
conditions as 4 and 10 mM glycerol assays (section 3.7).
At 65 mM, glycerol uptake by parent strain cells grown on ethanol-based media
and exposed to saline stress was fairly constant throughout the course of the assay
and actually resembled ASTLl glycerol uptake trend (Figure 4.4.1.A). The difference
in the initial glycerol uptake rate that was previously observed under 4 and 10 mM
glycerol concentrations was no longer detected at 65 mM. It is possible that when
the reaction mixture contains high glycerol concentration, the contribution ofStllp
to the total intracellular glycerol accumulation is masked by high background
uptake, probably due to passive diffusion and/or other uncharacterized glycerol
transport systems.
77

(A s:: 1750 • BY4742 Control
.2 i. t1STL 1 Control «i 1500 '3--:-E i 1250 :s ~ ~1000
_ C)
e ;:;; 750
B ~ ~ ::::L. 500 g)-
l' 250 ...... D+-~~~-r~~~~~~~ o 1 2 3 4 5 6 7 8 9 10 11
Time (min)
(B
BV4742 L1STL1
Figure 4.4.1: (14C]glycerol uptake and initial glycerol uptake rate at 65 mM glycerol in BY4742 and A.STL1. (A) Average (14C]glycerol uptake (n=6). (B) Comparison of initial glycerol
In contrast to the 4 mM and 10 mM glycerol assays, glycerol initial uptake rate
was not significantly different between parent and A.STLl under the 65 mM
conditions (Figure 4.4.2). Furthermore, the addition of CCCP only significantly
reduced glycerol accumulation in L1STLl and did not significantly affect the parent
strain. Even though Stl1p may actively transport glycerol into the cell under 65 mM
glycerol conditions, this transport cannot be accurately measured due to the high
levels of non Stl1 p-specific uptake of glycerol.
78

Figure 4.4.2: (14C]glycerol accumulation in BY4742 and J1STLl at 65 mM glycerol after 7 minutes with and without the incubation with CCCP. * Glycerol accumulation was significantly different than control at 95% confidence interval as determined by unpaired t-test (n=4, P=0.028). NS- means are not significantly different as determined by unpaired t-test (P= 0.053).
All six repeats of 65 mM assay were done from six different cell preparations
from six different growth experiments. These six repeats showed variability in
glycerol uptake rate and in the level of glycerol accumulation. It was necessary to
determine why the difference in initial uptake rate between parent strain and
knockout was observed only at lower glycerol concentrations (4 mM and 10 mM)
but not at 65 mM glycerol. Did it arise from the high glycerol concentration found in
the reaction mixture or due to the high variability among the different growth
batches? To investigate this question [14C]glycerol uptake was compared between 4
79

mM and 65 mM assays in hyperosmotically stressed cells that were harvested from
the same growth batch. Results show that glycerol uptake curve of parent strain was
almost identical to i!STLl at 65 mM glycerol (Figure 4.4.4).
c o 1250
i 1 i 1000
a ~ '" 'tJ 750 ~ III o-
J 1500
m-Jr 250
"t..
65 mM glycerol
• BY4742
... • 1STL 1
c o :;:;
250
I'll 200 :;""':' E i ~ ~150 U "l:I .! m o "-tii '0100
~! m,... 5
JJ ......
4 mM glycerol • BY4742
... !1STL 1
2 3 4 5 6 7 8 9 Time (min)
234 5 6 7 8 9
Time (min)
Figure 4.4.4: Comparison of [14C]glycerol uptake of BY 4742 and ASTLl under (A) 65 mM and (B) 4 mM in cells harvested from the same growth batch (n=2).
On the other hand, under 4 mM glycerol, parent strain harvested from the same
growth batch presented a faster uptake rate of glycerol compared to i!STLl as
previously presented in section 5.2.
Despite the fact that both 4 and 65 mM assays were performed with cells
collected from the same growth batch, the glycerol uptake rate and accumulation by
parent strain was only higher and significantly different from the i!STLl strain at the
4 mM glycerol assay condition.
80

It is implied from these results that the glycerol concentration in the reaction
mixture greatly influences the competence ofthe assay to measure Stl1p-dependent
glycerol uptake, rather than the variability among the different cell growth batches.
The reason why Stllp-dependent glycerol uptake was not detected at 65 mM
could be related to the high background levels of glycerol that perhaps eliminated
the difference in glycerol uptake rate and accumulation. Hence, at 65 mM Stllp
dependent glycerol uptake could not be accurately measured under these assay
conditions.
Comparison between the initial uptake rates measured at 4, 10 and 65 mM
revealed that glycerol uptake rate increased with glycerol concentration for both
parent and knockout strain (Figure 4.4.5). However the initial uptake rate was no
longer significantly different between the strains at 65 mM. This demonstrates that
under higher glycerol concentrations, the assay cannot display the contribution of
Stl1p to the measured glycerol uptake, since it cannot be distinguished from the
background glycerol uptake in the .t1STLl strain.
81

Q) ... e Q)-~.= coE ..... c.~ ::J~
- "C CO Cl ... . _-Co .- .. _CII
e~ Q)Cl
U~ >.0 -E 0):::1 ...... -o
'It 'I"" ......
Cl BY4742 llSTL 1
***
NS
Glycerol concentration
Figure 4.4.5: The effect of glycerol concentration on glycerol initial uptake rate in BY 4742 and ASTLl cells. *** The difference between the means was extremely significant at the 95% confidence interval (n=5, P=O.0004). ** The difference between the means was very significant at the 95% confidence interval (n=5, P=O.0066). NS- No significant difference between the means.
4.5 t 4Cjglyceroi uptake by wine yeast strain at 4 and 65 mM glycerol
Under 4 mM assay conditions the incubation of salt stressed wine yeast with
CCCP resulted in a significant reduction in glycerol accumulation as previously
observed for parent strain (Figure 4.5.1). On the contrary, at 65 mM glycerol, the
addition of CCCP did not significantly effect glycerol accumulation in wine yeast as
observed for parent strain. Similar to parent strain, at high glycerol concentration,
82

Stllp-dependent active glycerol transport could not be measured in wine yeast
using the conditions of the designed assay.
65 mM glycerol (A) (B)
4 mM glycerol
Figure 4.5.1: (14C]glycerol accumulation in wine yeast (K1-Vll16) and laboratory strain (BY 4742) after 7 minutes with and without the incubation with CCCP at (A) 65 mM and at (B) 4 mM glycerol. *** The difference between the means was extremely significant at the 95% confidence interval as determined by unpaired ttest (n=3, P<O.OOOl). * The difference between the means was significant at the 95% confidence interval as determined by unpaired t-test (n=3, P=O.018). NS- No significant difference between the means.
At 4 and 65 mM glycerol using Stllp salt induction conditions, initial uptake
rates were not significantly different between parent and wine strains (Figure
4.5.2). It appears that laboratory and wine strain of S. cerevisiae behave similarly in
relation to glycerol uptake under either higher or lower glycerol concentrations.
83

(A) 65 mM glycerol . (B) 4 mM glycerol
BY4742 K1-V1H6 BY4742 K1·V1116
Figure 4.5.2: comparison of (14C]glycerol initial uptake rate in wine yeast (KlVl116) and laboratory strain (BY4742) at (A) 4 mM and (B) 65 mM glycerol.
To evaluate the contribution of Stl1p in glycerol accumulation in
hyperosmotically stressed wine yeast, glycerol accumulation was compared under
stressed and non-stressed conditions. Stressed conditions induced glycerol uptake
in wine yeast that was correlated to the increase in STLl expression upon exposure
to the saline stress (Figure 4.1.1).
84

(A) 50
c • K1-V1116 non-stressed o :w ... K1-V1116 stressed .!! 400 :s E-:-S ~300 cv,;. -Q)
e =a 200
~! m _ 100
.Y ~
Ol~-T--r--r~~~~--r-~-'--~-' o 1 2 3 4 5 6 7 8 9 10 11
Time (min)
(B)
*** NS
(C)
K1-V1116 stressed K1-V1116 no:n-stressed
Figure 4.5.3: Comparison of glycerol uptake in stressed and non .. stressed wine yeast. (A) glycerol uptake (8) initial glycerol uptake rate and (C) comparison of [14C]glycerol accumulation after 7 minutes in stressed cells with and without the addition of CCCP and non stressed cells. *** The difference between the means was extremely significant at the 95% confidence interval (n=3, P=O.OOOl). ** The difference between the means was very significant at the 95% confidence interval (n=3, P=O.0015). NS- no significant difference between the means.
85

Wine yeast cells presented an approximately two-fold increase in the glycerol
initial uptake rate and accumulation compared to non-stressed cells (Figure 4.S.3.A
and H). Furthermore, the level of glycerol accumulated by non-stressed cells was
comparable to the level of glycerol accumulated when stressed cells were incubated
with CCCP (Figure 4.S.3.A and H, C). This means that the background level of glycerol
entering the cell through mechanisms other than Stl1p constitute approximately
half of the glycerol accumulated in stressed wine yeast cells, as observed for
laboratory parent strain.
86

Part 2- Stllp activity in Icewine and dilute Icewine juice fermentations
To investigate if Stl1p has a role in glycerol uptake in hyperosmotically stressed
yeast cells fermenting Icewine, two fermentations were set up (section 3.9-3.10).
One with Icewine juice and the second with diluted Icewine juice, containing half of
the concentration of soluble solids found in the Icewine juice. The latter
fermentation represents conditions at which yeast is exposed to mild hyperosmotic
stress and therefore acts as the control condition of table wine fermentation.
The role of Stl1p in wine yeast was investigated first at the RNA level using
Northern analysis (section 3.12) and second at the protein level using (14C]glycerol
uptake assay (section 3.11).
4.6 STL1 expression in wine yeast fermenting Riesling and Vidal Ice wine juices
To investigate the role of Stl1p in hyperosmotically stressed Icewine yeast cells
at the gene level, STLl expression was compared between cells fermenting Icewine
and diluted Icewine (section 3.11). This was done using two different types of
Icewine juices, Vidal and Riesling.
Northern analysis of STL1 expression showed that the gene is not expressed
under dilute conditions in wine yeast fermenting either Vidal or Riesling juice,
however it is expressed under Icewine conditions (Figure 4.6.1).
87

(A) Riesling juice (B) Vidal juice
STLl
Day I 4 5 6 7 4 5 6 7
J Dilute juice Icewine juice
I 2 345 234 5
J Dilute juice Icewine juice
Figure 4.6.1: Expression of STLl in wine yeast during Riesling/Vidal Icewine and dilute Icewine fermentations using Northern analysis. RNA of salt stressed BY 4742 yeast cells was used as control.
Under Riesling Icewine fermentation STLl was expressed in days 4-7, increasing
in expression during that period based on signal intensity. Surprisingly, STLl was
weakly expressed in cells fermenting the Vidallcewine juice at days 4 and 5 of the
fermentation. These results were unexpected since Martin (2008) found that STLl
was strongly expressed in cells fermenting Vidallcewine juice by using both
Northern analysis and microarray analysis. However, in this experiment a different
lot of Vidallcewine juice was used.
Despite the fact that STL1 was differentially expressed in this study, the degree
of STLl differential expression could not be accurately quantified within the
timeframe of this thesis study due to technical complications with the breakdown of
the phosphoimager machine.
88

4.7 Stllp activity in wine yeast during Icewine fermentation
Stl1p activity was compared between cells fermenting Icewine and diluted
Icewine that were harvested at day 7 of Riesling fermentation and day 4 of Vidal
fermentation (section 3.11).
It appears that glycerol concentration in the fermentation media was correlated
to the degree ofhyperosmotic stress. Cells fermenting Icewine juice produced
significantly greater levels of glycerol compared to dilute Icewine fermenting cells at
the day the cells were harvested for glycerol uptake assay (Table 4.7.1). This
glycerol was measured in the fermentation media rather than inside the cells,
indicating that the cells released the glycerol that was produced in response to
hyperosmotic stress.
Interestingly, the level of glycerol concentration measured in Riesling and Vidal
Icewine fermentation media was comparable, despite the fact that there was a
difference of two days between the fermentations. Also, the concentration of
glycerol in the fermentation media was quite similar between the Icewine and the
diluted juice media despite the different osmotoic stress the cells were under and
their different rates of sugar consumption.
Even though yeast fermenting Riesling Icewine juice were (1) subjected to
greater degree of hyperosmotic stress, (2) induced STLl and (3) produced higher
levels of glycerol at the day the cells were harvested for [14C]glycerol assay, glycerol
uptake levels were not significantly different than cells fermenting diluted Icewine
juice (Figure 4.7.1). Similarly, no difference in glycerol uptake was detected between
89

the Vidal Icewine and diluted Icewine fermenting cells, despite the difference in the
degree of hyperosmotic stress between the two fermentation conditions.
Table 4.7.1: Glycerol concentration in Riesling and Vidal fermentation media measured on the day the cells were harvested for (14C]glycerol uptake assay
Vidal day 5 Riesling day 7 Icewine
Glycerol (g/L) 4.53 ± 0.00 Glycerol produced (g/L) 2.78 ± 0.00 Glucose (g/L) 149.4 ± 1.51 Fructose (g/L) 205.3 ± 6.70
Total sugar consumed (g/L) 31.66 ± 2.60
Glycerol produced/sugar 0.0879 ± 0.005 consumed
(A) Riesling 120
c • Diluted Icewine o i 100
'3~ e i 80
B ~ g "g _ C) 60 0_ ; '0 ~ i 40
C) -JS 20
W
1 2 3 4 5 6 7 8 9 10 11
Time (min)
Diluted Icewine 3.96 ± 0.01 2.86 ± 0.01 27.3 ± 1.20 75.7 ± 0.87
87.2 ± 1.03
0.0328 ± 0.006
(B) 120
Icewine Diluted Icewine 4.49 ± 0.00 4.17 ± 0.02 2.63 ± 0.07 2.64 ± 0.10 173.4 ± 2.8
241.5 ± 4.07
38.89 ±.1.15
0.0677 ± 0.001
Vidal
37.3 ± 1.5 95.7 ± 2.9
89.5 ± 3.78
0.0295 ± 0.004
• Diulted Icewlne • Icewine
O+-~~-'--r-.--r~~~~'-~ o 1 2 3 4 5 6 7 8 9 10 11
Time (min)
Figure 4.7.1: (14C]glycerol uptake at 4 mM glycerol in wine yeast K1-Vll16 fermenting (A) Riesling and (8) Vidal Icewine and diluted Icewine juices.
To better understand whether Stllp has any contribution to active glycerol
uptake during Icewine fermentation, the cells were incubated with CCCP to dissipate
90
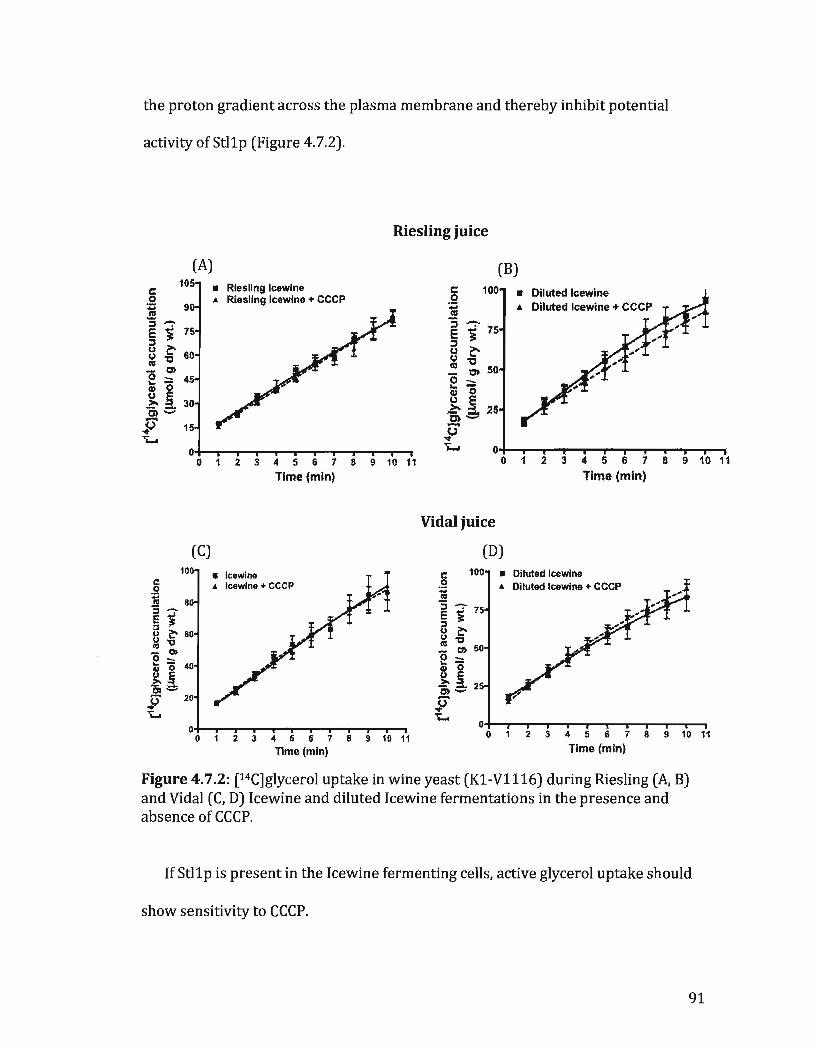
the proton gradient across the plasma membrane and thereby inhibit potential
activity of Stl1p (Figure 4.7.2).
(A) 10 a i 90
"S • e i 75 ::J
8 ~ 60 IV
- Q) o - 4 ;'0 ~! 30 Q) -
P' .....
• Riesling lcewine "' Riesling Icewine + CCCP
Riesling juice
(B) 100 • Diluted Icewine
O+-~-r-T~~~~~-r-T~~ o 1 2 345 6 7 8 9 10 11
O+-~-T~~~~-r-'--~~~~ o 1 2 3 4 5 6 7 8 9 10 11
Time (min) Time (min)
Vidal juice
(C) (D) 100 • Icewine • Diluted Icewine
... lcewlne + CCCP ... Diluted Icewlne + CCCP
O!+-~-r~-'~~r-~~-r~~ o 1 2 3 4 5 6 78 9 10 11 3 4 5 6 7
Time (min) 8 9 10 11
Time (min)
Figure 4.7.2: [14C]glycerol uptake in wine yeast (K1-Vll16) during Riesling (A, B) and Vidal (C, D) Icewine and diluted Icewine fermentations in the presence and absence of CCCP.
If Stl1p is present in the Icewine fermenting cells, active glycerol uptake should
show sensitivity to CCCP.
91

Results show that glycerol accumulation in the presence of CCCP was not
significantly different than control conditions, where no CCCP was added, under
either Icewine or diluted Icewine fermentations for both Riesling and Vidal juices
(Figure 4.7.2). These results suggest that wine yeast did not use StUp for active
glycerol uptake on the day the cells were harvested during Icewine fermentations
and StU p was perhaps glucose inactivated. It is most likely that this glucose
inactivation is not specific for day five of fermentation, however to confirm that,
Stllp activity should be measured throughout the course of the fermentation.
92

Part 3-STLl sequencing
4.8 STU sequence alignment
STLl sequence alignment scored 99% similarity and 99.5% identity between
sequences of wine and laboratory strains (Appendix. Figure I). Out of 1710
sequenced base pairs of STLl gene (section 3.13) there were 7 codon variations
(Table 4.8.2). Four of the codon variations encoded for the same amino acid,
therefore, these were silent mutations and the other three variations encoded for an
amino acid with the same biochemical properties, hence synonymous mutations.
Substitution in the predicted amino acid sequence occurred in the center of Stl1p
within the predicted transmembrane domain (TM) 6 (beta-sheet), between the fifth
and the sixth TM (beta-sheet), and between sixth and the seventh TM (a-helix).
These mutations did not affect the predicted secondary structures that constitute
these domains since they are favored substitution in membrane proteins, according
to predicted computational structure analysis.
Figure 4.8.1: The predicted 3D structure of Stl1p.
93

Table 4.8.2: Codon variations in STLl sequence oflaboratory and wine yeast strains. Grey background represents silent mutations and white background represents synonymous mutations.
Nucleotide K1Vll16 BY4742
position Codon Amino Codon Amino
TM Domain
acid acid (Figure 4.8.1)
579 TIT Phe(193} TIG Leu (193) Between 5 and 6
640 TIC Phe(214} eTC Leu (214) 6
836 AAT Asn (279) AGT Ser (279) Between 6 and 7
94

5 DISCUSSION
The purpose of this study was to investigate the role of Stl1p in glycerol uptake
in wine yeast cells during Icewine fermentation. In order to accomplish this goal,
first, a glycerol uptake assay dependent on Stl1p had to be developed, and then
applied to wine yeast fermenting Icewine juice. After successfully developing this
assay, our results show that even though STLl was expressed in Icewine fermenting
cells, there was no measurable activity of Stll p using the developed assay on the day
the cells were harvested from the Icewine fermentations.
Part i-Development of Stlip-dependent glycerol uptake assay
5.1 STL1 is induced in response to saline stress in wine and laboratory yeast
strains but not in control strain L1STLl
The development of an Stl1p-dependent glycerol uptake assay involved two
major steps: first, determination of conditions that stimulated STLl expression in
the laboratory yeast strain BY 4742 where no expression was detected in the
negative control.t1STL1; and second, developing an Stl1p activity assay using cells
that express STLl and using the L1STLl strain as a negative control to test the
specificity of the assay.
In the first step of this project, it was necessary to determine the hyperosmotic
stress conditions that resulted in STLl induction. This step was important in the
development of the Stl1 p-dependent glycerol uptake assay to better understand the
95

relationship between STLl expression and Stl1p activity in hyperosmotically
stressed cells. To that end, K1-Vl116, BY 4742 and LlSTLl cells were subjected to 1
M saline stress for the duration of 90 minutes. Results show that under these
hyperosmotic stress conditions, K1-Vll16 and BY4742 induced STLl upon
exposure to hyperosmotic stress (Figure 4.1.1) and therefore Stl1p is most likely
present in these cells. The absence of STL1 mRNA signal in ASTL1 cells under either
stressed or non-stressed conditions confirmed that this strain did not express STL1
and therefore, could act as a negative control during the [14C]glycerol uptake assay.
These results also indicated that harvesting the stressed cells at that time point
(after 90 minutes of saline stress) should provide the conditions to assay Stl1p
activity, since the protein is likely to be present in K1-Vll16 and BY 4742 however
absent in the control strain ASTL1 .
5.2 The effect 0/ glycerol concentration on Stllp-dependent active
[14Cjglycerol uptake measurements
In the second step of [14C]glycerol uptake assay design, it was necessary to
determine the concentration at which glycerol uptake by yeast cells presents both
specificity to Stl1p and energy dependency. Yeast cells were exposed to three
different glycerol concentrations in the reaction mixture, 4, 10 and 65 mM and
glycerol uptake rate and accumulation were compared (Sections 4.2-4.4). In the
development of this assay, the commercially available yeast strain iJSTL1 developed
from the parent strain BY 4742 where STL1 was knocked out of the genome, was
96

used to assess the background level of glycerol uptake that was not Stl1 p
dependent.
Under 4 mM glycerol, STL1 expression positively contributed to glycerol uptake
in hyperosmotically stressed cells. Several pieces of evidence support this
conclusion. First, there was a clear difference in the kinetics of glycerol uptake
between parent and L1STLl cells . .t1STLl cells followed monophasic kinetics, where
no changes in glycerol uptake rates were detected throughout the course of the
assay (Figure 4.2.1). This type of kinetics represents glycerol that entered the cell
via passive diffusion (Mattews, 1993; Petty, 1993). Conversely, the parent strain
followed biphasic glycerol uptake kinetics, starting with a high initial rate of glycerol
uptake that readily declined with time until reaching a steady state rate (Figure
4.2.1). This type of kinetics insinuates a presence of a carrier-mediated glycerol
transport, in addition to simple diffusion. Thus, STL1 deletion eliminated this carrier
mediated glycerol uptake observed in parent strain.
Second, deletion of STLl significantly reduced the initial rate of glycerol uptake
(Figure 4.2.2) suggesting that STL1 expression is essential to induce rapid glycerol
transport into hyperosmotically stressed cells. And third, incubation with the
un coupler CCCP led to approximately 50% reduction in glycerol accumulation
(Figure 4.2.3) in the parent strain over the 7 min timecourse experiment, indicating
that active glycerol uptake was exclusively inhibited in cells expressing STL1 and
not in L1STLl cells, thus, the deletion of STL1 eliminated energy dependent glycerol
accumulation.
97

It is inferred from these results that under the 4 mM glycerol concentration, the
expression of STLl increases the velocity of glycerol uptake and positively
influenced energy dependent glycerol accumulation.
It also appears that at 4 mM glycerol, the glycerol uptake assay can accurately
measure Stl1p-depedent active glycerol uptake and accumulation.
The assay was also tested at the higher glycerol concentrations of 10 mM and 65
mM glycerol concentrations that would be encountered by wine yeast fermenting
Icewine (Sections 4.3-4.4). These higher glycerol concentrations did not allow
accurate measurements of an Stl1p-dependent glycerol uptake as observed by the
lack of an energy dependent glycerol uptake in the parent strain and the non
significant difference in glycerol initial uptake rate between the parent strain and its
knockout counterpart.
Other than Stl1p, glycerol can enter the cell through facilitated diffusion
mediated by the glyceroporin Fps1p, however previously published research
showed that under hyperosmotic stress, the Fps1p channel is shut down in order to
prevent glycerol loss from the cell and increase glycerol retention (Tamas, et aI.,
2003). Therefore, the glycerol that was accumulated in L1STLl cells should not have
entered the cells via the Fsp1p channel. Alternatively, glycerol can easily cross the
yeast plasma membrane due to its lipophilic nature. That means that the measured
experimental velocity of glycerol uptake is encompassing both the contribution of
active uptake by Stl1p and passive diffusion.
98

Oliveira et al (2003) demonstrated that the higher the glycerol concentration
used to measure uptake, the higher the contribution of passive diffusion to uptake.
This was also observed in our results. Both parental and L1STLl cells presented
higher glycerol uptake rates at 10 mM glycerol compared to 4 mM, and these rates
further increased at 65 mM (Figure 4.4.5). In addition, the 65mM high glycerol
concentration abolished the biphasic kinetics formerly observed at 4 mM glycerol
and eliminated the difference in glycerol uptake rate between parent strain and
MTLl cells (Figure 4.4.1).
Enhanced passive diffusion not only influenced glycerol uptake rate but also the
uncoupling effect of CCCP. MTLl did not display sensitivity to the uncoupler at 4
mM, in opposition to the glycerol transport measured at higher glycerol
concentrations. These results are in contrast to Oliveira et al (2003) who
demonstrated that the CCCP inhibitory effect declines with glycerol concentration.
In addition, it is not clear why cells lacking the STLl gene would present energy
dependent glycerol uptake. These results suggest that Stl1p may not be the only
protein responsible for glycerol active uptake in S. cerevisiae. Yet, no other genes
that code for glycerol symporters have been reported in the literature to date that
would suport this hypothesis.
Even though Stl1p may actively transport glycerol into the cell under the 65 mM
glycerol conditions, this transport cannot be accurately measured due to the high
levels of non Stl1 p-dependent uptake of glycerol. This conclusion also holds true for
the wine yeast strain tested since it appeared to behave similarly to the parental
99

strain in relation to glycerol uptake rate and sensitivity to CCCP, under either high
or low glycerol concentrations.
Another limiting factor that can influence Stl1p-depenent glycerol uptake is the
degree of Stll p induction upon exposure of the parent cells to hyperosmotic stress.
Stllp induction could be optimized in order to increase the glycerol uptake rate and
accumulation in the parent strain, further away from background glycerol uptake.
Optimization of Stl1p induction may be advantageous since it can improve the
specificity of Stll p-dependent glycerol uptake at 65 mM glycerol, where background
glycerol uptake was shown to be too high, and resulted in non-specific glycerol
uptake.
What is the contribution of Stl1p to glycerol accumulation in response to
hyperosmotic stress? Salt induction of STLl by 3.4 fold in wine yeast led to a two
fold increase in the glycerol uptake rate (Figures 4.1.1 and 4.1.2). This suggests that
glycerol uptake rate is STL1-dose-dependent. The higher the expression of STL1, the
greater the effect on glycerol uptake rate in the wine yeast. Interestingly, glycerol
accumulation increased by 2-fold as well and this increase was eliminated by CCCP
to the same level of glycerol that was accumulated under non-stressed conditions
(Figure 4.5.3.B). It appears that the contribution of Stl1p to glycerol accumulation
constitute roughly half of the glycerol accumulated in the cell in response to
hyperosmotic stress. Therefore, the other half of glycerol accumulated represents
glycerol that entered the cell via other transport mechanism such as passive
diffusion.
100

Even though both wine and laboratory yeast strains were exposed to the same
conditions of salt stress, STLl expression was higher in laboratory yeast strain.
However, Stl1p activity was comparable between the two strains. These results
further demonstrates that laboratory yeast strain response to hyperosmotic stress
differ than wine yeast strain at the level of Stl1p-depenedent glycerol uptake, in
addition to the differences that are were previously presented in the gene
expression (Borneman et al., 2008).
All these evidence indicate that in wine yeast at 4 mM glycerol (1) glycerol
uptake measured in the assay is Stl1 p-dependent and (2) glycerol accumulation is
energy dependent. On the contrary at 65 mM glycerol, neither Stl1p-dependant
uptake nor energy dependent glycerol accumulation could be accurately measured.
101

Part 2- Stllp activity in cells fermenting Icewine and dilute Icewine juice
5.3 STLl was expressed in yeast during Icewine fermentation
STLl was weakly expressed in cells fermenting Vidal Icewine juice but clearly
induced in cells fermenting Riesling Icewine juice over the first 7 days of
fermentation (Figure 4.6.1). In the fermentations, day 4 was chosen as the harvest
day for the Vidal fermentations and day 7 was chosen for the Riesling fermentations,
timepoints where a differential expression of STLl was evident at the day the cells
were harvested for the [14C]glycerol uptake assay. Surprisingly, a signal for STLl
expression in was not evident in cells fermenting either Vidal or Riesling diluted
Icewine juice. This lack of expression signal for STLl in the dilute juice
fermentations was surprising based on previous results in Vidal fermentations
(Martin, 2008). Martin (2008) demonstrated that STLl expression was upregulated
in cells fermenting diluted Vidal Icewine during days 2-4 of the fermentation,
showing a strong expression on day 4.
More surprising was the weak STLl expression during Vidal Icewine
fermentation, which once again is in contrast to the findings of Martin (2008) who
showed a strong expression of the gene in cells fermenting the same juice type.
It is not clear why cells fermenting Vidal Icewine juice exhibited low STLl
expression. These results could not have been derived from STLl glucose repression
where STLl transcription is inhibited by glucose, since it was previously shown that
STLl was expressed despite the presence of high glucose concentration in the juice
(Martin, 2008; Erasmus et al, 2003) and STLl was expressed in cells fermenting
102

Riesling Icewine juice. It is probable that this discrepancy resulted from variability
among the different Vidal Icewine juice lots. Even though the degree of
hyperosmotic stress was comparable to the previous study (Martin, 2008), the
chemical composition of the Icewine juice may still differ. The composition of the
Icewine juice changes from harvest to harvest depending on different factors such
as the environmental conditions the grapes are exposed to, grape ripeness, humidity
and more. These factors influence the chemical composition of the grape, and
thereby the initial Icewine juice parameters. Vidal Icewine juice parameters that
include the initial concentrations of titratable acidity, assimilable amino acid
nitrogen, reducing sugars and pH, appear to differ depending on the year of harvest
(Kontkanen et aI, 2004; Pigeau and Inglis, 2005; Martin, 2008). For instance, the pH
of Vidal Icewine juice used by Kontkanen et al (2004) was 0.6 pH units lower than
the Vidal Icewine juice used by Martin (2008) and Pigeau and Inglis (2005). It is not
known how or if this difference in juice acidity influences the transcriptional
regulation of STLl.
Alternatively, the low induction of STLl during Vidal Icewine fermentation may
be a result of experimental error. This potential error could not have resulted from
weak binding of the STLl probe to the membrane bound mRNA during the
hybridization procedure, since the same probe demonstrated a strong hybridization
signal with a positive control mRNA (Figure 4.6.1). Furthermore, no visible evidence
for experimental error was detected during RNA isolation procedure, besides
relatively low RNA yields.
103

Since Northern blot analysis methods exhibits relatively low sensitivity and
requires large amounts of mRNA to accurately quantify gene expression, an
alternative method should be used. Real time polymerase chain reaction is a
relatively new method that allows rapid and sensitive quantification of gene
expression levels (Jiirgen & Maurizio, 2005) and requires about 20 times less RNA
for a single test than Northern blot hybridization as used in our study. In addition,
this method allows a faster quantification ofthe mRNA fraction, using the internal
transcribed spacers ITSl as an internal control gene for the normalization
procedure.
These advantages will allow enhanced accuracy in RNA quantification when
isolation procedure fails to extract satisfactory quantities for Northern analysis.
5.4 Hyperosmotically stressed cells fermenting Icewine did not present active glycerol uptake
Wine yeast fermenting Icewine juice did not show a significant difference in
glycerol uptake compared to diluted Icewine juice in either Vidal or Riesling juice,
even though Icewine fermenting cells were exposed to greater hyperosmotic stress
(Figure 4.7.1). Furthermore, no evidence for active glycerol uptake was detected
upon the addition of the uncoupler under either Icewine or diluted Icewine
fermentations (Figure 4.7.2).
104

The glycerol concentration in the Icewine fermentation media was significantly
greater than the glycerol concentration found in the diluted Icewine fermentation as
observed in previous studies (Martin, 2008; Pigeau and Inglis, 2005).
Furthermore, Icewine fermenting cells produced more than twice of the glycerol
produced by diluted Icewine fermenting cells, for the same amount of sugar
consumed for both juice types (Table 4.7.1) as previously observed by Martin
(2008) and Pigeau and Inglis (2005). It was hypothesized in this project that Stllp
has a role in the uptake of the glycerol that was initially present in the fermentation
media and subsequently released during fermentation, to increase the level of
intracellular glycerol and counteract the dehydration effect of the Icewine juice.
However, hyperosmotically stressed cells harvested from Vidal and Riesling Icewine
fermentations on day 4 and 7 respectively did not show energy dependent glycerol
uptake activity that differed between cells in the Icewine or diluted Icewine
conditions (Figure 4.7.2.A and C).
Even more surprising was the absence of active glycerol uptake specifically in
the cells fermenting Riesling Icewine juice, since these cells induced STLl at the day
of their harvest (Figure 4.6.1.A).
Why did hyperosmotically stressed cells not show an energy depended glycerol
uptake however still expressed STLl during Riesling Icewine fermentation?
The fact that active glycerol uptake was not detected in hyperosmotically stressed
wine yeast cells despite the increase in glycerol concentration in the fermentation
media suggests that Stl1p was probably glucose inactivated in wine yeast. These
105

results are in contrast to the findings of Ferreira et al (2005), who showed that Stl1p
glucose inactivation was overcome by saline hyperosmotic stress in laboratory yeast
cells grown on glucose based media (Ferreria, et al., 2005).
These results may imply that overcoming Stll p glucose inactivation in S.
cerev;s;ae depends on the type of stressor used to induce the hyperosmotic stress.
Salt induces Stllp active glycerol uptake whereas the high concentration of soluble
solids in the Icewine juice most likely leads to Stl1p glucose inactivation and
subsequent inhibition of active glycerol uptake.
In addition to the type of stressor, overcoming Stl1p glucose inactivation may
also depend on the yeast strains. Studies have shown that response of laboratory
yeast strain to hyperosmotic stress differs from commercial yeast strain at the
transcriptional level (Rep, et al, 2000; Pigeau and Inglis, 2005, Erasmus et al, 2003;
Martin, 2008). In addition, Kayingo et al (2009) demonstrated that unlike glucose
inactivated Stl1p oflaboratory strain of S. cerev;s;ae under non-stressed conditions,
the activity of C. albicans glycerol symporter is unaffected by carbon source
(Kayingo, et al. 2009). Borneman at al. (2008) demomstrated that 0.6% of the whole
genome and 0.4% of predicted proteome differ between the laboratory and wine
yeast strains. These genomic variations may lead to Stl1p glucose inactivation in
wine strain, but not in laboratory strain during hyperosmotic stress.
Therefore, it is likely that overcoming Stllp glucose inactivation by
hyperosmotic stress may be a strain-dependent event in addition to the type of
solute used to stress the cells.
106

The absence of energy dependent glycerol uptake measured in cells fermenting
Icewine could also have resulted from low sensitivity ofthe designed [14C]glycerol
assay. The sensitivity of glycerol uptake assay was initially fixed to allow
measurements of energy dependent glycerol uptake of salt stressed wine yeast
grown on ethanol-based media. Taking into account the degree of STLl expression
in wine yeast under these conditions, it was determined that the designed assay
showed competency to measure Stl1p active glycerol uptake. However, this degree
of sensitivity was not sufficient to measure glycerol uptake in Icewine and diluted
Icewine fermenting cells. For that reason, the cell concentration in the reaction
mixture had to be increased by 1.5-fold in order to increase the assay sensitivity.
Still, the maximum level of glycerol accumulation in cells fermenting Icewine juice
(Figure 4.7.1) was four times lower than the level of glycerol accumulated in wine
yeast grown on ethanol and stressed with salt (Figure 4.5.3.A). It appears that the
designed assay may present sensitivity limitations for measuring Stll p in wine yeast
during fermentation and therefore may not be suitable in its present form to detect
differences in glycerol uptake between cells that were harvested from Icewine and
diluted Icewine fermentations.
107

Part 3-STLl sequencing
5.5 Glucose inactivation and Stllp activity in wine and laboratory yeast
strains
Our results suggest that overcoming Stllp glucose inactivation by yeast under
hyperosmotic stress conditions is either solute dependent or strain-dependent.
Therefore, a third objective was set to compare the coding sequence of STLl
between laboratory and wine yeast strains of S. cerevisiae in order to evaluate for
potential variability in the predicted amino acid sequence and consequently the
predicted 3 D structure of Stl1 p of the two strains. These differences may lead to
changes in the tertiary structure of Stl1p and thereby affect the process of glucose
inactivation.
STLl coding sequence alignment of wine and laboratory yeast strains revealed
thatSTLl coding sequence was 99.5% identical between the two strains. The seven
codon variations resulted in four silent and three synonymous mutations (Figure
4.8.1). Since silent mutations do not result in amino acid substitution, these
mutations cannot influence the secondary or tertiary structure of Stl1p. On the other
hand, the synonymous mutations may affect the tertiary structure ofStl1p, even
though these are favorable amino acid substitutions for membrane proteins. It is
difficult to predict this effect without the crystal structure of Stllp, which has yet to
be investigated.
Stl1p glucose inactivation occurs through the ubiquitination of Stllp. The
addition of this short peptide targets Stllp for degradation in the vacuole. However,
108

the chemical nature of the signal targeting Stl1p glucose-induced degradation is
unknown.
Glucose inactivation of fructose-1,6-bisphosphate (FBPase) has been extensively
studied. The enzyme is first reversibly inactivated by phosphorylation on a serine
residue and then irreversibly inactivated by proteolysis (Miiller and Holzer 1981).
Mutations of Serine 289 resulted in the decrease of glucose induced FBPase
inactivation (Hung et al. 2004). Interestingly our results suggest that the expected
amino acid sequence of Stl1p wine and laboratory yeast strain differs at the 279
position located between transmembranes domains six and seven. This substitution
of serine to aspargine in wine yeast strain can possibly influence the inactivation of
Stl1p in the presence of glucose, since this amino acid residue appears to be
important for the phosphorylation of proteins during glucose inactivation event. If
this is true, this substitution may eliminate Stl1p glucose inactivation in wine yeast.
However, this assumption does not agree with our conclusions that Stl1p was most
likely glucose inactivated in wine yeast during Icewine fermentation.
109

6 FUTURE DIRECTIONS
6.1 Optimization of Stl1p induction
The designed glycerol uptake assay could measure Stllp activity at 4 mM
glycerol, however, failed to do so at higher glycerol concentration such as 65 mM.
Even though Stll p may actively transport glycerol into the cell at 65 mM glycerol,
this transport cannot be accurately measured due to the high levels of background
glycerol uptake that represent the non Stllp-dependent uptake of glycerol.
In order to reduce the effect of background glycerol uptake at 65 mM glycerol,
Stllp-dependent glycerol uptake should be optimized in parent strain (BY 4742) .
Greater induction of Stllp may increase the glycerol uptake in parent strain above
background levels.
In this study, the expression of STLl was measured only at one timepoint,
after 90 minutes of 1 M NaCI hyperosmotic stress. However, it is not known at which
time cells present the peak expression of STLl, and how this expression correlates
the induction of Stllp. Therefore correlating the degree of STLl expression and the
activity of Stll p will create a dose-response curve. To that end, STLl expression
should be measured at 30, 60, 90 and 120 minutes upon exposure to 1 M NaCI
hyperosmotic stress, and at the same timepoints, the initial glycerol uptake rate
should also be measured to in laboratory strain. The relationship between the
degree of STLl expression and Stllp-dependent glycerol uptake will present the
dose-response curve of Stllp. This curve will allow to determine (1) if glycerol
110

uptake in parent strain cells depends on the concentration of Stll p in the cell
membrane, and (2) the timepoint at which Stl1 p induction peaks throughout the
time course of hyperosmotic stress. Harvesting the cells at the timepoint of Stll p
peak activity will potentially increase the levels of glycerol uptake, above
background glycerol uptake, at 65 mM glycerol.
6.2 Further investigation 0/ wine yeast Stllp glucose inactivation
The fact that active glycerol uptake was not detected in hyperosmotically
stressed wine yeast cells despite the high concentration of soluble solids in the
Icewine juice suggests that Stl1p was glucose inactivated in KI-Vll16 strain cells.
Because Icewine juice is a complex media that comprises different metabolites and
chemicals, it is important to make certain that the absence of active glycerol uptake
in Icewine fermenting cells directly resulted from Stllp glucose inactivation, rather
than inhibition by the components in the Icewine juice.
To that end, it is necessary to provide further supporting evidence for Stl1p
glucose inactivation in wine yeast harvested from Icewine fermentation. In order to
confirm that glucose is the component in the Icewine juice that is responsible for the
inhibition of energy dependent glycerol uptake in wine yeast cells fermenting
Icewine juice, the activity of Stl1p should be explored in wine yeast cells in the
presence and absence of glucose. Stl1p activity will be measured in cells suspended
in a buffer media containing glucose concentrations that are normally found in
Icewine juice (200 gjL).
111

To show that Stllp in wine yeast is glucose inactivated as previously
demonstrated in laboratory yeast strain (Ferreira, et aI, 2005), Stllp-dependent
glycerol uptake assay used in this project will be adjusted to measure Stllp activity
in the presence of glucose.
In the first step, the inhibition of active glycerol uptake in parent strain due to
Stllp glucose inactivation will be validated in laboratory strain of S. cerevisiae, and
therefore will act as control for Stllp inhibition in wine yeast. Kl-Vll16, BY4742
and L1STLl cells will be grown on ethanol-based media and stressed with 1 M NaCI
to induce STLl. The induction of STLl in parent and wine yeast strains and the lack
of STLl expression in the control strain L1STLl will be confirmed using Northern
analysis, as it was done for this project.
The cells will then be harvested for [14C]glycerol uptake assay to measure Stllp
dependent active glycerol uptake using the same STLl induction conditions.
Following that, cells harvested from the same experiment will be suspended in a
buffer solution containing 2 giL of glucose (11 mM) for 30 minutes. Ferreira et al.
(2005) demonstrated that when laboratory strain cells grown on non-fermentative
carbon source were shifted to media containing 2 giL of glucose, Stll p was
completely glucose inactivated after 30 minutes of exposure to glucose, however it
is not known if Stllp is glucose inactivated in wine yeast under the same conditions.
After validating that STLl was induced and Stll p activity is present in ethanol
grown laboratory yeast cells, Stllp-dependent glycerol uptake will be measured
once again, following the incubation with glucose and compared between the two
112

conditions. If the difference in the initial glycerol uptake rate between parent strain
and LlSTLl is eliminated in the presence of glucose, it is possible to infer that active
glycerol uptake was inhibited in laboratory yeast strain due to glucose addition, as
observed by Ferreria et al (2005). To test if this glycerol uptake is an energy
dependent process, the % reduction in glycerol accumulation will be compared
before and after the addition of glucose, in the presence and absence of CCCP. If
parent strain cells incubated with glucose does not present a significant difference
in glycerol reduction upon incubation with CCCP compared to LlSTLl cells, it is
possible to conclude that active glycerol uptake is inhibited in parent strain cells due
to StUp glucose inactivation. The same procedure will be used to test Stllp glucose
inactivation for laboratory yeast cells suspended in 200 gIL of glucose, a
concentration of glucose that is often present in the Icewine juice.
Upon validation of StU p-glucose inactivation using the control assay with
laboratory yeast strain, the assay will be applied to measure Stll p activity in wine
yeast strain in the presence of glucose.
Using the same procedure as determined for the control assay, the initial
glycerol uptake rate will be compared before and after incubation with glucose. To
test for active glycerol uptake, glycerol accumulation will be compared in the
presence and absence of CCCP with and without the 30 minutes incaution with 2 gIL
of glucose. Reduction in the initial rate of glycerol uptake upon exposing the cells to
glucose will indicate that glycerol uptake is partially inhibited in the presence of
glucose. If the level of glycerol accumulation in wine cells will not be affected by the
113

addition of CCCP in the presence of glucose, it will indicate that active glycerol
uptake was inhibited due to Stllp glucose inactivation.
Salt-induced hyperosmotic stress was previously shown to overcome glucose
inactivation in laboratory yeast strain, however it is not known if sugar-induced
hyperosmotic stress results in the same outcome. Therefore, in the last step, Stllp
glucose inactivation will be evaluated in wine yeast using the same approach except
the cells will be exposed to 200 giL glucose solution (1.1 M), a concentration of
glucose that is often encountered by yeast during Icewine fermentation. If Stllp
glucose inactivation can overcome by glucose-induced hyperosmotic stress, the
glycerol initial uptake rate will not change upon exposure to glucose stress, and the
cells should experience sensitivity to CCCP, indicating of energy dependent glycerol
transport.
7 CONCLUSIONS
We concluded that active glycerol uptake is not detected in wine yeast during
Icewine fermentation, most likely due to Stllp glucose inactivation, Therefore, Stllp
cannot contribute to the dissipation of the proton gradient and the limited cell
growth observed during the process of Icewine fermentation.
114

8 LITERATURE CITED
Albertyn, J., Hohmann, S., Thevelein, J. M., & Prior, B. A. (1994). GPD1, which encodes glycerol-3-phosphate dehydrogenase, is essential for growth under osmotic stress in Saccharomyces cerecisiae, and its expression is regulated by high-osmolarity glycerol response pathway. Molecular and Cellular Biology, 14, 4135-4144.
Alepuz, P. M., de Nadal, E., Zapater, M., Ammerer, G., & Posas, F. (2004). Osmostressinduced transcription by Hotl depends on a Hogl-mediated recruitment of the RNA Pol II. The EMBO Journal, 22, 2433-2442.
Alepuz, P. M., Jovanovic, A., Reiser, V., & Ammerer, G. (2001). Stress~Induced MAP Kinase Hogl Is Part of Transcription Activation Complexes. Molecular Cell" 7, 767-777.
Ansell, R., Granath, ,. K., Hohmann, ,. S., Thevelein, ,. J., & Adler, L. (1997). The two isoenzymes for yeast NAD+-dependent glycerol- 3-phosphate dehydrogenase encoded by GPD1 and GPD2 have distinct roles in osmoadaption and redox regulation. EMBO Journal, 16, 2179-2187.
Blomberg, A. (1995). Global changes in protein synthesis during adaptation of the yeast Saccharomyces cerevisiae to 0.7 M NaCI. Journal 0/ Bacteriology, 177, 3563-3572.
Blomberg, A. (2000). Metabolic surprises in Saccharomyces cerevisiae during adaptation to saline conditions: questions, some answers and model. FEMS Microbiology Letters, 182, 1-8.
Blomberg, A., & Adler, L. (1989). Roles of glycerol and glycerol-3-phosphate dehydrogenase (NAD+) is acquired osmotolerance of Saccharomyces cerevisiae. Journal o/Bacteriology, 171, 1087-1092.
Blomberg, A., & Adler, L. (1992). Physiology of osmotolerance in fungi. Advances in Microbiial Physiology, 33,145-212.
Bloomberg, A. (1997). The osmotics hypersensitivity of the yeast Saccharomyces cerevisiae is strain and growth media dependent; Quantitative aspects of the phenomenon. Yeast, 13, 529-539.
Borneman, A. R., Forgan, A. H., Pretorius, I. S., & Chambers, P. J. (2008). Comparative genome analysis of a Saccharomyces cerevisiae wine strain. FEMS Yeast Research, 8, 1185-1195.

Bosson, R, Jaquenoud, M., & Conzelmann, A (2006). GUPl of Saccharomyces cerev;s;ae Encodes an O-Acyltransferase Involved in Remodeling of the GPI Anchor. Molecular and Cellular Biology, 17,2636-2645.
Boulton, R B. Principles and Practices o/Winemaking. Maryland: Aspen Publishers, Inc.
Bourges, I., Mucchielli, M., Herbert, C. J., Guiard, B., Dujardin, G., & Meunier, B. (2009). Multiple defects in the respiratory chain lead to the repression of genes encoding components of the respiratory chain and TCA cycle enzymes. Journal 0/ Molecular Biology, 387, 1081-1091.
Carrasco, P., Querol, A, & del Olmo, M. (2001). Analysis of the stress resistance of commercial wine yeast strains. Archives o/microbiology, 175,450-457.
Cordier, H., Mendes, F., Vasconcelos, I., & Fran~ois, J. M. (2007). A metabolic and genomic study of engineered Saccharomyces cerevisiae strains for high glycerol production. Metabolic Engineering, doi:l0.l016/j.ymben.2007.03.002.
Daran-Lapujade, P., Jansen, M. L., Daran, J., van Gulik, W., de Winde, J. H., & Pronk, J. T. (2003). Role of transcriptional regulation in controlling fluxes in central carbon metabolism of Saccharomyces cerevisiae. The Journal 0/ Biological Chemistry, 279, 9125-9138.
Darin, B. 0., & Gorman, J. A (1999). The Extracellular Domain of the Saccharomyces cerevisiae Slnlp Membrane Osmolarity Sensor Is Necessary for Kinase Activity. Journal o/Bacteriology, 181, 2527-2534.
de Nadal, E., Alepuz, P. M., & Posas, F. (2002). Dealing with osmostress through MAP kinase activation. EMBO Reports, 3, 735-740.
de Nadal, E., Zapater, M., Alepuz, P. M., Sumoy, L., Mas, G., & Posas, F. (2004). The MAPK Hogl recruits Rpd3 histone deacetylase to activate osmoresponsive genes. 427,370-374.
Erasmus, D. J., van der Merwe, G. K., & van Vuuren, H. J. (2003). Genome-wide expression analysis: Metabolic adaptation of Saccharomyces cerevisiae to high sugar stress. FEMS Yeast Research, 3, 375-399.
Ferreria, c., & Lucas, C. (2007). Glucose repression over Saccharomyces cerevisiae glyceroljH+ symporter gene STLl is overcome by high temperature. FEBS Letters, 581,1923-1927.
116

Ferreria, c., van Voorst, F., Martins, A, Neves, L., Oliveira, R., Keilland-Brandt, M. c., et al. (2005). A member of the sugar transporter family, Stllp is the glycerolfH+ symporter in Saccharomyces cerevisiae. Molecular Biology of the Cell, 16,2068-2076.
Gancedo, J. M. (1998). Yeast Carbon Catabolite Repression. MICROBIOLOGY AND MOLECULAR BIOLOGY REVIEWS, 62,334-361.
Gao, Z., Maurousset, L., Lemoine, R., Yoo, S. D., van Nocker, S., & Loescher, W. (2003). Cloning, expression, and characterization of sorbitol transporters from developing sour cherry fruit and leaf sink tissues. Plant Physiology, 131, 1566-1575.
Gasch, A P., Spellman, P. T., Kao, C. M., Carmel-Harel, 0., Eisen, M. B., Storz, G., et al. (2000). Genomic expression programs in the response of yeast to environmental changes. Molecular Biology of the Cell, 11,4241-4257.
Gustin, M. C., Albertyn, J., Alexander, M., & Davenport, K. (1998). MAP kinase pathways in the yeast Saccharomyces cerevisiae. Microbiology and Molecular Biology Reviews, 6, 1264-300.
Haurie, V., Perrot, M., Mini, T., Jeno, P., Sagliocco, F., & Boucherie, H. (2001). The transcriptional activator Cat8p provides a major contribution to the reprogramming of carbon metabolism during diauxic shift in Saccharomyces cerevisiae. The Journal of Biological Chemistry, 276, 76-85.
Haurie, V., Perrot, M., Mini, T., Jeno, P., Sagliocco, F., & Boucherie, H. (2001). The Transcriptional Activator Cat8p Provides a Major Contribution to the Reprogramming of Carbon Metabolism during the Diauxic Shift in Saccharomyces cerevisiae. The Journal of Biological Chemistry, 276, 76-85.
Hirayama, T., Maeda, T., Saito, H., & Shinozaki, K. (1995). Cloning and characterization of seven cDNAs for hyperosmolarity-responsive (HOR) genes of Saccharomyces cerevisiae. Molecular and General Genetics MGG ,249, 127-138.
Hofmann, K. (2000). A superfamily of membrane-bound O-acyltransferases with implications for wnt signaling. Trends in Biochemical Sciences, 25, 111-112.
Hohmann, S. (2009). Control of high osmolarity signalling in the yeast Saccharomyces cerevisiae. FEBS Letters I 583,4025-4029.
Hohmann, S. (2002). Osmotic Stress Signaling and Osmoadaptation in Yeasts. Microbiology and Molecular Biology Reviews I 66, 300-372.
Hohmann, S., & Mager, W. H. (2003). Yeast stress responses (1 ed.). New York, New York: Springer.
117

Hohmann, S., Krantz, M., & Nordlander, B. (2007). Yeast Osmoregulation. Methods in Enzymology, 428, 29-45.
Holst, B., Lunde, c., Lages, F., Oliveira, R, Lucas, c., & Kielland-Brandt, M. C. (2000). GUPl and its close homologue GUP2, encoding multimembrane-spaning proteins involved in active glycerol uptake in Saccharomyces cerevisiae. Molecular Microbiology ,37,108-124.
Horak, I. (1986). Amino acid transport in eucaryotic microorganisms. Biochimica et Biophysica Acta ,864,223-256.
Hung, G. c., C. R Brown, A B. Wolfe, J. J. Liu, and H. L. Chiang. (2004) Degradation of the gluconeogenic enzymes fructose-l,6-bisphosphatase and malate dehydrogenase is mediated by distinct proteolytic pathways and signaling events. I BioI Chern. 279, 49138-50.
Jiirgen, F., & Maurizio, P. (2005). Encyclopedia of medical genomics and proteomics. New York: Marcel Dekker.
Johnston, M., & Carlson, M. (1992). The Molecular and Cellular Biology of the Yeast Saccharomyces: Gene expression (1st ed., Vol. 2).0. R Broach, J. R Pringle, & E. w. lones, Eds.) NY: Cold Spring Harbor Lab Press.
Karlgren, S., Pettersson, N., Nordlander, B., Mathai, I. c., Brodsky, J. L., Zeidel, M. L., et al. (2005). Conditional osmotic stress in yeast. The Journal of Biological Chemistry I 280,7186-7193.
Kayingo, G., Martins, A, Andrie, R, Neves, L., Lucas, c., & Wong, B. (2009). A permease encoded by STLl is required for active glycerol uptake by Candida albicans. Microbiology ,55, 1547-1557.
Kontkanen, D., Inglis, D. L., Pickering, G. I., & Reynolds, A (2004). Effect of yeast inoculation rate, acclimatization and nutrient additon on Icewine fermentation. American Society for Enology and Viticultur ,55,363-370.
Lages, F., & Lucas, C. (1995). Characterization of a GlycerolfH+ Symport in the Halo tolerant Yeast Pichia sorbitophila. Yeast,ll, 111-119.
Lages, F., & Lucas, C. (1997). Contribution to the physiological characterization of glycerol active uptake in Saccharomyces cerevisiae. Biochimica Biophysica Acta / 1322,8-18.
118

Larsson, K., Ansell, R., Eriksson, P., & Adler, L. (1993). A gene encoding sn-glycerol 3-phosphate dehydrogenase (NAD+) complements an osmosensitive mutant of Saccharomyces cerevisiae. Molecular microbiology, 10, 1101-1111.
Levin, D. E. (2005). Cell wall integrity signanling in Saccharomyces cerevisiae. Microbiology and Molecular Biology Reviews~ 69,262-291.
Lucas, c., Costa, M. D., & Van Uden, N. (1990). Osmoregulatory Active SodiumGlycerol Co-transport in the Halotolerant Yeast Debaryomyces hansenii. Yeast, 6, 187-191.
Luyten, K., Albertyn, J., Skibbe, W., Prior, 8., Ramos, J., Thevelein, J. M., et al. (1995). Fps1, a yeast member of the MIP famly of channel proteins, is facilitator for glycerol uptake and efflux and is under osmotic stress. The EMBO Journal, 14, 1360-1371.
Maeda, T., Takekawa, M., & Saito, H. (1995). Activation of yeast PBS2 MAPKK by MAPKKKs or by binding of an SH3-containing osmosensor. Science., 269, 554- 558.
Martin, S. J.(2008).The osmoadaptive response of the wine yeast Saccharomyces cerevisiae K1-Vll16 during Icewine fermentation. PhD Thesis. Saint Catharines, ON: Department of Biological sciences, Brock University.
Mas, G., de Nadal, E., Dechant, R., de la Concepcion, M. L., Logie, c., Gonzalez, S. J., et al. (2009). Recruitment of a chromatin remodeling complex by the Hog1 MAP kinase to stress genes. The EMBO Journal, 28,326-336.
Mattews, J. C. (1993). Foundamentals ofreceptor, enzyme, and transport kinetics. Boca Raton: CRC Press.
Melamed, D., Pnueli, L., & Arava, Y. (2008). Yeast translational response to high salinity: Global analysis reveals regulation at multiple levels. RNA, 14, 1337-1351.
Modig, T., Granath, K., Adler, L., & Liden, G. (2007). Anaerobic glycerol production by Saccharomyces cerevisiae strains under hyperosmotic stress. Applied Microbiology and Biotechnology, 75, 289-96.
Muller, D., Holzer, H. (1981). Regulation of fructose-1,6-bisphosphatase in yeast by phosphorylation/ dephosphorylation. Biochemical and Biophysical Research Communications. 103, 926-933.
Nelissen, 8., De Wachter, R., & Goffeau, A. (1997). Classifcation of all putative permeases and other membrane plurispanners of the major facilitator superfamily encoded by the complete genome of Saccharomyces cerevisiae. FEMS Microbiology Reviews,21,l13-134.
119

Neves, L., Lages, F., & Lucas, C. (2004). New insights on glycerol transport in Saccharomyces cerevisiae. FEBS Letters, 565, 160-162.
Nevoigt, E., Stahl, U. (1997). Osmoregulation and glycerol metabolism in the yeast Saccharomycescerevisiae. FEMS Microbiology Reviews, 21, 231-241.
Noiraud, N., Maurousset, L., & Lemoine, R (2001). Identification ofa Mannitol Transporter, AgMaTl, in Celery Phloem. The Plant Cell, 13, 695-705.
Norbeck, I., Pahlman, A K, Akhtar, N., Blomberg, A, & Adler, L. (1996). Purification and Characterization of Two Isoenzymes ofDL-Glycerol-3-phosphatase from Saccharomyces cerevisiae. Thejournal of Biological Chemistry, 271,13875-13881.
Nurgel, c., Pickering, G. I., & Inglis, D. L. (2004). Sensory and Chemical characteristics of Canadian Ice wines. Journal of the science offood and agriculture, 84,1675-1684.
O'Rourke, S. M., & Herskowitz, I. (2004). Unique and Redundant Roles for HOG MAPK Pathway Components as Revealed by Whole-Genome Expression Analysis. Molecular Biology of the Cell; 15,532-542.
Oliveira, R, & Lucas, C. (2004). Expression studies of GUPl and GUP2, genes involved in glycerol active transport in Saccharomyces cerevisiae, using semi-quantitative RTPCR Current Genetics, 46, 140-146.
Oliveira, R, Lages, F., Silva-Grac;:a, M., & Lucas, C. (2003). Fpslp channel is the mediator of the major part of glycerol passive diffusion in Saccharomyces cerevisiae: artefacts and re-definitions. Biochimica et Biophysica Acta, 1613, 57-71.
Pahlman, A K, Granath, K, Ansell, R, Hohmann, S., & Adler, L. (2001). The yeast glycerol3-phosphatases Gpplp and Gpp2p are required for glycerol biosynthesis and differentially involved in the cellular responses to osmotic, anaerobic, and oxidative stress. Journal of Biological Chemistry, 276,3555-3563.
Pascual-Ahuir, A, Struhl, K, & Proft, M. (2006). Genome-wide expression analysis of the stress-activated MAP kinase Hogl in yeast. Methods, 40, 272-278.
Paulsen, I. T., Sliwinski, M. K, Nelissen, B., Goffeau, A, & Saier Ir, M. H. (1998). unified inventory of established and putative transporters encoded within the complete genome of Saccharomyces cerevisiae. FEBS Letters, 430, 116-125.
Pavlik, P., Simon, M., Schuster, T., & Ruis, H. (1993). The glycerol kinase (GUT1) gene of Saccharomyces cerevisiae: cloning and characterization. Current Genetics, 24, 21-25.
120

Pettersson, N., Filipsson, c., Becit, E., Brive, L., & Hohmann, S. (2005). Aquaporins in yeasts and filamentous fungi. Biology of the cell, 97,487-500.
Petty, H. R (1993). Molecular biology of membranes: structure and function. New York: Plenum press.
Pigeau, G. M., & Inglis, D. L. (2007). Response of wine yeast (Saccharomyces cerevisiae) aldehyde dehydrogenases to acetaldehyde stress during Icewine fermentation. Journal of Applied Microbiology, 103, 1567-1586.
Pigeau, G. M., & Inglis, D. L. (2005). Upregulation of ALD3 and GPDl in Saccharomyces cerevisiae during Icewine fermentation. Journal of Applied Microbiology, 99, 112-195.
Pigeau, G. M., Bozza, E., Kaiser, K, & Inglis, D. L. (2007). Concentration effect of Riesling Icewine juice on yeast performance and wine acidity. Journal of Applied Microbiology, 103, 1691-1698.
Pokholok, D. K, Zeitlinger, J., Hannett, N. M., Reynolds, D. B., & Young, R A (2006). Activated signal transduction kinases frequently occupy target genes. Science, 313, 533-536.
Pollard, A, & Wyn Jones, R G. (1979). Enzyme activities in concentrated solutions of glycinebetaine and other solutes. Planta, 144, 291-298.
Posas, F., & Saito, H. (1997). Osmotic activation of the HOG MAPK pathway via Stellp MAPKKK: scaffold role ofPbs2p MAPKK Science., 276,1702-1705.
Posas, F., Chambers, J. R, Heyman, J. A, Hoeftler, J. P., de Nadal, E., & Ariiio, J. (2000). The transciptional response of yeast to saline stress. The Journal of Biological Chemistry, 275, 17249-17255.
Raitt, D. C., Posas, F., & Saito, H. (2000). Yeast Cdc42 GTPase and Ste20 PAK-like kinase regulate Sho i-dependent activation of the Hogl MAPK pathway. EMBO Journal, 19,4623-4631.
Reiser, V., Ruis, H., & Ammerer, G. (1999). Kinase Activity-dependent Nuclear Export Opposes Stress-induced Nuclear Accumulation and Retention of Hogl Mitogenactivated Protein Kinase in the Budding Yeast Saccharomyces cerevisiae. Molecular Biology of the Cell, 10, 1147-1161.
Reiser, V., Salah, S. M., & Ammerer, G. (2000). Polarized localization of yeast Pbs2 depends on osmostress, the membrane protein Shol and Cdc42. Nature Cell BioI, 2, 620-627.
121

Remize, F., Cambon, B., Barnavon, L., & Dequin, S. (2003). Glycerol formation during wine fermentation is mainly linked to Gpd1p and is only partially controlled by the HOG pathway. Yeast, 20,1243-1253.
Rep, M., Albertyn, J., Thevelein, J. M., Prior, B. A, & Hohmann, S. (1999). Different signalling pathways contribute to the control of GPD1 expression by osmotic stress in Saccharomyces cerevisiae. Microbiology, 145, 715-727.
Rep, M., Krantz, M., Thevelein, J. M., & Hohmann, S. (2000). The transcriptional response of Saccharomyces cerev;siae to osmotic shock. The journal of Biological Chemistry, 275, 8290-8300.
Roberts, G. G., & Hudson, A P. (2006). Transcriptome profiling of Saccharomyces cerevisiae during transition from fermentative to glycerol-based respiratory growth reveals extensive metabolic and structural remodeling. Molecular Gene Genomics, 276,170-186.
Saito, H., & Tatebayashi, K (2004). Regulation of the osmoregulatory HOG MAPK cascade in yeast. The journal ofBioch em is try ,136,267-272.
Scanes, K T., Hohmann, S., & Prior, B. A (1998). Glycerol production by the yeast Saccharomyces cerevis;ae and its relevance to wine: A review. South African journal of Enology and Viticulture (South Africa) , 19, 17-24.
Silva-Gras;aa, M., & Lucasa, C. (2006). Physiological studies on long-term adaptation to salt stress in the extremely halotolerant yeast Candida versatilis CBS 4019 (syn. C. halophila). FEMS Yeast Research, 3, 247 - 260.
Spencer, J. F., & Spencer, D. M. (1997). Yeasts in natural and artificial habitats. NewYork: springer verlag berlin heidelberg.
Sprague, G. F., & Cronan, J. E. (1977). Isolation and characterization of Saccharomyces cerevisiae mutants defective in glycerol catabolism. journal of Bateriology, 129, 1335-1342.
Sutherland, F., Lages, F., Lucas, C., Luyten, K, Albertyn, J., Hohmann, S., et al. (1997). Characteristics of Fps1-dependent and-independent glycerol transport in Saccharomyces cerevisiae. journal of Bacteriology, 197, 7790-7795.
Tamas, M. J., Karlgren, S., Bill, R. M., Hedfalk, K, Allegri, L., Ferreira, M., et al. (2003). A short regulatory domain restricts glycerol transport through yeast Fps1p. The journal of Biological Chemistry, 278, 6337-6345.
122

Tamas, M. J., Rep, M., Thevelein, J. M., & Homann, S. (2000). Stimulation of the high osmolarity glycerol (HOG) pathway: evidence for a signal generated by a change in turgor rather than by water stress. FEBS Letters, 472, 159-165.
Tamas, M. J., Luyten, K., Sutherland, F., Hernandez, A, Albertyn, J., Valadi, H., et al. (1999). Fps1p controls the accumulation and release of the compatible solute glycerol in yeast osmoregulation. Molecular Microbiology, 31,1087-1104.
Tao, W., Deschenes, R. J., & Fassler, J. S. (1999). Intracellular glycerol levels modulate the activity of Sln1p, a Saccharomyces cerevisiae two component regulation. The Journal of Biological Chemistry, 274, 360-367.
Thorsen, M., Di, Y., Tangemo, c., Morillas, M., Ahmadpour, D., Van der Does, c., et al. (2006). The MAPK Hog1p modulates Fps1p-dependent arsenite uptake and tolerance in yeast. Molecular Cell Biology, 17,4400-4410.
Trumbly, R. J. (1992). Glucose repression in the yeast Saccharomyces cerevisiae. Molecular Microbiology, 6, 15-21.
van Zyl, P. J., Kilian, S. G., & Prior, B. A (1990). The role of an active transport mechanism in glycerol accumulation during osmoregulation by Zyyosaccharomyces rouxii. Applied Microbiology and Biotechnology, 34, 231-235.
Vintners Quality Aliance (VQA) Act (1999) Vintners Quality Aliance Act. Ontario Regulation 406/00.
Vintners Quality Aliance Ontario (2008) Annual Report. Vintners Quality Aliance. Toronto, Ontario.
Westfall, P. J., Patterson, J. c., Chen, R. E., & Thorner, J. (2008). Stress resistance and signal fidelity independent of nuclear MAPK function. PNAS, 105, 12212-12217.
Yale, J., & Bohnert, H. J. (2001). Transcript expression in Saccharomyces cerevisiae at high salinity. TheJournal of Biological Chemistry, 276, 15996-16007.
Yancey, P. H., Clark, M. E., Hand, S. c., Bowlus, R. D., & Somero, G. N. (1982). Living with water stress: evolution of osmolyte systems. Science, 217, 1214-1222.
Young, c., Mapes, J., Hanneman, J., AI-Zarban, S., & Ota, I. (2002). Role of Ptc2 Type 2C Ser/Thr Phosphatase in Yeast High-Osmolarity Glycerol Pathway Inactivation. Eukaryotic cell, 1, 1032-1040.
Zapater, M., Sohrmann, M., Peter, M., Posas, F., & de Nadal, E. (2007). Selective requirement for SAGA in Hog1-mediated gene expression depending on the severity
123

of the external osmostress conditions. Molecular and Cellular Biology, 27, 3900-3910.
Zhao, S., Douglas, N. W., Heine, M. J., Willams, G. M., Winther-Larsen, H. c., & Meaden, P. G. (1994). The STU gene of Saccharomyces cerevisiae is predicted to encode a sugar transporter-like protein. Gene, 146,215-219.
Ziraldo, D., & Kaiser, K. (2007). Extreme Win em a king. Key Porter Books.
124

9 APPENDIX
9.1 STL1 sequence alignment
u _ w I I I
STU KIV1l16 ATGAAGGATT TAAAATTATC GAATTTCAAA GGCAAATTTA TAAGCAGAAC CAGTCACTGG 60
STLl SY4742 .......... 60 H _ = I I I
STU KIVl1l6 GGACTTACGG GTAAGAAGTT GCGGTATTTC ATCACTATCG CATCTATGAC GGGCTTCTCC 120
STU BY4742 120 - ~ ~ I I I ~LIKWI1W CTGTTTGGAT ACGACCAAGG GTTGATGGCA AGTCTAATTA CTGGTAAACA GTTCAACTAT 180
STU BY4742 180 200 220 240
I I I STU K1V1116 GAATTTCCAG CAACCAAAGA AAATGGCGAT CATGACAGAC ACGCAACTGT AGTGCAGGGC 240
STU BY4742 240
- = -I I I STU KIV1116 GCTACAACCT CCTGTTATGA ATTAGGTTGT TTCGCAGGTT CTCTATTCGT TATGTTCTGC 300
STU BY4742 300
= - -I I I ~UKWI1W GGTGAAAGAA TTGGTAGAAA ACCATTAATC CTGATGGGTT CCGTAATAAC CATCATTGGT 360
STU BY4742 360 = ~ ~
I I I STU K1V1l16 GCCGTTATTT CTACATGCGC ATTTCGTGGT TACTGGGCAT TAGGCCAGTT TATCATCGGA 420
STLl BY4742 420 - - -I I I STU KIV1116 AGAGTCGTCA CCGGTGTTGG AACAGGGTTA AATACATCTA CTATTCCCGT TTGGCAATCA 480
STU BY4742 ....... G 480
- = ~ , I I STLl KIVl116 GAAATGTCAA AAGCTGAAAA TAGAGGGTTG CTGGTCAATT TAGAAGGTTC CACAATTGCT 540
STU BY4742 540 - - -I I I S~lKWIIW TTTGGCACTA TGATTGCTTA TTGGATTGAT TTTGGGTTTT CTTATACCAA CAGTTCTGTT 600
STLl BY4742 ..... T .... .... G. 600
~ - -I I I STU KIVll16 CAGTGGAGAT TCCCCGTGTC AATGCAAATC GTTTTTGCTT TCTTCCTGCT TGCTTTCATG 660
STU BY4742 660
- - = I I I ~LlKWIIW ATTAAACTAC CTGAATCGCC ACGTTGGCTG ATTTCTCAAA GTCGAACAGA AGAAGCTCGC no
STU BY4742 720 - - -I I I STU KIVl116 TACTTGGTAG GAACACTAGA CGACGCGGAT CCAAATGATG AGGAAGTTAT AACAGAAGTT 780
STLl BY4742 780 - ~ -I I I STU K1V1l16 GCTATGCTTC ACGATGCTGT TAACAGGACC AAACACGAGA AACATTCACT GTCAAATTTG 840
STU BY4742 ..... G •... 840 - - -I I I STU KIVl116 TTCTCCAGAG GCAGGTCCCA AAATCTTCAG AGGGCTTTGA TTGCAGCTTC AACGCAATTT 900
STLl BY4742 900
= - -I I I
STU K1V1116 TTCCAGCAAT TTACTGGTTG TAACGCTGCC ATATACTACT CTACTGTATT ATTCAACAAA 960
STLl BY4742 960 980 1,000 1,020
I I I STLl KIVl1l6 ACAATTAAAT TAGACTATAG ATTATCAATG ATCATAGGTG GGGTGTTCGC AACAATCTAC 1020
STU BY4742 .... C ..... 1020
125
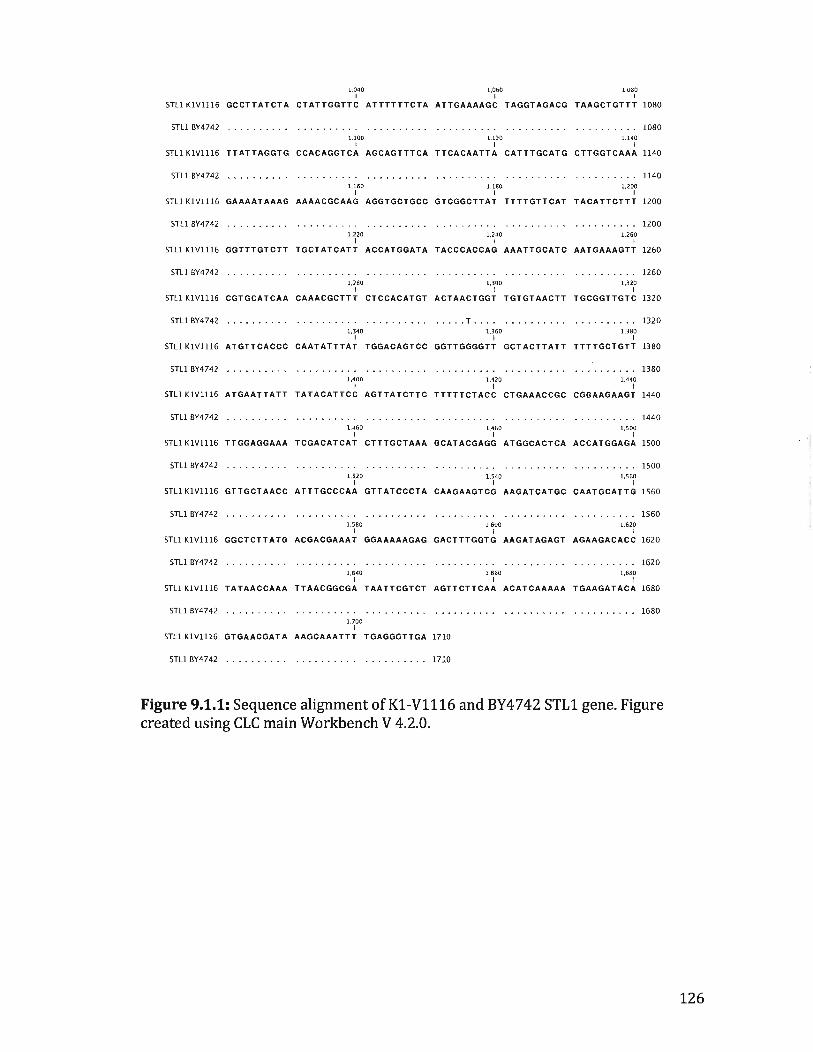
1.040 1,060 1,080 I I I
STLl K1Vl116 GCCTTATCTA CTATTGGTTC ATTTTTTCTA ATTGAAAAGC TAGGTAGACG TAAGCTGTTT 1080
STLl BY4742 . . . .. .. ... ........ . . .. ... . . .. . . . . . . ~ .... ...... . .. . . . . . . . . . . . 1080 1.100 1.120 1,140
I I I STLl K1V1116 TTATTAGGTG CCACAGGTCA AGCAGTTTCA TTCACAATTA CATTTGCATG CTTGGTCAAA 1140
STLl BY4742 ......... . ....... . . . . .. . ...... ... .. ..... . . ........ . . . . . . . . . . 1140 1.160 1,180 1.200
I I I STLl K1V1116 GAAAATAAAG AAAACGCAAG AGGTGCTGCC GTCGGCTTAT TTTTGTTCAT TACATTCTTT 1200
STU BY4742 ......... . ... . ..... . . . ....... . ... . . ..... . . . . ... . .. .. . ...... . 1200 1,220 1.240 1,260
I I I STU K1V1116 GGTTTGTCTT TGCTATCATT ACCATGGATA TACCCACCAG AAATTGCATC AATGAAAGTT 1260
STLl BY4742 ...... . ... . .. ...... . .. . . . .... . .. . ...... . ..... . . . . . . . ..... . . . 1260 1,280 1,300 1,320
I I I STU KIVll16 CGTGCATCAA CAAACGCTTT CTCCACATGT ACTAA CTGGT TGTGTAACTT TGCGGTTGTC 1320
STU BY4 742 . .. . ..... . ... . . ... . . . . .. ...... ... .. T .... . .... . . . .. . . . ....... 1320 1.340 1,360 1,380
I I I STU KIVll16 ATGTTCACCC CAATATTTAT TGGACAGTCC GGTTGGGGTT GCTACTTATT TTTTGCTGTT l380
STU BY4742 ...... .. . . · . . . . . . . . . .. . . .. ... . .... . . .. . . . ......... . ......... 1380 1.400 1,420 1,440
I I I STU K1 V1116 ATGAATTATT TATACATTCC AGTTATCTTC TTTTTCTACC CTGAAACCGC CGGAAGAAGT 1440
STLl BY4742 ......... . . ..... .. . . . .. .. ..... ......... . ... .. .. .. . .. ....... . 1440 1.460 1,480 1,500
I I I "j STU KIVll16 TT GGAGGAAA TCGACATCAT CTTTGCTAAA GCATACGAGG ATGGCACTCA ACCATGGAGA 1500
STLl BY4742 . . . . . . . . . . · . . . . . . . . . ... . . . . . . . . ..... . .. . .. ..... .. . . ........ . 1500 1.520 1,540 1,560
I I I STU KIVll16 GTTGCTAACC ATTTGCCCAA GTTATCCCTA CAAGAAGTCG AAGATCATGC CAATGCATTG 1560
STLl BY4742 . . ... .... . .. .. .. . ... . .. . ...... ........ . . . ..... . ... . . .. .. . .. . 1560 1,580 1,600 1.620
I I I STll K1V1l16 GGCTCTTATG ACGACGAAAT GGAAAAAGAG GACTTTGGTG AAGATAGAGT AGAAGACACC 1620
STLl BY4 742 . . . . .. . .. . · . . . . . . . . . . . .. .. . .. . ... . ... . . . .... .. ... . . ......... 1620 1,640 1,660 1,680
I I I STU Kl Vll16 TATAACCAAA TTAACGGCGA TAATTCGTCT AGTTCTTCAA ACATCAAAAA TGAAGATACA 1680
STU BY4742 .... ... . . . ......... . . . . .... .. . ... ... ... . . ......... . . . . ... . . . 1680 1,700
I STU KIV1116 GTGAACGATA AAGCAAATTT TGAGGGTTGA 1710
STLl BY4742 .... .. . . . . ..... .. . . . ..... . ... . 1710
Figure 9.1.1: Sequence alignmentofK1-V1116 and BY4742 STL1 gene. Figure created using CLC main Workbench V 4.2.0.
126

9.2 Optimization of glycerol uptake assay
In the designed glycerol uptake assay, hyperosmotically stressed cell were
incubated with (14C]glycerol and 10 uL of stock cell suspension was filtered at
specific time points and washed with Ice-cold water to remove excess extracellular
glycerol and allow accurate measurements of the level of intracellular [14C]glycerol.
The level of glycerol accumulated by the cells was inferred from the amount of
radioactivity that was left on the filter. Because glycerol has a lipophilic nature there
was a concern that the radioactivity that remained on the filter represents
extracellular glycerol that was bound to the cell membrane rather than intracellular
glycerol. That means that washing the cells with water may not be sufficient to
remove extracellular glycerol and therefore hinder the accuracy of the results.
To make certain that the radioactivity retained on the filter represents only
intracellular glycerol, cells were washed with either Ice-cold water or 1 M cold
glycerol solution. Ifradiolabeled glycerol was indeed stuck in the cell membrane,
washing the cells with cold glycerol should reduce the radioactivity on the filter
since the cold glycerol molecules will compete and therefore substitute for the
membrane-bound radiolabeled glycerol.
Washing .t1STLl or parent strain cells with glycerol did not decrease the level of
radioactive glycerol throughout the course of the assay (Figure 4.2), indicating that
glycerol was not bound to the cell membrane and therefore washing with water is
sufficient to remove extracellular glycerol from the filter.
127

-:----o ~ "-CD~ ~'O t»tn ...... -0-~ 0 ~§. -
350
300
250
200
150
100
50
0 0.0 2.5 5.0 7.5
Time (min)
10.0
• BY4742 water wash
• BY4742 1 M glycerol wash
• t1STL 1 water wash
• t1STL 11M glycerol wash
12.5
Figure 9.2.1: The effect of washing solution on the level of radio labeled glycerol retained on the filter. Parent strain and L!STLl cells were washed twice with either 5 mL of Ice-cold water or 5 mL of cold glycerol solution (1M) at the specified time-points.
128