shock pulse shaping in a small-form factor velocity amplifier
TRANSCRIPT

Shock and Vibration 17 (2010) 787–802 787DOI 10.3233/SAV-2010-0521IOS Press
Shock pulse shaping in a small-form factorvelocity amplifier
Gerard Kellya,∗, Jeff Puncha, Suresh Goyalb and Michael SheehyaaCTVR, Stokes Institute, University of Limerick, Limerick,IrelandbBell Labs Ireland, Alcatel-Lucent, Blanchardstown Industrial Park, Blanchardstown, Dublin, Ireland
Received 23 June 2009
Abstract. This theme of this paper is the design and characterisation of a velocity amplifier (VAMP) machine for high-accelerationshock testing of micro-scale devices. The VAMP applies multiple sequential impacts to amplify velocity through a system ofthree progressively smaller masses constrained to move in the vertical axis. Repeatable, controlled, mechanical shock pulsesare created through the metal-on-metal impact between pulse shaping test rods, which form part of the penultimate and ultimatemasses. The objectives are to investigate the controllableparameters that affect the shock pulses induced on collision, namely;striker and incident test rod material; test rod length; pulse shaping mechanisms; and impact velocity.
The optimum VAMP configuration was established as a 60 mm longtitanium striker test rod and a 120 mm long titaniumincident rod. This configuration exhibited an accelerationmagnitude and a primary pulse duration range of 5,800–23,400 g and28.0–44.0µs respectively. It was illustrated that the acceleration spectral content can be manipulated through control of the testrod material and length. This is critical in the context of practical applications, where it is postulated that the acceleration signalcan be controlled to effectively excite specific componentsin a multi-component assembly affixed to the VAMP incident test rod.
Keywords: Shock, impact, pulse shape, high-acceleration,velocity amplification, stress wave propagation
1. Introduction
Recent technological development has witnessed a continuing trend towards the miniaturisation of electronicdevices. As a consequence, application areas for Micro-Electro-Mechanical Systems (MEMS) have expanded intothe automotive, aerospace, military and telecommunications sectors. Gad-El-Hak [1] has noted that electroniccomponents such as inductors and tunable capacitors fabricated using MEMS technology offer distinct advantagesover their integrated counterparts. However, the reliability engineering of MEMS devices is still in its infancy,particularly with respect to micro-devices deployed in harsh environments that are subject to shock stimuli that mayinduce stress related failure, such as those analysed by Srikar and Senturia [2]. This is of paramount concern fordevices that have applications in high-acceleration environments such as missile control systems. The accelerationpulse shape is a critical aspect of high-acceleration shocktesting as clean, consistent pulse shapes are extremelydifficult to obtain [3]. State-of-the-art high-acceleration shock test methods include Hopkinson pressure bar (HPB)techniques [4,5], ballistics, rail and air guns, drop testing, and centrifuging. Some of the difficulties with thesemethods include large size, high cost, safety and repeatability issues. The theme of this paper is an investigation ofa velocity amplifier (VAMP) machine for high-acceleration shock testing of micro-scale devices.
The primary objective of this paper is the realisation of a small-scale and cost-effective platform which can providerepeatable high-acceleration pulses, of controllable acceleration magnitude and primary pulse duration. To thisend, the VAMP shock testing machine is based on the principleof using multiple, sequential impacts to amplify
∗Corresponding author. Tel.: +353 61 233619; Fax: +353 61 202393; E-mail: [email protected].
ISSN 1070-9622/10/$27.50 2010 – IOS Press and the authors. All rights reserved

788 G. Kelly et al. / Shock pulse shaping in a small-form factor velocity amplifier
Principle (a) Shock Tester (b)
m1
m2
mn
e1,0 vff
-vff
-vff
m1
m2
m3
Incident Test Rod
Striker Test Rod
Fig. 1. VAMP principle and a schematic of a VAMP shock tester.denotes impact event.
velocity through a system of progressively smaller masses constrained to move in the vertical axis. An illustrativeexample of the velocity amplification process is displayed in Fig. 1(a), with a chain of massesm2 − mn fallingwith a free-fall velocityvff , and massm1 rebounds at a velocity dependent on the coefficient of restitution, e.The process is explained in detail by Rodgers et al. [6–8]. The VAMP principle represents a promising designfor a range of applications such as; launchers (velocity amplification); armour (energy absorption); and enhancedenergy harvesters. Figure 1(a) illustrates the principle with an accompanying schematic in Fig. 1(b) demonstratinga realisation of the principle as a shock tester.
The VAMP mechanical shock pulses are created through the metal-on-metal finite collinear rod impact betweenthe striker and incident pulse shaping test rods as illustrated in Fig. 1(b), which is the critical element of operation.The plane-ended cylindrical test rods are partially enclosed within the penultimate,m2, and ultimate,m3, masses.
This paper investigates VAMP shock pulses with acceleration magnitudes of between 5,000–25,000 g and primarypulse durations from 20–50µs, as documented by Kelly et al. [9–11]. The frequency range of the VAMP analysisis 0–19 kHz and it is shown how manipulation of the VAMP parameters can effectively control the dominant signalfrequency components. This is an extension to current shockstandards such as the MIL-STD-810G [12] whichrequire a frequency response from 0–10 kHz. The analysis of the higher frequency data is an important aspect ofthe work. It permits direct application of the VAMP acceleration data to test MEMS devices within a frequencybandwidth of 0–19 kHz.
The ultimate impact is analysed for a range of parameters in order to find the optimum configuration to obtainclean, repeatable shock pulses. The pulse shaping test rod material is varied between titanium and copper-beryllium.The diameter of the test rods is kept constant at 10 mm and the test rod length is varied between 60, 90 and 120 mm.Impact interface conditions are varied by altering the testrod geometry and introducing mitigators at the impactinterface, which plastically deform on impact. Isolation of the striker and incident test rods is achieved by aluminiumcarriers with embedded O-rings, which partially enclose the test rods and act as effective Coulomb dampers duringimpact to negate the effect of clattering. The primary application for the VAMP is envisaged as a small-form factorshock tester. To this end, an accelerometer is fixed to the endof the incident test rod, and this can be substituted fora micro-device in order to conduct high-acceleration shocktesting.
The objectives of the paper are as follows:
– to design and characterise a small-form factor VAMP shock tester to generate high-acceleration shock pulsesof controllable acceleration magnitude and primary pulse duration.
– to investigate the pulse shaping characteristics of the test rods when subjected to a HPB generated incidentcompression pulse.
G. Kelly et al. / Shock pulse shaping in a small-form factor velocity amplifier 789
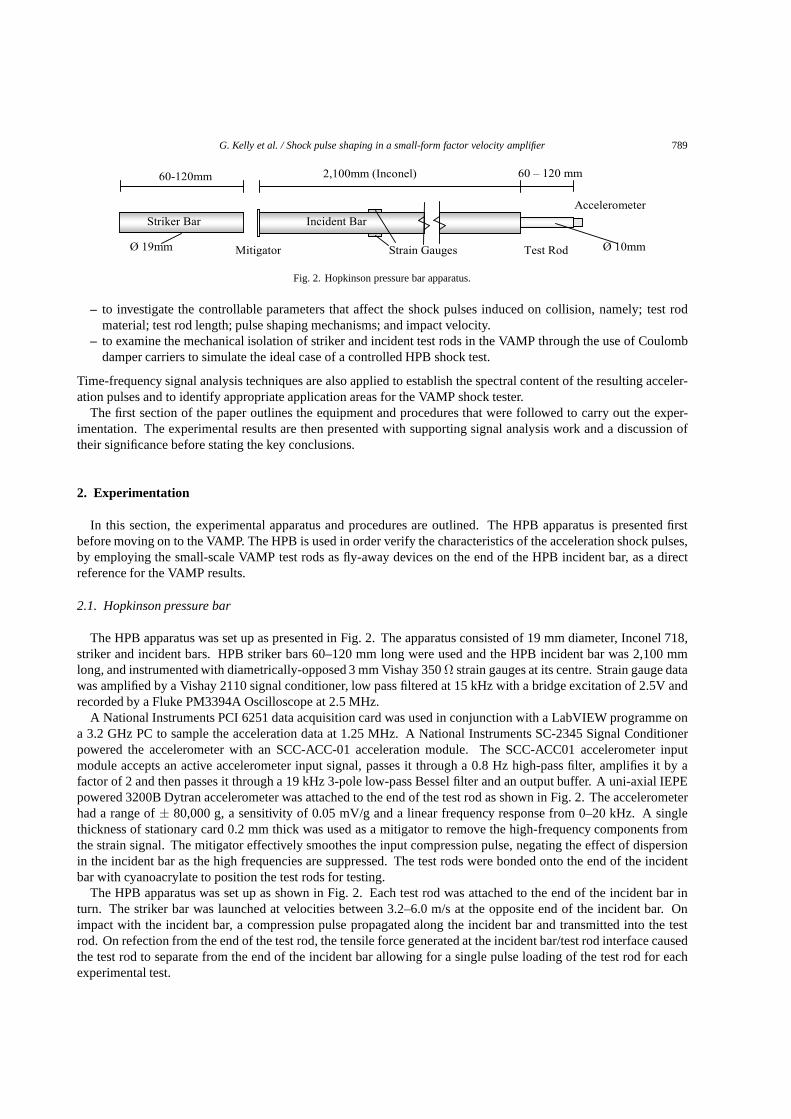
Fig. 2. Hopkinson pressure bar apparatus.
– to investigate the controllable parameters that affect theshock pulses induced on collision, namely; test rodmaterial; test rod length; pulse shaping mechanisms; and impact velocity.
– to examine the mechanical isolation of striker and incidenttest rods in the VAMP through the use of Coulombdamper carriers to simulate the ideal case of a controlled HPB shock test.
Time-frequency signal analysis techniques are also applied to establish the spectral content of the resulting acceler-ation pulses and to identify appropriate application areasfor the VAMP shock tester.
The first section of the paper outlines the equipment and procedures that were followed to carry out the exper-imentation. The experimental results are then presented with supporting signal analysis work and a discussion oftheir significance before stating the key conclusions.
2. Experimentation
In this section, the experimental apparatus and proceduresare outlined. The HPB apparatus is presented firstbefore moving on to the VAMP. The HPB is used in order verify the characteristics of the acceleration shock pulses,by employing the small-scale VAMP test rods as fly-away devices on the end of the HPB incident bar, as a directreference for the VAMP results.
2.1. Hopkinson pressure bar
The HPB apparatus was set up as presented in Fig. 2. The apparatus consisted of 19 mm diameter, Inconel 718,striker and incident bars. HPB striker bars 60–120 mm long were used and the HPB incident bar was 2,100 mmlong, and instrumented with diametrically-opposed 3 mm Vishay 350Ω strain gauges at its centre. Strain gauge datawas amplified by a Vishay 2110 signal conditioner, low pass filtered at 15 kHz with a bridge excitation of 2.5V andrecorded by a Fluke PM3394A Oscilloscope at 2.5 MHz.
A National Instruments PCI 6251 data acquisition card was used in conjunction with a LabVIEW programme ona 3.2 GHz PC to sample the acceleration data at 1.25 MHz. A National Instruments SC-2345 Signal Conditionerpowered the accelerometer with an SCC-ACC-01 accelerationmodule. The SCC-ACC01 accelerometer inputmodule accepts an active accelerometer input signal, passes it through a 0.8 Hz high-pass filter, amplifies it by afactor of 2 and then passes it through a 19 kHz 3-pole low-passBessel filter and an output buffer. A uni-axial IEPEpowered 3200B Dytran accelerometer was attached to the end of the test rod as shown in Fig. 2. The accelerometerhad a range of± 80,000 g, a sensitivity of 0.05 mV/g and a linear frequency response from 0–20 kHz. A singlethickness of stationary card 0.2 mm thick was used as a mitigator to remove the high-frequency components fromthe strain signal. The mitigator effectively smoothes the input compression pulse, negating the effect of dispersionin the incident bar as the high frequencies are suppressed. The test rods were bonded onto the end of the incidentbar with cyanoacrylate to position the test rods for testing.
The HPB apparatus was set up as shown in Fig. 2. Each test rod was attached to the end of the incident bar inturn. The striker bar was launched at velocities between 3.2–6.0 m/s at the opposite end of the incident bar. Onimpact with the incident bar, a compression pulse propagated along the incident bar and transmitted into the testrod. On refection from the end of the test rod, the tensile force generated at the incident bar/test rod interface causedthe test rod to separate from the end of the incident bar allowing for a single pulse loading of the test rod for eachexperimental test.

790 G. Kelly et al. / Shock pulse shaping in a small-form factor velocity amplifier
Fig. 3. VAMP model highlighting the penultimate and ultimate masses with interchangeable test rod cores.
2.2. Velocity amplifier shock tester
The VAMP was integrated within the crosshead of the Instron 9250 HV drop tester as displayed in Fig. 3. A crosssection of the ultimate mass and the penultimate mass is alsoshown, illustrating the critical aspects of the VAMPdesign.
The critical features of the VAMP are as follows:
– Carrier/Isolator: The carrier was employed to avoid multiple impacts, isolate the test rods from any complexgeometry and minimise the effect of stress wave propagationon impact. It acted as an effective Coulombdamper in each mass by opposing the vertical motion of the striker and incident test rods with a negligiblespring component in order to nullify the possibility of multiple impacts.
– Mitigator: Annealed copper discs, 0.5 mm thick and 3 mm diameter were used as mitigators to remove the highfrequency components in the acceleration signal. Plastic deformation of the mitigator on impact increases thepulse duration at the expense of acceleration magnitude.
– Test Rod: The striker test rod was held in the penultimate mass and the incident test rod in the ultimatemass. A range of 10 mm diameter test rods was used. Test rod material was varied between titanium andcopper-beryllium and the test rod length between 60 mm, 90 mmand 120 mm.
The data acquisition and signal conditioning applied to theVAMP acceleration data was identical to that documentedfor the HPB acceleration data. Selected drop tests were recorded using an IDT XStream XS-4 CMOS high-speedcamera, which recorded the drop event at between 5,000–100,000 frames per second, dependent on the area ofinterest.
The VAMP was first attached to the drop tester as the acting crosshead. The crosshead was raised to the requiredheight in the drop tester using the drop test interface. The crosshead was released and the accelerometer signal wasrecorded by the data acquisition system. This process was repeated to generate a statistical sample of 10 drop testsfor each test setup. The drop heights tested from 50–200 mm resulted in an impact velocity range of 3.5–5.8 m/sbetween the ultimate and penultimate masses, which was calculated from the high-speed imaging.

G. Kelly et al. / Shock pulse shaping in a small-form factor velocity amplifier 791
3. Results and discussion
This section contains the results from the HPB and VAMP experimentation, a discussion of the significantoutcomes, and a comparison between the HPB and VAMP test methods. A modal analysis of the test rods is presentedfirst in order to establish if test rod resonant effects affect the experimental instrumentation. The acceleration pulseshape is examined for a range of test rod parameters on the HPBand VAMP, and the effect of each parameter on thepulse is evaluated in order to obtain the optimum setup for the ultimate and penultimate masses in the VAMP. Theacceleration results are investigated with signal analysis tools which aid in deciphering the spectral content of theacceleration data and strengthen the applicability of the research to testing micro-scale devices.
3.1. Modal analysis
A modal analysis of the test rods was carried out using ANSYS 11.0 finite element software package in order toanticipate the modal frequencies of interest for the VAMP shock pulse shaping. Solid 95 20-node brick elements wereapplied and a Block Lanczos modal analysis was carried out for the required modes between 1–150 kHz. The axialmodes were of primary importance due to the impact orientation of the test rods. The model boundary conditionsincorporated the constraints of the aluminium carrier and the mounted accelerometer as displayed in Fig. 3. The firstaxial mode for the 120 mm long, 10 mm diameter titanium test rod was 21.5 kHz. The most important point to notewas that all axial modes – with the exception of the first axialmode for the 120 mm long copper-beryllium test rodat 16.5 kHz – were greater than 20 kHz. This implies that any resonant effect due to axial modal frequencies will befiltered by the experimental signal conditioner.
3.2. Hopkinson pressure bar
The HPB represents the state-of-the-art in controlled high-acceleration shock testing. The HPB testing was carriedout to verify the characteristics of the acceleration shockpulses, by employing the small-scale VAMP test rods asfly-away devices on the end of the HPB incident bar, as a directreference for the VAMP results. An industry-standardHPB was used to test the pulse shaping effects on the full array of test rods using Inconel bars.
The experimental tests applied Inconel striker bars of 60–120 mm in length in order for the pulse duration tocompare directly with the VAMP test results. The Inconel bars also used a 0.2 mm thick stationary card as mitigationat the impact interface between the striker and incident bars. The low thickness of the mitigator had the effect ofprotecting the compression-type piezoelectric accelerometer from the very high frequency components of the inputsignal without appreciably altering the shape of the acceleration pulse. Strain gauge and accelerometer data wascompared and each experimental test exhibited less than 5% and 10% difference in terms of acceleration magnitudeand primary pulse duration respectively. This was deemed anacceptable degree of comparison between the straingauge and accelerometer data as Rogillio et al. [13] and Gamaet al. [14] state that 4–6% is a typical level ofdiscrepancy between strain gauge and accelerometer readings for bars of matching impedance.
It was established that employing the short test rods causedreflective interference in the acceleration signalfollowing the initial pulse, and attenuation of the residual signal oscillations. This led to a close approximation ofa uni-modal acceleration pulse, with minimal oscillatory behaviour subsequent to the primary acceleration pulse.Fig. 4 presents the accelerometer data with impact velocities of 6 m/s for the 120 mm long striker bar and 5m/s forthe 90 and 60 mm long striker bars respectively. The legend indicates the test rod material followed by the strikerbar length followed by the incident test rod length. Effectively;
– Ti – 120 – 90 denotes a titanium test rod, 120 mm long striker bar and 90 mm long incident test rod affixed onthe end of the HPB.
This representation scheme is used throughout the paper.The acceleration magnitude levels in Fig. 4 compare well forthe Ti – 90 – 90 and Ti – 60 – 60 test configurations
due to the similar impact velocity in each test. Each acceleration signal displays a similar rate of roll-off with aroll-off of −15,000 g/period for the Ti – 120 – 90 configuration (a slope of−251 g/µs for the linear approximation).The variation in the primary pulse duration is dependent on the geometry of the striker bar, with longer pulse

792 G. Kelly et al. / Shock pulse shaping in a small-form factor velocity amplifier
Table 1Acceleration primary pulse range for the Inconel HPB
Test rod material – Impact velocity (m/s) Primary pulse duration Maximum accelerationstriker – incident (mm) (µs) (g)
Ti – 60 – 120 5 45.0 18,157Ti – 90 – 120 5 48.8 18,378Ti – 120 – 120 6 52.0 24,661Ti – 60 – 90 5 40.8 20,103Ti – 90 – 90 5 44.8 21,073Ti – 120 – 90 6 44.8 27,255
Fig. 4. Comparison of acceleration traces for the 120, 90 and60 mm long striker bars and the 60 and 90 mm long titanium test rods.
durations recorded for longer striker bars. The acceleration signals are therefore a close approximation to the idealcase of a uni-modal shock pulse leading to a single pulse loading for an attached micro-device. A sample of therange of acceleration data for the Inconel HPB testing is tabulated in Table 1.
A statistical sample of five tests was performed for the Ti – 60– 120 data presented in Table 1 for an impactvelocity of 5 m/s. The average maximum acceleration over thefive tests was 18,157 g with a standard deviation of7% of the average. The average primary pulse duration was 45.0 µs for the five tests with a standard deviation of4.9%, with the average duration of the half-period residualoscillations at 30.2µs. The primary pulse duration wasconsistently computed using the guidelines outlined by Wilson [15].
The acceleration magnitude increased with impact velocityto a maximum of 27,255 g for a 6 m/s impact velocityemploying the 120 mm striker bar and the 90 mm titanium test rod. Primary pulse duration increased with strikerbar length. As the HPB was the secondary form of experimentation in this research, the data range established wassufficient as a point of reference for the VAMP results.
3.3. Velocity amplifier shock tester
This section examines the acceleration results obtained from the VAMP testing where the effect of a range ofparameters on the acceleration pulse shape is evaluated, inorder to obtain the optimum setup for the ultimate andpenultimate masses. The effect of the following parameterson the acceleration shock pulse was analysed:
– Test rod material

G. Kelly et al. / Shock pulse shaping in a small-form factor velocity amplifier 793
Fig. 5. VAMP acceleration plots displaying the repeatability of the pulse shape for six tests applying a consistent impact velocity of 3.5 m/s foreach test.
– Test rod geometry– Drop height and resulting impact velocity– Impact interface and use of mitigators between striker and incident rods
The VAMP data is compared directly with the HPB data to evaluate the attributes of the VAMP acceleration data. Theaccelerometer signal conditioner module low-pass filteredthe acceleration data at 19 kHz to ensure operation withinthe linear response region of the accelerometer. For practical VAMP applications, suitable mechanical filtering [16,17] at 19 kHz is required for the micro-device under test to negate the effect of high frequency components.
3.3.1. Repeatability and test rod geometryThe acceleration plots in Fig. 5 show the complex acceleration signal for six identical drop tests using the VAMP
and demonstrate the shape of the acceleration pulse to be consistent with a decaying sinusoid, with a roll-off ofapproximately 4,300 g/period. Each drop height of 50 mm resulted in an impact velocity of 3.5 m/s for a Ti –60 – 120 configuration. Each plot possesses similar characteristics in terms of pulse magnitude and pulse length,demonstrating the repeatability of the acceleration pulses. Average peak acceleration and primary pulse duration forthe six traces is 11,671 g and 28.7µs, with standard deviations of 1.70% and 1.14% of the mean values respectively,verifying the repeatability.
The titanium test rods were established as the optimum pulseshaping test rods for the VAMP due to their low mass,and they formed the primary focus of all VAMP test results. Having established the repeatability of accelerationpulse shape, the variation in test rod length for the titanium test rods was considered. Figure 6 plots the VAMPacceleration pulses for an impact velocity of 3.5 m/s and a 120 mm long incident rod while varying the striker length.
The acceleration pulse shapes presented in Fig. 6 follow a trend of increased primary pulse duration for greaterstriker rod length. The primary pulse duration exhibited for each test is higher than that predicted for simple 1-Dwave propagation with 28.0µs for the 60 mm striker versus 11.8µs for the theoretical case. This increase in primarypulse duration was due to the following factors:
– increased titanium striker test rod length,– complexities at the impact interface from local elastic deformation and the inherent difficulties in ensuring a
flat-flat impact,– the low-pass filtering applied by the acceleration signal conditioner module,– stress wave transmission through the aluminium carriers.

794 G. Kelly et al. / Shock pulse shaping in a small-form factor velocity amplifier
Fig. 6. VAMP acceleration traces for a series of titanium striker rod lengths and an impact velocity of 3.5 m/s.
3.3.2. Impact interface and mitigator useThe primary VAMP configuration is a flat-flat, metal-on-metalfinite collinear rod impact resulting in a high-
frequency high-acceleration shock pulse. Geometry variations of test rod length have been presented in Fig. 6 tovary the pulse shape. Another method of pulse shaping is to alter the impact interface with the effect of extending theprimary pulse duration and decreasing the acceleration magnitude. The application of annealed copper mitigatorsbetween the test rods will now be investigated, which plastically deform on impact in order to extend the impactduration.
The use of annealed copper discs as mitigators has been extensively documented in HPB pulse shaping studies byFrew et al. [18–20]. In VAMP testing, annealed copper discs –3 mm diameter and 0.5 mm thickness – were appliedas mitigators between the striker and incident test rods. Onimpact, the plastic deformation of the copper prolongedthe impact with an associated increase in primary pulse duration and decrease in acceleration magnitude. Figure 7represents the effect of using a mitigator at the impact interface between the striker and incident rods. Accelerationplots from a flat-flat impact for a Ti – 60 – 120 configuration arecompared directly with plots when using mitigationfor impact velocities of 3.5 and 5.1 m/s. The resulting acceleration plots for the use of mitigators have much slowerramp rates due to the plastic deformation.
Figure 7 illustrates how the 46% increase in impact velocityaffects the acceleration pulse shape with and withoutthe copper mitigator. The application of the mitigator for a3.5 m/s impact velocity resulted in a 56.7% increase inprimary pulse duration from 29.6 to 46.4µs and a 54.6% decrease in acceleration magnitude from 11,520to 5,235 g.This compares well with the VAMP data for an increased impactvelocity of 5.1 m/s. The elevated impact velocitygenerated a 55.6% increase in primary pulse duration from 28.8 to 44.8µs and a 53.5% decrease in accelerationmagnitude from 19,535 to 9,092 g. Therefore, the effect of mitigation scales well in terms of acceleration magnitudeand exhibits a negligible difference in the primary pulse duration for increasing impact velocity.
3.3.3. Acceleration pulse rangeHaving outlined the effects of varying each parameter on theVAMP, a quantitative analysis of the acceleration
magnitude and primary pulse duration for the full range of test rods is now considered. This section compares theattributes of the VAMP acceleration pulse for the full rangeof parameters. Figure 8 plots the average maximumacceleration against impact velocity for a statistical sample of ten tests for a selection of test rods and pulse shapingmechanisms. The Ti – 60 – 120 Cu Mitigator configuration denotes use of the plastically deformable mitigators atthe impact interface.

G. Kelly et al. / Shock pulse shaping in a small-form factor velocity amplifier 795
Fig. 7. VAMP acceleration traces displaying the effects of applying annealed copper mitigators with the Ti – 60 – 120 configuration.
Fig. 8. Maximum acceleration plotted against impact velocity for a range of test rods and pulse shaping mechanisms. The broken lines betweendata points represent an indicative curve-fit.
The titanium test rods in Fig. 8 demonstrate consistent acceleration levels for varying striker rod length. More-over, the titanium rods illustrate a linear acceleration increase with impact velocity with an approximate slope of5,181 g/(m/s) for the Ti – 60 – 120 configuration. It can thus beinferred that much higher acceleration levels areobtainable for higher drops, resulting in greater impact velocities. This body of work has not researched accelerationsover 30,000 g as very high drop testing would decrease the lifespan of the test facility. The plot representing theuse of annealed copper mitigators displays a much lower ramprate with a linear acceleration increase and a slope of1,980 g/(m/s) for the data presented.
Having outlined the range of acceleration pulse shapes achieved through VAMP shock testing, it is instructive tocompare the VAMP data with the HPB data in terms of acceleration magnitude and primary pulse duration. Figure 9

796 G. Kelly et al. / Shock pulse shaping in a small-form factor velocity amplifier
Fig. 9. Acceleration pulse range for each experimental method in terms of acceleration magnitude and primary pulse duration. The broken linesbetween data points represent an indicative curve-fit.
plots the acceleration pulse ranges for the following experimental methods:
– VAMP– HPB – VAMP approximation – Inconel bars
All data presented was obtained using the 120 mm long incident test rods. The striker test rod length was increasedfrom 60–120 mm to increase the primary pulse duration accordingly for the VAMP and Inconel HPB tests asannotated for the VAMP data in Fig. 9.
Loci for the titanium test rods are plotted in Fig. 9 for minimum and maximum impact velocities of 3.5 and 5.8 m/sfor clarity. Inconel HPB data is displayed for the 120 mm titanium test rod and compares well with the VAMP datain terms of acceleration magnitude. The VAMP titanium test rod loci are well ordered and of a consistent slope forthe 3.5 and 5.8 m/s impact data with increased pulse durationfor greater striker rod length. The copper-berylliumdata displays greater pulse duration for the 60 mm striker rod with respect to the titanium loci.
– The pulse duration increase, relative to striker rod lengthis consistent for each material.– The largest primary pulse duration range of 28.0–48.0µs is exhibited by the titanium test rods.– The variation in pulse duration range between materials is due to the variation in stress wave speed and the
dynamic behaviour of each material under mechanical shock.
The greater mass for the copper-beryllium test rods resultsin higher contact forces on impact than for the titaniumtest rods. This leads to increased local elastic deformation with impact velocity, and associated shorter primarypulse duration for the copper-beryllium test rods as the impact interface more closely approximates planar contact.The Ti – 60 – 120 was the optimum configuration resulting in acceleration pulses closely approximating a decayingsinusoid as plotted in Fig. 5.
The maximum acceleration levels for the Inconel HPB data represent impact velocities of 5 and 6 m/s, whichcompare closely with the VAMP data for an impact velocity of 5.8 m/s. The Inconel HPB loci displays greaterprimary pulse duration than the VAMP due to dispersion effects in the 2,100 mm long HPB incident bar as a result ofthe minimal mitigation applied to approximate the VAMP testcase. The dispersion leads to an increased rise-timeand primary pulse duration as evidenced in Fig. 4 for the Inconel HPB acceleration data.

G. Kelly et al. / Shock pulse shaping in a small-form factor velocity amplifier 797
Fig. 10. Input acceleration data for each signal analysis process.
3.4. Signal analysis
Signal analysis tools are applied to the experimental acceleration signals to investigate the spectral content of thesignals in order to determine the utility of the shock data. The signal analysis tools applied to the experimental dataare listed as follows:
– Shock Response Spectrum (SRS)– Harmonic Wavelet Transform (HWT)– Energy Input Spectrum (EIS)
3.4.1. Shock response spectrumFigure 10 plots the acceleration traces that were used as input for each signal analysis method. The VAMP
pulse was recorded from the optimum Ti – 60 – 120 configuration. The uni-modal sine pulse was modelled on theVAMP acceleration trace with similar primary pulse duration and acceleration magnitude as outlined by Goyal [21].The SRS plotted in Fig. 11 was computed using a ramp invariantdigital filter simulation of the SDOF system inaccordance with the ISO standard for the computation of the SRS [22], with the critical damping,ξ, set at 5% foreach test.
From inspection of Fig. 11, the similarity between the SRS for the VAMP and uni-modal sine pulse is clear; withthe sine pulse SRS encompassing the majority of the VAMP SRS with the exception of the low frequency responseto the VAMP acceleration excitation. The peak accelerationof the VAMP data in Fig. 11 is 56,655 g at a frequencyof 17.6 kHz. This is important in the context of practical applications where MEMS devices can be tested to excitespecific resonances at predetermined acceleration levels using the VAMP.
3.4.2. Harmonic wavelet transformThe limitations of the SRS are well documented by Smallwood [23], with the primary limitation being the loss
of all temporal information in the SRS. The HWT is an alternative tool for time-frequency analysis as it retainsthe temporal information in a 3-D plot. A modified version of the original HWT, proposed by Newland [24], wasapplied here.
Figure 12 plots the HWT data for a VAMP Ti – 60 – 120 acceleration trace as illustrated in Fig. 10. The 3-Dcontour plot represents time, frequency and energy spectral density on the x-, y- and z-axes respectively. Theretention of the temporal information is important as it affords a more detailed analysis of the acceleration signal

798 G. Kelly et al. / Shock pulse shaping in a small-form factor velocity amplifier
Fig. 11. SRS for VAMP and uni-modal sine pulse.
Fig. 12. HWT contour plot of VAMP Ti – 60 – 120 acceleration trace.
frequency content. The energy spectral density was normalised in order that the volume under the HWT surfacecorresponds to the energy of the original acceleration signal. The maximum energy spectral density of 7,750 g2/(Hzs) is concentrated between 80–110µs and 15.5–18.0 kHz for the VAMP HWT in Fig. 12.
To illustrate the effect of altering the initial conditionsof test rod material and length, a HWT was computed fora VAMP CuBe – 120 – 120 acceleration trace, for an impact velocity of 5.1 m/s. The resulting HWT displays amaximum energy spectral density of 5,250(g2/(Hz s)) over a frequency bandwidth of 11.0–12.0 kHz. The criticalsignal parameters in the time and frequency domains for the representative VAMP acceleration traces and theuni-modal sine pulse are tabulated in Table 2.

G. Kelly et al. / Shock pulse shaping in a small-form factor velocity amplifier 799
Table 2Signal parameters for the representative acceleration signal traces
Description Uni-modal sine Ti – 60 – 120 CuBe – 120 – 120
Max Accel (g) 20,000 20,407 12,682Rise-time (µs) 10.4 10.4 15.2Primary Pulse Duration (µs) 28.0 28.0 55.2Max Energy (g2/(Hz s)) 4,700 7,750 5,250Frequency Bandwidth (kHz) 15.0–18.0 15.5–18.0 11.0–12.0Time (µs) 60–90 80–110 130–210
Fig. 13. Maximum energy input to an array of SDOF systems at their natural frequency for the VAMP and uni-modal sine acceleration pulse.
Table 2 illustrates how application of the HWT proves an effective method of investigating the energy content inthe VAMP signals. It is concluded that the maximum energy spectral density for the VAMP Ti – 60 – 120 signal isconcentrated at 80–110µs in the time domain and between 15.5–18.0 kHz in the frequency domain. Altering theVAMP initial conditions of test rod material and length demonstrates how the dominant signal frequency componentscan be controlled. This is critical in the context of practical VAMP applications, where control of the signal in thetime and frequency domains is vital in order to effectively model an acceleration pulse to shock test a specific MEMSdevice.
3.4.3. Energy input spectrumThe EIS is computed as an improved representation of the damage potential of a shock in comparison to the SRS
and is an accurate representation of the energy defined as theintegral of force over a distance. The EIS is effectivelya smoothed Fourier energy spectra and approximates the energy input to a SDOF by the acceleration signal, wherethe total energy is given in units of Nm/kg. Manipulation of the governing equations given by Smallwood andEdwards [25] leads to a derivation of the relative energies as follows:
Energy Input (EI)= Energy Dissipated (ED)+ Kinetic Energy (KE)+ Energy Absorbed (EA)The energy absorbed is the most important component as it relates to strain energy in the SDOF that can potentially
lead to failure. The energy dissipated accounts for thermaland acoustical losses generated by the stress wavepropagation through the linear SDOF system, and the kineticenergy is due to the rigid body translation. This isimportant in terms of practical applications for the VAMP, where the VAMP can be applied as a shock tester incurrent MEMS research such as micro-cantilevers under shock stimuli by Sheehy et al. [26]. For such an application,the VAMP pulse can be modelled in terms of magnitude and pulseduration to excite the MEMS device under test.

800 G. Kelly et al. / Shock pulse shaping in a small-form factor velocity amplifier
Table 3Energy input for the VAMP and uni-modal sine pulse acceleration signals
Description Ti – 60 – 120 Uni-modal sine
Maximum Energy (Nm/kg) 28.8 17.4Natural Frequency of SDOF System at Maximum Energy (kHz) 15.8 13.7Energy at 90% of Maximum (Nm/kg) 25.9 15.7Frequency Bandwidth at 90% of Maximum Energy (kHz) 15.0–18.0 10.5–16.5
Fig. 14. EIS components for the VAMP acceleration pulse at 15.8 kHz.
Analysis of the EIS can then be used to investigate the damagepotential of the VAMP shock pulses for a givenMEMS device.
Figure 13 plots the maximum energy input against natural frequency for an array of linear SDOF systems. TheVAMP data was compared to the ideal uni-modal sine pulse as displayed in Fig. 10. The EIS components for theVAMP acceleration pulse are plotted in Fig. 14 with the energy input divided into components of energy dissipated,kinetic energy and energy absorbed for a linear SDOF system with a natural frequency of 15.8 kHz.
Figure 13 shows the maximum energy input for the VAMP data is 28.8 Nm/kg for a linear SDOF system with anatural frequency of 15.8 kHz. This correlates well with thesignal analysis tools applied in the preceding sectionwhere it was shown that the majority of the VAMP signal energyis concentrated between 15.5–18.0 kHz. Theuni-modal sine pulse gives a maximum energy of 17.4 Nm/kg fora linear SDOF system with a natural frequencyof 13.7 kHz. It is clear that the VAMP data leads to higher energy concentration than the sine pulse. A criterionto compare the input signal response is to measure the frequency bandwidth corresponding to energy values greaterthan 90% of the maximum energy, as annotated in Fig. 13. Table3 displays the energy input data range for theVAMP Ti – 60 – 120 pulse and the uni-modal sine pulse acceleration signal.
Table 3 displays an energy input range of 15.0–18.0 kHz over 25.9 Nm/kg for the VAMP Ti – 60 – 120 accelerationsignal. The narrow bandwidth is important in relation to practical VAMP applications. It is hypothesised that aVAMP acceleration pulse can be modelled to excite specific components in a multi-component assembly affixed tothe VAMP incident test rod.
The absorbed strain energy can be responsible for failure ina micro-device as it represents the energy absorbed bythe structure as a result of its structural dynamics, as reported by Smallwood and Edwards [25]. The absorbed strainenergy displays a maximum value of 12.4 Nm/kg at 134.4µs, which is 80.0µs after the rise-time for the input VAMPacceleration signal. This delay between completing the acceleration signal rise-time and attaining the maximumstrain energy is due to the ramp-up of the energy input as the initial kinetic energy is converted and absorbed as

G. Kelly et al. / Shock pulse shaping in a small-form factor velocity amplifier 801
strain energy by the SDOF system at 15.8 kHz. Figure 14 illustrates how the kinetic and absorbed strain energiesincrease over the first 70µs of the energy input ramp up. The absorbed strain energy levels out between 120–180µswith two consecutive peaks above 12 Nm/kg. The kinetic and absorbed strain energies then decrease as the signalenergy is dissipated as heat and sound with 97.4% of the totalenergy dissipated after 500µs in Fig. 14.
The analysis of the energy spectrum illustrated that the maximum energy concentration was at frequencies between15–18 kHz for the VAMP acceleration excitation. This is because the energy spectrum represents the response of aSDOF spring-mass-damper system and the frequency content of the input pulse is heavily influenced by the incidentrod. The incident rod used here was a 120 mm long, 10 mm diameter titanium test rod with a first axial resonantmode at 21.5 kHz. Thus, varying the parameters of the test rodmaterial and geometry can effectively control thedominant frequency components and hence how the VAMP acceleration signal energy is dissipated.
Analysis of the energy spectrum is useful with a view to critiquing the VAMP as a useful shock tester. It affordsinsight into how the acceleration pulse is broken down into the relative energy densities and aids in the machinesetup to achieve the desired acceleration excitation pulse.
4. Conclusions
Experimental shock pulse testing was performed using a VAMPmachine and a HPB. The test articles were shortcylindrical test rods and acceleration pulses were recorded by an accelerometer on the upper surface of each testrod. Parameters varied were: impact velocity, test rod length, test rod material and contact interface – mitigator use.Statistical sample sets for each test rod were obtained withconsistent initial conditions. The VAMP accelerationdata range was compared to the HPB data in terms of acceleration magnitude and primary pulse duration with thefollowing conclusions:
– The VAMP was demonstrated as a viable alternative to currentshock test methods such as the HPB. It is anovel technique as it applies a small-form factor machine with no external propulsion to generate repeatablecontrolled shock pulses for a series of initial conditions.
– Isolation of the striker and incident test rods from any complex geometry is a crucial design guideline for theVAMP as it negates the effect of stress wave propagation throughout the penultimate and ultimate masses.
– The acceleration data was low pass filtered at 19 kHz to ensureoperation within the linear response region ofthe accelerometer. For practical VAMP applications, suitable mechanical filtering at 19 kHz is required for themicro-device under test to negate the effect of high frequency components.
– Shock pulses were obtained from the VAMP in excess of 20,000 gfor impact velocities of 5.8 m/s. It is inferredthat much higher shock levels are possible due to the linear relationship between impact velocity and peakacceleration.
– The optimum VAMP configuration was deemed to be the 60 mm titanium striker and 120 mm titanium incidentrod. This configuration exhibited an acceleration data range of 5,800–23,400 g and 28.0–44.0µs for impactvelocities between 3.5–5.8 m/s for flat-flat and mitigator tests.
– Application of plastically deformable mitigators was shown to increase the primary pulse duration at the expenseof acceleration magnitude.
– Application of the HWT established a dominant frequency bandwidth of 15.5–18.0 kHz for the VAMP Ti – 60– 120 configuration and 11.0–12.0 kHz for the CuBe – 120 – 120 configuration acceleration signal.
By comparing the energy spectra for the series of VAMP configurations, it was shown that the spectral content ofthe acceleration signal can be manipulated through controlof the test rod material and length. This is critical inthe context of practical VAMP applications, where it is postulated that the VAMP acceleration pulse shape can becontrolled to effectively excite specific components in a multi-component assembly affixed to the VAMP incidenttest rod.
Acknowledgement
The authors would like to acknowledge the assistance of Prof. Ian (Rick) Hall, Spencer Laboratories, Universityof Delaware, for his helpful advice and the use of the Hopkinson pressure bar equipment.

802 G. Kelly et al. / Shock pulse shaping in a small-form factor velocity amplifier
The authors would like to acknowledge the assistance of Mr. David Smallwood and Mr. Tim Edwards, SandiaLaboratories, for insightful discussions and supplying Matlab code for the signal analysis work.
The authors would like to acknowledge IRCSET (Irish Research Council for Science,Engineering and Technology)for their support of this work. The work is also supported by SFI (Science Foundation Ireland) under grant number03/CE3/I405.
References
[1] M. Gad-El-Hak,The MEMS Handbook, New York, CRC Press, 2002.[2] V.T. Srikar and S.D. Senturia, The reliability of microelectromechanical systems (MEMS) in shock environments,Journal of Microelec-
tromechanical Systems11(3) (2002), 206–214.[3] D.J. Frew, M.J. Forrestal and W. Chen, Shock Testing Electrical Components with a Hopkinson Pressure Bar,Society for Experimental
Mechanics – 10th International Congress and Exhibition on Experimental and Applied Mechanics, Springfield, MA, 2007.[4] V.I. Bateman, F.A. Brown and N.T. Davie, Use of a Beryllium Hopkinson Bar to Characterize a Piezoresistive Accelerometer in Shock
Environments,Journal of the Institute of Environmental Sciences, 39(6) (1996), 33–39.[5] W.-Y. Lu, H. Jin, S. Lee, K. Gwinn, W. Chen and B. Song, Dynamic Loading of LIGA Structures,ASME International Mechanical
Engineering Congress and Exposition, Chicago, IL., 2006.[6] B. Rodgers, S. Goyal, G. Kelly and M. Sheehy, The Dynamicsof Shock Amplification,International Conference of Mechanical Engineering,
London, U.K., 2008.[7] B. Rodgers, S. Goyal, G. Kelly and M. Sheehy, Dynamics of Shock Amplification through Multiple Impacts,8th World Congress on
Computational Mechanics, Venice, Italy, 2008.[8] B. Rodgers, S. Goyal, G. Kelly and M. Sheehy, The Dynamicsof Multiple Pair-Wise Collisions in a Chain for Designing Optimal Shock
Amplifiers,Shock and Vibration16(1) (2009), 99–116.[9] G. Kelly, J. Punch, S. Goyal and M. Sheehy, Analysis of Shock Pulses from a Small Velocity Amplifier,Society for Experimental Mechanics
– 11th International Congress and Exhibition on Experimental and Applied Mechanics, Orlando, FL., 2008.[10] G. Kelly, J. Punch, S. Goyal and M. Sheehy, Shock Pulse Shaping in a Small Velocity Amplifier,79th Shock and Vibration Symposium,
Orlando, FL., 2008.[11] G. Kelly, M. Sheehy, B. Rodgers, J. Punch and S. Goyal, Analysis of High Acceleration Shock Pulses Part I: Geometry ofIncident Mass,
Society for Experimental Mechanics – 10th International Congress and Exhibition on Experimental and Applied Mechanics, Springfield,MA., 2007.
[12] NASA-STD-7003, Pyroshock Test Criteria,National Aeronautics and Space Administration Technical Standard, 1999.[13] B. Rogillio and J. Heister, A New Approach to Designing Hopkinson Bar Fly Away Test Fixtures for MEMS Devices,78th Shock and
Vibration Symposium, Philadelphia, PA., 2007.[14] B.A. Gama, S.L. Lopatnikov and J.W. Gillespie Jr, Hopkinson Bar Experimental Technique: A Critical Review,Applied Mechanics
Reviews, 57(1–6) (2004), 223–250.[15] J.S. Wilson, Shock and Vibration Measurement Technology – An Applications Oriented Short-Course,Endevco Corporation, San Juan
Capistrano, CA., 2007.[16] V.I. Bateman, F.A. Brown and M.A. Nusser, High Shock, High Frequency Characteristics of a Mechanical Isolator for aPiezoresistive
Accelerometer, the Endevco 7270AM6,68th Shock and Vibration Symposium, Albuquerque, New Mexico, 1997.[17] S.O. Oyadiji, K.T. Feroz and G.R. Tomlinson, Design of Polymer-Based Mechanical Filters for Shock-Measurement Accelerometers,SPIE
The International Society for Optical Engineering, Bellingham, WA., 1996.[18] D.J. Frew, M.J. Forrestal and W. Chen, A Split HopkinsonPressure Bar Technique to Determine Compressive Stress-Strain Data for Rock
Materials,Experimental Mechanics, 41(1) (2001), 40–46.[19] D.J. Frew, M.J. Forrestal and W. Chen, Pulse Shaping Techniques for Testing Brittle Materials with a Split Hopkinson Pressure Bar,
Experimental Mechanics42(1) (2002), 93–106.[20] D.J. Frew, M.J. Forrestal and W. Chen, Pulse Shaping Techniques for Testing Elastic-Plastic Materials with a SplitHopkinson Pressure
Bar,Experimental Mechanics45(2) (2005), 186–195.[21] S. Goyal, J.M. Papadopoulos and P.A. Sullivan, Shock Protection of Portable Electronic Products: Shock Response Spectrum, Damage
Boundary Approach, and Beyond,Shock and Vibration4(3) (1997), 169–191.[22] ISO/TC-108/SC-N900-Standard, Mechanical Vibrationand Shock – Signal Processing – Part 4: Shock Response Spectrum Analysis,
2008.[23] D. Smallwood, Beyond the Shock Response Spectrum – Short-Course,78th Shock and Vibration Symposium, Philadelphia, PA., 2007.[24] D.E. Newland,An Introduction to Random Vibrations, Spectral and WaveletAnalysis, (3rd ed.), New York, Dover Publications, 2005.[25] D. Smallwood and T. Edwards, Energy Methods for the Characterisation and Simulation of Shock and Vibration – Short-Course,78th
Shock and Vibration Symposium, Philadelphia, PA., 2007.[26] M. Sheehy, M. Lishchynska, J. Punch, S. Goyal and G. Kelly, The Response of Micro-Scale Devices Subject to High-g Impact Stimuli,
Society for Experimental Mechanics – 11th International Congress and Exhibition on Experimental and Applied Mechanics, Orlando, FL.,2008.

International Journal of
AerospaceEngineeringHindawi Publishing Corporationhttp://www.hindawi.com Volume 2010
RoboticsJournal of
Hindawi Publishing Corporationhttp://www.hindawi.com Volume 2014
Hindawi Publishing Corporationhttp://www.hindawi.com Volume 2014
Active and Passive Electronic Components
Control Scienceand Engineering
Journal of
Hindawi Publishing Corporationhttp://www.hindawi.com Volume 2014
International Journal of
RotatingMachinery
Hindawi Publishing Corporationhttp://www.hindawi.com Volume 2014
Hindawi Publishing Corporation http://www.hindawi.com
Journal ofEngineeringVolume 2014
Submit your manuscripts athttp://www.hindawi.com
VLSI Design
Hindawi Publishing Corporationhttp://www.hindawi.com Volume 2014
Hindawi Publishing Corporationhttp://www.hindawi.com Volume 2014
Shock and Vibration
Hindawi Publishing Corporationhttp://www.hindawi.com Volume 2014
Civil EngineeringAdvances in
Acoustics and VibrationAdvances in
Hindawi Publishing Corporationhttp://www.hindawi.com Volume 2014
Hindawi Publishing Corporationhttp://www.hindawi.com Volume 2014
Electrical and Computer Engineering
Journal of
Advances inOptoElectronics
Hindawi Publishing Corporation http://www.hindawi.com
Volume 2014
The Scientific World JournalHindawi Publishing Corporation http://www.hindawi.com Volume 2014
SensorsJournal of
Hindawi Publishing Corporationhttp://www.hindawi.com Volume 2014
Modelling & Simulation in EngineeringHindawi Publishing Corporation http://www.hindawi.com Volume 2014
Hindawi Publishing Corporationhttp://www.hindawi.com Volume 2014
Chemical EngineeringInternational Journal of Antennas and
Propagation
International Journal of
Hindawi Publishing Corporationhttp://www.hindawi.com Volume 2014
Hindawi Publishing Corporationhttp://www.hindawi.com Volume 2014
Navigation and Observation
International Journal of
Hindawi Publishing Corporationhttp://www.hindawi.com Volume 2014
DistributedSensor Networks
International Journal of