shock waves in medicine and · pdf fileshock waves in medicine ... energy flux density or...
TRANSCRIPT


Shock Waves in Medicine
M. Thiel, M. Nieswand, M. Dörffel and R. Schultheiss
HMT High Medical Technologies, Kreuzlingerstrasse 5, 8574 Lengwil, Switzerland
Extracorporeal generated shock waves were introduced for medical therapy approximately 20 years ago to disintegrate kidneystones. Today shock waves are the first choice for the treatment of kidney and ureteral stones. Meanwhile shock waves have beenused in Orthopaedics and Traumatology to treat insertion tendinitis, non- or delayed unions, avascular necrosis of the head offemur and other necrotic bone alteration. Another field of shock wave application is the treatment of tendons, ligaments andbones of horses in veterinary medicine. The hypothesis of shock wave therapy for orthopaedic diseases is the stimulation of self-healing processes in tendons and bones. There are different shock wave devices in the market, which use different shock wavegenerating systems. Medical results with respect to success rates, number of shock waves per treatment and re-treatment ratediffer significantly. At the moment it has not yet been established a correlation between physical parameters such as pressure,energy flux density or total focal energy and medical results. The shock wave itself generated by the various systems showsdifferent properties and behaviour. Efficiency with respect to low re-treatment rates and low number of shock waves should be arequest of shock wave systems. Different shock wave generation principles will be compared and analysed under this focus.
INTRODUCTION
Shock waves used in medicine were generatedaccording to three different principles.
The electrohydraulic principle uses the tips of anelectrode as a source. The electrode is placed in thefirst focal point of a semi-ellipsoid and a high voltageis switched to the tips of the electrode. An electricalspark is generated between the tips and the shock waveis released as a result of the vaporisation of the waterbetween the tips. The spherical shock waves arereflected by a metal ellipsoid and focused into thesecond focal point, which in therapy is adjusted to thetherapeutic volume inside the patient’s body. Anessential characteristic of this principle is a real shockwave from the onset.
The electromagnetic principle uses a coil and ametal membrane placed opposite to it. A high currentpulse is released through the coil, generating a strongvarying magnetic field, which induces a high current inthe opposite membrane. The electromagnetic forcesaccelerate the metal membrane away from the coil,creating a slow, low-pressure acoustic pulse in water.An acoustical lens is used to focus the wave. Theamplitude of the focused acoustic wave increases in anonlinear fashion when the wave propagates towardsthe focal point.
The third principle forms acoustic waves by thepiezoelectric effect. A few hundred to some thousandcrystals are mounted on a spherical surface. A highvoltage pulse to the crystals causes them to contract,subsequent expansion generates a low pressure pulse inthe surrounding water. The system is self-focusing, bythe geometric shape of the sphere. Again, the shockwave is created by nonlinear and increasing
amplitudes during the propagation of the wave to thefocal point.
Physical Parameters
In Urology each lithotripter has a specificdisintegration capability per shock wave for a certainenergy level. The disintegration volume of alithotripter could be estimated by the followingequation:
V = ε E n (1)
where V is the total disintegration volume, ε is thespecific disintegration capability for a certain materialand n is the total number of applied shock waves. Inorder to find a dose-effect relationship forextracorporeal shock wave therapy in Orthopaedicsmanufactures agreed to measure and to publishphysical parameters of their devices. Physicalparameters like pressure, energy flux density, energyand focal extent should be compared with medicaltreatment parameters and results to find an optimaldosage for shock wave therapy of orthopaedic diseases.The parameters are available and it seems quite clearthat an easy correlation to only one parameter is notpossible. Our literature review has revealed thatelectrohydraulic shock wave devices need a lowernumber of shock waves per treatment and a lower re-treatment rate to cure a patient compared to othergenerating principles. New clinical studies have shownthat not only the treatment parameters but also theresults differ significantly between electrohydraulicand electromagnetic or piezoelectric generated shock

waves [1,2,3,4]. It is apparent that electrohydraulicgenerated shock waves are more efficient compared toother generating principles.
Table 1. Treatment parameters and results of clinical studiesIndication Device SW* Re-
treatmentrate
Successrate in %
Heel spur OssaTron° 1500 1 76EMSE 3800 1 not
reportedNon-union
OssaTron 1000-6000
1 87.5
EMSE 4000 4 - 6 67
* Number of shock waves per treatment° The OssaTron is an electrohydraulic orthopaedic shockwave device
Shock wave characteristic
A typical shock wave used in medicine can bedescribed as a single pulse with a wide frequency range(up to 20 MHz), high-pressure amplitude (up to 120MPa), low tensile wave (up to 10 MPa), small pulsewidth at –6 dB and a short rise time (< 10 ns). Folberthet.al. [5] compared the pressure distribution in the focalregion of two different shock wave generating systems,an electrohydraulic (Dornier HM3) and anelectromagnetic system (Siemens Lithostar Plus).Shock waves generated by an electrohydraulic systemshow a specific shock wave behaviour in the centre ofthe focus, in the vicinity of the centre and far fromfocus centre. The essential characteristics, such as shortrise time, small pulse width at –6 dB, high positivepressure amplitude and small tensile wave are fulfilled.This is different for an electromagnetic generatedshock wave. The essential characteristics are onlyfulfilled in the focus centre and in the vicinity of thecentre. This means electrohydraulic shock wavedevices generate shock waves in a large focus volume,whereas electromagnetic shock wave devices have areal shock wave only in the focus centre and in a smallarea around the centre. Orthopaedic shock wavedevices show the same behaviour [6].
Another difference between the shock wavegenerating principles is the ratio of the positivepressure amplitude and the tensile part.Electrohydraulic shock waves systems generate energyper shock wave mainly from the positive pressureamplitude while other systems generate it from thetensile part. The positive pressure and short rise timeare responsible for the direct shock wave effect. Thetensile part of a shock wave generates cavitationbubbles. These bubbles grow under the influence of thetensile wave [7].
Interfaces between two different materials withdifferent acoustic impedance influence the shock wavetravelling through the interface. Reflection, refractionat the interface and damping inside the material leadsto energy loss of the shock wave. An essentialcharacteristic of the electrohydraulic principle is theshock wave from the onset whereas other principlesstart with a slow, low pressure acoustic pulse. The veryfast pressure transition of electrohydraulic generatedshock waves (high pressure, short rise time) in a largefocal volume causes very high tension at the interfaces,so that the structure of the material cracks. This effectdepends on the plasticity of the material. The energy ofthe shock wave for the disintegration of kidney stonesdoes not cause severe alterations in intact bonestructures.
At present efficiency of orthopaedic shock wavedevices has only been analysed with in vitroexperiments. It is obvious that the situation iscompletely different in a water bath compared to thesituation in vivo. Many interfaces with differentacoustic properties are between the skin and thetreatment area. Therefore the shock wave itself and thefocus will change. The alteration of the shock waveand the focal volume could depend on the generatingprinciple because of the discussed differences betweenelectrohydraulic and electromagnetic or piezoelectricprinciples. Medical results such as treatmentparameters and success rates have shown thatelectrohydraulic generated shock waves are moreefficient and more successful compared to othergenerating systems (see Table 1).
REFERENCES
1. Ogden, J.A., et al., ESWT for heel pain. Final FDAstudy outcome at one year, Abstract of the 3rd ISMSTCongress Naples 2000, pp. 51.
2. Buch, M., et al., Prospective randomized placebocontrolled double blind multicenter study to evaluatesafety and efficacy of extracorporeal shockwave therapy(ESWT) in chronic plantar fasciitis, Abstract of the 4th
ISMST Congress Berlin 2001, www.ismst.com3. Wang, C-J., et al., Treatment of non-union of long bone
by extracorporeal shock waves, Abstract of the 3rd
ISMST Congress Naples 2000, pp. 60.4. Gigliotti, S., et al. Indications and limits of S.W. in
treatment of diaphyseal non-unions, Abstract of the 3rd
ISMST Congress Naples 2000, pp. 63.5. Folberth, W., et al., Journal of Stone Disease 4(1), 1-7
(1992)6. Steiger, E., Modellierung der Ausbreitung in
extrakorporalen Therapien eingesetzterUltraschallimpulse hoher Intensität, Dissertation,Universität Karlsruhe 1998.
7. Delius, M., Shock Waves 4, 55-72 (1994)

INTRODUCTIONSWL has been widely viewed as one of the most
effective means of removing kidney stones since it wasintroduced in the early 1980�s. In contrast, views onthe safety of SWL have changed as clinical experiencewith the protocol has increased. One of the first clinicalreports on SWL expressed the view that shock waves�do not cause damage in passing through body tissue�(1), but less than a year later another laboratoryreported renal injury in 63-65% of all SWL patients andthat 30% of SWL patients experienced immediate post-SWL reductions of effective renal plasma flow (2).Since then, there have been many reports of SWL-induced renal injury and impaired function in humanpatients and experimental animals (3,4). The morecurrent view on SWL-induced renal injury is that somedegree of renal damage occurs with virtually everySWL treatment (5).
ANIMAL MODELOur group has used the female farm pig as a model
system to determine the bioeffects of shock wavelithotripsy in that the pig kidney is similar in size,anatomy (including ureters) and function to the humankidney (3). Another advantage of the pig is that itsbody size allows us to position and treat the animalkidney in the unmodified Dornier HM3 lithotripterunder the identically conditions used in clinicalpractice. In these studies, F2 of the lithotripter isfocused on the lower pole calyx of the right kidney ofjuvenile pigs (6-7 weeks of age) and 2,000 shock wavesare applied at 24kV. Females are used because bothureters could be catheterized, thereby permittinganalysis of split renal function. The experimentaldesign of our studies marks the first attempt to correlatestructural and functional changes in the intact kidney
following shock wave treatment. Each animal wassubjected to a set of pre-SWL and 1- to 4-hour post-SWL evaluations, which included inulin and P-aminohippurate (PAH) clearances. At the end of thestudy, both kidneys were perfused with glutaraldehydeand routinely processed for morphologicalexamination.
Figure 1.
MORPHOLOGIC OBSERVATIONSGross examination of the kidneys revealed a large
subcapsular hematoma at the site of F2 for everytreated kidney. The site of injury within the renalparenchyma was localized to the region of F2, andextended the full height of the kidney (anterior toposterior surfaces) because this dimension was thesame as the height of F2 (Figure 1). Thus, the lesionextends from the renal capsule to papillary tip,including the calycal tissue region at F2 and then to theopposite renal surface. Those kidneys with asubcapsular hematoma always had a laceration thatextended from the cortex to the hematoma, which canbe clearly seen by in tissue sections (Figure 1). We
Shock Wave Lithotripsy (SWL) Induces Structural andFunctional Changes in the Kidney
A. P. Evana, L.R. Willisb, B.A. Connorsa and J.E. Lingemanc
aDepartment of Anatomy and Cell Biology, Indiana University, Indianapolis, IN 46223bDepartment of Pharmacology & Toxicology, Indiana University, Indianapolis, IN 46223
cMethodist Research Institute, Indianapolis, IN 45202
Early clinical studies suggested that SWL was free of bioeffects. However, recent experimental and clinical studies haveclearly documented acute and chronic renal changes. The foundation for understanding the characteristics and consequences ofclinical SWL-injury has been well controlled renal structural and functional studies in the pig, a model that closely mimics thehuman kidney. Our studies show that 2000 shocks at 24 kV administered by the Dornier HM3 induces a predictable,irreversible vascular injury at F2 that is associated with a transient renal vasocontrictive event in both treated and untreatedkidneys. The SWL-induced trauma is associated with inflammation at the site of damage. While lesion size increases with kVlevel and shock wave number, the pronounced vasoconstriction has a lower threshold for these same parameters. Kidney sizeand pre-existing renal injury are also risk factors for SWL exaggerated impairment of renal tubular and hemodynamic functionobserved at a clinical dose. Thus, there is still a concern that SWL may generate a major health risk for some stone patients.
Site ofHemorrhage

know from our other studies that by reducing the shocknumber to 1000 at 24kV, fewer kidneys showed asubcapsular hematoma.
Examination of the lesion sites by light andtransmission electron microscopy revealed themorphological lesion to be unique, in that the physicalforces of the pressure wave tore, lacerated and rippedthrough the wall of most veins and capillaries located inF2 producing primarily a vascular insult (6). Evidenceof extensive endothelial damage in these veins wasnoted by a loss of endothelial cells and the immediateattachment of numerous polymorphonuclear cells(PMNs) and activated platelets to the luminal surface ofthese vessels depicting a vasculitis. Medium to smallarteries also showed a unique injury. By lightmicroscopy, injured vessels are identified by acharacteristic swelling of the tunica media, whichresults in extensive narrowing of the vessel lumen.Sites of frank rupture are also seen. Destruction of theendothelium and vascular smooth muscle cells resultedin focal laceration sites causing hemorrhage into theintracellular spaces. Thrombus formation was oftenseen at these sites of breakage along with numerousplatelets and PMNs. It is these vascular changes thatmay explain in part the intense vasoconstriction notedin the treated kidney.
Tubular and interstitial cell injury was also noted inthe region of the vascular damage and wascharacterized by rips and tears that pass through thebasement membrane and nearby cells resulting inirreversible cell necrosis. An immediate inflammatoryresponse was also noted around these damaged tubulesand interstitial cells. A process of tubulo-interstitialnephritis has been established immediately after SWLtreatment. These site of injury over time becomeregions of scar tissue with a loss of tubules and vessels.
FUNCTIONAL OBSERVATIONSGross hematuria was consistently noted from the
ureter of the treated kidney after the application of 200shocks. The primary functional change found was avasoconstrictive response in both kidneys (treated anduntreated) (7). Renal plasma flow (measured by PAHclearance) was reduced as much as 60% in the treatedkidney and by 35% in the untreated kidney 1-hour post-SWL (Figure 2). By 4-hours post-SWL the values forRPF in the untreated kidney were near baseline while asignificant reduction was still noted in the treatedkidney. SWL significantly reduced glomerularfiltration rate (GFR) to a similar degree in both kidneyover the same time periods (values not shown). Para-aminohippurate, a indicator of tubular function wasonly reduced in the treated kidney. These studiesdemonstrate that shock waves delivered at a number
Figure 2.
and intensity similar to that used to treat stone patientsinduces an injury that is predictable in size, focal inlocation and unique in the types of injuries (primarilyvascular insult) induced. There is also a marked acutereduction in renal hemodynamics in both kidneys.Concern exists for the long-term consequences ofthese SWL-induced structural and functional changes.
ACKNOWLEDGMENTS
These studies were funded through a United StatesPublic Health Service Grant PO1 DK43881.
REFERENCES
1. C. Chaussy, J. Schuller, E. Schmiedt, H. Brandl, D.Jocham and B. Liedl, Urol. 23, 59-66 (1984).2. J.V. Kaude, C.M. Williams, M.R. Millner, K.N.Scott and B. Finlayson, Am. J. Roentgenol. 145, 305-314 (1985).3. A.P. Evan, L.R. Willis, B. Connors, G. Reed, J.A.McAteer and J.E. Lingeman, Am. J. Kid. Dis. 17, 445-450 (1991).4. D.M. Kaji, H.W. Xie, B.E. Hardy, A. Sherrod andJ.L. Huffman, J. Urol. 146, 544-547 (1991).5. J.E. Lingeman, J.Urol. 145, 1002 91992).6. A.P. Evan, L.R. Willis, J.E. Lingeman, and J.A.McAteer, Nephrol. 78, 1-8 (1998).7. L.R. Willis, A.P. Evan, B.A. Connors, P.Blomgren, N.S. Fineberg and J.E. Lingeman, J. Am.Soc. Nephrol. 10, 1753-1762 (1991).

Correlation between the predicted stress field andobserved spall-failure in artificial kidney stones treated by
shock wave lithotripsy (SWL) in vitro
R. O. Clevelanda, J. A. McAteerb, and J. C. Williams Jr.b
aDepartment of Aerospace and Mechanical Engineering, Boston University, Boston, MA 02215, USAbDepartment of Anatomy and Cell Biology, Indiana University School of Medicine, Indianapolis, IN 46202, USA
We attempted to predict the failure of kidney stones due to the direct stress field of the lithotripter shock wave (SW). Numericalsimulations of the acoustic field inside stones were carried out with a finite-difference time-domain (FDTD) code in a two-dimensional geometry. The code could model arbitrary shaped interfaces between the fluid and stone. Predictions from thecode indicated that the peak tensile stress inside the stone was highly sensitive to the geometry of the distal surface of the stone;in particular curved surfaces produced a strong focusing effect. Focusing was weak for stones less than 3 mm in diameter.
INTRODUCTIONShock wave lithotripsy has revolutionized the treat-ment of kidney stones and is used in approximately90% of cases in the United States. Despite this there isno agreement in the literature as to the mechanism bywhich shock waves break kidney stones. There is alsogrowing recognition that lithotripsy induces significantdamage to the kidney.[1] A better understanding ofhow shock SWs fragment kidney stones and how SWsimpact tissue may provide a path towards safer moreefficacious lithotripsy.
Five mechanisms have been proposed to explainSW comminution of kidney stones: Spallation;Superfocusing; Cavitation; Squeezing; and Fatigue.We have observed, in vitro, that stone destructionquickly progresses through a cascade of fragmentationfrom large pieces to fragments about 3-4 mm indiameter. The destruction of these fragments into 2mm gravel (a size sufficiently small for a clinicallypositive result) can take a long time. We used anumerical model to study the effect of stone size andgeometry on the mechanisms of spallation andsuperfocusing. We limited our study to assessment oftensile stress as the majority of kidney stones, likemost brittle materials, are weakest in tension.
COMPUTATIONAL MODEL
Our model equation was the linear acoustic waveequation for lossy, inhomogeneous media:
Here p is acoustic pressure, c0 small-signal sound-speed, and ρ0 density. We have neglected the presenceof shear waves in the stone because for the geometriesunder consideration shear waves will have a limitedimpact on the tensile stress in the stones. We have alsoneglected the impact of nonlinearity and absorption asthe propagation distances considered are short enoughthat the distortion from these effects will be weak. Theequation was solved on a flat two-dimensionalcartesian grid using a finite-difference time-domain(FDTD) algorithm that was second-order accurate intime and fourth-order accurate in space.[2]
RESULTSThe focused shock wave was modelled as an incidentplane wave (a reasonable assumption in the focalregion) with a peak positive pressure of 40 MPa and apeak negative pressure -6.5 MPa.[3] The acousticproperties were: water c0=1500 m/s, ρ0=1000 kg/m3,and stone c0=3000 m/s, ρ0=1700 kg/m3.
In Figure 1 we compare the prediction of the peaktensile stress in a square stone and a circular stone. Inthe square stone the incident compressive phase isinverted upon reflection from the distal surface andthere is constructive interference with the trailingtensile phase of the lithotripter pulse. This results in aregion of tensile stress near the distal surface of thestone which can result in failure by spall. In the caseof the circular stone the incident shock wave isreflected (and inverted) as a converging wave from theconcave distal surface. The peak tensile stress in thiscase is produced by focusing of the reflected wave-front, we refer to this as superfocussing, and leads to alocalised region of tensile stress.[4] Although the
∇ − = ∇ ⋅ ∇2
02
2
20
0
1p
c
p
tp
∂∂
ρρ

resulting region of high tensile stress is different forthe two shapes the peak tensile stress is of similaramplitude, in excess of 70 MPa.
FIGURE 1. Predicted peak tensile stress inside: (a)10 mm square stone with a spall plane; (b) 10 mmdiameter circular stone with a superfocusing spot.
Figure 2 shows the calculated peak tensile stress forsmaller circular stones. In the 6.5 mm diameter stonethe peak tensile stress has been reduced to 55 MPa andin the 3 mm stone the peak tensile stress is just 37 MPa- about half that in the 10 mm stone. The small regionof tensile stress that occurs near the proximal surfaceis due to a subsequent reflection of the shock waveinside the stone from the proximal surface.
DISCUSSION AND CONCLUSIONSWe have shown that the region of high tensile
stress is dependent on stone shape. Square stones, witha flat distal surface, produced a larger region of hightensile stress than a circular stone. For circular stonesthe amplitude of the peak tensile stress reduced as thestone diameter reduced. A threshold should existwhere the tensile stress generated inside the stone is nolonger large enough to fragment it. We speculate that
multiple mechanisms may contribute to the initialbreak up of stones, and that when fragments become 3-4 mm in size those mechanisms that are dependent onstone size and shape (e.g. spall and superfocussing) areno longer effective, and a second mechanism, such ascavitation, is necessary to fully comminute the stone.
ACKNOWLEDGMENTSSupport: National Institutes of Health P01-DK43881.
REFERENCES1. Evan A P, and McAteer J A, "Q-Effects of shock wave
lithotripsy," in Kidney Stones: Medical and SurgicalManagement. Eds. F. Coe, C. Pak, G.M. Preminger,New York: Raven, 1996, pp. 549-570.
2. IM Hallaj and RO Cleveland, J. Acoust. Soc. Am 105:L7—12, 1999.
3. Church CC, J. Acoust. Soc. Am, 86:215-227, 1989.
4 . Gracewski SM, Dahake G, Ding Z, Burns SJ, andEverbach EC, J. Acoust. Soc. Am, 94: 652-661 (1993).
FIGURE 2. Predicted peak tensile stress for a circularstone: (a) 6.5 mm diameter (b) 3 mm diameter.

Generation of very High Pressure Pulse using 1 Bit Timereversal in a solid Waveguide : Application to Lithotripsy
G.Montaldo, P.Roux, A. Derode, C. Negreiraa, M.Fink
Laboratoire Ondes et Acoustique, ESPCI, 10 rue Vauquelin, 75005, Paris, Francea Laboratorio de Ultrasonido, Inst. De Fisica, Fac. De Ciencias, Montevideo, Uruguay
The use of piezoelectric transducers array has open the possibility of electronic steering and focusing the beam to track the stone.However, due to the limited pressure delivered by each transducer (typically 10 bars), the number of transducers needed to reachat the focus an amplitude of the order of 1000 bars is typically of some hundreds elements. Here, we present a new solution thatcombines the use of time reversal method with a small number of transducers that generate low amplitude waveforms in a solidwaveguide to obtained shock wave of very high amplitude in tissues located in front of the waveguide.
INTRODUCTION
Today extracorporeal shock wave lithotripsy is by farthe method of choice to treat kidney and gall stones. Itinvolves the use of large amplitude acoustic shockwaves that are generated extracorporeally and focusedonto a stone within the body. Lithotripters typicallyhave a high focusing gain so that pressures are high atthe stone but substantially lower in the surroundingtissue. The positioning of the patient alignment ofstone with the lithotripter focus is accomplished withfluoroscopy or ultrasonic imaging. Focusing isachieved geometrically, i.e., with ellipsoidal reflectors,concave focusing arrays of piezoelectric transducers,or acoustic lenses. The shock waves utilised haveamplitudes at the focus of the order of 1000 bars andduration of a few microseconds. Shock waves aretypically fired at a 1 s pulse repetition rate.The use of 2D arrays of piezoelectric transducers hasopen the possibility of electronic steering and focusingthe beam in biological tissues. Tracking focusingprocedures have also been studied [1]. The feasibilityof a piezoelectric shock wave generator in which thefocal zone is moved electronically to track the stoneduring a lithotripsy treatment using time reversaltechnique has been implemented and tested. Howeverin such techniques, the number of transducers neededto reach at the focus an amplitude of the order of 1000bars is typically of some hundreds elements. This ismainly due to the fact that today the piezoelectrictransducer technology allows to deliver in front of a
transducer an amplitude limited to 10 bars. Thepressure generated by a transducer is proportional tothe electric field applied between its two electrodesand to avoid breaking phenomena the value of theusual fields is limited to 2 kV/mm that correspondstypically to 10 bars.Despite the spatial gain due to the spatial focusing, thenumber of transducers cannot be reduced if the beamhas to be steered in attenuating tissues. As in timereversal technology, each transducer has its ownelectronic to record, time-reversed and retransmit thestone echo, the price of an electronic board of somehundred channels is yet very high and limits thecommercial interest of such lithotripter.In this paper, we propose a new elegant solution thatcombines the use of time reversal technology with asmall number of piezoelectric transducers that generatelow amplitude waveforms in a solid waveguide toobtained shockwave of very high amplitude in tissueor in a fluid located in front of the waveguide.In this technique, we use the fact, that due to the timereversal invariance of the elastic wave equation in alossless solid, for every burst of ultrasound divergingfrom a source and possibly multiply reflected by theboundaries of the waveguide- there exists in theory aset of elastic waves that precisely retraces all of thesecomplex paths and converges in synchrony, at theoriginal source, as if time were going backwards [2].As the temporal dispersion of the waveguide increases,the time reversed wave is temporally recompressedwith a stronger amplitude amplification. Typically, fora one microsecond initial pulse transmitted in thewaveguide, if the signals dispersed and recorded by

some transducers have durations of some milliseconds,the time reversed waveform will refocus both in thetime domain and in space to generate a onemicrosecond pulse at the source position. Such aspectacular effect allows to reach very high spatio-temporal recompression and to obtain with a smallnumber of transducers the amplitude needed to breakstones. In this presentation, we study this techniqueand we show that the technique give even morespectacular results when we practice a 1 bit timereversal operation instead of a classical 8 bit operation.
THE EXPERIMENT
The experiment is performed between a pointsource in water and seven 8-mm piezo-electrictransducers fastened to a section of a 3.2-cm diameter,50-cm length duraluminium cylinder. Both the sourceand the transducers are linear and reversible : theywork in reception and in transmission. The centralfrequency is 1 MHz with a 75% bandwidth, whichcorresponds to a 5-mm central wavelength forcompressional wave in duraluminium. The bottom endof the metallic cylinder is immerged in water at adistance d from the source (d between 0-10 cm). Eachtransducer is connected to an electronic circuitrywhich consists of :
- two 15-MHz sampling-rate, 8-bit D/A andA/D converters to receive the incident signal andtransmit the time-reversed signal.
- a memory which records the incident signalsent from the source.
- a processor which creates a time-reversedversion of the incident signal.According to these characteristics, classical timereversal is then 8-bit time reversal. On the other hand,during a 1-bit time reversal experiment, only the signof the time reversed signal is transmitted (+V if s(t)>0,-V if s(t)<0, where V is the maximum amplitude of theinput signal)
After transmission of a pulse from the sourcein S, the signal spreads in time because of manyreverberations on the interfaces of the solidwaveguide. The signal lasts more than 2000 µs, i.e.around 1000 times the length of the initial pulse. In aduraluminium sample, 2 ms correspondsapproximately to a 10-m distance, to be compared tothe 50-cm length of our cylinder. This means thatmany round trips inside the cylinder are present in thedispersed signal. We observe a remarkable timecompression on the initial source in S. This confirmsthat the amplitude information which has been ignoredwith 1-bit time reversal is not necessary to successfullyperform a time reversal experiment in a solidwaveguide.
REFERENCES
1. J.L Thomas, F. Wu, M. Fink, “Time Reversal MirrorApplied to Litotripsy”, Ultrasonic Imaging, Vol 18, 1996, p106-121
2. P. Roux and M. Fink, “Time reversal in a waveguide: study of the temporal and spatial focusing”, J. Acoust.Soc. Am., 107 (5), pp 2418-2429, 2000.

INTRODUCTION
The application of 2000 shock waves at 24 kV outputenergy to the lower pole calyx of young farm pigsdamages renal tissue in the shocked kidney [1] andreduces renal plasma flow (RPF) and glomerularfiltration rate (GFR) in both kidneys (Figure 1) [2]. There are at least two explanations for the reductionin RPF in the unshocked kidneys. In one instance,renal autonomic nerves may have been activated by theshock waves. Alternatively, there may have been thelocal or systemic release of a vasoconstrictor substance. The present study investigated the role of renal nervesin regulating the vasoconstrictive response in theunshocked kidney by unilaterally denervating onekidney and bilaterally measuring RPF before and afterSWL.
METHODS
Four 6-week-old anesthetized female farm pigsunderwent asceptic laparoscopic denervation of onekidney. Visible renal nerves were dissected and cut,and the artery was painted with 10% phenol. Allincisions were then sutured closed and the animals weresent to recovery. Two weeks later, the pigs werereanesthetized and prepared for measurements of renalclearance. Catheters were placed in appropriate arteriesand veins for infusions of fluids, measurement ofarterial blood pressure, sampling of arterial blood, andbilateral collections of urine and renal venous blood.
FIGURE 1. Figure showing renal plasma flow beforelithotripsy, and 1 and 4 hours after lithotripsy treatment.Animals were treated in a unmodified Dornier HM-3 with2000 shock waves at 24 kv focused on the lower pole calyxof one kidney. Data are expressed as mean ± S.E. Asteriskindicates a significant difference from baseline at p < 0.05.
The clearance (C) and renal extraction (E) of p-aminohippurate (PAH) were determined forcalculation of �true� renal plasma flow (RPF) for each
The Role of Renal Nerves in the Reduction of Kidney BloodFlow Observed After Shock Wave Lithotripsy (SWL)
Bret A. Connorsa, Andrew P. Evana, Lynn R. Willisb, Jay R. Simonc
Arieh L. Shalhavd, David Lifshitzd, Ryan F. Patersond and James E. Lingemand
aDepartment of Anatomy and Cell Biology, Indiana University, Indianapolis, IN 46202bDepartment of Pharmacology & Toxicology, Indiana University, Indianapolis, IN 46202
cDepartment of Psychiatry, Indiana University, Indianapolis, IN 46202dMethodist Research Institute, Indianapolis, IN 45202
A reduction in renal blood flow (65% in shocked kidneys, 33% in contralateral unshocked kidneys) has been observed followingdelivery of a clinical dose of shock waves (SWs) (2000 SWs, 24 kV, Dornier HM3) to only one kidney. Using a porcine renaldenervation model the role of renal nerves in blood vessel constriction after SWL was examined. Pigs (6 weeks old) underwentunilateral renal denervation. Nerves along the renal artery of one kidney were identified, sectioned and painted with 10% phenol.After two weeks the pigs were anesthetized and renal function was determined using inulin and PAH clearance. The lower poleof the innervated kidney was then treated with 2000 SWs. Bilateral renal plasma flow (RPF) was measured 1 hour before and 1hour after SWL. Both kidneys were then removed for analysis of norepinephrine (NE) content. Blood flow was reduced 50% inthe shocked kidney. However, the contralateral denervated kidney (NE levels 8.7% of control) exhibited 0% change in bloodflow. The blunted vascular response in the contralateral denervated kidney suggest that the SWL pressure wave stimulates renalnerve activity in intact unshocked kidneys.

kidney. (RPF=CPAH ÷ EPAH), and the clearance ofpolyfructosan was determined as an index of GFR.
The innervated kidney of each pig was then targetedfor application of 2000 shock waves at 24 kV (HM-3lithotripter) output energy to the lower pole calyx.Timed collections of urine and blood were obtainedfrom each kidney prior to and at 1 and 4 hours afterSWL for determination of RPF and GFR. At the end ofthe study six 1-gram samples of cortical tissue weretaken from each kidney (3 from each pole) fordetermination of norepinephrine (NE) content.
RESULTS AND DISCUSSION
The NE content of denervated kidneys was 1.2 ±0.5% of that in the contralateral innervated kidneys onthe day of the experiment. SWL produced thecharacteristic vasoconstictor effect in the shocked,innervated kidneys; i.e., RPF was reduced by more than50% within 1 hour after SWL and had returned nearlyto baseline 3 hours later (Figure 2). GFR was likewisereduced by nearly 50% at the 1-hour measurement, andwas returning to baseline at 4 hours post-SWL (data notshown). In contrast, 3 of 4 denervated kidneysdemonstrated no change in RPF or GFR at the 1-hourdetermination (Figure 2, RPF only). On average,neither RPF nor GFR in the denervated kidneys differedsignificantly from baseline over the 4-hour post-SWLcourse of the experiments. These preliminary data support the hypothesis that therenal nerves mediate the reductions of GFR and RPFthat typically occur in contralateral unshocked kidneysafter the application of shock waves to the oppositekidney. Presumably, the shock waves may activate asensory-afferent/sympathetic-efferent arc [3] beginningwith sensory nerves in the shocked kidney and endingwith efferent sympathetic nerves to the contralateralkidney. It follows that sensory nerve traffic from shockedkidneys would activate sympathetic efferent nerves toboth kidneys, contributing in part or in toto to theSWL-induced reductions of blood flow in shocked andunshocked kidneys alike. However, because RPF isordinarily reduced to a greater degree in the shockedkidneys than in the contralateral kidneys, the greatervasoconstriction in the shocked kidneys may reflect theadditive effects of sympathetic stimulation and locally-released vasoconstrictors. In any case, the presentstudy was not designed to evaluate the role of nerves inthe hemodynamic response of shocked kidneys toSWL.
ACKNOWLEDGEMENTS
These studies were funded through a United StatesPublic Health Service Grant PO1 DK43881 and
through the AFUD/AUA Research Scholar Program(RPF).
FIGURE 2. Figure showing the showing renal plasma flowbefore lithotripsy, and 1 and 4 hours after lithotripsytreatment. Animals were treated in a unmodified DornierHM-3 with 2000 shock waves at 24 kv focused on the lowerpole calyx of one kidney. Data are expressed as values fromindividual animals (solid lines) and mean ± S.E. (dashedlines). Asterisk indicates a significant difference frombaseline at p < 0.05.
REFERENCES
1. Evan, A.P., Willis, L.R., Connors, B.A., Reed, G.,McAteer, J.A., and Lingeman, J.E., Am. J. Kid. Dis.17, 445-450 (1991).2. Willis, L.R., Evan, A.P., Connors, B.A., Blomgren,P.M., Fineberg, N.S., and Lingeman, J.E., J. Am. Soc.Nephrol. 10, 1753-1762 (1999).3. Kopp, U.C., Olson, L.A., and DiBona, G.F., Am. J.Physiol. 246, F67-F77 (1984).

Localized cavitation detection in lithotripsy in vivo
M. R. Baileya, L. A. Cruma, N. Millera, O. A. Sapozhnikovb, Y. A.Pishchalnikovb, J. A. McAteerc, B. Connorsc, and A. P. Evanc
aCenter for Industrial and Medical Ultrasound, Applied Physics Lab, University of Washington, Seattle, USAbDepartment of Acoustics, Physics Faculty, M.V. Lomonosov Moscow State University, Moscow, Russia
cDepartment of Anatomy, Indiana University School of Medicine, Indianapolis, IN, USA
In order to determine if cavitation occurs within kidney tissue during shock wave lithotripsy (SWL) we devised a localizationsystem in which our lithotripter source, two single-element transducers and an ultrasound scanhead were aligned confocal andorthogonal. B-mode imaging and fluoroscopy showed the position of the focus within the kidney. Hyperechoic clouds in theimage indicated pockets of bubbles during SWL. A coincidence-detection algorithm and the confocal transducers made itpossible to localize cavitation to within a 2x2x2 mm region. Cavitation was detected in pig kidneys during SWL. FollowingSWL, the tissue region that was SW treated and simultaneously interrogated was marked with a lesion produced by using thedetection transducers as high intensity focused ultrasound (HIFU) sources. Thus, with this system in which we were able tocorrelate anatomical targeting (x-ray and ultrasound) with echogenicity, bubble collapse acoustic emissions, and a dual-sourceHIFU lesion we conclude that lithotripter SW's produce cavitation not only within the renal collecting system, but withinkidney tissue as well.
INTRODUCTION
Cavitation is suspected to play a role in stonecomminution and in collateral tissue injury duringshock wave lithotripsy (SWL). [1, 2] Hyperechoindicative of bubbles has been seen in the collectingsystem and surrounding the kidney in vivo with B-mode ultrasound. [3, 4] Cavitation has also beendetected in vivo with a single focused hydrophone[5,6], however it is difficult to be sure detection waswithin tissue. Cleveland et al[7] devised and tested invitro the use of 2 focused receivers and coincidencedetection to better resolve the location of thecavitation. Here, we report on the simultaneousapplication of dual passive cavitation detection (PCD)and B-mode imaging to detect cavitation in kidneytissue during SWL.
EXPERIMENTAL METHOD
Experiments were conducted in a Dornier HM-3electrohydraulic lithotripter (Dornier System GmbH,Germany). Two orthogonal single element listeningtransducers (1.1 MHz, aperture 10 cm, radius ofcurvature 10cm) were mounted rigidly around thelithotripter reflector confocal with the lithotripter.Signals were high-pass filtered at 300 kHz, recordedon Tektronix TDS 744 oscilloscope (Beaverton, OR),and acquired and analyzed using LabVIEW software(National Instruments, Austin, TX, USA). Presenteddata have been rectified and smoothed to get the
envelope of the signal. The lithotripter pulse firstcollapses bubbles then sets them into a growth thatends in collapse driven by the inertia of thesurrounding fluid. The characteristic cavitation signalin SWL is two strong spikes, corresponding to eachcollapse, separated by time tC. The receivers arefocused and most sensitive to a 2x14 mm cigar-shapedregion. With two receivers and coincidence detectionthe region can be made considerable smaller to avolume of nearly 8 mm3.
A 3-MHz phased array cardiac scanhead of a Sonosite180 ultrasound-imaging machine (Bothell WA, USA)was mounted between the 2 receivers such that theimage plane was parallel to the receiver axes. Imageswere stored on videotape and later analyzed withAdobe PhotoShop software (Mountain View, CAUSA). Alternatively ring transducers were used withthe imaging probe within them; however, the datareported in this paper is not with the ring transducers.
Anesthetized juvenile pigs (20 kg) were treated withSWL as described by Blomgren et al.[8] Lithotriptercharging potentials were 18 and 24 kV. Not more than2000 lithotripter pulses were administered andelectrodes were replaced after every 1000 pulses.
The B-mode imaging and the fluoroscopy system ofthe Dornier HM-3 were used to align the pig kidney.The detection system and the lithotripter were focused

first in the collecting system and then in the tissue ofthe lower pole.
RESULTS
Hyperecho on the B-mode image was seen in thecollecting system during SWL at both 18 and 24 kV.Bright flashes were seen with in the first 5 pulses at 18kV and within 1-3 at 24 kV. Within 10 pulses, thecollecting system was filled with white. Very rarely(<1% of the pulses) a flash of white was seen in thetissue image.
Figure 1 shows dual PCD data collected in the fluid-filled collecting system. The signal amplitude in mVis plotted versus time. Lithotripter charging potentialwas 18 kV. Channel 1 is on top and Channel 2 isbelow. The second channel data is inverted in aneffort to ease comparison. Both channels detected astrong signal at 70 µs when the lithotripter pulse
arrived and at 405 µs. The average tC for N=250pulses was 448±76 µs at 18 kV and 681±112 µs at 24kV. Signals were detected 35% of the time at 24 kV.
Figure 2 shows dual PCD data collected in the lowerpole at 18 kV. A spike at 70 µs and at 680 µs isevident on both channels. tC is 562±93 µs at 18 kV and745±143 at 24 kV. Signals were weaker than in thecollecting system and less common (N=250) 10%detection. There are more spikes between 70 and 300
µs. Spikes in this region varied but were very rarelycoincident.
CONCLUSIONS
An ultrasound image-guided, localized cavitationdetection and marking system was devised and tested.Cavitation was detected by dual passive cavitationdetection (PCD).[7] Two focused receivers and
coincidence detection allows us to detect within thetissue and within the fluid of the collecting system.Two charging potentials were tested 18 and 24 kV. Intissue the time tC, over which the bubbles grow andcollapse, appears equal or slightly longer in tissue thanin the collecting system fluid, 562±93 µs and 448±76µs at 18 kV and 745±143 and 681±112 at 24 kV.PCD signals as well as hyperecho in the B-modeultrasound image were detected much readily in thecollecting system than in tissue.
The focal location and size could be assessed in vivoby using image-guided high intensity focusedultrasound (HIFU). In this way we could verify thatrefraction in the tissue did not greatly distort ouralignment and that we were listening in tissue.
ACKNOWLEDGMENTS
We gratefully acknowledge support from NIHDK43881, NIH DK55674, NIH Fogarty, and CRDF.
REFERENCES
1. Evan, A.P. and J.A. McAteer, in Kidney Stones: Medicaland Surgical Management, F. Coe, C. Pak, and G.M.Preminger, Editors. 1996, Raven: New York. p. 549-570.
2. Sass, W., M. Braunlich, H. Dreyer, E. Matura, W.Folberth, H. Priesmeyer, and J. Seifert,. Ultrasound MedBiol, 1991. 17: p. 239-243.
3. Cleveland, R.O., L.A. Crum, D.A. Lifshitz, B.A.Connors, A.P. Evan, L.R. Willis, and J.E. Lingeman,. JAcoust Soc Am, 1997. 102: p. 3154
4. Delius, M. and S. Gambihler. Digestion, 1992. 52: p. 55-60.
5. Coleman, A.J., M.J. Choi, J.E. Saunders, and T.G.Leighton, Ultrasound Med Biol, 1992. 18(3): p. 267-281.
6. Zhong, P., I. Cioanta, F.H. Cocks, and G.M. Preminger, JAcoust Soc Am, 1997. 101: p. 2940-2950.
7. Cleveland, R.O., O.A. Sapozhnikov, M.R. Bailey, andL.A. Crum,. J. Acoust. Soc. Am., 2000. 107(3): p. 1745-1758.
8. Blomgren, P., B.A. Connors, J.E. Lingeman, L. Willis,and A.P. Evan,. Anat Rec, 1997.
FIGURE 1: Dual PCD signals from the kidney fluid.
FIGURE 2: Dual PCD signals from the kidney tissue.

Although in vitro model systems are used frequently in lithotripsy research, few attempts have been made to compare in vitroresults directly with those in vivo. To determine if in vitro stone fragmentation correlates with that in vivo, gypsum stones wereexposed to SWL in two systems: In vivo, stones were placed into pig kidneys and exposed to SW’s in an unmodified Dornier HM3lithotripter. 400 SW’s (20 kV) were delivered at two rates. In vitro, stones were placed on plastic mesh inside a polypropylene tube,and exposed to SW’s in an HM3-like research lithotripter. At 0.5 Hz, SW's in vitro yielded 280±34% breakage (increase in surfacearea, n=8), while in vivo breakage was 327±26% (n=6). At 2 Hz, in vitro breakage was 101±16% (n=20), while in vivo was 134±47%(n=7). Statistically, in vitro and in vivo effects did not differ, while the effect of SW rate was significant in both. Thus, with the invitro system and lithotripters used here, both absolute stone breakage and rate effects were similar to what was observed in vivo.
In Vitro Model of Shock Wave Lithotripsy (SWL) ProducesStone Breakage Equivalent to that Seen In Vivo
James A. McAteer1, Ryan F. Paterson2, David A. Lifshitz2, James E. Lingeman2,Drew L. Rietjens1, Bret A. Connors1, Andrew P. Evan1, and James C. Williams, Jr.1
1Department of Anatomy & Cell Biology, Indiana University School of Medicine, Indianapolis, IN 46202, USA2Methodist Hospital Institute for Kidney Stone Disease, 1801 North Senate Blvd., Indianapolis, Indiana 46202, USA
INTRODUCTIONThe progress that has been made in understanding the
mechanisms by which lithotripter shock waves commi-nute stones and damage tissue is due in large part to workdone in vitro. The in vitro situation offers greater controlof experimental variables than can usually be done invivo. For example, studies in which overpressure is ap-plied to stones or cells being exposed to shock waves [1]would be difficult or impossible to carry out in anythingother than an in vitro setting, and even simpler experi-ments can benefit from the control of extraneous vari-ables that is possible with an in vitro approach.
This “in vitro advantage” is just as apparent in studiesof stone comminution as it is in studies of cell or tissuedamage. For example, the development of artificial stoneshas been important in providing experimental targets forlithotripsy that have less variability in fragility than isseen in natural stones [2]. Studying comminution of arti-ficial stones in the in vitro setting offers the best combi-nation for carrying out a well-controlled experiment.
However, it is also possible that the in vitro environ-ment can fail to mimic the environment of the stone invivo. While cavitation activity is generally high in samplesexposed to lithotripter shock waves in vitro, the amountof cavitation activity in vivo could be much lower [3,4].If this is the case, then conclusions made about, say, therole of cavitation in stone comminution could be in errorif they are based solely on in vitro studies.
The work described here utilized a unique model inwhich artificial stones were implanted into pigs and ex-posed to lithotripter shock waves at two rates in a settinglike that seen in the clinic. Identical stones were treatedin vitro with the same dose of shock waves, and at thesame two rates of shock wave delivery. Thus, the artifi-cial stones—representing a reproducible target for test-
ing comminution—were exposed to the same shock wavetreatment under in vivo and in vitro conditions, provid-ing an excellent comparison of the possible effects ofenvironment on lithotripsy.
METHODS Artificial Stones. Stones were cast in polystyrene
multiwell plates using a commercial hydrated gypsum(Ultracal-30, USG, Chicago, IL, USA). Polystyrene wasdissolved away with chloroform, leaving artificial stonesin the shape of slightly tapered cylinders (7.5 mm longby 6.5 mm mean diameter). Stones were stored underwater and used within one week after casting.
In Vitro Study. Stones were placed in a plastic vialover a nylon mesh with 2 mm spaces and positioned atthe focus of a research lithotripter that delivers a shockwave equivalent to that of the Dornier HM3 [5]. A plas-tic apron covered with polyethylene was used to catchthe falling fragments. Following delivery of 400 shockwaves (20 kV, 0.5 or 2 Hz), the retained and passed frag-ments were collected, spread out in a dish, dried, andscanned on a flatbed scanner. The projected surface areaof the fragments was measured using appropriatethresholding, and the data expressed as the increase inarea over that of an untreated stone.
Implantation and Lithotripsy of Artificial Stones InVivo. Stones were implanted in both kidneys of femalefarm pigs (~45 kg) using a percutaneous access similarto that performed in percutaneous nephrostolithotomy forthe removal of stones from patients. Upper pole periph-eral calyceal puncture was performed with an 18 gasplenic needle and the tract was dilated using aNephromax balloon and Amplatz sheath. A rigidnephroscope was used to visualize the renal collectingsystem and to guide one stone into a lower pole calyx,one stone per kidney. During a 2 hr recovery period urine

output returned to normal. Renal ultrasonography andfluoroscopy were used to confirm stone position. Therewas no occurrence of hydronephrosis, minimal peri-nephric fluid and no air within the collecting system. SWLwas performed using a Dornier HM3 lithotripter (unmodi-fied: 80 nf capacitor). Stones were targeted via biplanarfluoroscopy—initially and at every 50 shock waves.Shock waves were delivered uninterrupted; 400 shockwaves per stone, 20 kV, 0.5 Hz or 2 Hz. Following lithot-ripsy, the urinary tract was removed en bloc and dissectedin a retrograde manner to locate stone fragments that mi-grated from the kidney. Stone fragments were collected,debrided, placed in dishes and dried. They were thenscanned on a flatbed scanner to determine projected sur-face area, as above.
RESULTSIn both in vitro and in vivo situations, there was a sig-
nificant effect of the rate of shock wave delivery on stonefragmentation (Figure 1). It is noteworthy that there wasno difference between the results found in vitro and invivo, as determined by a two-way analysis of variance(p<0.0001 for rate of delivery; p=0.2 for in vitro vs. invivo).
DISCUSSIONIntuitively, it seems hard to imagine that the condi-
tions that contribute to stone comminution in patientscould be reproduced faithfully in vitro. First of all, thelithotripter shock wave is affected to some extent by pass-ing through the body wall, being lower in peak pressure,with a longer rise time and larger focal region than whatis measured in water [6]. Secondly, body fluids, includ-ing urine, are characteristically more difficult to cavitate
than in vitro solutions, so the cavitation environment of astone may be different in vivo [7]. Also, the presence oftissue can affect the cavitation activity and bubble be-havior induced by shock waves [3,4]. In addition, the widerange of fragility of human stones makes any work withthese targets inherently variable [2].
Only the last of these problems was controlled betweenthe in vivo and in vitro conditions tested in the presentstudy. The use of artificial stones provided a standardtarget for the two conditions. However, apparently theother parameters (shock wave and body fluid character-istics) were not critical for the comminution of thesestones, as the results were identical between in vivo andin vitro.
One possible flaw in the methodology of this study isthe inability to recover all the stone fragments after shockwave treatment in vivo. In the in vitro case, all the frag-ments are contained, and thus recovered after exposureto shock waves. In the animal, some of the smaller par-ticles undoubtedly escaped with the urine. Indeed, onaverage only 75±3% of the stone dry weight was recov-ered. The difference that this would make to the projectedarea data in Figure 1 is not simple to predict, but it iscertainly true that such an error favors better breakage invivo than in vitro. Considering, as mentioned above, thatsome features of the lithotripter pulse are affected by invivo conditions, this result is unexpected.
In summary, we have observed a close correlation be-tween in vitro and in vivo results in assessing the influ-ence of SW rate on stone fragmentation. This close cor-relation demonstrates that our in vitro test system gives agood approximation of stone breakage in vivo.
ACKNOWLEDGMENTSSupported by NIH grants PO1-DK43881 and
DK55674.
REFERENCES1. Williams JC, Woodward JF, Stonehill MA, Evan AP, and McAteer
JA. Ultrasound Med Biol 25:1445-1449 (1999).2. Zhong P and Preminger GM. J Endourol 8:263-268 (1994).3. Ding Z and Gracewski SM. J Acoust Soc Am 96:3636-3644 (1994).4. Zhong P, Cionta I, Cocks FH, and Preminger GM. J Acoust Soc Am
101:2940-2950 (1997).5. Cleveland RO, Bailey MR, Fineberg NS, Hartenbaum B,
Lokhandwalla M, McAteer JA, and Sturtevant B. Rev Scientific In-struments 71:2514-2525 (2000).
6. Cleveland RO, Lifshitz DA, Connors BA, Evan AP, Willis LR, andCrum LA. Ultrasound Med Biol 24:293-306 (1998).
7. Lifshitz DA, Williams JC, Sturtevant B, Connors BA, Evan AP, andMcAteer JA. Ultrasound Med Biol 23:461-471 (1997).
Figure 1. Comparison of stone breakage at two rates, in vivoand in vitro. Both in vivo and in vitro show similar effects withrate, and stone breakage is not different between in vivo and invitro. Each point represents one Ultracal-30 stone, treated with400 SW’s at 20 kV.
0
50
100
150
200
250
300
350
400
0.5 2Rate (Hz)
0.5 2
In vivo In vitro
Incr
ease
in fr
agm
ent a
rea
(%)
GR
EAT
ER
FR
AG
ME
NTAT
ION

Previous work has shown that shock wave (SW) lysis of cells occurs by both cavitational and non-cavitational mechanisms. SW’scan cause cell lysis, but it is possible that intracellular organelles could be damaged under conditions in which the cell is notruptured. Such damage would likely not involve cavitation due to the high viscosity and lack of cavitation nuclei within cytoplasm.To assess the SW-fragility of intracellular organelles, unilamellar membrane vesicles were used as an in vitro model, and SW-induced damage was quantitated with and without high overpressure (>130atm) to preclude cavitation. Membrane vesicles (~100nmdiameter, made by extrusion from egg phosphatidylcholine) were exposed to SW’s (1Hz, 20kV) in a research lithotripter withacoustic output similar to the Dornier HM3. SW-dependent vesicle lysis increased with SW number (p<0.001), with mean lysis of0.12±0.02% at 400 SW’s (n=49 vials). (In comparison, red blood cells show >5% lysis with only 100 SW’s.) Overpressure did notprotect against vesicle lysis and lysis with overpressure was not different from that at atmospheric pressure, 0.10±0.02% (n=10). Incontrast, lysis of red blood cells is greatly reduced by overpressure. This suggests that when target dimensions are small enough,SW-membrane interactions are independent of cavitation bubble activity.
Breakage of Membrane Vesicles by Shock WavesIs Independent of Cavitation
James C. Williams, Jr., Drew L. Rietjens, Chad A. Zarse, and James A. McAteer.Department of Anatomy & Cell Biology, Indiana University School of Medicine, Indianapolis, IN 46202, USA.
INTRODUCTIONThere are at least two ways in which shock waves might
cause damage to cells and tissues. Shock wave shear couldtear tissue (or cells), and shock wave-bubble interactionsin the form of cavitation and bubble expansion or subse-quent bubble collapse could also lead to disruption ofsurrounding cells and tissue. In studies of red blood cellsin vitro, it appears that both of these mechanisms play arole in shock wave-dependent cell lysis [1]. The lysis ofred blood cells in suspension is significantly reduced bythe application of excess hydrostatic pressure (overpres-sure). Overpressure reduces bubble formation and accel-erates bubble dissolution [2]. Thus, reduced cell lysis inthe presence of overpressure is consistent with the ideathat much of the lysis (as much as 85%) is due to shockwave-induced cavitation.
However, these studies with red blood cells alsoshowed that shock wave-dependent cell lysis was stillsignificant, even when the overpressure was raised to avalue greater than the tensile phase of the shock waves(>120 atm). At pressures this high, bubbles cannot ex-pand, and therefore cavitation cannot occur. The persis-tence of cell lysis under this condition is strong evidencethat shock wave shear is an important force for cell lysis.
These experiments were done with cells in fluid sus-pension. The result could well be different with an intra-cellular target. First of all, there is not likely to be anycavitation activity inside a cell—the gel-like environmentwould probably preclude that. Secondly, with either shockwave shear or cavitation, the stress put on the target willbe related to the size of the target [3]. Just as a smallpiece of wood can float through a violent surf without
being damaged, a small enough target should be unaf-fected by the shock wave. The purpose of this study wasto test the effects of shock waves on vesicles of the samesize as those present inside living cells (~100-150 nm).
METHODS Vesicles were prepared by the extrusion method [4]. Eggphosphatidylcholine (Avanti Polar Lipids, BirminghamAL) was hydrated in buffer and passed multiple timesthrough a polycarbonate filter of pore size 0.1 µm.Vesicles made this way are unilamellar and about 120nm in diameter [4]. Carboxyfluorescein was included inthe buffer, and just before use, vesicles were passedthrough a Sephadex G-25 column to removeextravesicular carboxyfluorescein. Lysis of the vesicleswas measured by determining the level ofcarboxyfluorescein in the extravesicular fluid followingtreatment.
Exposure to lithotripter shock waves was done in aresearch electrohydraulic lithotripter that delivers a shockwave very similar to that of the Dornier HM3 [5].Unshocked controls were used to determine baseline leak-age of carboxyfluorescein from vesicles.
For experiments with overpressure, vials were mountedwithin a chamber that enabled pressurization to > 120atm [6]. Briefly, this chamber has ends made of a plasticthat allows the shock wave to pass virtually unalteredfrom waveforms measured in the free field.

RESULTSVesicles showed shock wave-dependent damage, asshown in Figure 1.
Breakage of vesicles by shock waves was linearly de-pendent on shock wave number (data not shown). How-ever, the percentage of vesicles lysed was much lowerthan we had previously observed with red blood cells.Vesicles lysed at a rate of about 0.03% per 100 shockwaves, while red blood cells lysed at a rate of about 2.3%per 100 shock waves. The magnitude of difference isapparent in Figure 2, which also shows the effect of celldensity on red blood cell lysis. The density of vesicles ismuch lower than that used for red blood cells, and thiscould have been a factor in the lower lysis rate seen inthe vesicles. However, the effect of density on the redblood cells is actually in the opposite direction, so it doesnot appear that the low volume density of the vesiclepreparation should play a role in the low lysis rate.
To test whether vesicle lysis was dependent upon cavi-tation, shock waves were administered at overpressure,and results are shown in Figure 3. Note the overlap ofdata points in this figure. There was no significant differ-ence between lysis of vesicles at atmospheric pressureand at 130 atm overpressure. This suggests strongly thatthe lysis of vesicles at atmospheric pressure was not dueto cavitation.
DISCUSSIONPrevious work with red blood cells showed that most
of the shock wave-dependent lysis measured in these cellswas eliminated by overpressure, showing that this lysisis strongly related to bubble action generated by the shockwaves. The results with unilamellar vesicles does notshow a pressure effect on shock wave-dependent lysis.This suggests that the lysis of vesicles is due solely to anon-cavitational mechanism, likely shear.
The low level of lysis in the vesicles—as compared tocells—does not appear to be related to the density of thepreparations, as the density relationship seen in red bloodcells goes in the other direction. Rather, the low level oflysis in the vesicles is consistent with a size effect pre-dicted for the interaction of a membrane-bound objectwith diverging force vectors in a shock wave [3].
These results demonstrate that small biological tar-gets—even those as small as intracellular organelles—can be damaged by lithotripter SW’s, and that this dam-age is independent of cavitation. Thus, it is feasible thatsubcellular organelles could be broken even within cyto-plasm, a local environment in which cavitation is unlikelyto occur.
ACKNOWLEDGMENTSSupported by NIH R01 DK55674.
REFERENCES1. Williams JC, Jr., Woodward JF, Stonehill MA, Evan AP, and McAteerJA. Ultrasound Med Biol 25:1445-1449 (1999).2. Bailey MR, Cleveland RO, Sapozhnikov OA, McAteer JA, WilliamsJC Jr, Crum LA. 1999. J Acoust Soc Am 105:1267-1270 (1999).3. Lokhandwalla M, McAteer JA, Williams JC, Jr., and Sturtevant B.Phys Med Biol 46:1245-1264 (2001).4. MacDonald RC, MacDonald RI, Menco BPM, Takeshita K, SubbaraoNK, and Hu L. Biochim Biophys Acta Bio-Membr 1061:297-303 (1991).5. Cleveland RO, Bailey MR, Fineberg NS, Hartenbaum B,Lokhandwalla M, McAteer JA, and Sturtevant B. Rev Scientific Instru-ments 71:2514-2525 (2000).6. Stonehill MA, Williams JC, Bailey MR, Lounsbery D, ClevelandRO, Crum LA, Evan AP, and McAteer JA. Methods Cell Sci 19:303-310 (1998).
Figure 3. Lysis of unilamellar membrane vesicles by lithotriptershock waves in the presence and absence of high overpressure.
Lys
is m
ean
(%)
0
0.05
0.10
0.15
0.20
0.25
130 atmAtmosphericPressure
400 SW’s20 kV
p=0.12
0.00
0.02
0.04
0.06
0.08
0.10
0.12
0.14
Control 400 SW’s
p <.0001
Lysi
s (%
)
n=48
n=49
Figure 1. Lysis of unilamellar membrane vesicles by lithotriptershock waves. Shock waves were 20 kV, administered at 1 Hz.
0.0
0.5
1.0
1.5
2.0
2.5
3.0
1.5 3.1 6.2 12.4
Red blood cells (% )0.02
Vesicles (% )
Red cells 75 SW’s
Vesicles400 SW’s
Figure 2. Lysis of unilamellar membrane vesicles and red bloodcells by lithotripter shock waves. Volume concentrations ofpreparations are shown along bottom of figure.

Alternative Pressure Waveforms for ESWL
A. M. Loske, F. E. Prieto, J. van Cauwelaert and F. Fernández
Instituto de Física, UNAM. A.P. 1-1010, 76000 Querétaro, Qro., Mé[email protected]
Basic research may still lead to safer, more efficient extracorporeal shock wave lithotripters. The modifications presented hereare based on the fact that shock wave-induced cavitation is one of the most important mechanisms for stone fragmentation.Spatial and temporal dephasing of the shock front and the use of two, phase inverted, pressure pulses were studied usingelectrohydraulic and piezoelectric shock wave generators. Pressure measurements and stone fragmentation efficiency werecompared using the new and the conventional systems.
INTRODUCTION
Despite the fact that ESWL (extracorporeal shockwave lithotripsy) has been the medical procedure ofchoice for patients with renal and ureteral calculi formore than twenty years [1], basic research is stillnecessary to define techniques that minimize tissuedamage while improving treatment efficiency. Basedon the results of previous investigations [2-5] we havebeen studying alternative focusing and shock wavegeneration systems for electrohydraulic andpiezoelectric extracorporeal shock wave lithotripters. Electrohydraulic lithotripters induce shock wavesby electrical breakdown of water between twoelectrodes, located at the focus (F1) closest to a rigidpara-ellipsoidal reflector. Shock waves are reflectedoff the reflector and concentrated at the second focus(F2). Since the patient is positioned with the calculuslocated at F2, shock waves enter the body, get focusedon the stone, and fracture it [5]. It is the ellipsoidalreflector that concentrates the shock wave and permitsit to be created extracorporeally. Treatment efficiencyand tissue trauma depend on its material and design. Piezoelectric extracorporeal shock wavelithotripters generate pressure waves by high voltagedischarges sent to an array of up to 3000 piezoelectriccrystals laid out on a metallic spherical segment. Thesewaves get concentrated at the center of the segment.The crystals are covered with a flexible insulatingmaterial. As in electrohydraulic systems, water is usedas a coupling fluid and patient positioning isperformed by fluoroscopy or ultrasound imagingsystems [5]. The devices presented here may also beused in the future for other medical applications likemembrane permeabilization of cells in order to achieveeffective macromolecule delivery in vitro and in vivo.
MATERIALS AND METHODS
Alternative reflectors for electro-hydraulic lithotripters
Two composite reflectors, each obtained bycombining two sectors of two rotationally symmetricellipsoidal reflectors with different geometries weredesigned [6]. Reflector A is composed of two stainlesssteel sectors (major axes a = 278.0 mm, a´ = 313.0mm; minor axes b = 156.0 mm, b´ = 166.4 mm),having two F2 foci. Reflector B is obtained bycombining one sector of a stainless steel rotationallysymmetric reflector (a = 278.0 mm, b = 156.0 mm)and another sector of an ellipsoidal reflector made outof polyurethane foam (a´ = 353.2 mm, b´ = 267.8mm). In this case, the foci F1 and F2 of both sectorscoincide. Pressure measurements and kidney stonemodel fragmentation efficiency of the two novelreflectors were compared to that of a conventionalreflector (unmodified Dornier HM3) on a researchlithotripter [7]. Stone models were exposed to 250shock waves generated at 22 kV (80 nF), placing thembetween F2 and F2´ (reflector A) or at F2 (reflector B).
Alternative electronic circuit forpiezoelectric lithotripters
The discharge circuit of a Piezolith 2300 lithotripter(Richard Wolf GmbH), consisting of a capacitorcharging system and a spark gap trigger unit wasduplicated and connected in parallel to thepiezoelectric crystal array. A specially designed pulsegenerator triggers both systems with a delay between50 and 900 �s [8]. Due to this, two similar shockwaves are generated. Pressure measurements at thefocal zone were compared to those obtained using theconventional system. Fragmentation efficiency was

obtained exposing the models to pairs of shock waveshaving a delay of either 50 or 550 �s.The piezoelectric generator was operated at 7.5 kV.Spherical HMT (High Medical Technologies) kidneystone models, placed on a nylon mesh with 1.0 x 1.0mm openings, were used for all experiments reportedhere and exposed at different positions to 250 shockwaves. Pressure measurements were made with needlehydrophones (Imotec GmbH).
RESULTS
Amplitudes (peak positive pressure about 73 MPa)and waveforms generated by the conventional reflectorare comparable to data published by other authors[5,8]. As expected, the wave reflected off A is thesuperposition of two compressional pulses (� 30 and63 MPa), followed by a tensile phase (� 15MPa). Thewaveform produced by reflector B consists of acompressional peak (� 45 MPa), followed by a trough(� 13 MPa), about 50 �s ahead of a negative pulsecoming from the soft (pressure-release) sector (� 18MPa), followed by a positive pulse (� 36 MPa). Pressure waveforms obtained with the dual-pulsepiezoelectric system show two similar positivepressure peaks (� 37 MPa), followed by a negativephase (� 10 MPa), separated either 50 or 550 �s. The mean weight of the dry residual stonefragments obtained with reflector A at F2´ was about26 % less than the lowest value obtained with theconventional reflector. The best result achieved withthe dual-phase reflector (B) was about 6% less thanthe best value measured with the standard reflector.Using the piezoelectric system with a delay of 550 �simproved the fragmentation efficiency about 12%compared to a delay of 50 �s. All differences reportedhere were statistically significant (one tailed P � 0.01).
DISCUSSION AND CONCLUSIONS
Using reflector A, enhanced stone fragmentationdid not occur at the region of maximum pressure,indicating that spatial and temporal phasing out of theshock wave plays a significant role in stonefragmentation and should be considered in designingESWL reflectors. Reflector B also seems to be moreefficient than the conventional reflector in breaking upHMT models. It is expected that this may still beimproved by adjusting the delay between pulses.Reflectors A and B are supposed to be more efficientthan standard ellipsoidal reflectors due to alternative
compressions and rarefactions as well as enhancedcavitation. [3,4-6]. Analogously, triggering two, ratherthan just one, piezoelectrically-generated shock wavesmay increase lithotripter efficiency due to enhancedcavitation. Since cavitation bubbles are known tocollapse about 250 �s after passage of the first shockwave, it may be convenient to trigger the second pulsewith a delay between 200 and 300 �s. This article is based on fragmentation in water bathset up’s using one type of stone model. It will benecessary to perform tests with different models and invivo experiments with animals, to evaluate if the novelsystems remain efficient and prove to reduce tissuedamage.
ACKNOWLEDGMENTS
The authors would like to thank Arturo Méndez,Helmuth Busch, Mario Granizo, Marco Veytia,Francisco Mercado and Eduardo Armenta forimportant technical assistance. The advice of RobinO. Cleveland in the construction of the pressure –release reflector is also acknowledged. The Piezolithgenerator was donated to our university by Dewimed.
REFERENCES
1. Loske, A.M., and Prieto, F.E., Shock Waves in Medicine:Commented Bibliographical Data Base, UNAM, MexicoCity 1995. ISBN968–36–4466–X.
2. Bailey, M.R., Blackstock, D.T., Cleveland, R.O., andCrum, L.A., Journal of the Acoustical Society ofAmerica 104, 2517-2524 (1998).
3. Zhong, P., Lin, H., Xi, X., Zhu, S., and Bhogte, E.S.,Journal of the Acoustical Society of America 105, 1997-2009 (1999).
4. Prieto, F.E., and Loske, A.M., The Journal ofEndourology 13, 65-75 (1999).
5. Loske A.M., “Applications of shock waves in medicine”,in Handbook of Shock Waves, edited by G. Ben-Dor etal., Academic Press, San Diego, 2000, pp. 415-440.
6. Prieto, F.E., and Loske, A.M., Multifocal compositereflectors to concentrate shock waves, InternationalPatent PCT/MX 95/00008, November 1995.
7. Prieto, F.E., Loske, A.M., and Yarger, F.L., Review ofScientific Instruments 62, 1849-1854 (1991).
8. van Cauwelaert, J., Cavitación controlada por dos ondasde choque y su aplicación a litotripsia extracorporal.B.Sc. Thesis, Facultad de Ciencias UNAM, Mexico City2001.
9. Coleman, A.J., and Saunders, J.E., Ultrasound inMedicine and Biology 15, 213-227 (1989).

Visualization of temperature rise induced by high intensity ultrasound in tissue
V. A. Khokhlovaa, N. Millerb, R. Ollosb, R. W. Martinb, M. R. Baileyb, Y.
Mohammadianc, and M. Naghavic
aDepartment of Acoustics, Physics Faculty, M.V. Lomonosov Moscow State University, Moscow, Russia bCenter for Industrial and Medical Ultrasound, Applied Physics Lab, University of Washington, Seattle, USA
c Texas Heart Institute and the University of Texas Medical School, Houston, Texas, USA
Temperature rise in excised bovine liver exposed to high intensity focused ultrasound was visualized experimentally and simulated numerically. An infrared camera, which records surface temperature only, was used to measure spatial temperature distribution. Two blocks of tissue were stacked, and their interface was placed along the axis of the ultrasound beam. After exposure to ultrasound, the upper piece was immediately removed, and the temperature on the axial plane was infrared imaged. Our theoretical model employs a KZK-type equation for the acoustic pressure field combined with a bioheat equation. It is shown that experiment and theory agree well on the location, shape, and dimensions of the heated region if the effective absorption coefficient of liver is 1.4 dB/cm/MHz. The higher value of absorption in excised liver compared to the known data for in vivo or degassed tissue (0.35 – 0.7 dB/cm/MHz[1 – 3] ) is hypothesized to be due to the presence of air bubbles.
INTRODUCTION
High intensity focused ultrasound (HIFU) creates localized heating deep in tissues which can be used to necrose tumors or cauterize vessels. Imaging of the temperature field in tissue is important for guiding HIFU treatment. Various methods can be employed, such as thermocouples, MRI, and ultrasound thermometry. However, thermocouples are local and invasive, MRI is expensive, and acoustic methods have poor accuracy and spatial resolution. Here we suggest a simple, but informative, laboratory method of imaging the temperature in tissue with a thermal camera. Temperature rise in excised liver induce by HIFU was infrared imaged and predicted numerically. Direct comparison of experimental images and numerical results is presented.
EXPERIMENTAL METHOD
Shown in Figure 1 is the experimental set-up. The HIFU transducer (2 MHz, 35 mm aperture, 55 mm radius of curvature) was mounted on the side of an acrylic box (6 x 9.5 x 6 cm). The box was lined with ultrasound transmission gel and gel was added for good coupling between the transducer and the tissue. The power output was calibrated by force balance. Bovine liver was used within 8 hours of excision. A
large piece was cut to fill the box and then bisected at the half height of the box and transducer. Care was taken to avoid bubbles between the two tissue slabs by dampening the interface with water and gel. A tissue specimen was imaged with a Radiance 1 infrared camera (Raytheon TX USA) from above. Camera wavelength was 3-5 µm, and the penetration depth was less than 2 mm, so that only the surface temperatures could be measured. Experimental procedure was to heat the tissue for 5 seconds with 29 W of acoustic power. Then the top slab of tissue was immediately removed and the temperature field was recorded.
FIGURE 1. Experimental set-up.

NUMERICAL SIMULATIONS
The acoustic field was modeled by the KZK - type equation that accounts for the combined effects of diffraction, absorption, and nonlinearity. A linearized version of the frequency-domain code was employed[4], as it was shown that nonlinear effects were negligible in liver for given acoustic output. The acoustic parameters of liver were taken as: density, ρ0 = 1214 kg/m3; speed of sound, c0 = 1614 m/s; power law of absorption, η = 1.266[3]. Temperature field was computed by a bio-heat equation[5] using a finite difference scheme[4]. The thermal properties of liver were taken as: heat capacity, Cv = 3.81 J/cm3/°C and thermal conductivity, κ = 0.508 W/m/°C [3]. Simulations were performed for various values of absorption from 0.35 to 1.4 dB/cm/MHz.
RESULTS
Numerical simulations predicted much higher temperature rise at the focal spot and quite different geometry of the temperature field than in experiment if computed with typical values of absorption given in the literature (0.35 – 0.7 dB/cm/MHz)[1 – 3]. It was hypothesized that absorption in ex vivo, not degassed liver is likely higher, because of exposure to air, than in vivo or in carefully degassed tissue. Air bubbles are strong nonlinear scatterers, so the radiated acoustic field contains higher frequencies with higher absorption rate, which may result in average
enhancement of absorption[6]. It was found that the absorption 1.4 dB/cm/MHz provided a very good match between simulations and measurements for the entire 2D spatial distribution (the location, shape, and dimensions of the heated region), Figure 2. The spatial and temperature scales are the same for the two pictures. The transducer is on the right. Both predicted (a) and measured (b) distributions show a heated triangle (cone) that comes to a point close to the geometrical focus. Enhanced heating is seen close to the transducer, followed by a relatively less heating, and then by the highest temperature rise at the focal spot. In addition, two hot localized spots in are seen in measured image due to the presence of air bubbles. Little heating occurs on the far side of the focus which is typical for highly absorptive propagation.
CONCLUSIONS
A novel experimental method was used to visualize 2D temperature field in tissue. The method was shown to provide a clear image of the temperature distribution in tissue heated by ultrasound. Comparison of measured images with numerical modeling showed enhanced average absorption in excised liver due to reradiation from the air bubbles. Future experiments should include a direct measure of the attenuation in the samples and comparison with the degassed samples.
ACKNOWLEDGMENTS
We gratefully acknowledge support by NIH Fogarty, NSF, and CRDF.
REFERENCES
1. S. A. Goss, R.L. Johnston, and F. Dunn, J. Acoust. Soc. Am., 64, 423-457 (1978).
2. F.A. Duck, Physical properties of tissue, A comprehensive reference book, New York: Academic Press, 1990, pp. 101 - 114.
3. P. Meaney, M.D. Cahill, Gail ter Haar, SPIE, 3249, 246 - 256 (1998).
4. E.A. Filonenko and V.A. Khokhlova, Acoust. Phys., 47(4), in print, (2001).
5. H.H. Pennes, J. Appl. Physiol., 1(2), 93 - 122, (1948)
6. F. Chavrier, J. Chapelon, A. Gelet, D. Cathignol, J. Acoust. Soc. Am., 108(1), 432 - 440 (2000).
20
21
22
23
24
25
0123456789
-3
-2
-1
0
1
2
3
a)
b)
z, cm
T, °C r, cm
FIGURE 2. Comparison of modeled (a) and measured (b) temperature fields in liver

Small Aperture Piezo Sources for Lithotripsy
R. Riedlingera, T. Dreyera and W. Kraussb
a Institut fuer Hoechstfrequenztechnik und Elektronik, Universitaet Karlsruhe, Kaiserstr.12, D 76128 Karlsruhe, Germany
bRichard Wolf GmbH, Pforzheimerstr. 32, D 75438 Knittlingen, Germany
To improve the handling and to reduce the costs of piezoelectric transducers used in lithotriptors new transducer designs withtwo layers of piezoelectric elements are investigated. Using this construction principle the generated pressure near the tranducersurface can be significantly raised up and relevant properties of the sound field can be preserved. 3-D FEM simulations are usedas a design tool. Simulation results and measurements are compared to each other and are in high agreement. The doublelayered design allows a reduction in the transducer diameter and in the number of needed piezoelements to about 50%.
SINGLE LAYERED AND DOUBLELAYERED PIEZO TRANSDUCERS
In extracorporal lithotripsy of renal, salvary or gallstones peak pressures of about 100 MPa should begenerated in the focal region. This can be achieved byself focusing single layered (SL) piezoelectric mosaictransducers with diameters of about 50 cm and 85°apex angle, driving the piezoelements close to theirelectromechanical limits. A multilayer design howevercan substantially increase the initial pressure at theradiating surface and therefore allows to reduce thetransducer in diameter and in the radius of theradiating spherical cap simultaneously and in thenumber of needed piezoelements as well. Transducerswith two layers of piezoelements on both sides of asupporting spherical cap (DL) were investigated. InFigure 1 the principle of the design is shown.
Epoxy 7 mm th.
Aluminum 2-4 mm th.
HV Pulse Generator
Piezo 6 mm x 5 mmτ
FIGURE 1. Structure and operation principle of aplane transducer with two layers of piezoelements.
0
2000
4000
0 5 10 15t (µs)
UT (V)
FIGURE 2. Voltage pulses applied on back layer andon front layer (bold).
Figure 2 represents the driving electrical pulses, whosedelay times are adjusted so that the wave front emittedfrom the back layer coincides with the wave frontgenerated by the front layer on the radiating side.
3-D SIMULATION & VERIFICATION
Parameters as piezo design, mounting cap and electricexcitations influence the transducer performance [1].To investigate a mosaic structure, 3-D calculations areadvisable. We used CAPA software for FEM 3-Dsimulations in time domain. Considering thesymmetric structure the hexagonal mosaic wasprimarily reduced to an acute-angled trianglecontaining at its acute angle a 30° sector of a singlecylindrical element. It can be shown easily that thewhole mosaic can be calculated using this basicelement and appropriate boundary conditions at thesymmetry planes.
-1,5-1,0
-0,50,0
0,51,0
1,52,0
25 30 35 40 45 50t (µs)
p (MPa)
sim.DLmeas.DL
FIGURE 3. Comparison of simulated and measuredpressure responses at a distance of 50 mm on the axisof a 10 cm diameter test transducer, double layer ofhexagonal mosaics with cylindrical elements.

The FEM analysis shows complicated transientbehaviour of a single piezoelement and its surroundingepoxy material following the voltage pulse excitation.The radiating surface gets curved and bent, containselastic wave movements and does by far not act like apiston source. Some cm of travel path however aresufficient to form a regular uniform wave front due tothe superposition of the pressure pulses of the mosaic.In Figure 3 the calculated pressure signal for ahexagonal plane and infinite double layered mosaic ofcylindrical piezoelectric elements is shown andcompared to pressure measurements done at a planetest transducer of 10 cm diameter with a fibre opticalhydrophone at 50 mm distance on axis.
COMPARISON SL50 VS DL50
For comparison a SL with 50 cm diameter (SL50) anda double layered test transducer with 26 cm diameter(DL26) are investigated by fibre optical measurementsin water tanks. Using the driving voltage as parameterwe see from Figure 4 that the SL50 design reaches 100MPa focal peak pressure at 2.3 kV whereas the DL26design needs 3.2 kV for it. This is due to the fact thatSL50 has a longer propagation distance from surfaceto focus than the smaller and more curved DL26, theSL50 type thus profits from nonlinear steepenig of thewavefront since both apex angles are about equal. TheDL26 design also is appropriate for lithotripsyreaching peak pressures of over 130 MPa.
20
60
100
140
180
1 2 3 4 5 6UTp (kV)
pp (MPa)
DL26SL50
FIGURE 4. Peak focal pressures of single layertransducer SL50 and double layer transducer DL26 vspeak driving voltage.
In Figures 5 and 6 the peak pressure distributions areshown. The driving voltages are adjusted to produceabout comparable focal pressures. The DL26 producesa larger (-6dB) focal volume, a fact that is not only dueto the smaller aperture but also to its shorter pulsepropagation path which influences the nonlinearsteepening of the pressure and leads to a less sharpfocusing property. This can be regarded as an
20
60
100
140
-15 -10 -5 0 5 10 15z (mm)
pp (MPa)
DL26SL50
FIGURE 5. Axial distribution of peak pressure. z = 0is the focal point. z > 0 is beyond focus on beam axis.
20
60
100
140
0 1 2 3r (mm)
pp (MPa)
DL26SL50
FIGURE 6. Radial distribution of peak pressure inthe focal plane. r = 0 is the focal point.
advantage of the DL26 system since during lithotripsyit becomes more easy to position the targets (stones)into the therapeutically relevant focal pressure zone.The enlarged focal volume may also be advantageousin orthopedics and pain therapy, where largertherapeutical volumes but lower focal intensities arepreferred.
REFERENCES
1. Dreyer, T., Krauss, W., Bauer, E. and Riedlinger, R.,“Investigations of Compact Self Focusing TransducersUsing Stacked Piezoelectric Elements for Strong SoundPulses in Therapy”, in Proceedings 2000 IEEEUltrasonics Symposium, edited by S. C. Schneider et al.,IEEE New York, 2000, Vol 2 , pp. 1239-1242.
2. Dreyer, T. and Riedlinger, R., “Transient Response ofCylindrical Piezoceramics Used in Self FocusingTransducers for Therapy”, in Proceedings 1999 IEEEUltrasonics Symposium, edited by S. C. Schneider et al.,IEEE New York, 1999, Vol 2 , pp. 1245-1248.

The Application of Low-Energy Shock Waves to One RenalPole Prevents Hemorrhagic Injury Induced by High-
Energy Shock Waves in the Other Pole
Lynn R. Willisa, Andrew P. Evanb, Bret A. Connorsb, PhilipM. Blomgrenb, Ryan F. Patersonc, Naomi S. Finebergd and
James E. Lingemanc
aDepartment of Pharmacology and Toxicolog, Indiana Universityy, Indianapolis, Indiana 46223bDepartment of Anatomy, Indiana University, Indianapolis, Indiana 46223
cMethodist Hospital of Indiana, Inc, Indianapolis, Indiana 46202.dDepartment of Medicine, Indiana University, Indianapolis, Indiana 46223,
Two thousand shock waves (SWs) applied at 12 kV to one renal pole cause no hemorrhagic lesion but induce renalvasoconstriction. We examined the lesions appearing in upper and lower poles of kidneys after 2000 SWs at 12 kV to one polefollowed immediately by 2000 SWs at 24 kV to the other pole. Three anesthetized pigs received 2000 SWs (Dornier HM3) tothe lower pole at 12 kV and 2000 SWs to the upper pole at 24 kV. Four pigs received 2000 SWs at 24 kV to one pole. Renalhemodynamics were measured before and 1 hr after SWs. Shocked kidneys were fixed, sectioned and digitized for visualanalysis. Similar reductions of renal blood flow occurred in shocked kidneys receiving SWs to both poles or only to one poleKidneys treated first at 12 kV sustained little to no hemorrhagic injury, other than scattered petechii, in either pole. Bycomparison, massive hemorrhagic injury occurred in kidneys treated only in one pole.
INTRODUCTION
High-energy shock waves (24 kV) administered byshock wave lithotripsy (SWL) predictably injure renaltissue and reduce both glomerular filtration rate (GFR)and renal plasma flow (RPF) (1,2). The size of theinjury normally increases both with increasing shockwave voltage, being minimal at 12 kV (3,5), and withincreasing numbers of shock waves. (4,6) Shock-waveinduced reductions of RPF, however, appear to beindependent of voltage (3).
When we treated each renal pole in succession with2000 shock waves at 24 kV in earlier experiments, thesecond application caused less injury and bleedingthan the first. This protective effect may have resultedfrom the renal vasoconstriction normally induced by asingle dose of shock waves. Moreover, since shockwaves administered at 12 kV reduce RPF but causelittle to no tissue injury (3), vasoconstriction caused bytreatment of one pole at 12 kV might protect the otherpole from injury caused by 2000 shock waves at 24kV. The present studies tested that hypothesis.
METHODS
Two groups of female pigs, 6 weeks old, wereanesthetized (ketamine, 15-20 mg/kg i.m. forinduction, then isoflurane 1-2% and oxygen 100% for
maintenance) and prepared for renal clearanceexperiments. Catheters were placed in a peripheralvein for infusion of fluids, a femoral artery formeasurement of blood pressure, both renal veins formeasurement of the renal extraction of p-aminohippurate (EPAH) and in both ureters for bilateralurine collections. Three 15-minute baselinecollections of urine and mid-point blood samples werefollowed by the application of 2000 shock waves at 12kV to the lower pole of one kidney followedimmediately by 2000 shock waves at 24 kV to theupper poles of the same kidney (Group 1, n=3). Group2 (n=4) received 2000 shock waves at 24 kV only tothe lower pole of one kidney. Two more sets of three15-minute clearance collections were obtained at 1 and4 hours after SWL (unmodified Dornier HM3lithotripter). The focal zone for the shock waves (F2)was fluoroscopically aligned with the targeted regionwith the aid of contrast media injected into the renalpelvis.
Steady-state concentrations of polyfructosan andPAH were infused i.v. throughout the experiments.Urine and plasma samples were analyzed by standardcolorimetric methods. Clearances of polyfructosan andPAH were calculated as estimates, respectively, ofGFR and RPF. EPAH was used to calculate “true” RPF(TRPF = PAH clearance ÷ EPAH). The criterion forstatistical significance was p<0.05. The experimentalprotocol was approved by the Institutional Animal

Care and Use Committees for the Indiana UniversitySchool of Medicine and Methodist Hospital of Indiana.
At the completion of the clearance studies, allanimals were prepared for vascular perfusion of bothkidneys (7). The kidneys were then embedded andsectioned. Computer-assisted segmentation techniqueswere applied to serial sections of the kidneys todetermine lesion sizes (8).
RESULTS
The application of 4000 shock waves to one kidney(2000 to each pole) of Group 1 pigs and 2000 shockwaves to one pole of Group 2 kidneys caused similarmaximal reductions of GFR and RPF in both groups.EPAH, which reflects the integrity of renal tubularsecretion, was reduced only in the shocked kidneys ofGroup 2.
Lesion sizes were quantified in the shocked kidneysfrom 3 pigs in Group 1 (12/24 kV) and 4 pigs in Group2 (24 kV only). In Group 1 kidneys, mean lesion size,calculated for the entire kidney, was about one-sixththat of the lesions seen in the shocked poles of Group2 kidneys even though the kidneys of Group 1received twice as many shock waves as did thekidneys of Group 2 (Figure 1).
FIGURE 1. Size of hemorrhagic lesions produced in eachof 3 kidneys from pigs treated with successive applicationsof low- and high-energy shock waves (12 and 24 kV) first tothe lower pole, and then to the upper pole (open bars). Themean for this group (shaded bar) is compared with meanlesion size in pigs treated only with high-energy (24 kV)shock waves to one renal pole (solid bar). The asteriskdenotes a statistically significant difference; vertical barsdenote standard error of the mean.
DISCUSSION
The first application of 2000 shock waves at 12 kVto one renal pole in Group 1 produced little to noevidence of hemorrhagic injury. The subsequent
application of 2000 shock waves to the opposite polesof those kidneys at 24 kV likewise produced littleevidence of injury (Figure 1). A dose of 2000 shockwaves applied alone at 24 kV would ordinarily havebeen expected to produce lesions amounting to about6% of the functional renal mass (Figure 1). Thus, theinitial application of low-energy shock waves to onepole clearly seems to have protected the opposite polesof those kidneys from injury and bleeding.
The mechanism by which pretreatment of one renalpole with low-energy shock waves protected theopposite pole from subsequent damage by the high-energy shock waves is not immediately clear fromthese studies. We know from previous studies (3) thatlow-energy shock waves reduce RPF, presumably bycausing vasoconstriction. Since the lesion caused bySWL is hemorrhagic, it seems reasonable to suggestthat vasoconstriction induced by the first application ofshock waves limited the bleeding, and hence thedevelopment of the lesion, caused by the subsequentapplication of high-energy shock waves.
ACKNOWLEDGMENTS
This project was supported in part by the Institutefor Kidney Stone Disease, Methodist Hospital ofIndiana, USPHS Grant PO1-DK43881, and theAFUD/AUA Research Scholar Program (R.F.P.).
REFERENCES
1. L. R. Willis, A. P. Evan, B. A. Connors, G. Reed, N. S.Fineberg and J. E. Lingeman, J. Urol. 156, 1502-1506 (1996).
2.. L. R. Willis, A. P. Evan, B. A. Connors, P. Blomgren, N. S.Fineberg and J. E. Lingeman, J. Amer. Soc. Nephrol. 10, 1753-1762, (1999).
3. M. Delius, M. Jordan, H. Eizenhoefer, E. Marlinghaus, G.Heine, H.-G. Liebich, and W. Brendel, Ultrasound Med. Biol.14, 689-694 (1988).
4. B. A. Connors, A. P. Evan, L. R. Willis, P. Blomgren, J. E.Lingeman, and N. S. Fineberg, J. Amer. Soc. Nephrol. 11,310-318 (2000).
5. W. Roessler, P. Steinbach, H. Nicolai, F. Hofstaedter, and W.F. Wieland, Urol. Res. 21, 273-277 (1993).
6. L. R. Willis, A. P. Evan, and J. E. Lingeman, Contemp. Urol.11, 45-50, (1999).
7. A. P. Evan, D. A. Hay and W. G. Dail, Anatomical Record191, 397-414 (1978).
8. P. M. Blomgren, B. A. Connors, J. E. Lingeman, L. R. Willisand A. P. Evan, Anatomical Record 249, 341-348, (1997).

Holographic interferometric quantitative study of pulse laser induced underwater shock waves and cavity bubble
S. H. R. Hosseini and K. Takayama
Shock Wave Research Center, Institute of Fluid Science, Tohoku University 2-1-1, Katahira, Aoba, Sendai 980-8577, Japan
Paper reports a quantitative study of underwater shock waves and cavity bubbles induced by direct irradiation of pulse laser beam. Energy source was a Q-switched Ho:YAG laser. The laser beam was focused and transmitted through an optical fiber. Double exposure holographic interferometry was used for flow visualization. The whole sequences of underwater shock waves generation and propagation were observed. The laser interaction produced micro plasma, which drove spherical shock wave in water and followed by formation of a vapor cavity. By shaping the optical fiber’s surface to a hyperboloidal contour, an effective laser focusing and stronger underwater shock waves were achieved. The micro shock waves produced by this method have potential to be applied for precise medical procedures.
INTRODUCTION
For applying shock waves to precise medical procedures like cerebral thrombolysis, generation of underwater micro shock waves plays an important role [1]. Such sensitive application makes limit on usage of conventional underwater shock wave sources like shock wave reflection and focusing over half-ellipsoidal cavity, so-called Extracoporeal Shock Waves ESW [2], or micro explosives [3]. In the present study a Q-switched Ho:YAG laser and a 0.60 mm glass optical fiber are used. Advantages of this method over previous shock wave sources are two order of magnitude reduction in focusing area if compared with ESW and elimination of product gases of micro explosives. Nakahara and Nagayama [4] studied underwater shock waves emanated from an optical fiber by pulse Nd:Yag laser input using shadowgraph technique. Their qualitative study limited to visualization of shock waves at its early stage. The present research aims to clarify quantitatively; (a) process of the shock wave generation by direct laser beam irradiation; (b) effects of the optical fiber’s end configuration on the shock wave strength; (c) growth and collapse of the generated cavitation bubble; and (d) structure of heat induced flow in front of the fiber.
EXPERIMENTAL METHOD
Energy source was a Q-switched Ho:YAG laser (Nippon Infrared Industries Co., Ltd.,) with 91±10% mJ/Pulse energy measured at the end of a 0.60 mm diameter glass optical fiber, pulse duration of 200 ns, and wavelength of 2.1 µm. The laser beam was transmitted through the optical fiber. Double exposure holographic interferometry was used for quantitative flow visualization. Figure 1 shows a schematic
d=200mm, f=1000mmParabolic mirror
Film holder
Ruby Laser
Power
6:4Beam Splitter
M
M
M
M
M
L
L
L
P. M.
Optical fiber
Test section
Ho:YAG Laser
Delay circuit
FIGURE 1. A schematic diagram of holographic interferometric optical arrangement.
diagram of the optical set-up. The light source was a holographic double pulse ruby laser (Apollo Laser Inc. 22HD, 25 ns pulse duration, 1 J/pulse). The first laser exposure was carried out before triggering of the Ho:YAG laser and the second exposure was synchronized with the propagation of the shock wave at the test section with a proper delay time. The whole sequences of the spherical shock wave generation and growth of the induced cavitation bubble were successfully observed.
RESULTS AND DISCUSSION
Figure 2 shows infinite fringe interferograms of generation and propagation of the underwater shock waves from roughened end of the optical fiber. Figure 2a, 4 µs after shock wave production, shows a 5.9 mm radius spherical shock wave in water. The shock wave generation associated with the laser breakdown in the water. The laser interaction produced micro plasma in the water and heated the liquid. The plasma drove spherical shock wave in water. This process followed by formation of a high temperature vapor cavity. In front of the optical fiber in Fig. 2a the vapor bubble of about 0.5 mm dia. is observed and fringes next to it

indicate the high temperature of that zone. Shock wave propagation through the optical fiber produced a conical precursor wave, which is clearly observable in Fig. 2a. In this figure first shock wave followed by another shock with 0.5 mm radial distance and shock front had a fold shape. This process is related to Ho:YGA laser irradiation from the optical fiber. A random or rough end surface of the fiber can produce diffuse transmission of the laser beam and separate focal areas with different energies. This made a delay for distinct plasma and shock wave generations. Figure 2b, at 100 µs, shows cavitation bubble of 2.3 mm dia. The high temperature in front of the optical fiber resulted in higher growth of the vapor cavity in that direction. Figure 2c, at 300 µs, shows the cavitation bubble after its first collapse. By that moment secondary cavity is produced which is observable in front of the optical fiber in Fig. 2c. Heat induced flow was vanished after 100 ms. Figure 2d, at 3.2 µs, shows a uniform spherical shock wave with 5.1 mm radius from a hyperboloidal shaped optical fiber. In this figure, by effective laser focusing, a stronger underwater shock wave is produced.
CONCLUSIONS
A Q-switched Ho:YAG laser and an optical fiber were used for production of underwater spherical micro shock waves. Using double exposure holographic interferometric quantitative flow visualization its generation process and propagation were observed. Growth and collapse of the induced cavitation bubbles were clarified. The weak shock waves produced by this method have potential to be applied for precise medical procedures such as revascularization in neurosurgery [5].
ACKNOWLEDGMENTS
The authors wish to express their thanks to Dr. T. Hirano, Professor A. Takahashi, and Professor T. Yoshimoto of Dept. of Neurosurgery, School of Medicine, Tohoku University.
REFERENCES
1. K. Takayama, Application of shock wave research to medicine, Plenary Lecture, 22nd International Symposium on Shock Waves, Imperial College, London, UK, (1999).
2. E. Heustler, Destruction of kidney stones by means of auto focused guided shock-waves, 2nd European Congress Ultrasonic and Medicine (1975).
3. T. Kodama, K. Takayama, N. Nagayasu, H. Uenohara, M. Yoshida, A basic study of shock wave revascularization therapy for cerebral embolism, Neurosonology 10, 79-83 (1997).
4. M. Nakahara, K. Nagayama, Water shock wave emanated from roughened end surface of an optical fiber by pulse laser input, J. Material Proc. Tech. 85, 30-33 (1999).
5. S. H. R. Hosseini, T. Hirano, O. Onodera, K. Takayama, Interaction of shock waves with cavitation bubble: Application of Ho:YAG pulse laser irradiation for cerebral thrombolysis, J. Acoust. Soc. Am. (140th Meeting ASA/NOIS CON 2000), 108, 2518 (2000).
FIGURE 2. Infinite fringe holograms of underwater shock waves and cavities: (a) 4 µs, (b) 100 µs, (c) 300 µs, from roughened end surface of optical fiber; and (d) 3.2 µs, from hyperboloidal optical fiber.

Shock waves induced antigenic modification on renal cell carcinoma
S. Moosavi-Nejada, M. Satohb and K. Takayamaa
aShock Wave Research Center, Institute of Fluid Science, Tohoku University, Sendai 982875, Japan bDepartment of Urology, Tohoku University School of Medicine, Sendai 982,987, Japan
The objective of the present study was to determine whether shock waves could modify antigenic pattern on the surface of surviving cells after shock wave exposures. Suspended human renal carcinoma cells (TOS-1) were exposed to 1000 focused under water shock waves at 16 MPa over pressure in the focal region. Expression of a cytosolic antigen (monosialosyl galactosyl globoside) was analysed with double staining flowcytometric assay (Propidium iodide/FITC) before and after the exposures. Expression of the antigen was increased on the surfaces of the treated cells and remained detectable during 4 hours after the exposures; however, it gradually declined to the control level by elapse of time. The increased intensity was mostly found on the surfaces of live shrunk cells; a newly generated population of the cells following the shock waves. The quantitative data obtained from flowcytometric analysis was confirmed by immunoelectron microscopic images, which revealed displacement of the antigen from the cytoplasm toward the cell periphery. According to the obtained results, shock waves were able to enhance the MSGG expression on the surfaces of the surviving TOS-1 cells, which in normal condition was negative or low expressed. The modification might be a preferred target for shock-wave-based approaches to cancer therapy.
INTRODUCTION
Combination of shock waves with substances acting on the cellular level has been reported as the most effective method than mono-therapy [1,4]. Therefore, detailed knowledge of shock wave-tumour interaction at the cellular level is important in order to develop the most effective combination.
The adverse immune reactions following Extra- corporeal Shock Wave Lithotripsy (ESWL) raised the question whether shock waves could change antigenic pattern on the surfaces of cells in general and tumour cells in particular [3,6].
In this preliminary study, effects of shock waves on the expression of a cytosolic glycolipid antigen, monosialosyl galactosyl globoside (MSGG) was investigated, in-vitro.
MATERIALS AND METHODS
Cultured human renal carcinoma cells, TOS-1, suspended in PBS (2x10⁶ cells/ml) were transferred into polyethylene tube whose bottom was cut and sealed with a thin polyethylene film. The suspension was positioned in the focal region of a piezoceramic generator dish and was treated with 1000 shots at maximum over pressure of 16 MPa (Fig. 1). To
measure the antigen intensity on the surfaces of intact cells and to prevent interference from dead cells a double staining flowcytometric assay (Propidium Iodide / FITC) was used.
An indirect immunoperoxidase technique [5] was applied for sub-cellular localisation of the antigen by immuno-electron microscopy.
Control cells (-SW) were treated in the same ways except for the shock waves.
FIGURE 1. Schematic diagram of the experimental set up.
Piezoceramic generator (P+max = 16 MPa)
Suspended cells
Acoustical waves
Tube holder
Degassed water
Wave generator Amplifier Heater

RESULTS AND DISCUTIONS
The flowcytometric assay of the –SW cells revealed that MSGG is a cytosolic antigen with almost no expression on the surfaces of the cells. The expression pattern was changed on the surfaces of the treated cells (+SW), as is shown in Fig. 2. The increased intensity was mostly found on the surfaces of shrunk cells; a newly generated population of the cells following the shock waves. The modification remained detectable during 4 hours after the exposures and gradually declined to the control level by elapse of time.
FIGURE 2. Histogram plot of the antigenic intensity on the cell surfaces.
The quantitative results were confirmed by immuno- electron microscopic images, as shown in Figs. 3a-b. The immuno-stained antigens were found as small dark spots non-uniformly scattered in the cytoplasm of the control cells (Fig. 3a). After the shock waves, this distribution pattern was changed to a membrane pattern in which the antigens were predominantly concentrated in the membranous structures close to the outer surfaces of the cell (Fig. 3b).
In the present study, it was demonstrated that shock waves were able to displace the antigen toward the cell periphery and increase its expression on the tumour cells, in-vitro. MSGG antigen is a member of glycospingolipid family that their modification on the outer leaflet of the tumour cells can change the antigenisity and immunogenisity of the cells [2]. It is, however, a challenging idea whether the shock waves may alter tumour antigenisity in such a way that they become more sensitive to the cytotoxicity of drugs or more immunogen for stimulating the immune system.
Regarding to the cases of autoimmun diseases, It is assumed that the phenomenon might be a common but reversible one in-vivo, however in some individuals it might be irreversible or lead to a permanent surface modification.
a b
FIGURE 3. Histogram plot of the antigenic intensity on the cell surfaces: a) before the shock waves; b) after the shock waves. (Original magnification 15,000X)
ACKNOWLEDGMENTS
The authors would like to thank Dr. H. Ohtani, Associate Professor at Department of Pathology, Tohoku University, for his help in conducting immuno-electron microscopy.
REFERENCES
1. M. Delius and G. Adams, 1999, Cancer Res., 59, 5227-5232.
2. I. Iwamoto, S. Yonekawa, T. Takeda, et al., American J. Nephrology, 1998, 18(6), 534-537
3. U. Lauer, E. Burgelt, Z. Squire, 1997, Gene Ther., 4, 410-715.
4. S. Hakomuri and Y. Zhang, Chemistry & Biology, 1997, 4, 97-104
5. H. Ohtani, Y. Fukushi, S. Orikasa and H. Nagura, J. Histochemistry and cytochemistry, 1991, 39, 479-484.
6. A. Xenocostas, S. Jothy, B. Collins, R. Loertscher, M. Levy, 1999, American J. Kidney Diseases, 33(1), 128-132.

Basic Research of Laser-induced Bubble/Shock InteractionApplied to Revascularization of Cerebral Embolism
M. Komatsua, T. Hiranob, H. Uenoharac, T. Yoshimotob and K. Takayamaa
aShock Wave Research Center, Tohoku University, 2-1-1 Katahira, Aoba-ku, Sendai 980-8577, JapanbDepartment of Neurosurgery, Tohoku University, 1-1 Seiryoucho, Aoba-ku, Sendai 980-8574,Japan
cNational Sendai Hospital, Miyagino 2-8-8,Miyagino-ku, Sendai 983-8520, Japan
In previous study, we successfully revealed that the detonation of silver azide pellets weighing a few mg produced shockwave/bubble interactions in water. The interactions were found to form liquid-jet and effectively penetrate layers of artificialthrombi. In this paper, laser-induced bubble and shock wave driven by micro-explosive were interacted to produce the liquid-jet.Pulse Ho:YAG laser beams transmitted through 0.6 mm dia. optical fiber. Phenomena were observed by high-speed camera. As aresult of this, the collapse of bubbles impinged with micro shock waves induced micro-water jets, which penetrated readilyartificial thrombi for several mm in depth. And laser-induced water-jet released from narrow catheter was also effective topenetrate the thrombi.
INTRODUCTION
Cerebral infarction has to be treated within6 hoursafter onset. Extension of blood vessel with ballooncatheter is usually conducted for recanalization inpresent. However, success rate of the treatment isabout 75% and serious side effect often appearsbecause of using large amount of fibrinolytics.Development of fibrinolysis on cerebral artery ispromoted. Liquid-jet can be produced by shock wave/ bubbleinteraction, and the liquid-jet can penetrate thrombi.Instead of the former method, application of liquid-jetto cerebral embolism was worked out, and the effect ofliquid-jet on revascularization was certified in vitroexperiments [1]. For approach of this technique toclinical field, trial liquid-jet generators were developedand in vitro experiments to break artificial gelatinthrombi with the trial device were carried out
EXPERIMENTS
Shock/Bubble interaction liquid-jetShock/Bubble interaction liquid-jetShock/Bubble interaction liquid-jetShock/Bubble interaction liquid-jetFigure 1 is schema of liquid jet generator caused by
shock wave/ bubble interaction. Shock wave andbubble is produced by micro-explosive and laserirradiation going through optical fiber, respectively.Irradiated laser is pulse Ho:YAG laser (NipponInfrared Industry Co. Ltd, 350msec pulse width, 350)10%mJ/pulse). Wavelength of Ho:YAG laser is 2.1mm, which is near to the absorption wave length ofwater [2]. The optical fiber has 0.6 mm core diameter.Explosive used to generate shock wave was AgN3pellet. The explosive is ignited by YAG laser. Weightof the explosive was 25 }3% mg. Shock wavepropagated through the gap between two tubes in Fig.1. 10% gelatin artificial thrombus was inserted to 4
mm inner diameter glass tube. The glass tube is infront of the liquid-jet generator. Experiments wereconducted in water container, which has 110mmlength and 110mm breadth and 130mm height. 5 mmacrylic plates were put on the both side of thecontainer for visualization. The glass tube is at thecenter of the container. Liquid-jet produced in theglass tube and breaking process of the artificialthrombus by liquid-jet were observed by high-speedcamera (SHIMADZU Co. Ltd, prototype ISIS-CCD).
FIGURE 1.Schema of shock/bubble interaction liquid-jet generator
Jet catheterJet catheterJet catheterJet catheter Figure 2 is cross section of trial jet catheter. Opticalfiber was inserted to the catheter (2mm diameter).Rapid babble expansion in narrow tube induces thewater-jet going out from the catheter. There wasdistance between exit of the catheter and tip of thefiber, the distance is described "stand-off distance D"after this. D is variable parameter. Pure water flew inthe catheter. Flux was 150 ml/sec. The catheter wasinserted into the glass tube, and tip of the catheter wascontacted to the surface of the artificial thrombus.Condition of experiments was same as above-mentioned experiments, and breaking process of theartificial thrombus by jet catheter were visualized byhigh-speed camera.
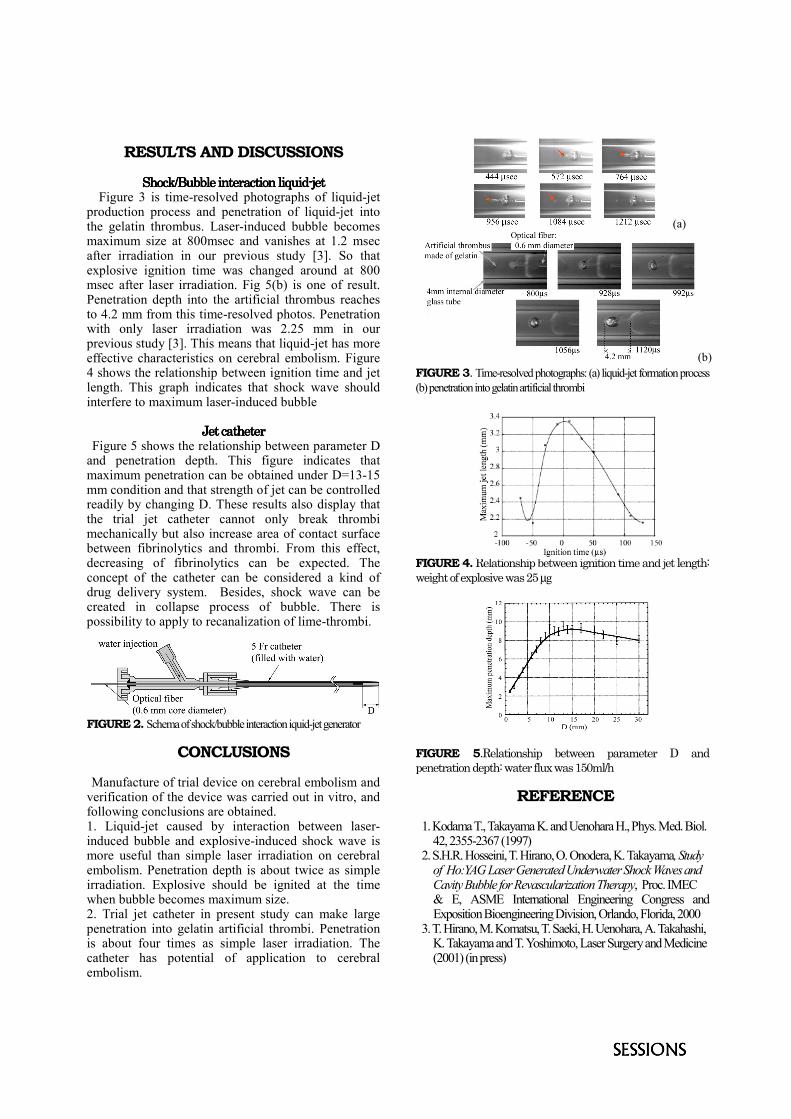
RESULTS AND DISCUSSIONS
Shock/Bubble interaction liquid-jetShock/Bubble interaction liquid-jetShock/Bubble interaction liquid-jetShock/Bubble interaction liquid-jet Figure 3 is time-resolved photographs of liquid-jetproduction process and penetration of liquid-jet intothe gelatin thrombus. Laser-induced bubble becomesmaximum size at 800msec and vanishes at 1.2 msecafter irradiation in our previous study [3]. So thatexplosive ignition time was changed around at 800msec after laser irradiation. Fig 5(b) is one of result.Penetration depth into the artificial thrombus reachesto 4.2 mm from this time-resolved photos. Penetrationwith only laser irradiation was 2.25 mm in ourprevious study [3]. This means that liquid-jet has moreeffective characteristics on cerebral embolism. Figure4 shows the relationship between ignition time and jetlength. This graph indicates that shock wave shouldinterfere to maximum laser-induced bubble
Jet catheterJet catheterJet catheterJet catheter Figure 5 shows the relationship between parameter Dand penetration depth. This figure indicates thatmaximum penetration can be obtained under D=13-15mm condition and that strength of jet can be controlledreadily by changing D. These results also display thatthe trial jet catheter cannot only break thrombimechanically but also increase area of contact surfacebetween fibrinolytics and thrombi. From this effect,decreasing of fibrinolytics can be expected. Theconcept of the catheter can be considered a kind ofdrug delivery system. Besides, shock wave can becreated in collapse process of bubble. There ispossibility to apply to recanalization of lime-thrombi.
FIGURE 2. Schema of shock/bubble interaction iquid-jet generator
CONCLUSIONS
Manufacture of trial device on cerebral embolism andverification of the device was carried out in vitro, andfollowing conclusions are obtained.1. Liquid-jet caused by interaction between laser-induced bubble and explosive-induced shock wave ismore useful than simple laser irradiation on cerebralembolism. Penetration depth is about twice as simpleirradiation. Explosive should be ignited at the timewhen bubble becomes maximum size.2. Trial jet catheter in present study can make largepenetration into gelatin artificial thrombi. Penetrationis about four times as simple laser irradiation. Thecatheter has potential of application to cerebralembolism.
FIGURE 3. Time-resolved photographs: (a) liquid-jet formation process(b) penetration into gelatin artificial thrombi
FIGURE 4. Relationship between ignition time and jet length:weight of explosive was 25 µg
FIGURE 5.Relationship between parameter D andpenetration depth: water flux was 150ml/h
REFERENCE
1. Kodama T., Takayama K. and Uenohara H., Phys. Med. Biol.42, 2355-2367 (1997)
2. S.H.R. Hosseini, T. Hirano, O. Onodera, K. Takayama, Studyof Ho:YAG Laser Generated Underwater Shock Waves andCavity Bubble for Revascularization Therapy, Proc. IMEC& E, ASME International Engineering Congress andExposition Bioengineering Division, Orlando, Florida, 2000
3. T. Hirano, M. Komatsu, T. Saeki, H. Uenohara, A. Takahashi,K. Takayama and T. Yoshimoto, Laser Surgery and Medicine(2001) (in press)
(a)
(b)

INTRODUCTION A variety of mechanisms have been proposed to ex-plain how lithotripter shock waves (SW’s) break kidneystones. There is good evidence to show that enhancementof tensile stress due to SW reflection off the distal side ofthe stone can cause it to fail by spall [1]. Cavitation inthe fluid surrounding the stone, particularly at its proxi-mal surface also has been shown to contribute to stonefragmentation [2,3]. It has been proposed that cavitationbubble collapse could create secondary shock waves that,like the focused SW of the lithotripter pulse, contributeto tensile stress within the stone [4,5]. Here we reportobservations with in vitro systems using artificial stonesin which cavitation appears to promote spall failure.
EXPERIMENTAL METHODS Artificial Stones: Stones (cylinders 7.5 mm long by 6.5mm dia) were cast from Ultracal-30 gypsum [6] (UnitedStates Gypsum, Chicago, IL) and stored in water.
Lithotripter: SW’s were administered using a researchelectrohydraulic lithotripter that has been demonstratedto produce acoustic output comparable to an unmodifiedDornier HM3 lithotripter [7]. For all in vitro configura-tions stones were positioned at F2 and treated at 20 kV,0.5 Hz.
Shock Wave Exposure at Overpressure: Stones con-tained within a mesh basket were positioned inside achamber in which excess static pressure (overpressure)
Cavitation Promotes Spall Failure of Model Kidney StonesTreated by Shock Wave Lithotripsy In Vitro
James A. McAteer1, Robin O. Cleveland2, Drew L. Rietjens1, Yuriy A.Pishchalnikov3, Irina V. Pishchalnikova3 and James C. Williams, Jr.1
1Dept. of Anatomy & Cell Biology, Indiana Univ. Sch. of Medicine, 635 Barnhill Dr., Indianapolis, IN 46202, USA.2Dept. of Aerospace and Mechanical Engineering, Boston University, 110 Cummington St., Boston, MA 02215, USA.
3Dept. of Acoustics, Physics Faculty, M.V. Lomonosov Moscow State University, Moscow 119899, Russia.
Studies were conducted to assess the role of cavitation and spall in the breakage of artificial stones in vitro. Hydrated gypsumcylinders held in a mesh basket (free to move) fragmented readily when treated (400 SW’s, 20 kV) at atmospheric pressure. Treat-ment with a higher dose of 1600 SW’s, but, at overpressure (>130 atm) sufficient to preclude cavitation, dramatically reduceddamage. These stones remained intact and showed no erosion, but upon examination by micro-computed tomography, some stoneswere seen to exhibit internal fractures. Overpressure could have suppressed the fracture failure of these stones. Also, stone move-ment within the vial likely created shot-to-shot variation in the location of the tensile stress necessary for spall. With this in mindstones were stabilized by holding them with water-saturated gauze. These stones treated at atmospheric pressure failed by spallwithin 300SWs. The gauze did not prevent cavitation, as the SW-entry surface of the stone showed erosion. When a Mylar disk washeld directly against the SW-entry end of the stone the stone showed no erosion and did not spall. Moving the mylar proximal to thegauze did not prevent spall. These observations suggest that in this particular in vitro system, cavitation bubble collapse at thesurface of the stone contributed to failure by a spall mechanism.
could be applied. The overpressure chamber had acous-tic windows that allowed transmission of the SW withminimal attenuation and virtually no alteration in wave-form [8]. Overpressure well-in-excess of the amplitudeof the tensile phase of the SW (~80-100 atm) could beachieved (overpressure >130 atm possible).
Stones Stabilized for SW Exposure: Stones were heldupright in water by surrounding them with water-satu-rated cotton gauze (Figure 1). Gauze was wrapped aroundthe stone, which was then fitted into a plastic tube fillednearly to the mouth with such gauze. At this point oneend of the stone remained uncovered. A cushion of gauzewas placed over this end, held in place with a threadedcap. For some stones, a 6.5 mm disk of 5 mil Mylar waslaid against the end of the stone, held in place by thegauze cushion and cap. The cap had a Mylar window (5mil) and the distance from the window to the stone was 5mm.
Analysis of Stone Damage: Stones were analyzed byvisual inspection and by micro-computed tomography us-ing a Scanco-20 research CT scanner (Scanco, Zurich).
RESULTS AND DISCUSSIONStones held within a 2 mm mesh basket and treated at
atmospheric pressure with 400 SW’s broke into numer-ous fragments, many of which could pass through themesh. Stones treated with up to 1600 SW’s, but at ex-treme overpressure (>120 atm) did not break into frag-

ments, but some of these stones did show faint cracks. Inprevious studies we have shown that overpressure sup-presses cavitation [8,9]. Overpressure in the range of 1-3atm eliminates cavitation in water as assessed by highspeed photography and passive cavitation detection [10].Foil targets which show pitting when exposed to SW’s atatmospheric pressure, show no pitting when treated withSW’s at 120 atm [8]. Thus, overpressure eliminates cavi-tation, but might also suppress the failure of a stone byspall. That is, since spall is the failure of a material undertension, application of overpressure in excess of that ten-sile stress could very well stabilize the stone and keep itfrom breaking up. Because overpressure might interferewith spall we looked for another means to control cavita-tion. We reasoned that if the cavitation that erodes theproximal surface of a stone involves bubble activity inti-mately associated with the surface of the stone it mightbe possible to physically interrupt the growth of thesebubbles, thus preventing their forceful collapse. We de-vised a setup in which a thin sheet of Mylar could bepressed against the stone. Stones stabilized by gauze (butwith no Mylar disk pressed against stone surface) showedproximal erosion and spall—often with complete trans-verse breakage (Figure 2, left). When Mylar was in place,the stones showed no erosion of their proximal surface,and these stones did not spall (Figure 2, right). To testwhether the Mylar disk interfered with transmission ofthe SW we tested placement of the disk next to the cap.Stones treated with this configuration showed proximalerosion and spall.
In summary, these observations suggest that both cavi-tation and spall contribute to stone fragmentation. Spallcan occur in the absence of cavitation, but at least as seenwith this particular in vitro system, spall failure is dra-matically enhanced when cavitation occurs at the proxi-mal face of the stone.
ACKNOWLEDGMENTS This work was supported by NIH grants PO1-
DK43881 and DK55674, and by an AFUD Fellowshipto RF Paterson.
REFERENCES1. Xi X, and Zhong P. J Acoust Soc Am 109:1226-1239 (2001).2. Crum LA. J Urol 140:1587-1590 (1988).3. Sass W, Braunlich M, Dreyer HP, Matura E, Folberth W, PreismeyerHG, and Seifert J. Ultrasound Med Biol 17:239-243 (1991).4. Zhong P, Chuong CJ, and Preminger GM. J Acoust Soc Am 94: 29-36 (1993).5. Gracewski SM, Dahake G, Ding Z, Burns SJ, and Everbach EC. JAcoust Soc Am 94: 652-661 (1993).6. Dahake G, and Gracewski SM. J Acoust Soc Am 102:2138-2145(1997).7. Cleveland RO, Bailey MR, Fineberg NS, Hartenbaum B,Lokhandwalla M, McAteer JA, and Sturtevant B. Rev Scientific Instru-ments 71:2514-2525 (2000)8. Stonehill MA, Williams JC, Bailey MR, Lounsbery D, ClevelandRO, Crum LA, Evan AP, and McAteer JA. Meth Cell Science 19:303-310 (1998)9. Williams JC, Woodward JF, Stonehill MA, Evan AP, and McAteerJA. Ultrasound Med Biol 25:1445-1449 (1999)10. Bailey MR, Cleveland RO, Sapozhnikov OA, McAteer JA, Will-iams JC, and Crum LA. J Acoust Soc Am 105:1267-1270 (1999)
Figure 2. Micro CT images of stones exposed to 300 SW’s, 20kV, 0.5 Hz (at atmospheric pressure). Upper images are slicesthrough stones; lower images are 3-D reconstructions of theproximal ends (SW entry end) of the two stones. Left: Stonewas supported by gauze alone. Proximal end was eroded (thickarrows and lower image); this is damage likely due to cavita-tion activity. Transverse fracture is apparent within stone (thinarrows); this is damage characteristic of spall. Right: Stonethat had a Mylar disk pressed against its proximal end duringadministration of SW’s. This stone showed no damage, withno erosion at the proximal face and no fractures within the stone.
Figure 1. Illustration of stone environment for this study. Stonewas supported by gauze in water within a vial (SW enteringfrom the bottom of diagram). Stones were exposed to SW’swith and without Mylar disk pressed against lower surface.
Gauzein water
Stone
Mylar diskagainst stone

INTRODUCTION The current trend in clinical SWL is to treat patients atthe relatively fast rate of 2 Hz. In vitro studies have shownthat SW rate is a factor in stone fragmentation and thathuman and artificial stones break better at slower rates[1]. We sought to test the effect of SW rate on stone com-minution in vivo using a new animal model. Here wereport that slowing the SW rate improved the efficiencyof stone breakage in vivo. To better understand the acous-tic mechanisms responsible for this effect we collectedwaveforms at two rates (0.5 and 2 Hz) using a PVDFmembrane hydrophone and assessed for differences inSW parameters including arrival time, and maximum am-plitudes and areas of the compressive and tensile phases.
EXPERIMENTAL METHODS Implantation of Artificial Stones Via Percutaneous Ac-cess: Hydrated gypsum stones (Ultracal-30; 7.5 x 6.5mm) were implanted in both kidneys of female farm pigs(~45 kg) using a percutaneous access similar to that per-formed in percutaneous nephrostolithotomy for the re-moval of stones from patients. Upper pole peripheral ca-lyceal puncture was performed with an 18 ga splenicneedle and the tract was dilated using a Nephromax bal-loon and Amplatz sheath. A rigid nephroscope was usedto visualize the renal collecting system and to guide one
Slowing the Pulse Repetition Frequency in Shock WaveLithotripsy (SWL) Improves Stone Fragmentation In Vivo
Ryan F. Paterson2, David A. Lifshitz2, James E. Lingeman2, James C. Williams,Jr.1, Drew L. Rietjens1, Andrew P. Evan1, Bret A. Connors1, Michael R. Bailey3,
Lawrence A. Crum3, Robin O. Cleveland4, Yuriy A. Pishchalnikov5,Irina V. Pishchalnikova5, and James A. McAteer1
1Dept. of Anatomy and Cell Biology, Indiana Univ. Sch. of Medicine, 635 Barnhill Dr., Indianapolis, IN 46202, USA2Methodist Hospital Institute for Kidney Stone Disease, 1801 North Senate Blvd., Indianapolis, IN 46202, USA
3Applied Physics Laboratory, University of Washington, 1013 NE 40th Street, Seattle, WA 98105, USA4Dept. of Aerospace and Mechanical Engineering, Boston University, 110 Cummington St., Boston, MA 02215, USA;
5Dept. of Acoustics, Physics Faculty, M.V. Lomonosov Moscow State University, Moscow 119899, Russia.
In clinical lithotripsy shock waves (SW’s) are often delivered at rates as fast as 2Hz. This may not give the best stone breakage, as invitro studies have shown that slowing the SW rate (<2Hz) improves stone fragmentation. We tested the effect of SW rate on stonecomminution in vivo in a new animal model. Artificial stones were inserted into both kidneys of ~45 kg pigs via percutaneousaccess. SWL was performed (Dornier HM3, 400SW’s uninterrupted, 20kV, 2Hz or 0.5Hz), and stone fragments were collected andsieved through 2mm mesh. The percent of stone weight lost (particles <2mm), was greater in stones treated at 0.5Hz than with 2Hz.Thus, slowing the SW rate improved the efficiency of stone fragmentation in vivo. One explanation for this effect is that bubblesalong the SW axis were more numerous with faster rate. These bubbles might interfere with SW propagation; however, in vitromeasures with a PVDF membrane hydrophone showed no effect of SW rate on arrival time or amplitude of the positive pressurepulse. Thus, the acoustic mechanism for this SW rate effect on stone comminution has yet to be determined.
stone into a lower pole calyx, one stone per kidney. Dur-ing a 2 hr recovery period urine output returned to nor-mal. Renal ultrasonography and fluoroscopy were usedto confirm stone position. There was no occurrence ofhydronephrosis, minimal perinephric fluid and no airwithin the collecting system. Shock Wave Lithotripsy: SWL was performed using aDornier HM3 lithotripter (unmodified: 80 nf capacitor).Stones were targeted via biplanar fluoroscopy—initiallyand at every 50 SW’s. SW’s were delivered uninterrupted;400 SW’s per stone, 20 kV, 0.5 Hz or 2 Hz. Control stoneswere implanted but not treated. Harvest and Quantitation of Stone Fragments: The uri-nary tract was removed en bloc and dissected in a retro-grade manner to locate stone fragments that migrated fromthe kidney. Stone fragments were collected, debrided,sieved through 2 mm mesh, and dried. Fragments retainedby the mesh were weighed. In Vitro Assessment of SW Rate on Lithotripter Wave-form: Studies were performed using a research electro-hydraulic lithotripter with the same acoustic output asthe Dornier HM3 lithotripter [2]. Series of >100 SW’swere fired (20 kV, 0.5 Hz or 2 Hz) and waveforms col-lected at F2 using a PVDF membrane hydrophone (Ktech,Albuquerque, NM, USA) that we shielded with a film ofRTV silicone sealant.

RESULTS AND DISCUSSIONSW rate had a significant effect on stone comminution
in vivo (Figures 1 and 2). SW treatment at 0.5 Hz wasmore efficient than at 2 Hz, leaving fewer particles largerthan 2 mm (2 mm is clinically relevant, as fragments ofthis size can be passed from the urinary tract).
Shock arrival time, pressure amplitudes (Figure 3) and
the area of positive and negative pressure of the wave-form were characteristically responsive to changes incharging potential. However, SW rate had no effect onthese parameters. This was surprising since we have ob-served by b-mode ultrasound and high-speed camera adramatic, visible increase in bubbles along the SW axisat fast rate. We anticipated that such a buildup of bubbleswould act to interfere with propagation of the SW, butdirect measurement revealed no change in waveform pa-rameters as a function of rate.
CONCLUSIONSOur findings demonstrate that slowing the pulse rep-
etition frequency in SWL has a significant positive ef-fect on the efficiency of stone fragmentation in vivo. Theimplication for clinical SWL is that slower administra-tion of SW’s could improve the efficiency of SWL. As-sessment with a membrane hydrophone showed no ef-fect of SW rate on waveform parameters. This suggeststhat SW rate does not have a profound effect on thelithotripter acoustic field and implies that the mechanismof the rate effect might be localized to the environmentof the stone—possibly involving cavitation dynamics atthe stone surface.
ACKNOWLEDGMENTS This work was supported by NIH grants PO1-
DK43881 and DK55674, and by an AFUD Fellowshipto RF Paterson.
REFERENCES1. Lifshitz DA, Williams JC, Lingeman JE, Evan AP, Rietjens DL,McAteer JA. J Urol 163 (no. 4 supplement):338 (2000).2. Cleveland RO, Bailey MR, Hartenbaum B, Lokhandwalla M,McAteer JA, Sturtevant B. Rev Scientific Instr 71:2514-2525 (2000).
Figure 3. Hydrophone measurements of peak pressure of shockwave at different rates and voltage. Number of measurementsshown at the bottom of each column. Connected bars are stan-dard error of the mean, and standard deviation is shown withthin lines. The 20 kV data are not different between the tworates. *Different from 0.5Hz 20 kV and 2Hz 20 kV, p<0.05.
1
2
3
4
20 kV 18 kV 20 kV 22 kV
0.5 Hz 2 Hz
*
*
Pea
k p
ress
ure
(re
lati
ve s
cale
)
97 9987 99
Figure 1. Appearance of typical stone breakage inside the pigkidney after receiving 400 shock waves at 20 kV. A. 0.5 Hz.Stone is broken into small pieces. B. 2 Hz. Stone remains inlarge fragments.
GR
EAT
ER
FR
AG
ME
NTAT
ION
30
40
50
60
70
80
90
100
0.5 2Rate (Hz)
p<0.0008
Fra
gm
ents
ret
ain
ed >
2mm
(%
)
6
6
Figure 2. Measurement of fragments left after administrationof 400 SW’s to stones inside live pigs. At the slower rate, mostof the stone was broken into pieces less than 2mm in dimen-sion. Error bars show standard error of the mean, with numberof stones above the bars.

A variety of in vitro models have been used to investigate stone comminution in SWL and have provided evidence that bothcavitation and spall play a role in stone fragmentation. We sought to determine how stones break within the kidney of living animals.Artificial stones (gypsum cylinders 7.5x6.5mm) were inserted into the kidneys of ~45 kg pigs via percutaneous access. Stones weretargeted by fluoroscopy and treated (400SW’s, 20kV) with a Dornier HM3 lithotripter. Kidneys were dissected and stone fragmentsexamined. Many stones revealed damage characteristic of cavitation (erosion) and spall (with the fracture distal to the site of SWimpact). The pattern of damage in vivo was similar to that of cohort artificial stones treated under comparable conditions (orienta-tion, stabilization, SW parameters) in vitro. Thus, it appears that artificial stones fragment in vivo by a combination of cavitation andspall damage.
Evidence That Cavitation and Spall Contribute to StoneFailure in an Animal Model of Kidney Stone Fragmentation
by Shock Wave Lithotripsy (SWL)
James A. McAteer1, Robin O. Cleveland2, Ryan F. Paterson3, Drew L. Rietjens1,Andrew P. Evan1, Bret A. Connors1, James E. Lingeman3, Yuriy A. Pishchalnikov4,
Irina V. Pishchalnikova4, and James C. Williams, Jr.1
1Dept. of Anatomy & Cell Biology, Indiana Univ. Sch. of Medicine, 635 Barnhill Dr., Indianapolis, IN 46202, USA.2Dept. of Aerospace and Mechanical Engineering, Boston University, 110 Cummington St., Boston, MA 02215, USA.
3Methodist Hospital Institute for Kidney Stone Disease, 1801 North Senate Blvd., Indianapolis, IN 46202, USA.4Dept. of Acoustics, Physics Faculty, M.V. Lomonosov Moscow State University, Moscow 119899, Russia.
INTRODUCTION SWL has proven to be an effective therapy for re-
moval of urinary stones. However, SW treatment com-monly results in collateral damage to the kidney [1]. Thespectre of adverse effects has stimulated research to findways to enhance stone comminution without causing re-nal injury. The foundation for the improvement of SWLis to understand how SW’s break stones. Numerousmechanisms have been proposed to explain how SW’scause stones to fail, and studies with in vitro models havedemonstrated that the compressive stress of the focusedSW [2] and cavitation caused by the tensile phase of thepressure pulse [3,4] both contribute to stone breakage.Thus, data obtained with in vitro test systems implicateat least two acoustic mechanisms that can be manipu-lated by controlling the lithotripter waveform. One ca-veat of work with in vitro models is concern that the invitro environment may not adequately represent the en-vironment of kidney stones in vivo. That is, how SW’sbreak stones in vitro may not be how stones are brokenin the kidney. To address this concern we characterizedthe pattern of damage when artificial stones were treatedin vitro and compared this to stones implanted in pig kid-neys and treated with a clinical lithotripter.
EXPERIMENTAL METHODS Artificial Stones: Stones (slightly tapered cylinders
7.5 mm x 6.5 mm) were prepared from Ultracal-30 gyp-sum cement (United States Gypsum, Inc.), cast in 96 well
plates, liberated with chloroform and stored in water. In Vitro Setup: Stones were immobilized with loosely
packed water-hydrated cotton gauze and positioned nearan acoustically invisible Mylar window in the cap of aplastic centrifuge tube. Thus, SW’s passed through theMylar and through gauze before striking the stone. Stoneswere oriented in vitro to approximate the orientation ofstones in vivo (i.e. stone long axis perpendicular to, or at~45° to the SW axis). Stones were exposed to 300 SW’s,20 kV, using a research electrohydraulic lithotripter pat-terned after the Dornier HM3 lithotripter [5].
SW Treatment of Stones In Vivo: Stones were im-planted in the lower pole calyx of female pigs (~45 kg)via percutaneous access. During a 2 hr recovery periodfluoroscopy and diagnostic US were used to rule out ab-normal fluid accumulation or air within the collectingsystem. Stones were stabilized by the walls of the calyx,but were bathed by urine at the flat ends and over por-tions of the sides of the cylinder. In positioning the ani-mals for lithotripsy the stones were targeted by biplanarfluoroscopy. 400 SW’s were administered at 20 kV.
Analysis of Stone Damage: Following SWL the kid-neys were removed and dissected to expose the calycealsystem. Stone fragments were collected and dried. Digi-tal images of the fragments were collected and selectedstones were analyzed by micro-computed tomographyusing a Scanco-20 research CT scanner (Scanco, Zurich).

RESULTS AND DISCUSSIONIn vitro stones were eroded at their proximal surface
and they showed fractures (Figure 1). The location of thefractures was dependent on the orientation of the stonerelative to the acoustic axis of the lithotripter. That is,when in vitro stones were oriented vertically the fracturewas transverse (Figure 2, left). When the stone was tiltedto approximately 45° the fracture could be longitudinalor transverse (Figure 1, and Figure 2, right).
Figure 4. Another artificial stone exposed to lithotripter SW’sin vivo. This photograph shows a crack in the surface of thisstone that is consistent with development of a longitudinal spallfracture, like that seen in Figure 1 in vitro.
TL
E
T
E
Figure 2. Modes of stone damage. E: erosion, probably fromcavitation activity. L and T: longitudinal and transverse cracksor breaks within the stone; these fit with what is expected fromspallation. Insets show direction of SW entering stone.
In vivo stones showed a very similar pattern of damagethat included erosion on one side and fractures runningeither along the length of the cylinder or across it (Fig-ures 3 and 4). In experiments with in vivo stones it wasnot possible to be certain of the orientation of the stoneto the SW axis. Based upon the position of the animal inthe lithotripter we estimate that SW’s entered the stoneobliquely (like the 45° stones in vitro).
The pattern of damage to stones in vivo and in vitrosuggests a contribution from at least two possible mecha-nisms. Erosion at the leading face of the stone is prob-ably due to cavitation. In related studies we have foundthat proximal erosion is eliminated when SW’s are ad-ministered at overpressure sufficient to preclude cavita-tion. Fracture of the stones is consistent with failure dueto a spall mechanism. Spall occurs when the SW reflectsoff the distal surface of the stone [2]. The reflected SWreverses phase, is focused within the interior of the stoneand the stone fails in tension. The geometry of the stone
influences the focus of this reflection and numerical simu-lations using a finite-difference time-domain code in atwo-dimensional geometry can be used to predict theenhancement of the tensile stress and the location of fo-cus [6]. Using this model we estimate that for an inci-dent SW normal to the longitudinal or transverse axis ofthe stone, spall fracture should occur 2-3 mm inward fromthe side opposite to SW entry. Our results both in vivoand in vitro are in agreement with this prediction.
In summary, the pattern of damage to artificial stonesimplanted in pig kidneys and exposed to SW’s in vivoexhibits features (erosion and fractures) consistent withfailure by cavitation and by spall.
ACKNOWLEDGMENTSThis work was supported by NIH grants PO1-DK43881
and DK55674, and by an AFUD Fellowship to RFP.
REFERENCES1. Evan AP. Willis LR, Lingeman JE, and McAteer JA. Nephron 78:1-8 (1998).2. Xi X, and Zhong P. J Acoust Soc Am 109:1226-1239 (2001).3. Crum LA. J Urol 140:1587-1590 (1988).4. Sass W, Braunlich M, Dreyer HP, Matura E, Folberth W, PreismeyerHG, and Seifert J. Ultrasound Med Biol 17:239-243 (1991).5. Cleveland RO, Bailey MR, Hartenbaum B, Lokhandwalla M,McAteer JA, and Sturtevant B. Rev Scientific Instr 71:2514-2525 (2000).6. Cleveland RO, McAteer JA, and Williams JC. Proc 17th Intl CongAcoust (2001).
Figure 3. Artificial stone exposed to lithotripter SW’s in vivo.Left: micro CT reconstruction of stone surface, showing re-gion where SW’s appear to have entered stone. Right: Slicethrough reconstructed CT image showing transverse fracture.
Figure 1. Artificial stone exposed to lithotripter SW’s in vitro,at about 45° angle. A: Erosion visible at site of SW entry intostone. B: Photo of other end shows a surface crack (arrows)that indicates a longitudinal fracture developing in this stone.