short range devices operating in the 863 - 870 mhz frequency band
TRANSCRIPT

2210/SRDMR/R/3
5th
August 2010
Short Range Devices operating in the 863 - 870 MHz
frequency band
Office of Communications (Ofcom)
Final Report


Ægis Systems Limited 863–870 MHz SRDs
2210/SRDMR/R/3 i
Table of Contents
1 EXECUTIVE SUMMARY ....................................................................... 1
2 INTRODUCTION ................................................................................. 6
2.1 Background ........................................................................................................ 6
2.2 Scope of report ................................................................................................... 6
2.3 Acknowledgments.............................................................................................. 9
3 THE 863 –870 MHZ FREQUENCY BAND .............................................. 10
4 LOW-BAND ....................................................................................... 13
4.1 Wireless microphones ....................................................................................... 13
4.2 Wireless audio systems .................................................................................... 15
4.3 Assistive listening devices ............................................................................... 16
5 MID-BAND ........................................................................................ 19
5.1 Manufacturing and distribution ........................................................................ 19
5.2 Individual item tagging ...................................................................................... 22
5.3 Asset tracking ..................................................................................................... 25
6 HIGH-BAND AND UNDERLAY ............................................................... 27
6.1 Fire alarm systems ............................................................................................. 27
6.2 Intruder alarm systems ...................................................................................... 30
6.3 Home/Office automation .................................................................................... 33
6.4 Access control .................................................................................................... 34
6.5 Remote controllers............................................................................................. 34
6.6 Medical ................................................................................................................ 36
6.7 Social alarms/Telecare ...................................................................................... 37
6.8 Smart metering ................................................................................................... 39
6.9 Telemetry ............................................................................................................ 42
6.10 Automotive .......................................................................................................... 43
7 CONCLUDING REMARKS .................................................................... 45
A ACRONYMS / ABBREVIATIONS ............................................................ 46

863–870 MHz SRDs Ægis Systems Limited
ii 2210/SRDMR/R/3
B REFERENCES ................................................................................... 48
C PARAMETERS, ASSUMPTIONS AND CALCULATIONS USED FOR
FORECASTS ...................................................................................... 50
C.1 Low-band ............................................................................................................ 50
C.1.1 Wireless Microphones ..................................................................................... 50
C.1.2 Assistive Listening Devices – ALDs ................................................................ 53
C.2 Mid-band ............................................................................................................. 56
C.2.1 RFID use in Manufacturing and Distribution ................................................... 56
C.2.2 RFID use in Individual Items ........................................................................... 61
C.3 High-band ............................................................................................................ 65
C.3.1 Fire alarms ...................................................................................................... 65
C.3.2 Intruder alarms ................................................................................................ 68
C.3.3 Remote Controllers ......................................................................................... 70
C.3.4 Social alarms ................................................................................................... 72
C.3.5 Smart metering ................................................................................................ 74
C.4 Use of the Gompertz Curve ............................................................................... 76

Ægis Systems Limited 863–870 MHz SRDs
2210/SRDMR/R/3 1
1 EXECUTIVE SUMMARY
Background
As a result of the switchover from analogue to digital television, an amount of radio
spectrum will be released for uses other than television. This release of spectrum is
widely known as the ―Digital Dividend‖.
There is a likelihood that the frequency band 790–862 MHz will be used for mobile
broadband services in line with plans being formulated in Europe. In order to
manage the radio spectrum effectively Ofcom needs to understand what the
implications of such use will be for Short Range Devices (SRDs) operating in the
frequency band just above the digital dividend spectrum in terms of the potential for
interference.
SRD band
862 MHz
863 MHz
865 MHz
868 MHz
870 MHz
Microphones & audio
Radio Frequency Identification Devices
Alarms, etcHome Office
Mobile system uplink(User Terminal Tx)
Potential impact
MoD
Ofcom has therefore commissioned two pieces of work relating to the 863–870 MHz
frequency band; one looking at the market for SRDs (as reported on here) and the
other investigating SRD receiver characteristics followed by measurements of their
performance (reported on elsewhere).
A further piece of work has been undertaken by other parties for Ofcom regarding
the implications for the frequency band sandwiched between the top of the digital
dividend spectrum and the bottom of the SRD frequency band, namely the 1 MHz
segment 862–863 MHz.
In order to better understand the current and future use of the 863–870 MHz SRD
band Ofcom requested that market research should address:
the different services/applications/products that utilise this band
the manufacturers of devices used and the end users
the number of these different devices active in the UK

863–870 MHz SRDs Ægis Systems Limited
2 2210/SRDMR/R/3
the likely demand from service providers/ manufacturers for this spectrum in
the future (including applications not yet using this spectrum but who might
choose to in the future).
Approach
In order to meet the main objective of the study, namely to estimate the market size
for Short Range Devices (SRDs) operating in the 863–870 MHz frequency band five
years ahead, we have undertaken three main tasks:
secondary research—an analysis of applications, systems and products
based on publicly available information
primary research—a programme of interviews with representatives from the
industry
analysis and forecasting—identification of application drivers/substitutes and
the forecast of future demand.
As a starting point we analysed the products and services offered by current and
past members of the Low Power Radio Association (LPRA). We were also able to
identify a number of suppliers who are not members of the LPRA.
In order to provide market forecasts for different applications it was firstly necessary
to group them by type. We have done this with respect to the three distinct parts of
the frequency band as follows:
Low-band
(863–865 MHz)
Mid-band
(865–868 MHz)
High-band
(868–870 MHz) [1]
Wireless microphones Manufacturing and
distribution
Fire alarm systems
Wireless audio Individual item tagging Intruder alarm systems
Assistive listening
devices
Asset tracking Home/Office automation
Access control
Remote controllers
Medical
Social alarms/Telecare
Smart meters
Telemetry
Automotive
Note 1—This includes the non-specific underlay across the whole band 863–870 MHz.

Ægis Systems Limited 863–870 MHz SRDs
2210/SRDMR/R/3 3
Amongst the LPRA members and other companies having an interest in this band
that were investigated, other less application-specific categories were also identified
(e.g. modules / chips / components / antennas, and design houses / test houses /
consultancies). These categories were not analysed in any great detail.
Representatives across the industry and covering all the categories identified in the
table above were contacted and questioned on all aspects of the market for their
devices and systems. This was undertaken through a mix of telephone interviews,
questionnaires and face-to-face meetings.
Low band devices
The 863–865 MHz portion of the 863–870 MHz band is used predominantly by
wireless microphones and wireless audio applications. While accounting for a
significantly smaller portion of the users in this band, assistive listening devices are
another application.
Mid band devices
This part of the 863–870 MHz band is used predominantly by Radio Frequency
Identification Devices (RFIDs) which consist of a combination of readers and either
active or passive tags. Typically, RFID technology can be employed as part of
innovative applications or as a replacement technology, either for other older
wireless technologies or for barcodes. RFIDs operate in many different frequency
bands; for the purposes of this report, however, we focus exclusively on UHF RFIDs
that operate in the 865–868 MHz band.
In general, RFIDs are used to locate and track items, whether these are individual
items such as clothes, containers used for transporting items in the supply chain or
high value items that require swift location. These general applications for RFIDs
can be divided into three categories: manufacturing and distribution, individual item
tagging and asset tracking; this study focuses specifically on these categories.
High band devices
The high band (868–870 MHz) is primarily used by wireless alarm systems,
including fire, intruder and social alarms which are each subject to different
operational and technical requirements. The band is subdivided further into a
number of sub-bands, based primarily on technical characteristics such as power
and duty cycle. Parts of the band are specifically identified for alarm systems,
although alarms may also operate in the part of the band identified for non-specific
devices. One of the alarm sub-bands is identified specifically for social alarms.
Underlay systems may utilise the whole 863–870 MHz band and typically deploy
spread spectrum or other wideband RF technologies. Applications are non-specific
and may include any of the applications associated specifically with the low, mid and
high bands.
Apart from the three types of alarm system already identified (i.e. fire, intruder and
social alarms), a number of other applications take advantage of the non-specific
863–870 MHz SRDs Ægis Systems Limited
4 2210/SRDMR/R/3
aspect of the regulations. These applications include home/office automation,
access control, remote controllers, medical, telecare, smart meters, telemetry
and automotive.
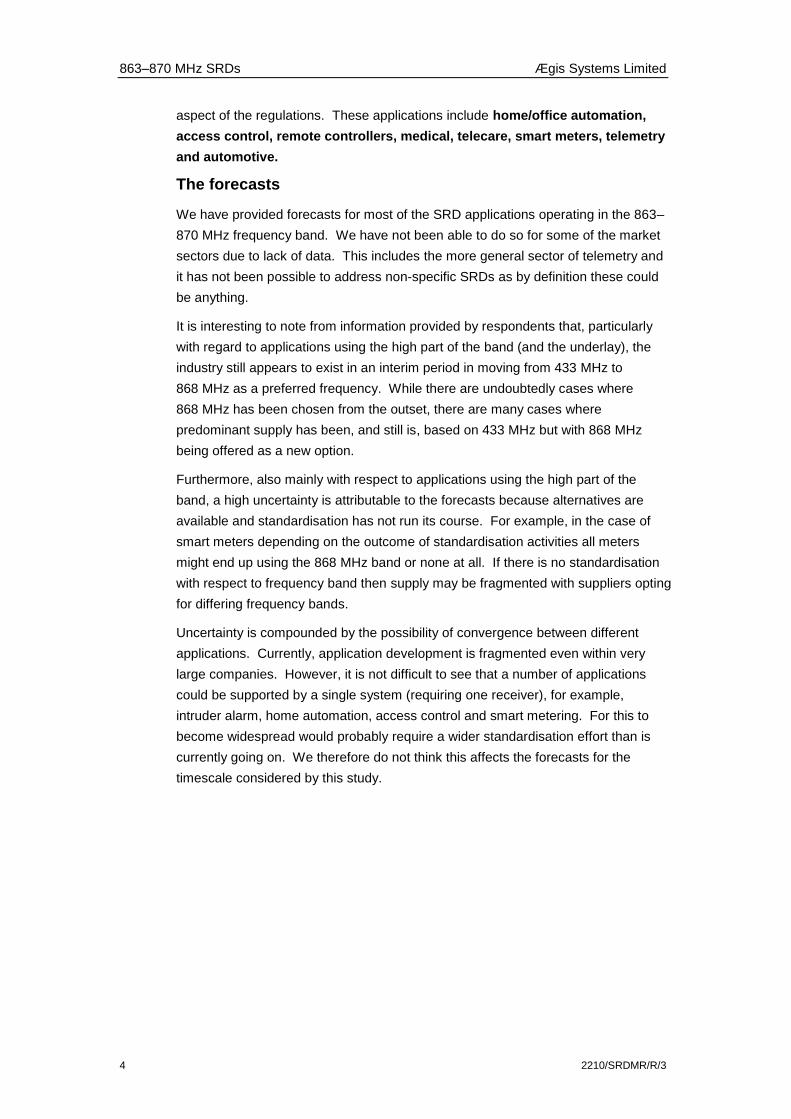
The forecasts
We have provided forecasts for most of the SRD applications operating in the 863–
870 MHz frequency band. We have not been able to do so for some of the market
sectors due to lack of data. This includes the more general sector of telemetry and
it has not been possible to address non-specific SRDs as by definition these could
be anything.
It is interesting to note from information provided by respondents that, particularly
with regard to applications using the high part of the band (and the underlay), the
industry still appears to exist in an interim period in moving from 433 MHz to
868 MHz as a preferred frequency. While there are undoubtedly cases where
868 MHz has been chosen from the outset, there are many cases where
predominant supply has been, and still is, based on 433 MHz but with 868 MHz
being offered as a new option.
Furthermore, also mainly with respect to applications using the high part of the
band, a high uncertainty is attributable to the forecasts because alternatives are
available and standardisation has not run its course. For example, in the case of
smart meters depending on the outcome of standardisation activities all meters
might end up using the 868 MHz band or none at all. If there is no standardisation
with respect to frequency band then supply may be fragmented with suppliers opting
for differing frequency bands.
Uncertainty is compounded by the possibility of convergence between different
applications. Currently, application development is fragmented even within very
large companies. However, it is not difficult to see that a number of applications
could be supported by a single system (requiring one receiver), for example,
intruder alarm, home automation, access control and smart metering. For this to
become widespread would probably require a wider standardisation effort than is
currently going on. We therefore do not think this affects the forecasts for the
timescale considered by this study.

Ægis Systems Limited 863–870 MHz SRDs
2210/SRDMR/R/3 5
Summary of forecasts
2010 2011 2012 2013 2014 2015 Notes
WIRELESS MICROPHONES (forecast in thousands of microphones)
Conservative 138 144 152 159 167 175
Aggressive 138 159 182 207 234 263
ASSISTIVE LISTENING DEVICES (forecast in thousands of ALDs)
Conservative 176 186 197 209 222 235
Aggressive 176 197 220 246 274 305
RETURNABLE CONTAINERS (forecast in millions of containers)
Conservative 29 34 39 46 53 62 1
Aggressive 29 36 44 53 65 79
RFID TAGS (forecast in millions of tags)
Conservative 336 390 452 524 606 699 2
Aggressive 336 410 499 606 732 875
FIRE ALARM RECEIVE DEVICES (forecast in millions of devices)
Conservative 10.2 12.7 15.9 19.8 24.7 30.7 3
Aggressive 10.2 13.4 17.6 23 30 39.1
INTRUDER ALARM RECEIVERS (forecast in millions of receivers)
Conservative 6.1 9 12.8 17.9 24.6 33.3 4
Aggressive 6.1 9.5 14.4 21.2 30.8 43.9
REMOTE CONTROLLERS (forecast in thousands of controllers)
Forecast 1.9 2.2 2.5 2.8 3.2 3.5
SOCIAL ALARM SYSTEMS (forecast in millions of alarm systems)
Conservative 1.8 2.1 2.5 2.9 3.4 4.0
Aggressive 1.8 2.4 3.1 4 4.9 5.0
SMART METERS (forecast in millions of meters)
Conservative 0.8 1.3 2 3.2 5.1 7.9
Aggressive 0.8 1.5 2.7 4.8 8.7 15.4
Note 1: It is estimated that the ratio of readers to tagged containers is in the region of 1:1400.
Note 2: It is estimated that the ratio of readers to tags is approximately 1:16800.
Note 3: Based on an assumed 50 receiver devices per system.
Note 4: Based on the number of receivers per system increasing from an average of 5 currently to 10 over the period.

863–870 MHz SRDs Ægis Systems Limited
6 2210/SRDMR/R/3
2 INTRODUCTION
This report details the results of a market research study undertaken by Aegis
Systems and Ovum Consulting for Ofcom, the topic of the market research being
the equipment, applications, manufacturers and users of the 863–870 MHz band.
2.1 Background
As a result of the switchover from analogue to digital television, an amount of radio
spectrum will be released for uses other than television. This release of spectrum is
widely known as the ―Digital Dividend‖.
There is a likelihood that the frequency band 790–862 MHz will be used for mobile
broadband services in line with plans being formulated in Europe. In order to
manage the radio spectrum effectively Ofcom needs to understand what the
implications of such use will be for Short Range Devices (SRDs) operating in the
frequency band just above the digital dividend spectrum (i.e. 863–870 MHz) in terms
of the potential for interference.
Ofcom therefore commissioned two pieces of work relating to the 863–870 MHz
frequency band; one looking at the market for SRDs (as reported on here) and the
other investigating SRD receiver characteristics followed by measurements of their
performance (reported on separately).
A further piece of work has been undertaken by other parties for Ofcom regarding
the implications for the frequency band sandwiched between the top of the digital
dividend spectrum and the bottom of the SRD frequency band, namely the 1 MHz
segment 862–863 MHz.
2.2 Scope of report
In order to better understand the current and future use of the 863–870 MHz SRD
band Ofcom requested that the market research should address:
the different services/applications/products that utilise this band
the manufacturers of devices used and the end users
the number of these different devices active in the UK
the likely demand from service providers/ manufacturers for this spectrum in
the future (including applications not yet using this spectrum but who might
choose to in the future).
In meeting this brief it is important to note the focus on the UK market and to
understand that, because the interference implications for SRDs are an important
consideration, the focus is on the number of receivers. For example, an alarm
system may have many sensors connected wirelessly to a hub or control panel. In
this instance there is only one receiver supporting many transmitting devices
(although there is a trend towards bidirectional communication to improve the
performance of such systems in which case the sensors become receivers as well).

Ægis Systems Limited 863–870 MHz SRDs
2210/SRDMR/R/3 7
It is the number of receivers that is of direct interest with the number of transmitting
devices only being of indirect interest.
In terms of structuring the forecasts we may initially be interested in other indirect
aspects (e.g. the number of RFID tags) which are quantified. These quantities can
then be related to receiver quantities.
An important caveat relating to this study concerns two factors that do not apply to
other types of radio spectrum usage:
a) use of the band is licence-exempt and therefore there is no record of the
numbers of users or number of devices operating in the band
b) some parts of the band (including underlay use) are designated for non-
specific SRDs. As the name of this designation implies, applications using
these parts of the band could be many and varied.
Because of these factors there is an inherent difficulty in guaranteeing to provide a
comprehensive view of use of the band. However, the authors believe that within
the resources and timescale available for the work a representative view has been
achieved as outlined in the remainder of this report.
Approach
In order to meet the main objective of the study, namely to estimate the market size
for Short Range Devices (SRDs) operating in the 863–870 MHz frequency band five
years ahead, we have undertaken three main tasks:
secondary research—an analysis of applications, systems and products
based on publicly available information
primary research—a programme of interviews with representatives from the
industry
analysis and forecasting—identification of application drivers/substitutes and
the forecast of future demand.
The results of these activities are detailed in this report.
Categorisation
As a starting point we analysed the products and services offered by current and
past members of the Low Power Radio Association (LPRA). We were also able to
identify a number of suppliers who are not members of the LPRA.
In order to provide market forecasts for different applications it was firstly necessary
to group them by type. We have done this with respect to the three distinct parts of
the frequency band as follows:

863–870 MHz SRDs Ægis Systems Limited
8 2210/SRDMR/R/3
Table 1: Applications by band
Low-band
(863–865 MHz)
Mid-band
(865–868 MHz)
High-band
(868–870 MHz) [1]
Wireless microphones Manufacturing and
distribution
Fire alarm systems
Wireless audio Individual item tagging Intruder alarm systems
Assistive listening
devices
Asset tracking Home/Office automation
Access control
Remote controllers
Medical
Social alarms/Telecare
Smart meters
Telemetry
Automotive
Note 1—This includes the non-specific underlay across the whole band 863–870 MHz.
Amongst the LPRA members and other companies having an interest in this band
that were investigated, other less application-specific categories were also identified
(e.g. manufacturers and distributors of modules / chips / components / antennas,
and design houses / test houses / consultancies). These categories were not
analysed in any great detail except in the case of RF module suppliers where it will
be seen that an effort was made to obtain information in support of the examination
of telemetry applications.
It can be noted that while we have used the separate categories identified in the
table above there is the very real possibility of convergence between different
applications. Currently, application development is fragmented even within very
large companies. However, it is not difficult to see that a number of applications
could be supported by a single system (requiring one receiver), for example,
intruder alarm, home automation, access control and smart metering. It is not
expected that this convergence will be significant in the timescale of the forecasts so
we have retained the categories identified above.
Interview programme
Representatives across the industry and covering all the categories identified above
were contacted and questioned on all aspects of the market for their devices and
systems. This was undertaken through a mix of telephone interviews,
questionnaires and face-to-face meetings. The remainder of this report is largely
based on comments from these representatives and because of the commercially

Ægis Systems Limited 863–870 MHz SRDs
2210/SRDMR/R/3 9
sensitive nature of some of the information it has not been attributed to individual
companies. Where a company is mentioned it is because the information has come
from a publicly available source.
2.3 Acknowledgments
During the course of the study that is the subject of this report we contacted a wide
range of companies to solicit information in support of our work. We acknowledge
with gratitude the help of representatives from those companies we received in this
work. We would usually name the companies and individuals involved as a sign of
our acknowledgement. However, we are unable to do so in this case as the nature
of some of the information provided was commercially confidential and identifying
individuals or companies would compromise the source. In spite of this the authors
of this report would like to reiterate their thanks to the individuals involved—they
know who they are.

863–870 MHz SRDs Ægis Systems Limited
10 2210/SRDMR/R/3
3 THE 863 –870 MHZ FREQUENCY BAND
The 863–870 MHz band has been identified by CEPT as a European harmonised
band for licence-exempt operation of a wide range of specific and non-specific short
range devices (SRDs). Various sub-bands have been defined for specific
applications and with differing technical parameters such as radiated power limits or
duty cycle. The various sub-bands and the corresponding technical parameters and
standards are defined in the annexes of ERC Recommendation 70-03 [1], which is
updated on a regular basis by the CEPT SRD Maintenance Group (SRD/MG).
The sub-bands and technical parameters contained in Recommendation 70-03 are
transposed into national regulations by CEPT Member States for licence exemption
purposes. In the UK various Statutory Instruments achieve this transposition and
the technical conditions of operation are embodied in Ofcom‘s Interface
Requirement IR2030—Licence exempt Short Range Devices [2]. These conditions
are summarised in Figure 1 below.
Figure 1: Overall band plan for 863–870 MHz
Generic SRDs 25 mW LBT/AFA or <0.1% DC
Microphones / Audio
10 mW 100%
NB
B
(Note: From many sources including [3] but modified to indicate the availability of the non-specific SRD
underlay across the whole frequency band.)

Ægis Systems Limited 863–870 MHz SRDs
2210/SRDMR/R/3 11
More detailed technical and operational parameters are defined in various ETSI and
CENELEC standards, depending on the type of device and application concerned.
The band is segmented into three main sub-bands, each of which reflects the
predominant applications that are associated with each sub-band. Note however
that the entire band can be used by non-specific short range devices subject to
compliance with the technical parameters defined in Annex 1 of Recommendation
70-03. The three main sub-bands are:
Low band (863–865 MHz): wireless audio devices, including speakers,
headphones, microphones and assisted listening devices.
Mid band (865–868 MHz): Radio Frequency Identification (RFID) devices.
High band (868–870 MHz): Wireless alarms, including intruder, fire and social
alarms and other non-specific applications.
Each of these sub-bands is further divided on the basis of transmit power and/or
duty cycle, to cater for particular requirements and to minimise the risk of harmful
interference arising between different types of SRD. Non-specific SRDs are
permitted anywhere in the 863–870 MHz band subject to a maximum effective
radiated power (ERP) of 25 mW and either a maximum duty cycle of 0.1% or
deployment of a ―listen before talk‖ transmission protocol. Different limits apply to
non-specific SRDs that operate within certain sub-bands defined in Annex 1 of
Recommendation 70-03. Similar interference mitigation techniques are specified for
wireless alarm systems operating in the high band. These conditions are
summarised in Figure 2 below.
Figure 2: Regulatory envelope for the band 868–870 MHz
PO
W E
R
[ E
RP
]
868.0 868.6 868.7 869.2 869.3 869.65 870 [MHz]
869.25 869.4 869.7
WIDE BAND 25 kHz WIDE BAND -25 kHz- 25 kHz 25 kHz WIDEBAND or
WIDEB.
Duty Cycle: <1% <0.1% <0.1 % <0.1% <10 % <10% up to100%
[mW]
500
100
10
100kHz
25 mW 10mW 25mW
5 mW
10mW
25mW
600 kHz 500 kHz 300 kHz
GENERAL SRD ALARM’s General-SRD Soc. AL. General-SRD AL. General-SRD
Alarms
500mW
Ac
cess P
roto
co
l
Existing use of the band 868-870 MHz (ERC REC 70-03)
100 250 kHz
(Note: From many sources including [4])

863–870 MHz SRDs Ægis Systems Limited
12 2210/SRDMR/R/3
The following chapters address each of the three sub-bands identified above. For
each application permitted in the relevant sub-band, the following information is
presented:
description of the application
users and motivation for use within this frequency band
alternative frequency bands and methods (e.g. wired)
research methodology and key findings (e.g. drivers)
methodology for the forecast
5-year forecast (for all applications where data is available).
As the underlay non-specific SRDs are subject to similar technical parameters to
wireless alarms and other systems operating in the high band, these categories are
addressed together in chapter 6.
Further detail on the assumptions behind the forecasts is contained in Annex C.

Ægis Systems Limited 863–870 MHz SRDs
2210/SRDMR/R/3 13
4 LOW-BAND
The 863–865 MHz portion of the 863–870 MHz band is used predominantly by
wireless microphones and wireless audio applications. While accounting for a
significantly smaller portion of the users in this band, assistive listening devices are
another interesting application. This section details each of these applications and
provides forecasts for future use of both wireless microphones and assistive
listening devices in the 863–865 MHz band.
4.1 Wireless microphones
Wireless microphones have an extremely diverse user base and serve both the
consumer and professional markets. Typical users on the consumer side include
churches, schools, boardrooms and pubs while examples of more professional
users are professional musicians and bands, west-end theatres and sports
presenters.
While many wireless microphones purchased for consumer use do operate in the
863 – 865 MHz band, almost all the wireless microphones used by professionals
elect to operate either exclusively in a lower frequency band (such as channel 69, or
even down to channel 21) or, if the professional user requires a large number of
channels, predominantly in lower channels with only minimal use in the 863–
865 MHz band. Professional use of these lower frequency channels is subject to
licensing and co-ordination by the programme making and special events industry
body JFMG. The primary reason that professional users avoid the licence-exempt
863–865 MHz band relates to interference; professional users regard the band as
overcrowded and they cannot afford the possibility of experiencing interference
between their microphones and other devices. Consumer microphones designed to
operate in the 863 – 865 MHz band cannot be re-tuned to lower frequencies.
The last few years have seen demand for wireless microphones steadily increasing,
with users shunning the more restrictive wired counterparts; the need to move
around while talking or singing clearly advocates the need for a wireless method
through which voice can be amplified.1 In some instances, the wireless microphone
is the only product required by the consumer; in other instances, the wireless
microphone might be an integrated part of a larger audio system.
In order to forecast the number of wireless microphones in the UK, we estimate the
number of these microphones currently in use in the 863–865 MHz band. We
achieve this as follows (further detail can be found in Annex C.1.1):
1 We note, however, that one vendor we interviewed highlighted the fact that their sales of wireless
microphones have decreased by approximately 30% over the last year, predominantly due to increased
uncertainty regarding the usability of different frequency bands.

863–870 MHz SRDs Ægis Systems Limited
14 2210/SRDMR/R/3
1. We estimate the number of wireless microphones sold in the UK over the last
year. This estimate is produced based on inputs from a number of
interviews.
2. We use the number of microphones sold in a year to estimate the number of
wireless microphones currently in use. Once again, this estimate is
obtained through interview responses, all of which independently
corroborate the estimate.
3. We estimate the number of wireless microphones operating in the 863–
865 MHz band by considering that most consumer microphones operate
either in this band or in the VHF band (used mostly for low cost equipment)
and that most professional users avoid this band.
Having determined the current use of wireless microphones, we present a simple
forecast for the future use of wireless microphones operating in the 863-865 MHz
band by applying a market growth rate of 5% for future demand as well as
conservative and aggressive estimates for future penetration in the 863-865 MHz
band.2
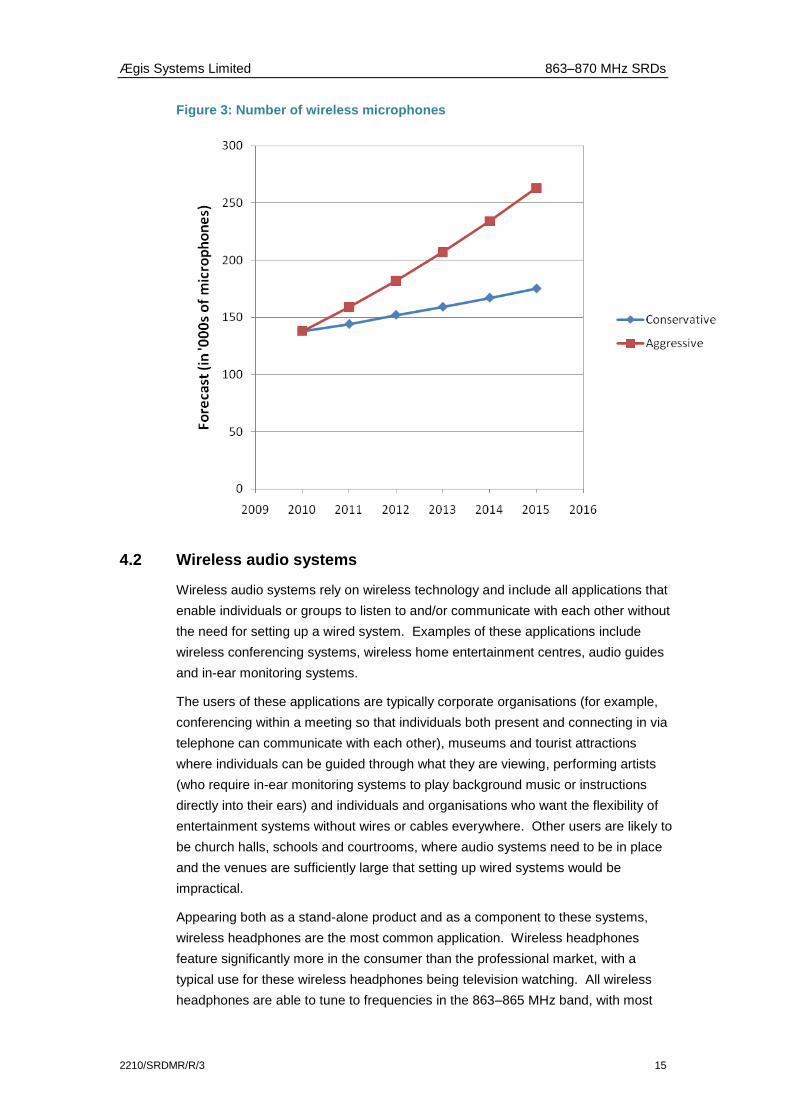
Table 2 and Figure 3 provide the forecast number of wireless microphones over a 5-
year period.
Table 2: Number of wireless microphones
Forecast (in '000s of microphones)
2010 2011 2012 2013 2014 2015
Conservative 138 144 152 159 167 175
Aggressive 138 159 182 207 234 263
As there is a one-to-one relationship between the number of wireless microphones
used and the number of receivers required, the above forecast applies to receivers
as well as to the actual wireless microphones3.
2 The growth rate of 5% is obtained by combining existing research [5] with responses gained from
interviews with a number of key manufacturers in the industry.
3 Although several microphones may connect to a single receiver unit, the latter will include a separate
receiver module for each microphone as each requires its own individual radio channel.
Ægis Systems Limited 863–870 MHz SRDs
2210/SRDMR/R/3 15
Figure 3: Number of wireless microphones
4.2 Wireless audio systems
Wireless audio systems rely on wireless technology and include all applications that
enable individuals or groups to listen to and/or communicate with each other without
the need for setting up a wired system. Examples of these applications include
wireless conferencing systems, wireless home entertainment centres, audio guides
and in-ear monitoring systems.
The users of these applications are typically corporate organisations (for example,
conferencing within a meeting so that individuals both present and connecting in via
telephone can communicate with each other), museums and tourist attractions
where individuals can be guided through what they are viewing, performing artists
(who require in-ear monitoring systems to play background music or instructions
directly into their ears) and individuals and organisations who want the flexibility of
entertainment systems without wires or cables everywhere. Other users are likely to
be church halls, schools and courtrooms, where audio systems need to be in place
and the venues are sufficiently large that setting up wired systems would be
impractical.
Appearing both as a stand-alone product and as a component to these systems,
wireless headphones are the most common application. Wireless headphones
feature significantly more in the consumer than the professional market, with a
typical use for these wireless headphones being television watching. All wireless
headphones are able to tune to frequencies in the 863–865 MHz band, with most
863–870 MHz SRDs Ægis Systems Limited
16 2210/SRDMR/R/3
headphones operating either in this frequency band or in the 2.4 GHz band. While
the 863–865 MHz band has the advantage that the consumer need not purchase a
licence, a concern mentioned by one interview respondent indicated that a number
of users find that headphones operating in this frequency are vulnerable to
interference.
An interview with a vendor in the wireless audio industry revealed that the number of
wireless headphones sold is significantly higher than the number of wireless
microphones sold in a given year. However, interview responses, and indeed
additional research, have not yielded the quantitative data required for the
construction of a forecast.
4.3 Assistive listening devices
Assistive listening devices (ALDs) enable individuals who are hard of hearing or
partially deaf to hear an audio transmission (speech, music, etc). Some of the
devices work alongside traditional hearing aids while many others are stand-alone
products. ALDs differ from traditional hearing aids as ALDs are intended to amplify
specific sound sources while hearing aids aim at amplifying all ambient sounds. In
this section we focus specifically on ALDs rather than traditional hearing aids as
research showed the latter do not generally use the 863–865 MHz band.
ALDs work by taking the signal the individual is interested in hearing and amplifying
it relative to surrounding sounds—this is achieved by placing a microphone near the
sound source. While wired versions of these devices exist, wireless alternatives are
desirable due to the improved flexibility and mobility they afford.
ALDs are used by both groups and individuals. Devices aimed at group use
broadcast the sound to more than one person; examples include induction loop,
infrared and frequency modulation (FM) systems. Devices designed for personal
use are generally configured to work with a single speaker; examples include
wireless personal FM systems and wireless headphones.
In general, these devices operate in the following frequency bands:
173.965–174.015 MHz
169.4–169.475 MHz
169.4875–169.5875 MHz
169.4–174 MHz – Limited implementation only of this European band in the
UK. 173.325 to 175.075 MHz at 2 mW power limitation.
863–865 MHz
Devices cannot generally switch between the UHF and VHF bands.
The frequency band employed depends on the specific application. Typically, the
ALDs that operate at UHF frequencies are those that are body worn medical
devices (placed in and around an individual‘s ear, or around the neck). Discussion
with one market participant indicated that there has been an attempt to put these

Ægis Systems Limited 863–870 MHz SRDs
2210/SRDMR/R/3 17
devices in the medical implant band (401–406 MHz) but there has been little support
for this in the relevant standardisation bodies; there is now increased interest in the
863–965 MHz band. Alternative frequencies, from very low bands up to the 169–
217 MHz band, are also occasionally employed.
One of the key uses for ALDs is to provide enhanced audio reception when
watching television. These assistive systems generally operate using infrared or
radio frequency (RF), some of which use the 863–865 MHz band. Infrared systems
are generally more expensive than RF systems, and they require the receivers to be
in direct line of sight of the device but they do have the advantage, from an
interference point of view, that signals do not go through walls. RF systems, on the
other hand, are cheaper initially but the signals are able to go through walls, raising
interference as a concern.
In order to provide a forecast for the number of ALDs in the 863–865 MHz band, we
begin by determining the number of ALDs currently operating in this band. We
calculate this figure as follows (further detail can be found in Annex C.1.2):
1. We identify the number of individuals with hearing impairments in the UK, the
number of individuals who would benefit from hearing assistance and the
number of individuals prescribed with a hearing aid. We obtain these
estimates using established research in the UK [6] [7].
2. We then conduct market research to estimate the current penetration of ALDs
and the percentage of these devices currently operating in the 863–
865 MHz band.
Having identified this starting point, we generate a forecast for the future use of
ALDs in this frequency band. We achieve this by estimating the level of penetration
of ALDs in the 863–865 MHz band when the market is saturated4, using an estimate
for growth in the number of ALDs and an estimate for the proportion of ALDs that
will operate in this frequency band.
The growth rates we employ are estimated using a combination of interview
responses and research. As there is a considerable degree of uncertainty
predicting these growth rates, we consider growth on two levels, one that represents
aggressive estimates of growth and another which is more conservative.
We conclude our forecast by plotting Gompertz curves (see Annex C.4) for the
estimates of aggressive and conservative growth, using the estimates of current and
saturated market sizes as inputs.
Table 3 and Figure 4 provide the forecast number of ALDs operating in the 863–
865 MHz band.
4 We refer to market saturation as the situation in the future when the number of devices in use in the
market equals the maximum potential demand for those devices. That is, after saturation, growth in
usage of the device is expected to be matginal.

863–870 MHz SRDs Ægis Systems Limited
18 2210/SRDMR/R/3
Table 3: Number of ALDs
Forecast (in '000s of ALDs)
2010 2011 2012 2013 2014 2015
Conservative 176 186 197 209 222 235
Aggressive 176 197 220 246 274 305
As the ALDs that operate in this band typically require one receiver for every device,
the forecast above applies to receivers as well as to the ALDs themselves.
Figure 4: Number of ALDs
0
50
100
150
200
250
300
350
2010 2011 2012 2013 2014 2015
Fore
cast
(in
'00
0s
of
ALD
s)
Conservative
Aggressive

Ægis Systems Limited 863–870 MHz SRDs
2210/SRDMR/R/3 19
5 MID-BAND
This part of the 863–870 MHz band is used predominantly by Radio Frequency
Identification Devices (RFIDs) which consist of a combination of readers and either
active or passive tags. Typically, RFID technology can be employed as part of
innovative applications or as a replacement technology, either for other older
wireless technologies or for barcodes. RFIDs operate in many different frequency
bands; for the purposes of this report, however, we focus exclusively on UHF RFIDs
that operate in the 865–868 MHz band.
One of the prominent areas in which RFIDs are used is transport and logistics.
Here, RFIDs are employed to track and locate shipping containers, track air freight,
track vehicles within a fleet or within a large warehouse and assist with yard
management. The ability to track items in this manner ensures that progress in
transport can be monitored, theft or misplacement of items can be identified and
rectified and any logistical concerns can be dealt with in a timely manner. Similar
benefits can be seen in the automotive industry where RFID technology is used both
for tracking finished items in the supply chain and for tracking individual parts in the
manufacturing process.
In general, RFIDs are used to locate and track items, whether these are individual
items such as clothes, containers used for transporting items in the supply chain or
high value items that require swift location. These general applications for RFIDs
can be divided into three categories: manufacturing and distribution, individual item
tagging and asset tracking. In this section, we focus specifically on these three
categories and detail the applications of particular interest.
5.1 Manufacturing and distribution
Discussions with UK manufacturers of RFID tags and readers have identified
manufacturing and distribution as a mature area for RFID deployment. In instances
in which this technology has been adopted, organisations have benefitted from
improved efficiency in the supply chain and a reduction in human error that is often
associated with distribution. Furthermore, the ability to track items throughout the
distribution process ensures detailed information, for example the current status of a
delivery, is instantly available.
Information provided by one vendor indicated that the supply chain is the main
platform for RFIDs, with this platform accounting for approximately 30% of overall
volumes. In this section we employ the supply chain as a proxy for RFID use in
manufacturing and distribution, specifically investigating the method through which
manufacturers supply retail outlets with a final product.
The most common way for manufacturers to distribute products to retailers is via
returnable containers. These containers, or pallets, leave the manufacturer,
transport the individual product items to the retailer, and then return to the
manufacturer to be reloaded with items for another delivery; in other words, they

863–870 MHz SRDs Ægis Systems Limited
20 2210/SRDMR/R/3
operate in a closed loop. The use of RFID has been introduced into this process in
order to track the returnable containers, thereby ensuring the containers can always
be located and the distribution of the items for delivery can be as efficient as
possible.
One retailer to implement RFID effectively in this way is Marks and Spencer (M&S).
M&S first tagged returnable containers in 2002, with an initial pilot scheme that
employed these containers for 42 stores. In 2005 the Marks and Spencer Food
Supply Chain Project comprised 4.5 million returnable containers. Now, M&S
successfully use a significant number of tagged containers in their UK distribution.5
Typically these containers are tracked using passive RFID technology. The use of
active RFID for container tracking is too expensive, the cost being driven by features
such as real-time tracking which is not required for the supply chain. Passive tags
are preferred as they are relatively inexpensive and highly reliable; these tags
operate well in both HF and UHF bands.
Most of the containers use generation 2 UHF.6 The readers for these containers are
based at the suppliers‘ premises, the retailers‘ warehouses and at the final retail
locations. While current penetration of RFID technology in the supply chain is low, it
is expected that new solutions are likely to use UHF due to benefits of physical
interaction between the tags and readers within a warehouse. However, one vendor
that we interviewed indicated that there are concerns that the 865–868 MHz band
might be too restrictive; the power of this band is appropriate but a large warehouse
may need to use more than four channels.
In order to quantify the use of RFID tags in closed loop applications7 in the
Distribution and Manufacturing sectors, we use the grocery retail industry as a proxy
for the distribution sector and the automotive industry as a proxy for the
manufacturing sector.
The first stage in the forecasting process is to identify the number of returnable
containers currently operating in the 865–868 MHz band (see Annex C2.1 for further
detail on the forecast).
1. We estimate the current number of returnable containers in each of the
grocery retail and automotive industries. These estimates are produced
based on inputs from interviews and research [9] [10] and are calculated by
extrapolating figures available for Tesco and Honda, respectively.
5 Updated information regarding the number of M&S returnable containers in operation was provided
during an interview with an industry vendor
6 Generation 2 contains a number of features that solidify the adoption of RFID in the UHF band [8].
7 Use of RFID tags in closed loop applications in the Distribution and Manufacturing sectors refers to the
tagging of returnable pallets, metal cages and containers. For simplicity we will refer to these different
elements as ‗returnable containers‘.
Ægis Systems Limited 863–870 MHz SRDs
2210/SRDMR/R/3 21
2. We estimate the percentage of these returnable containers that currently
have RFID tags and the percentage of these tags that operate in the 865–
868 MHz band. These estimates are produced based on inputs from the
interviews with RFID vendors, available data on publications [11], and
expert opinion from Datamonitor/Ovum analysts.
To construct this forecast, we use grocery as a proxy for the distribution sector and
automotive as a proxy for the manufacturing sector. Using an assumption for the
contribution of grocery retail and automotive in relation to the use of RFID overall in
the distribution and manufacturing sectors in the UK, we determine the estimate for
the current number of returnable containers used in manufacturing and distribution
that have RFID tags operating in the 865–868 MHz band. Our assumptions are
informed by conversations with RFID device manufacturers and calibration with
existing forecasts at European level.
The next step of the forecast focuses on estimates of the growth rate and the level
of penetration when the market is saturated8.
The level of penetration when the market is saturated is calculated with reference to
an estimation of growth in the number of returnable containers and the expected
contribution of grocery retail and automotive to the use of RFID in the 865–868 MHz
band in the distribution and manufacturing sectors at the time of saturation.
The recent and expected growth rates are estimated using inputs from interviews
and are cross-checked with information of growth rates from existing forecasts for
Europe. As there is a considerable level of uncertainty predicting future growth
behaviour, we consider two levels of growth rate, one that represents aggressive
estimates of growth and another which is more conservative.
We conclude our forecast by plotting Gompertz curves (see Annex C.4) for the
estimates of aggressive and conservative growth, using the estimates of current and
saturated market sizes as inputs.
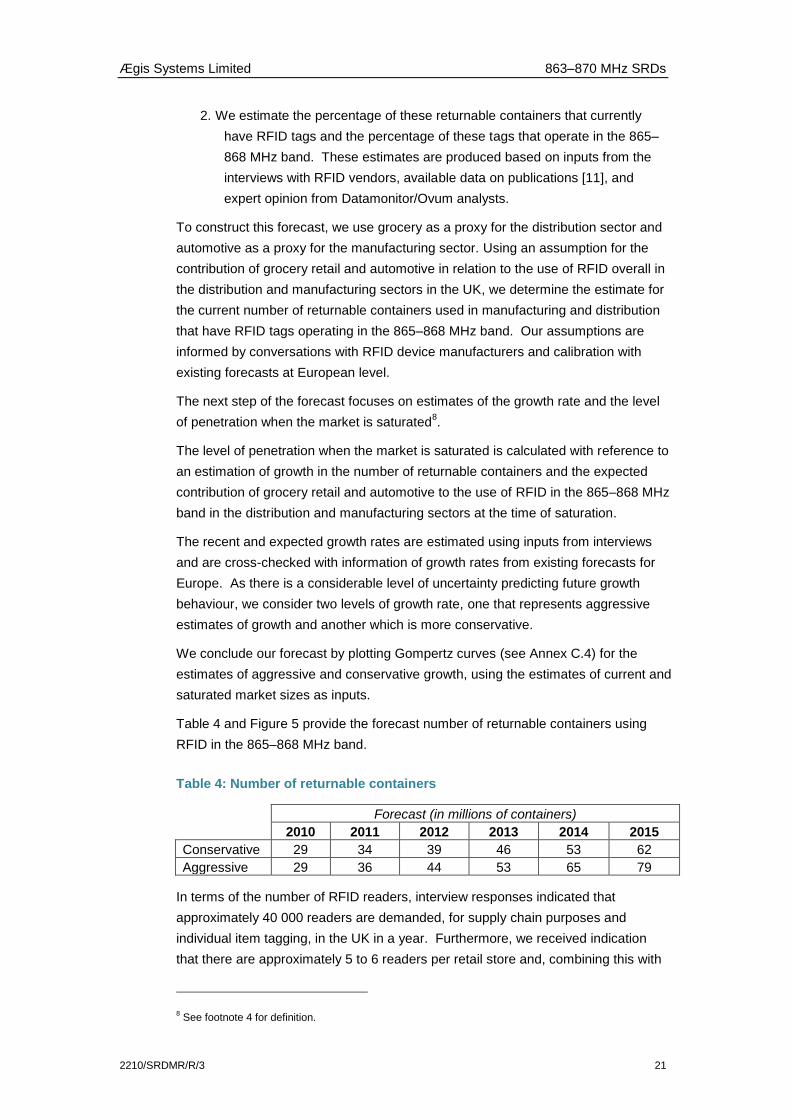
Table 4 and Figure 5 provide the forecast number of returnable containers using
RFID in the 865–868 MHz band.
Table 4: Number of returnable containers
Forecast (in millions of containers)
2010 2011 2012 2013 2014 2015
Conservative 29 34 39 46 53 62
Aggressive 29 36 44 53 65 79
In terms of the number of RFID readers, interview responses indicated that
approximately 40 000 readers are demanded, for supply chain purposes and
individual item tagging, in the UK in a year. Furthermore, we received indication
that there are approximately 5 to 6 readers per retail store and, combining this with
8 See footnote 4 for definition.

863–870 MHz SRDs Ægis Systems Limited
22 2210/SRDMR/R/3
information on the number of stores likely to use RFID in individual item tagging, this
suggests there are approximately 20 000 readers used in manufacturing and
distribution and approximately 20 000 readers employed for individual item tagging.
This indicates that the ratio of readers to tagged containers is in the region of
1:1400. We expect the number of readers to grow at a similar rate to, or slightly
faster than, the number of tagged containers; however, we do not expect the high
densities seen by barcode readers, primarily due to the characteristics (such as
signal range) of RFID technology.
Figure 5: Number of returnable containers
5.2 Individual item tagging
Another key application of RFIDs in the 865–868 MHz band is the tracking of
individual items. These items can range from clothes in a retail outlet, such as
M&S, to individual parts used in a manufacturing process, such as automobile
assembly.
One vendor we interviewed identified individual item tagging as one of the biggest
potential growth areas for RFIDs. Attaching RFID tags to individual items, and thus
enabling tracking of the items, has been shown to improve efficiency in stock control
and ensures that any item can be reliably identified and quickly located. This has
some obvious benefits; for example, for a retailer who is concerned about managing
stock efficiently and tracking items to reduce theft from stores.

Ægis Systems Limited 863–870 MHz SRDs
2210/SRDMR/R/3 23
The automotive industry provides another example where these RFID tags are
used. In this industry, RFIDs are employed largely for safety concerns with tags
being included on airbags, on ABS systems and embedded within tyres. Not only
do these tags have the advantage of being placed in areas where it is not viable to
scan a barcode, they also ensure that individual parts can be identified, located and
recalled if, for example, a fault is detected at some future date.
As mentioned, one alternative technology that might be employed is barcodes.
However, the fact that the distance between the scanner and the barcode needs to
be very small means that this technology is not practical in many instances.
Further, the fact that barcodes need to be scanned manually means that the number
of items that can be processed within a given time frame is severely limited; for
example, an RFID reader can scan 250 tags a second while a person scanning a
barcode is only likely to scan 1 barcode a second.
These facts support the industry‘s opinion that implementation of RFID technology
for individual items is likely to grow significantly in the future. One consideration,
however, is that because the number of tags that can be read is limited by the
bandwidth, the 3 MHz available in the 865–868 MHz band may be insufficient to
deal with future volumes of individual item tags.
In terms of selecting a frequency for operation, the RFID handheld readers
employed are manufactured to work with different frequency ranges; the change
from one frequency to another frequency is done via software. However, within
Europe the 865–868 MHz band is the only frequency band available with sufficiently
high power for use with these readers.
In order to quantify the number of RFID tags employed in individual item tagging, we
focus specifically on the garment retail industry, using this industry as a proxy for the
use of individual item tagging more generally. We begin the forecast by estimating
the number of tags that are currently attached to individual items and that operate in
the 865–868 MHz band. We achieve this as follows (further detail can be found in
Annex C.2.2):
1. We estimate the potential number of tags used in the retail garment industry.
We do this by extrapolating figures for a garment retailer, relating to both
the total number of tags used and the number of tags per store. These
figures were obtained from an interview with a vendor in relation to an
unnamed garment retailer.9
2. We then estimate the likely number of stores that use tags to identify
individual items as well as the percentage of these tags that operate in the
865–868 MHz band. These estimates are obtained by combining research
and interview responses and are compared with existing forecasts.
9 Because of strong consumer reaction due to privacy concerns, individual item tagging in the retail space
is treated with a high degree of confidentiality.

863–870 MHz SRDs Ægis Systems Limited
24 2210/SRDMR/R/3
Having attained an estimate for the number of tags currently employed using the
865–868 MHz band; we generate a forecast for the future use of these tags. We
achieve this as follows:
1. We estimate the level of penetration of RFID tags, as well as the penetration
of RFID tags in the 865–868 band, when the market is saturated10
. We
obtain the estimates of penetration by studying current growth trends; these
trends have been identified by vendors in the interviews and by examining
existing forecasts.
2. We estimate the growth rates for these tags. This is achieved by using inputs
from interviews and cross-checking the estimates with information of growth
rates from existing forecasts for Europe. As there is a considerable level of
uncertainty predicting future growth behaviour, we consider two levels of
growth rate, one that represents aggressive estimates of growth and
another which is more conservative.
We conclude our forecast by plotting Gompertz curves (see Annex C.4) for the
estimates of aggressive and conservative growth, using the estimates of current and
saturated market sizes as inputs.
Table 5 provides the forecast number of individual item tags using RFID in the 865–
868 MHz band.
Table 5: Number of RFID tags
Forecast (in millions of tags)
2010 2011 2012 2013 2014 2015
Conservative 336 390 452 524 606 699
Aggressive 336 410 499 606 732 875
As detailed in the preceding section, interview responses enabled us to conclude
that there are around 20 000 readers employed in the UK for individual item tagging.
This represents a ratio of readers to tags of approximately 1:16800. As before, we
predict that the number of these readers will grow in line with, or slightly faster than,
the number of tags.
10 See footnote 4 for definition.

Ægis Systems Limited 863–870 MHz SRDs
2210/SRDMR/R/3 25
Figure 6: Number of RFID tags
5.3 Asset tracking
A further area in which RFID technology has been adopted is asset tracking. Here,
RFID tags are placed on individual assets, typically high-value items, and ensure
these items can be traced and located. This use of RFID is especially prominent in
relation to IT equipment tracking; for example, Wells Fargo in the US place a UHF
chip in each piece of equipment.
Some general examples of assets that are tracked using RFID technology include
equipment in a hospital, legal and medical records and airline baggage. Another
use for asset tracking is illustrated in the beer industry where approximately 200,000
beer barrels in the UK are tagged; this represents 10% of all barrels and one vendor
we spoke to estimates this will grow by 10-15% every year.11
A further example is
provided by the Home Office who employ active tags, in approximately 70 sites, to
monitor the movements and location of prisoners.
One sector that provides a more in-depth example is the health sector. In this
sector, four key uses of RFID have been identified as patient wristbands (active
11 While one might view beer barrels as returnable containers, these barrels differ from typical returnable
containers as they are used specifically by a particular supplier to transport beer from the brewery to the
distributers and then track the barrels back to that particular supplier. The primary use of the RFID tags is
thus to enable a supplier to track his assets (the beer and the barrels). In contrast, returnable containers
are used more generically for transporting different goods between various parts of the supply chain.

863–870 MHz SRDs Ægis Systems Limited
26 2210/SRDMR/R/3
RFID tags to enable real time location), proximity warning devices (to monitor
patients who might wander off), labels on blood bags (passive labels to track the
bags) and labels on medical documents (passive labels to track the documents).
These devices, therefore, ensure that people can always be located, especially
important for individuals such as dementia patients and babies, and that the vital
assets within a hospital can be located.
As mentioned previously, barcodes are an alternative to the RFID tags and are used
more widely than RFID in the health sector. The primary reason for this is cost;
RFID remains significantly more expensive than competing technologies.12
However, for tasks in which it is desirable to reduce manual intervention or where it
is necessary to increase the speed and efficiency with which assets can be located,
RFID technology is favoured.
As the benefits of RFIDs are realised, and the costs are likely to decrease, the
expectation is that more and more sectors will adopt this technology. Indeed, the
challenge of competing technologies to certain RFID tags is very limited. For
example, an interview with one vendor highlighted that there are some extra long
range tags that are employed, for example in the health sector, for which there are
no real alternative technologies.
RFID tags employed in asset tracking typically operate in the 865–868 MHz band,
although other bands are also available. While some concerns regarding
interference have been raised, particularly in relation to the health sector, an
interview with practitioners within this sector indicated that no problems with
interference had been experienced within the 865–868 MHz band.
Finally, one vendor indicated two potential future applications for RFID use in asset
tracking. The first application is in the pharmaceutical industry where it is especially
important to check the authenticity of medication and ensure the drugs that reach
the end user remain tamper proof. The second application is in the supply chain
where interest is growing for RFIDs with temperature sensors.
Unfortunately neither interviews held nor additional research conducted has
provided any of the relevant data necessary for the construction of a forecast.
12 The relative costs of RFID tags differ significantly depending on factors such as the volume of tags
purchased, the memory required and the packaging of each tag. However, in general, barcodes cost
approximately 0.5 cents (US) while passive RFID tags cost between 7 and 30 cents (US).
Ægis Systems Limited 863–870 MHz SRDs
2210/SRDMR/R/3 27
6 HIGH-BAND AND UNDERLAY
The high band (868–870 MHz) is primarily used by wireless alarm systems,
including fire, intruder and social alarms which are each subject to different
operational and technical requirements. The band is subdivided further into a
number of sub-bands, based primarily on technical characteristics such as power
and duty cycle. Parts of the band are specifically identified for alarm systems,
although alarms may also operate in the part of the band identified for non-specific
devices. One of the alarm sub-bands is identified specifically for social alarms.
It should be noted that fire and intruder alarm systems are generally installed as
separate, independent systems as they have to conform to different operational
standards. The only exception to this tends to be in the residential sector where
wireless smoke detectors can be provided as add-ons to intruder alarm systems.
Hence we have treated fire and intruder alarms as separate market sectors.
Underlay systems may utilise the whole 863–870 MHz band, with the exception of
the high band sub-bands identified for alarm systems, and typically deploy spread
spectrum or other wideband RF technologies. Applications are non-specific and
may include any of the applications associated specifically with the low, mid and
high bands.
6.1 Fire alarm systems
Wireless fire alarm systems are widely deployed in commercial and industrial
premises such as hotels, factories, offices and shops. Wireless technology is most
often deployed in older buildings where installation of wired systems would cause
disruption, disfigure historic or listed buildings or lead to excessive installation costs.
In new buildings wired systems are generally preferred as they are perceived to be
more reliable; however, wireless components are sometimes used to extend
existing wired installations (these are referred to as hybrid installations) and,
according to industry sources, there is a long term trend towards adoption of
wireless systems.
Fire alarms may include a large number of individual components, for example one
UK manufactured system can accommodate up to 2,048 connected devices13
.
Although the 868 MHz frequency band is increasingly being deployed, there is still
extensive use of lower frequencies, notably the 458 MHz and 173 MHz bands where
higher transmit powers and correspondingly higher range is available. However,
one large UK based supplier of wireless fire alarm systems claimed that pending EU
legislation mandating the replacement of former national technical standards by the
harmonised European standard for wireless fire alarms (EN 54 Part 25 [12]) would
prevent it from installing new systems operating in these lower frequency bands, as
13 Firecell, manufactured by EMS Group.

863–870 MHz SRDs Ægis Systems Limited
28 2210/SRDMR/R/3
these are based on legacy national standards and not fully compliant with the EN54
standard. As a result this supplier will only be supplying 868 MHz equipment once
this legislation is enacted in April 2011 Performance and functionality improvements
arising from the adoption of this standard (such as mandatory bidirectional
communication between wireless devices) is likely to increase attractiveness of
wireless systems in the future.
In order to detail the current and expected number of non-residential fire alarms in
use in the UK, we begin by determining the number of fire alarm devices currently in
use in the 868–870 MHz band. We derive this number as follows (further detail can
be found in Annex C.3.1):
1. We calculate the number of commercial and industrial properties in the UK,
including properties relating to hospitals and schools. The figures for this
calculation are obtained from public information provided on various
government and community interest websites [14] [15] [16].
2. We estimate the average number of fire alarm devices likely to operate within
each of these properties. This estimate is based on interview responses
from a number of fire alarm manufacturers and information from vendors‘
web sites.
3. We then estimate the percentage of these properties that have installed fire
alarms, the percentage of fire alarms that are wireless and the penetration
of wireless alarms operating in the 868–870 MHz band. These estimates
are reached based on regulation relating to fire alarm installation in the UK
and responses from interviews held with various industry participants.
Having estimated the number of wireless fire alarm devices currently operating in
the 868–870 MHz band, we focus on obtaining a forecast based on estimates of
growth rate and the level of penetration when the market is saturated14
.
The level of penetration when the market is saturated is calculated with reference to
an estimation of growth in the number of wireless fire alarms, and the number of
these operating in the 868–870 MHz band. These estimates are based on interview
responses and pending European legislation mandating the use of the EN 54-25
standard for wireless fire alarm systems which will effectively require new systems
installed after March 2011 to operate in the 868–870 MHz band.
As there is a considerable degree of uncertainty surrounding the growth rate
predictions, we consider growth on two levels, one that represents aggressive
estimates of growth and another which is more conservative.
We conclude our forecast by plotting Gompertz curves (see Annex C.4) for the
estimates of aggressive and conservative growth, using the estimates of current and
saturated market sizes as inputs.
14 See footnote 4 for definition.

Ægis Systems Limited 863–870 MHz SRDs
2210/SRDMR/R/3 29
There is a wide variation in the size and complexity of fire alarm systems, depending
on the nature of the premises being protected, Taking account of typical system
dimensions and assuming each wireless alarm component includes a receiver (for
bidirectional communication) we estimate that on average there will be
approximately 40–60 receivers per system. This estimate is based on a multi-zone
system comprising 6 zones each of which contains 6 to 10 devices.
Table 6 and Figure 7 provide the forecast number of wireless fire alarm receiver
devices operating in the 868–870 MHz band, based on an assumed 50 receiver
devices per system.
Table 6: Number of fire alarm receiver devices
Forecast (in millions of devices)
2010 2011 2012 2013 2014 2015
Conservative 10.2 12.7 15.9 19.8 24.7 30.7
Aggressive 10.2 13.4 17.6 23 30 39.1
Figure 7: Number of fire alarm receiver devices

863–870 MHz SRDs Ægis Systems Limited
30 2210/SRDMR/R/3
6.2 Intruder alarm systems
In contrast to the fire alarm market, wireless intruder alarms are most widely
deployed in the residential sector; commercial and industrial users still tend to prefer
wired systems as these are perceived to be more reliable and less limited in terms
of range. According to one vendor, the residential market for wireless alarms is
approximately ten times the size of the industrial market in volume terms.
The number or receivers per intruder alarm system depends on the type (residential
or commercial) and the technology. Current low-cost residential systems use
unidirectional transmission from the various sensors to the control panel so a
receiver is only present in the control panel and the siren, i.e. two per system.
There is however a trend towards bidirectional communication where each wireless
element has a receiver (this enhances system reliability) and this would push the
number of receivers in a typical residential environment up to typically 10–12 per
system, though the number could be higher if additional home automation
functionality were to be included. Commercial wireless systems are also likely to
use bidirectional communication and depending on the size of building may have
potentially hundreds of receivers, though probably 20–30 would be a more
appropriate assumption for the ―average‖ system.
Historically, most domestic alarm systems in the UK used the 433 MHz band on
cost grounds but this has become increasingly prone to interference from other
wireless devices such as baby monitors. One vendor reported that whereas up to
30% of systems at 433 MHz could suffer interference there had been no reported
cases to date at 868 MHz. There has therefore been a marked migration to
868 MHz in recent years and virtually all new products now operate in this band.
The small physical size of many of the wireless sensors and devices used in the
home also tends to favour the use of the higher frequency. Although 2.4 GHz has
been used by at least one supplier, this band requires higher power to achieve the
same range with adverse implications for battery life.
According to one vendor, the current penetration of alarm systems (wired and
wireless) in the UK residential market is 12–14 %. This is relatively low by
European standards but there are signs that the UK is catching up, driven by
perceptions of increased criminal activity. According to this vendor, in 5 years the
penetration is expected to grow to 18-20%. The market share of wireless systems
(according to the same vendor) has grown significantly from 5-10% five years ago to
approximately 25% today. The main drivers of wireless systems are ease of
installation and the ability to add on extra features like home automation.
Another vendor estimated that approximately 35% of the overall intruder alarm
market is wireless, but the proportion may be as high as 60% or more in the DIY
market (we have been unable to obtain any firm data for the latter, however).
Alongside the growth in new systems there is also a thriving market in upgrades—
residential alarm systems are upgraded typically every 5–10 years and larger

Ægis Systems Limited 863–870 MHz SRDs
2210/SRDMR/R/3 31
companies often provide additional features (such as home automation) as an
incentive for users to upgrade.
The take up of wireless alarms in the UK has historically differed from the rest of
Europe in that it was driven initially by low cost far eastern products aimed at the
retail / DIY market, whereas in Europe there was a much stronger interest in
professional wireless systems. The UK now appears to be catching up with Europe
in this area.
Some equipment vendors are developing increasingly elaborate systems including
various home automation functions and providing connections to PSTN or mobile
data networks. These allow alarms and other domestic functions to be controlled
remotely and could in future be extended to include functionality like remote meter
reading. Intel has been working on a similar concept in the US referred to as ―home
dashboard‖, which creates a home area network (HAN) to connect smart devices to
a central control unit using ZigBee wireless technology.
One recent technical innovation that may increase the attractiveness of wireless
intruder alarms in non-residential sectors is the use of mesh wireless techniques,
which allow bi-directional communication between each element in the system,
diverse routing between wireless nodes and improved coverage and reliability
compared with conventional wireless systems. For example, coverage of an
existing system with a central controller serving a network of sensors in a
conventional ―star‖ configuration could be affected by the opening and closing of
metal doors or changes to the building infrastructure (e.g. new partitions), whereas a
mesh based system would simply re-route the wireless signal via a different set of
mesh nodes.
One vendor that currently installs tens of thousands of (mainly wired) alarm systems
in the UK has recently introduced a wireless mesh system and expects that in the
longer term all of their products could become wireless. This supplier estimated that
wireless accounted for 5-10 % of the UK intruder alarm market 10 years ago, has
now grown to 30% and could reach 100% in a further 10 years.
In generating a forecast for intruder alarms, we exclude the DIY market, due to lack
of data, and focus on the professional residential and commercial markets. Current
vendors focus more on the residential markets although recognise that demand for
wireless alarms in the commercial sector will increase over the next few years. In
order to determine the future market for intruder alarms, we begin by calculating the
number of these alarms that are wireless and currently operate in the 868–870 MHz
band. We reach this calculation through the following process (further detail can be
found in Annex C.3.2):
1. We determine the number of residential households and commercial
premises currently in the UK. These figures are provided by the Office of
National Statistics and various government and community websites.

863–870 MHz SRDs Ægis Systems Limited
32 2210/SRDMR/R/3
2. We estimate the penetration of intruder alarms in the residential market and
in the commercial market. These estimates are guided by responses from
interviews with market participants.
3. We estimate the percentage of intruder alarms that operate wirelessly in both
the residential and commercial markets. As above, these estimates are
based on a number of interview responses.
4. As the majority of new intruder alarms operate in the 868–870 MHz band, we
assume that penetration in this band is 100%.
The next step in the forecast focuses on estimates of growth rate and the level of
penetration when the market is saturated15
.
1. The level of penetration is calculated using estimates from interview
responses. These responses detail expected penetration of intruder alarms
in the residential and commercial markets as well as penetration of wireless
versions of these alarms.
2. The growth in the number of wireless intruder alarms is calculated with
reference to expected saturation of the market. As in the previous
forecasts, there is a considerable degree of uncertainty surrounding the
estimates of growth; thus, we consider growth on two levels, one that
represents aggressive estimates of growth and another which is more
conservative.
We conclude our forecast by plotting Gompertz curves (see Annex C.4) for the
estimates of aggressive and conservative growth, using the estimates of current and
saturated market sizes as inputs.
Table 7 and Figure 8 provide the forecast number of wireless intruder alarms
operating in the 868–870 MHz band.
Table 7: Number of intruder alarms
Forecast (in millions of alarms)
2010 2011 2012 2013 2014 2015
Conservative 1.2 1.5 1.8 2.2 2.7 3.3
Aggressive 1.2 1.6 2.1 2.7 3.4 4.4
As noted previously, the average number of receivers per intruder alarm system is
likely to increase over this time frame, due to increasing use of bidirectional
technology. We estimate that the number of receivers per system will increase
linearly from an average of 5 currently to 10 by 2015.
15 See footnote 4 for definition.

Ægis Systems Limited 863–870 MHz SRDs
2210/SRDMR/R/3 33
On this basis the total number of receivers would be as follows:
Table 8: Number of intruder alarm receivers
Forecast (in millions of receivers)
2010 2011 2012 2013 2014 2015
Conservative 6.1 9 12.8 17.9 24.6 33.3
Aggressive 6.1 9.5 14.4 21.2 30.8 43.9
Figure 8: Number of intruder alarms
6.3 Home/Office automation
There are a number of applications relating to home automation. One area that has
been growing in recent years and was highlighted in a recent ETSI Technical Report
[17] is that of indoor climate control, which involves automatic opening and closing
of windows alongside monitoring of temperature and humidity and activation of
heating or air conditioning systems. According to the ETSI report, such systems
may involve up to 50 wireless nodes per dwelling and the most likely frequency
band for deployment is in the region of 870 MHz.
In the UK, increasing saturation of the 434 MHz SRD band is driving a move
towards the 869 MHz band, which in Europe is already the preferred frequency.
The specific sub-band preferred for these applications is 869.85 MHz using
863–870 MHz SRDs Ægis Systems Limited
34 2210/SRDMR/R/3
Wideband FM technology at 10 mW power. There has been a trend in recent years
towards two-way communication, facilitated by the introduction of low cost
transceiver chip-sets. This has addressed client concerns with uni-directional
wireless technology, which does not provide any means of verifying that an
instruction has been carried out. Bidirectional communication allows reception of
transmitted data to be verified to the originator. Many utility meter manufacturers
are now embedding these chipsets into their meters.
One supplier indicated that future demand would be of the order of 100,000 units
per annum, but observed that there was a lot of competition from low cost ZigBee
devices operating in the 2.4 GHz band. As there is now provision for 869 MHz in
the ZigBee standard, this may actually lead to increased use of this band over time.
Other alternatives to 869 MHz in this sector include 2.4 GHz, 802.15.4 technology,
VHF chipsets on 169 MHz (which provide better range) and low cost GSM/GPRS
devices that can be embedded into devices.
Unfortunately neither interviews held nor additional research conducted has
provided any of the relevant data necessary for the construction of a forecast.
6.4 Access control
Wireless access control systems may be regarded as a subset of remote control
systems (see following section) and typically include garage and gate openers.
Both 433 MHz and 868 MHz frequencies are deployed and there is generally one
receiver per system. We have been unable to find specific market information on
the number of remote access control systems in the UK but would expect this to be
substantially less than the take up of intruder alarm systems (since access control is
perceived to be more of a luxury item). It is also likely that homes that have remote
door opening systems will also have intruder alarms, the majority of which will be
wireless and likely to include several receivers per system. The presence of an
access control system with a single receiver is therefore not likely to impact
significantly on the overall number of receivers per household and consequently we
have not undertaken a detailed analysis of this sector.
6.5 Remote controllers
Wireless remote controls are used in a variety of applications, in both the residential
and industrial sectors. Residential applications typically include control of heating
systems, windows, air vents etc and are covered under home automation in section
6.3 above. Industrial applications include control of cranes and hoists, where the
869 MHz band is one of a number of frequencies that are used. Not all suppliers of
industrial remote control gear use this band however. One supplier that caters for
large industrial and construction sites indicated a preference for 433 MHz (where
short range and intensive frequency re-use was required) and the non-harmonised
458 MHz band where longer range is required. According to this supplier there
were too few frequencies available in the 869 MHz band to cater for large sites with
multiple cranes operating in close proximity.

Ægis Systems Limited 863–870 MHz SRDs
2210/SRDMR/R/3 35
Conversely, another supplier said they now preferred the 869 MHz band, as
433 MHz and 458 MHz were very cluttered. This supplier uses the low power
(5 mW) sub band 869.70625–869.99375 MHz and claims this provides up to 100
metres range. The 869 MHz devices are digital whereas the previous 433 MHz and
458 MHz were analogue.
Volumes are relatively low—one supplier which estimated they have 30–35% of the
UK market for industrial remote controls said they had sold approximately 6,000 in
the UK since 1994 and were currently selling 300–600 units per year. Although
mainly used for cranes on building sites they are trying to develop new markets
relating to vehicle hoists for example.
There are protocols on the link that ensure that the system goes into a failsafe mode
(e.g. the crane stops its activity) if there is any interference on the radio link.
In order to generate a forecast for these controls, we begin by estimating the
number of remote controls currently in use in the UK and operating in the 868–
870 MHz band (see Annex C3.3 for further detail on the forecast).
We follow this by estimating the number of remote control units sold within a year.
This estimate is based on sales and market share information provided during an
interview with one of the key market players.
We then estimate the number of units currently in the market. This is achieved by
estimating the replacement cycle for remote control units, an estimate that is guided
by information provided during an interview.
Finally we estimate the percentage of units currently in use that operate in the 868–
870 MHz band. This estimate is generated by corroborating the responses from two
independent interviews.
Having determined the number of remote controls currently in use and operating in
the 868–870 MHz band, we focus on providing a forecast for these controls. We
arrive at this forecast by estimating the growth of the overall remote control market
as well as the percentage of sales that is likely to account for replacement of wired
systems and new deployments.
Table 9 and Figure 9 provide the forecast number of remote controls operating in
the 868–870 MHz band.
Table 9: Number of remote controls
Forecast (in '000s of controls)
2010 2011 2012 2013 2014 2015
1.9 2.2 2.5 2.8 3.2 3.5

863–870 MHz SRDs Ægis Systems Limited
36 2210/SRDMR/R/3
Figure 9: Number of remote controls
0
0.5
1
1.5
2
2.5
3
3.5
4
2010 2011 2012 2013 2014 2015
Fore
cast
(in
'00
0s
of
con
tro
ls)
6.6 Medical
It has been noted that one company, Toumaz, is using this SRD frequency band for
a medical application. More precisely this frequency band is being used to deploy a
Body Area Network which connects a central hub containing a processor and data
storage with various sensors on and around the body (e.g. to measure pulse rate,
blood pressure etc). Such a capability provides for regular readings, including
through the night, and replaces a nurse having to obtain the data for example.
There is also a crossover for such capability in the sport sector, both professional
and recreational.
Currently these devices are Category 2 with respect to the general SRD radio
standard [18]. This means that the wireless communication is of medium reliability
and can therefore be used where some inconvenience to the user is acceptable.
This contrasts with Category 1 devices which provide a higher reliability and should
be used where there is a physical risk to a person. These devices may well be
upgraded to Category 1 performance to improve their reliability for measurements
where there might be some degree of physical risk to a person. However, it is not
thought likely that operation in a non-specific licence-exempt band would qualify
these devices to support medical intervention that is in any way life threatening.
Other frequency bands were considered for this application, namely around
400 MHz and 2.4 GHz, but 863–870 MHz was selected as offering the best
compromise in terms of antenna performance, power requirements and congestion.
It can be noted that previous sectoral studies for Ofcom concerning healthcare and
assisted living addressed the issue of body area networks and identified the
possible need for dedicated spectrum for this type of application. The FCC in the
US is currently going through a formal process to identify possible frequency

Ægis Systems Limited 863–870 MHz SRDs
2210/SRDMR/R/3 37
allocations for Medical Body Area Networks to complement their allocations for
wireless telemetry in hospitals. If the UK or Europe follows this lead there will be no
need to focus on using the 863–870 MHz band for medical applications except for
those of a less critical / routine nature or where it is less medical and more to do
with general health / performance e.g. relating to sport and fitness.
It has not been possible to obtain sufficient market data in order to provide a
forecast of device numbers.
6.7 Social alarms/Telecare
Telecare systems provide a mix of facilities for infirm and disabled people including
self and/or automatically triggered alarms. Alarms can be triggered by sensors
around a dwelling (to detect an overflowing bath for example) or on the person (to
detect a fall for example). Such alarms are received by a hub unit which then
communicates with a remote monitoring centre where appropriate action can be
initiated.
Each hub can accommodate many devices but in general there are only 2 or 3
sensors per installation. The hub only responds to sensors carrying a particular
signature on the data stream with messages being sent by a sensor several times in
order to mitigate the possibility of interference. Currently the communications link is
one way only (i.e. the sensor is a transmitter and the hub is a receiver). Although
two way communications would be desirable, Category 1 receivers are very power
hungry and this would not sit well with a sensor‘s power supply.
Although there are some installed systems using 173 MHz these are legacy
systems and the majority of companies now use the 869 MHz social alarm sub-
band. There is one company that uses the 169 MHz allocation. There is no
practical alternative for the pendant type personal alarm as it has to be mobile. The
fixed sensors, on the other hand, could be wired but the cost would be prohibitive.
In terms of future developments it is likely that the types of different sensor will
increase but the hub unit will remain largely the same.
The key driver of the market is the aging population. One vendor reported 1.6
million installed units in the UK where one unit is a hub with a number of sensors.
Total annual sales in the UK across the market are approximately 500,000 per year.
To determine the market for these social alarms, we begin by establishing the
number of social alarms currently operating in the 868–870 MHz band (see Annex
C3.4 for further detail on the forecast).
The first step is to calculate the addressable market. As mentioned above, the
market for social alarms comprises the elderly and the disabled. We calculate the
number of individuals in each of these groups using data provided by the Office of
National Statistics. We define the elderly as anyone over 65 years old and the
disabled as anyone with a recorded disability.

863–870 MHz SRDs Ægis Systems Limited
38 2210/SRDMR/R/3
The next step is to determine the number of social alarms currently in use. This
figure is based on a combination of interview responses and data provided by the
Social Alarms and Telecare Association [19].
We then estimate the penetration of social alarms within the addressable market
and estimate the percentage of these social alarms that operate in the 868–
870 MHz band. Both estimates are guided by interview responses.
Having determined the number of social alarms currently operating in the 868–
870 MHz band, we then focus on generating a forecast for how this number will
evolve over time.
We estimate the level of penetration when the market is saturated16
. We examine
penetration both in terms of social alarms used by the addressable market and then
in terms of those alarms operating in the 868–870 MHz band.
We estimate the recent and expected growth rates using inputs from interviews and
by conducting additional research, especially in relation to the growth in the aging
population. As there is a considerable level of uncertainty predicting future growth
behaviour, we consider two levels of growth rate, one that represents aggressive
estimates of growth and another which is more conservative.
We conclude our forecast by plotting Gompertz curves (see Annex C.4) for the
estimates of aggressive and conservative growth, using the estimates of current and
saturated market sizes as inputs.
Table 10 and Figure 10 provide the forecast number of social alarms operating in
the 868–870 MHz band.
Table 10: Number of social alarm systems
Forecast (in millions of alarms)
2010 2011 2012 2013 2014 2015
Conservative 1.8 2.1 2.5 2.9 3.4 4.0
Aggressive 1.8 2.4 3.1 4 4.9 5.0
16 See footnote 4 for definition.

Ægis Systems Limited 863–870 MHz SRDs
2210/SRDMR/R/3 39
Figure 10: Number of social alarm systems
0
1
2
3
4
5
6
2010 2011 2012 2013 2014 2015
Fore
cast
(in
mill
ion
s o
f al
arm
s)
Conservative
Aggressive
6.8 Smart metering
The possibility of reading meters remotely over a wireless connection has been
around for some years [20]. Such systems provide for bidirectional communication
over a fixed infrastructure or allow for walk-by and/or drive-by readout.
More recent developments, largely spurred by international interest in energy
efficiency, has led to a wider concept often referred to as smart grids whereby there
is a more regular exchange of information across and between the infrastructure of
energy suppliers and the local distribution of energy in consumers‘ properties. In
terms of wireless communication to support smart grids one can distinguish
between a local network within a consumer‘s property and a wider area network
connecting the consumer‘s property back to the supplier.
At present there are a number of devices on the market that can be applied in a
straightforward manner to monitor electricity consumption. These involve clipping a
sensor around the live mains wire just before the meter. The sensor is attached to a
wireless transmitter which then transfers the data output of the sensor to a control
panel where the consumer can monitor the rate and cost of electricity consumption.
It is not possible for the consumer to monitor and analyse patterns of gas
consumption with the same ease (in terms of DIY installation) so there hasn‘t been
the same consumer interest in energy efficiency relating to gas. There is however a
UK Government target that smart meters should be fitted in all 26 million
households by 2020 and this has been confirmed in more general terms by the
incoming administration; the Conservative–Lib Dem coalition agreement which
states that the parties agree to implement a full programme of measures to fulfil
their joint ambitions for a low carbon and eco-friendly economy, including the
establishment of a smart grid and the roll-out of smart meters. The latter is already

863–870 MHz SRDs Ægis Systems Limited
40 2210/SRDMR/R/3
underway - the first half of 2010 saw at least three energy suppliers (British Gas,
npower, and Scottish and Southern Energy) announce the roll out of smart meters
both for gas and electricity. British Gas alone intends to install smart meters in 2
million homes by 2012.
In terms of the frequency bands that might be used to support smart meters within
the home there are at least two options. It might be argued that technologies
operating in the 2.4 GHz band are suitable as they are well established with many
homes having a wireless network and users being familiar with the technology.
However, there are questions about range at these frequencies, particularly when
meters are located at the extremities of a property. An alternative that also has
some traction is the 868 MHz SRD band which has already been identified for meter
reading and it is also know that smart meters built by Landis+Gyr, a partner of
British Gas, use this frequency. At this stage, given that there is not a single
standard that applies, it is difficult to say whether smart meters will end up using a
single frequency band or whether different systems will use different frequency
bands or perhaps a wired alternative such as powerline.
The forecast for the use of smart metering is guided predominantly by the
government‘s declaration that they aim to have smart meters in every UK household
by 2020 (see Annex C3.5 for further detail on the forecast).
As smart meters were only introduced towards the end of 2008 in the UK and the
use of these meters is still very much in the pilot phase, the number of smart meters
currently in use is relatively low. We estimate the current use of smart meters by
assuming very low penetration and then combining this assumption with the number
of UK households [21].
In order to calculate the likely uptake of smart meters over the next 11 years, we
consider both the government‘s aim to have 47 million smart meters installed by
2020 and the aim for the mass roll-out of smart meters to begin in 2013. We then
apply both conservative and aggressive estimates of the growth rate in order to
attain a forecast for the roll out of these smart meters over the next 11 years, at
which point the market will be saturated17
.
We conclude our forecast by plotting Gompertz curves (see Annex C.4) for the
estimates of aggressive and conservative growth, using the estimates of current and
saturated market sizes as inputs.
Table 11 and Figure 11 provide the forecast number of smart meters over the
forthcoming five year period.
17 See footnote 4 for definition.
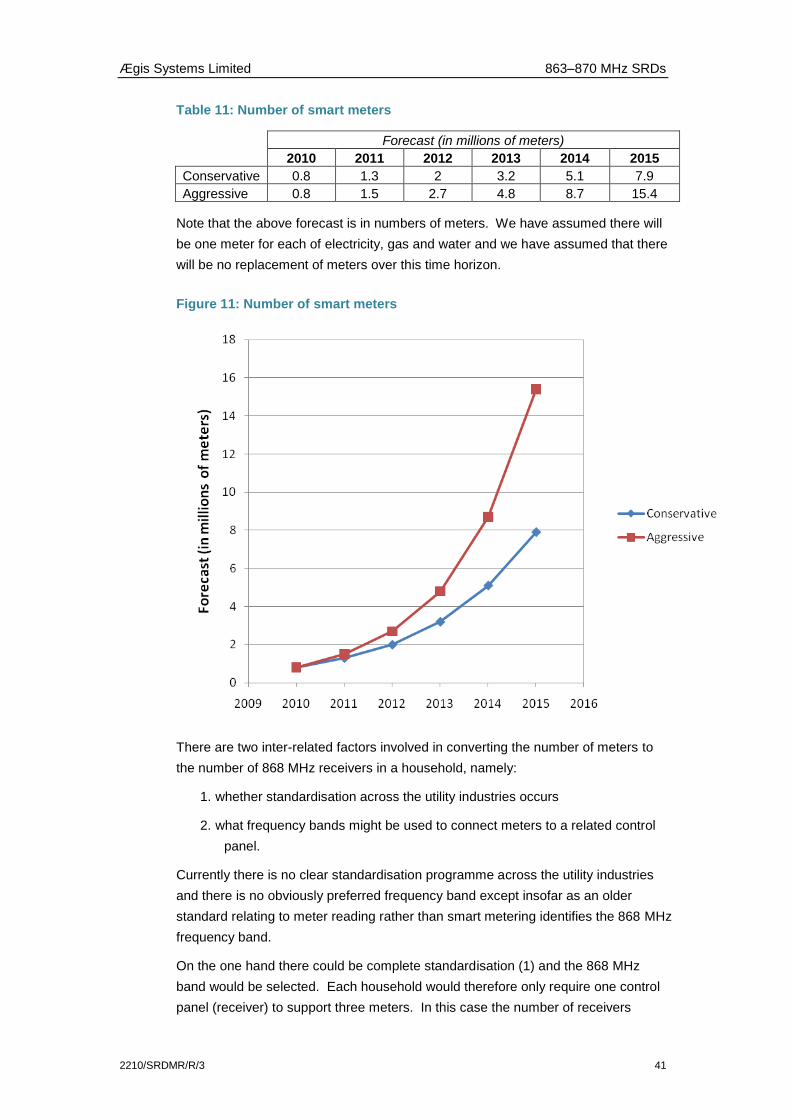
Ægis Systems Limited 863–870 MHz SRDs
2210/SRDMR/R/3 41
Table 11: Number of smart meters
Forecast (in millions of meters)
2010 2011 2012 2013 2014 2015
Conservative 0.8 1.3 2 3.2 5.1 7.9
Aggressive 0.8 1.5 2.7 4.8 8.7 15.4
Note that the above forecast is in numbers of meters. We have assumed there will
be one meter for each of electricity, gas and water and we have assumed that there
will be no replacement of meters over this time horizon.
Figure 11: Number of smart meters
There are two inter-related factors involved in converting the number of meters to
the number of 868 MHz receivers in a household, namely:
1. whether standardisation across the utility industries occurs
2. what frequency bands might be used to connect meters to a related control
panel.
Currently there is no clear standardisation programme across the utility industries
and there is no obviously preferred frequency band except insofar as an older
standard relating to meter reading rather than smart metering identifies the 868 MHz
frequency band.
On the one hand there could be complete standardisation (1) and the 868 MHz
band would be selected. Each household would therefore only require one control
panel (receiver) to support three meters. In this case the number of receivers
863–870 MHz SRDs Ægis Systems Limited
42 2210/SRDMR/R/3
operating in the 868 MHz band would be a third of the values above. If some other
frequency band is selected then clearly the number of receivers operating in the
868 MHz band falls to zero.
On the other hand there might be no effective standardisation, for example because
wide scale installation commences before any standardisation exercise can be
completed. This is likely in which case each household would require a separate
control panel (receiver) for each meter and each receiver may or may not use the
868 MHz frequency band. Depending on the outcome of this more variable
scenario the number of receivers operating in the 868 MHz frequency band could be
the same as the number of meters indicated above. However, there are any
number of scenarios between this and the zero option which depend on the degree
of standardisation within a utility sector (as opposed to across utilities) and the
choices of frequency band made by each fragmented part of the utility supply
industry.
6.9 Telemetry
In its broadest sense telemetry simply transfers data from A to B through a standard
interface at either end (RS232, Ethernet etc). Applications that might be supported
by one or more telemetry links are therefore wide and varied. For simpler radio links
carrying serial data, the communication is unidirectional and integrity is maximised
by using listen before talk (LBT) and error checking. For more important links,
bidirectional communication is used which allows for more sophisticated protocols
using redundancy checks and acknowledgements. This increases latency but
provides a very robust link.
Wireless telemetry is widely used by utilities and other industries for a variety of
applications, typically involving remote monitoring of systems. Safety critical
applications such as the monitoring of reservoir water levels or electricity
substations tend to use licensed spectrum in the 458 / 463 MHz band, which is
specific to the UK. Less critical applications that require long operational range use
the licence-exempt 458 MHz band, which is again UK-specific. The 869 MHz band
tends to be used for shorter range applications.
Although the potential market might be characterised as very large it appears from
companies we contacted that each company satisfies a small niche in terms of client
sector or application set. Each company has a view (generally confidential) of their
client sector and/or application set market size but absolutely no idea about the
overall market size for telemetry. Since telemetry devices are often based on RF
modules / chipsets it was suggested that the views of module manufacturers might
give a better idea of market size. However, the only module manufacturer who
responded to our enquiries had a similar profile to the telemetry companies, namely
that of a niche company. We have not therefore been able to gather enough data
on which to base a forecast.

Ægis Systems Limited 863–870 MHz SRDs
2210/SRDMR/R/3 43
6.10 Automotive
It has been noted [17] that ―Short Range Devices perform a variety of important
functions in modern automobiles. In accordance with information provided by the
European Automotive Manufacturers Association (ACEA), the existing passenger
car fleet in Europe consists of more than 250 million vehicles. Currently
approximately 60 % of these vehicles are equipped with one or more SRDs.
Approximately 6 million new vehicles are sold in Europe every year. 80 % of all new
vehicles are currently equipped with SRD devices. This percentage is increasing
and will reach 100 % in the near future.‖
The type of SRD applications used in vehicles listed include:
remote keyless entry systems
passive entry systems
personal car communications systems
truck-trailer communication systems
security systems (vehicle alarm systems).
The report [17] further notes ―the considerable number of malfunctions of the
keyless entry systems‖ and that increasing use of frequency bands will lead to an
increase in malfunctions and that ―spectrum in the 873 MHz to 876 MHz provides
the potential for a long term solution for automotive Short Range Devices‖.
However, our research identified very few products for the automotive industry that
operate in the already available 863–870 MHz band. The majority of products—
especially those associated with vehicle key fobs—operate in the 315 MHz band
(North America and Japan) and 434 MHz band (Europe).
Vehicle key fobs
Car key fobs have over time become more sophisticated. Initially they were used to
provide wireless identification to turn off the vehicle immobiliser, using LF
frequencies, and to provide remote keyless entry, using a unidirectional UHF link,
from a distance by the push of a button.
A Passive Keyless Entry / Go system, where sensors initiate communication
between the car and key, was introduced in 1999 and is available for more than 200
car models. The driver can enter the car by simply pulling the door handle and to
start the engine by simply pressing the ignition button in the dashboard, without the
need for taking the car key out of the pocket. The PKE system consists of one or
more key fobs, each with an LF receiver and a UHF transmitter while the car has
several LF transmitters and a UHF receiving module. The PKE system utilises the
LF link for data communication from the car to the key and the UHF link from the
key to the car. Also, for the remote keyless system, two-way communication key
fobs have been developed that allow the driver, for example, to receive confirmation
that the car was locked.

863–870 MHz SRDs Ægis Systems Limited
44 2210/SRDMR/R/3
The next developments are expected to be the Connected Key where connectivity
to other devices such as mobile phones, PDAs or PCs can be provided using Near
Field Communications which work at 13.56 MHz. This will allow the implementation
of applications which, for example, provide car related information onto a mobile
phone before opening the car or downloading route information from a PC into the
in-car navigation system.
While most current implementations use lower frequency bands, future
developments are expected to migrate to UHF and it can be noted that Audi and
BMW are already using 868 MHz for their car key fobs.
Tyre pressure
Another automotive application that has achieved some prominence recently is the
capability to measure tyre pressure while in motion. This is mandated in the US and
within Europe EC Regulation 661/2009 [22] which requires all new cars to be
equipped accordingly from 2014. EC standardisation mandate M/457 [23] has
started the process to arrive at a common method to achieve this and at this stage it
is not known what the final method might be. At present there are conflicting signals
as to what the final option might be as:
a current prominent UK supplier has a system based on 433 MHz
an Italian supplier specializing in this application also uses 433 MHz but
specifies 868 MHz as an option
it is understood that a physical / geometrical method for determining tyre
pressure which does not require the use of a wireless link is being
implemented already by car manufacturers.
We have not been able to gather enough data on which to base forecasts for
automotive applications

Ægis Systems Limited 863–870 MHz SRDs
2210/SRDMR/R/3 45
7 CONCLUDING REMARKS
We have provided forecasts for most of the SRD applications operating in the 863–
870 MHz frequency band. We have not been able to do so for some of the market
sectors due to lack of data. This includes the more general sector of telemetry and
it has not been possible to address non-specific SRDs as by definition these could
be anything.
It is interesting to note from information provided by respondents that, particularly
with regard to applications using the high part of the band (and the underlay), the
industry still appears to exist in an interim period in moving from 433 MHz to
868 MHz as a preferred frequency. While there are undoubtedly cases where
868 MHz has been chosen from the outset, there are many cases where
predominant supply has been, and still is, based on 433 MHz but with 868 MHz
being offered as a new option.
Furthermore, also mainly with respect to applications using the high part of the
band, a high uncertainty is attributable to the forecasts because alternatives are
available and standardisation has not run its course. For example, in the case of
smart meters depending on the outcome of standardisation activities all meters
might end up using the 868 MHz band or none at all. If there is no standardisation
with respect to frequency band then supply may be fragmented with suppliers opting
for differing frequency bands.
Uncertainty is compounded by the possibility of convergence between different
applications. Currently, application development is fragmented even within very
large companies. However, it is not difficult to see that a number of applications
could be supported by a single system (requiring one receiver), for example,
intruder alarm, home automation, access control and smart metering. For this to
become widespread would probably require a wider standardisation effort than is
currently going on. We therefore do not think this affects the forecasts for the
timescale considered by this study.

863–870 MHz SRDs Ægis Systems Limited
46 2210/SRDMR/R/3
A ACRONYMS / ABBREVIATIONS
ACEA European Automotive Manufacturers‘ Association
ALD Assistive Listening Device
CENELEC European Committee for Electrotechnical Standardisation
CEPT European Conference of Postal and Telecommunications
Administrations
DC Duty Cycle
DIY Do It Yourself
EC European Commission
ECC Electronic Communications Committee
ECO European Communications Office
ERC European Radiocommunications Committee
ERP Effective or Equivalent Radiated Power
ETSI European Telecommunications Standards Institute
EU European Union
FCC Federal Communications Commission (US)
FM Frequency Modulation
GPS Global Positioning System
GSM / GPRS Global System for Mobile Communications / General Packet
Radio Service
HAN Home Area Network
HF High Frequency
IT Information Technology
JFMG Joint Frequency Management Group
LBT / AFA Listen Before Talk / Adaptive Frequency Agility
LF Low Frequency
LPRA Low Power Radio Association
NB / WB Narrow Band / Wide Band
PC Personal Computer
PDA Personal Digital Assistant
PKE Passive Keyless Entry
PSTN Public Switched Telephone Network

Ægis Systems Limited 863–870 MHz SRDs
2210/SRDMR/R/3 47
RF Radio Frequency
RFID Radio Frequency Identification Device
SRD Short Range Device
SRD / MG Short Range Device Management Group
UHF Ultra High Frequency
VHF Very High Frequency

863–870 MHz SRDs Ægis Systems Limited
48 2210/SRDMR/R/3
B REFERENCES
[1] ERC Recommendation 70-03 relating to the use of Short Range Devices (SRD).
Edition of 16 October 2009 but containing revisions of January 2010.
[2] UK Interface Requirement 2030—Licence-exempt Short Range Devices. 98/34/EC
Notification number: 2007/0576/UK. Ofcom, September 2008 (Version 1.4).
[3] Annex 2 (The ECO report on inventory of cases and case studies of interferer to
victim interactions [WP2]) of the draft report on the receiver parameters pilot study
which is found as Annex A of ECC(09)130.
[4] ECC Report 11—Strategic plans for the future use of the frequency bands
862-870 MHz and 2400–2483.5 MHz for short range devices, Helsinki, May 2002.
[5] Draft ETSI TR 102 546 v1.1.1_2.0.2 (2007-01): ―Electromagnetic compatibility and
Radio spectrum Matters (ERM); Technical characteristics for Professional Wireless
Microphone Systems (PWMS); System Reference Document‖.
[6] Draft ETSI TR 102 791 v1.1.1_0.0.6 (2010-01): ―Electromagnetic compatibility and
Radio spectrum Matter (ERM); System reference document; Short Range Devices
(SRD); Technical characteristics of wireless aids for hearing impaired people
operating in the VHF and UHF frequency range‖.
[7] Shield, B. 2006: ―Evaluation of the social and economic costs of hearing impairment‖
Report for Hear-It.
[8] Alien Whitepaper: EPCglobal Class 1 Gen 2 RFID Specification.
[9] Verdict report (2010): ―How Britain Shops 2010: food and grocery‖.
[10] RFID journal article: ―Honda UK to track components through the supply chain‖
http://www.rfidjournal.com/article/articleview/2703/
[11] SeBW Table Report No. 06-2007: ―RFID Adoption‖.
[12] EN 54: Harmonised European standard for fire detection and fire alarm systems -
Part 25: Components using radio links. CEN/CENELEC 2008.
[13] Commission Communication on the framework of the implementation of the Council
Directive 89/106/EEC of 21 December 1988 on the approximation of laws,
regulations and administrative provisions of the Member States relating to
construction products.
[14] http://www.communities.gov.uk/documents/planningandbuilding/xls/1179479.xls
[15] http://www.dcsf.gov.uk/rsgateway/DB/SFR/s000843/SFR08_2009.pdf
[16] http://www.hospitalsworldwide.com/countries/uk.php
[17] ETSI TR 102 649-2 v1.2.1 (2010-06), Part 2: Additional spectrum requirements for
UHF RFID, non-specific SRDs and specific SRDs.

Ægis Systems Limited 863–870 MHz SRDs
2210/SRDMR/R/3 49
[18] ETSI EN 300 220-1 v2.3.1 (2009-12). Electromagnetic compatibility and Radio
spectrum Matters (ERM); Short Range Devices (SRD); Radio equipment to be used
in the 25 MHz to 1000 MHz frequency range with power levels ranging up to 500
mW; Part 1: Technical characteristics and test methods.
[19] Social Alarms and Telecare Association, Press Release: ―Gordon Brown signals
importance of alarms in spending review‖.
[20] EN 13757-4:2005. Communication systems for meters and remote reading of
meters—Part 4: Wireless meter readout (Radio meter reading for operation in the
868–870 MHz SRD band). CEN/CENELEC.
[21] Office of National Statistics: http://www.statistics.gov.uk/cci/nugget.asp?id=8
[22] EC Regulation 661/2009 (of 13th July 2009) concerning type-approval requirements
for the general safety of motor vehicles, their trailers and systems, components and
separate technical units intended therefor.
[23] EC standardisation mandate M/457 (21st December 2009) Standardisation mandate
to CEN, CENELEC and ETSI in the field of tyre pressure gauges for motor vehicles
and tyre pressure management systems (measuring instruments).

863–870 MHz SRDs Ægis Systems Limited
50 2210/SRDMR/R/3
C PARAMETERS, ASSUMPTIONS AND CALCULATIONS USED FOR
FORECASTS
C.1 Low-band
C.1.1 Wireless Microphones
Parameter
Designation
Value Sources Comments
Number of wireless
microphones sold by
one supplier in the
UK last year.
5,500 Interview with
supplier
One supplier estimates that they
have approximately 5-10% of the
market and that approximately
50,000 to 60,000 wireless
microphones were sold in the UK
in the last year (they estimate
their sales at approximately 5,000
to 6,000).
Another supplier estimated they
may have sales of 10,000 a year,
although this only covers entry-
level. Therefore sounds
reasonable they may sell close to
20,000 in total (consistent with
figures of first supplier).
Market Share of that
supplier
10% Interview with
supplier
See above.
Number of wireless
microphones sold in
the UK last year
55,000 Calculation 5,500 / 10%
This is consistent with PAMA‟s18
estimates of a total of ~650,000
wireless microphones sold in
Europe in 2009. From our
calculation, the UK would
represent ~8.5% of the European
volume. This is consistent with the
percentage of population in the UK
in relation to the total population
in Europe (61 million / 822 million
= 7.4%) plus an adjustment for a
supposedly higher penetration in
UK in relation to less developed
European economies.
18 The Professional Audio Manufacturers Alliance. Reference found in ETSI TR 102 546 v1.1.1 (2007-02)
located at
http://www.etsi.org/deliver/etsi_tr/102500_102599/102546/01.01.01_60/tr_102546v010101p.pdf

Ægis Systems Limited 863–870 MHz SRDs
2210/SRDMR/R/3 51
Number of wireless
microphones
currently in use in
the UK
275,000 Calculation 55,000 / 20%
Key assumption made is that
consumers upgrade microphones
every 5 years. Therefore annual
sales represent ~20% of total
market.
A third supplier noted that there
are already 100 000s of wireless
microphones out in the market
already.
Percentage of
wireless microphones
using the 863-865
MHz frequency range
50% Assumption Assumption made on the basis
that consumer applications make
up ~70% of market and that
~70% will operate in this range.
Based on comments from three
suppliers:
First supplier: … difficult to get a
handle on the users of the 863-
865 frequency as all applications
can be used in this frequency and
while it‟s mostly non-
professionals, many professionals
may combine this band with
another ...
Second supplier: There is a
general concern with the
overcrowding of the 863-865 MHz
band. The professionals who
purchase the higher end products
will use the lower frequencies and
completely avoid 863-865 MHz
because of the interference. This
863-865 MHz band is OK for a
vicar in a church or more
consumer-driven use, but no
professional will want to use the
band due to overcrowding.
Third supplier: There are not
currently many wireless
microphones and IEMs in this
band but they expect the numbers
to grow as these applications
move from other frequencies to
the 863 band. They noted that the
professional people won‟t use the
863-865 MHz band because of
interference concerns – more the
consumer side that uses
applications in this frequency
band.

863–870 MHz SRDs Ægis Systems Limited
52 2210/SRDMR/R/3
Number of wireless
microphones using
the 863-865 MHz
frequency range in
the UK
137,500 Calculation 275,000 x 50%
Growth rate in
number of wireless
microphones
5% Assumption Draft ETSI TR 102 546 (NOTE 1 –
page 17): PAMA estimated annual
growth after 2006 at 5%.
Interviews also predicted steady
increase over the years.
Percentage of
wireless microphones
using the 863-865
MHz frequency range
in the future
Conservative:
50%
Aggressive:
from 50% to
75% (in
steps of 5%)
between
2010 and
2015
Assumption Conservative: nothing changes.
Aggressive: consumer applications
in other bands migrate to 863-865
MHz band. Professional
applications increasingly use
channels in the 863-865 MHz
band.
Forecast for wireless microphones in the 863-865 MHz band:
2010 2011 2012 2013 2014 2015
Number of wireless
microphones currently in
use in the UK
275,000
Annual growth rate 5% 5% 5% 5% 5% 5%
275,000
288,750
303,188 318,347
334,264
350,977
% in 863-865 MHz
(conservative) 50% 50% 50% 50% 50% 50%
Conservative forecast
137,500
144,375
151,594 159,173
167,132
175,489
% in 863-865 MHz
(aggressive) 50% 55% 60% 65% 70% 75%
Aggressive forecast
137,500
158,813
181,913 206,925
233,985
263,233

Ægis Systems Limited 863–870 MHz SRDs
2210/SRDMR/R/3 53
C.1.2 Assistive Listening Devices – ALDs
Parameter
Designation
Value Sources Comments
Number of people in
UK with hearing
impairments (in
2003)
9 million Hear-It report19 “The figure generally quoted for
prevalence of hearing impairment
in the UK is 1 in 7, or
approximately 9 million people
(RNID, 2003)”
Number of people
who would benefit
from a hearing aid
(in 2003)
8.1 million Assumption 9 million x 90%
Assumption combining the above
9 million with 90% as indicated
below:
“In England and Wales it is
estimated that approximately 8.1
million of the population have a
hearing impairment, of whom
around 90% have a sensorineural
hearing loss and would benefit
from a hearing aid” (Hear-It
report)
Number of people
with a hearing aid
prescribed (in 2003)
1.4 million Hear-It report “Approximately 1.4 million, or
3.4% of the population, have a
hearing aid prescribed, although
around 10.4% of the population
could benefit (NICE, 2000; Davis,
2003).”
People with hearing
impairment without a
hearing aid (in 2003)
6.7 million Calculation 8.1 million – 1.4 million
Percentage of people
with hearing
impairment without a
hearing aid who
would benefit from
an ALD
50% Estimate 8% / 16%
Based on indication obtained
through research that the range
that would most benefit from
ALDs falls within people with 25 to
40 dB of hearing loss. The Hear-It
report estimates that 16.1% of
the UK population has a hearing
loss > 25 dB and 8.2% has a
hearing loss > 35 dB. Since the
population of people who have a
hearing impairment > 25 dB is
16% and 8% have a hearing loss
between 25 dB and 35 dB, this
equates to approximately 50% of
hearing impaired people who
would benefit from an ALD
19 http://www.ehima.com/members/Hear_It_Report_October_2006.pdf

863–870 MHz SRDs Ægis Systems Limited
54 2210/SRDMR/R/3
People who would
benefit from an ALD
(in 2003)
3.35 million Calculation 6.7 million x 50%
Population growth
rate
0.7% Estimate Estimate from the Office for
National Statistics
People who would
benefit from an ALD
(in 2010)
3.52 million Calculation 3.35 million x (1.007) ^ 7
Percentage of ALD in
the 863-865 MHz
frequency range (in
2010)
5% Estimate 25% x 20%
Based on estimates that only 1 in
4 people with some form of
hearing impairment uses some
form of hearing aid device and
that the market for Assistive
Listening Devices is largely
dominated by Infrared and FM
based systems (at least 80% in
our estimate based on availability
of models in vendors‟ websites)
Number of ALD in
the 863-865 MHz
frequency range (in
2010) [START]
175,882 Calculation 3,517,638 x 5%
Average growth 0.9% Estimate Based on ONS data showing
growth in the aging population of
0.88% in 2008.20
Number of people
who would benefit
from an ALD (by
2019)
3,813,042 Calculation 3.52 million x (1.009) ^ 9
Assumes that the number of
people who would benefit from an
ALD is driven by growth in the
aging population
Penetration of ALD in
the 863-865 MHz
frequency range (by
2019)
10% Assumption Assumes a combined effect of
increase in take up of ALDs and
increase in penetration of SRD
based ALDs
Number of ALD in
the 863-865 MHz
frequency range (in
2019) [CEILING]
381,304 Calculation 3,813,042 x 10%
20 http://www.statistics.gov.uk/downloads/theme_health/Pop-age-sex14.xls

Ægis Systems Limited 863–870 MHz SRDs
2210/SRDMR/R/3 55
Forecast for ALDs in the 863-865 MHz band:
Gompertz Series parameters
Ceiling 381,304
Initial Value 175,882
2010 2011 2012 2013 2014 2015 2016 2017 2018 2019
Forecast
(Conservative)
175,882
186,383
197,492
209,241
221,661
234,782
248,632
263,235
278,608
294,753
Growth YoY
(Conservative) 6.0% 6.0% 5.9% 5.9% 5.9% 5.9% 5.9% 5.8% 5.8%
Forecast
(Aggressive)
175,882
196,756
219,943
245,608
273,843
304,550
337,062
368,439
374,986
381,304
Growth YoY
(Aggressive) 11.9% 11.8% 11.7% 11.5% 11.2% 10.7% 9.3% 1.8% 1.68%

863–870 MHz SRDs Ægis Systems Limited
56 2210/SRDMR/R/3
C.2 Mid-band
C.2.1 RFID use in Manufacturing and Distribution
Parameter
Designation
Value Sources Comments
Number of
returnable containers
for a large retailer in
a particular retail
sector21
20 million Interview with
a supplier
The large retailer is used as a
proxy as it is the largest user of
returnable containers in a
particular retail segment.
The supplier also informed that
another large retailer uses
approximately 7 million returnable
containers with RFID tags.
Market share of the
particular retail
sector for that large
retailer
30.98% Verdict: How
Britain Shops
2010, p.25,
Table 3
Number of
returnable containers
in the particular
retail sector [A]
64,724,919 Calculation 20 million / 30.98%
This assumes the large retailer‟s
use of returnable containers
provides a good approximation for
all retailers in this particular
sector
Estimated
penetration of RFID
in the retail sector
26% SeBW report22 From SeBW report, page 49: “The
most interesting data point refers
to the retail sector, where 26% of
respondents indicated that they
have adopted RFID with 24% of
firms already using RFID in their
regular business.” (based on
survey from 2007).
We assume this penetration is the
same for the particular retail
sector of interest
Total estimated
number of returnable
containers using
RFID in the particular
retail sector
16,828,479 Calculation 64,724,919 x 26%
Percentage of
returnable containers
using RFID in 865-
868 MHz frequency
range
70% Assumption Based on the indication that most
of the implementations in
returnable containers now use
Gen2 UHF technology. However,
HF using 13.56 MHz and “real
time location systems – RTSL”
using 433 MHz and 2.4 GHz are
also employed.
21 This particular retail sector contains household goods, food, beverages and tobacco.
22 http://www.ebusiness-watch.org/studies/special_topics/2007/documents/Study_07-2008_RFID.pdf

Ægis Systems Limited 863–870 MHz SRDs
2210/SRDMR/R/3 57
Total estimated
number of returnable
containers using
RFID in 865-868 MHz
frequency range in
the particular retail
sector
11,779,935 Calculation 16,828,479 x 70%
Percentage of
returnable containers
with RFID in the
retail sector in
relation to total
number of returnable
containers in the
broader distribution
sector
50% Assumption Assumption made based on ONS
statistics for “Distributive and
Services trades”23. Weight of retail
related wholesale trades:
Household Goods, Food,
beverages and tobacco and other;
in relation to Machinery,
equipment and supplies and ½ of
Wholesale trades of non-
agricultural intermediate products,
waste and scrap. (2005)
Total estimated
number of returnable
containers using
RFID in 865-868 MHz
frequency range
[START –
DISTRIBUTION]
23,559,871 Calculation 11,779,935 x 2
This calculation enables the
extrapolation of the particular
retail sector to the distribution
sector as a whole
Average economic
growth [B]
2.5% Estimate Based on IMF estimates for period
2011 to 2015
Penetration of RFID
in the retail sector by
2019 [C]
70% Assumption Assumption made based on
indications of impact on
distribution efficiency / business
profitability driving penetration.
Also assumes diffusion to SMEs.
Penetration of RFID
in 865-868 MHz
frequency range in
the retail sector by
2019 [D]
70% Assumption Assumption made based on the
expectation that Gen 2 UHF and
RTSL will dominate and
percentage in the 865-868 MHz
will remain the same.
Percentage of
returnable containers
with RFID in retail in
relation to total
distribution by 2019
[E]
30% Assumption Assumes diffusion to other
distribution sectors which will
gradually use more returnable
containers with RFID technology.
Total r-c using RFID
in 865-868 MHz
frequency range in
2019 [CEILING –
DISTRIBUTION]
132,026,506 Calculation =64,724,919 x [(1.025)^9] x
70% x 70% / 30%
= [A] x [(1+[B])^9] x [C] x [D] /
[E]
I.e. affected by economic growth,
penetration and diffusion effects
23 http://www.statistics.gov.uk/pdfdir/das0506.pdf

863–870 MHz SRDs Ægis Systems Limited
58 2210/SRDMR/R/3
Parameter
Designation
Value Sources Comments
Number of
returnable containers
for Honda
350,000 RFID Journal24 The article reports figures for
2006 and we assumed that the
overall number of returnable
containers for Honda did not
change (due to the reduction in
output in the last two years).
Honda Market Share
in the UK
4.30% Estimate Estimate based on the market
share for Honda in 200625
Estimated number of
returnable containers
in the automotive
industry in the UK
[A]
8,139,535 Calculation 350,000 / 4.30%
Percentage of
returnable containers
in the automotive
industry using RFID
50% Assumption Desk research indicated that
approximately 80% of the top car
manufacturers with sales in the
UK use returnable containers with
RFID in the supply chain
Total estimated
number of returnable
containers using
RFID in the
automotive industry
4,069,767 Calculation 8,139,535 x 50%
Percentage of
returnable containers
in the automotive
industry using RFID
in the 865-868 MHz
range
70% Assumption Same assumption as in
distribution sector
Total estimated
number of returnable
containers in the
automotive industry
using RFID in the
865-868 MHz range
2,848,837 Calculation 4,069,767 * 70%
Percentage of r-c
with RFID in the
automotive industry
in relation to total
number of returnable
containers in the
manufacturing sector
50% Assumption Transport manufacturing
represents ~35% of the
manufacturing sectors likely to
use RFID (machinery and
equipment, electrical and optical,
transport equipment)26. Its
complex supply chain, justifies a
higher estimate for use of
returnable containers (Hence,
adjustment to 50%).
24 http://www.rfidjournal.com/article/articleview/2703/
25 http://www.autoblog.com/2006/06/20/honda-uk-sales-going-strong/
26 http://www.berr.gov.uk/files/file44332.pdf

Ægis Systems Limited 863–870 MHz SRDs
2210/SRDMR/R/3 59
Total r-c in the
manufacturing sector
using RFID in the
865-868 MHz range
[START –
MANUFACTURING]
5,697,674 Calculation 2,848,837 / 50%
Penetration of RFID
in the automotive
industry by 2019 [B]
70% Assumption Assumes diffusion to smaller
manufacturers and higher
penetration within large
manufacturers.
Penetration of RFID
in 865-868 MHz
range in automotive
industry by 2019 [C]
70% Assumption Same assumption as in
distribution sector.
Percentage of r-c
with RFID in the
automotive industry
in relation to total
number of returnable
containers in the
manufacturing sector
by 2019 [D]
30% Assumption Assumes diffusion to other
manufacturing sectors which will
gradually use more returnable
containers with RFID technology.
Total r-c using RFID
in 865-868 MHz
frequency range in
2019 [CEILING –
MANUFACTURING]
13,294,573 Calculation 8,139,535 x 70% x 70% / 30%
[A] x [B] x [C] /[D]
Economic growth not considered
as growth in manufacturing sector
is uncertain.

863–870 MHz SRDs Ægis Systems Limited
60 2210/SRDMR/R/3
Forecast for returnable containers with RFIDs in the 863-865 MHz band:
Gompertz Series parameters
Ceiling 145,321,080
= (132,026,506 + 13,294,573)
Initial Value 29,257,545
= (23,559,871 + 5,697,674)
(„000) 2010 2011 2012 2013 2014 2015 2016 2017 2018 2019
Forecast (Conservative)
29,257
34,000
39,496
45,859
53,216
61,706
71,479
82,680
95,430
109,753
Growth YoY
(Conservative) 16% 16% 16% 16% 16% 16% 16% 15% 15%
Forecast
(Aggressive)
29,257
35,804
43,772
53,444
65,136
79,172
95,814
115,006
135,254
143,188
Growth YoY
(Aggressive) 22% 22% 22% 22% 22% 21% 20% 18% 6%

Ægis Systems Limited 863–870 MHz SRDs
2210/SRDMR/R/3 61
C.2.2 RFID use in Individual Items
Parameter
Designation
Value Sources Comments
Number of tags used
by one large UK
garment retailer
(250 stores)
150 million
per year
Supplier The supplier has run this initiative
[item level tagging on clothes] at
a UK garment retailer for 2 years.
The retailer has used
approximately 150 million tags a
year – the tags are non-reusable.
This retailer has 250 stores in the
UK. Each store has approximately
2-3 RFID readers for these tags.
These tags and readers use the
866-868 MHz frequency band.
This has been a proven business
case – improved the bottom line
of the business, mostly by
improving the ability to count the
stock on shelves and to determine
what needs to be reordered. Other
clothing chains (eg in Portugal,
Germany and some in the UK) are
also now looking at this
approach.”
Number of Individual
Level Tags (ILTs) per
large store
600,000 Calculation 150,000,000 / 250
Number of large
garment retail stores
in the UK
4,000 Verdict and
internet
research
From Verdict Report: How Britain
Shops 2010: Clothing – M&S,
Next, Primark, Asda/George,
Debenhams, Matalan, New Look,
River Island, Tesco, TK Maxx and
Bon Marché have jointly 60.3% of
market share in the clothing
sector.
These retail chains have 3,849
stores according to the latest
information available in their
individual websites.
Total potential
number of RFID ILTs
in the UK garment
sector [A]
2.4 billion Calculation 600,000 x 4,000

863–870 MHz SRDs Ægis Systems Limited
62 2210/SRDMR/R/3
Percentage of retail
stores using RFID
ILTs in the UK
garment sector
20% Estimate Estimation obtained by looking at
top UK garment retailers and
determining the number that
employ RFID technology. This
estimate was then compared
against interview responses and
other forecasts to assess
accuracy.
Total estimated
number of RFID ILTs
in UK garment retail
480,000,000 Calculation 2.4 billion x 20%
Percentage of RFID
ILTs in the UK
garment retail using
RFID in the 865-868
MHz range
70% Assumption Based on the indication that most
of the implementations in
individual level tagging now use
Gen2 UHF technology. However,
HF using 13.56 MHz was
massively used in early
implementations.
Total estimated
number of RFID ILTs
in UK garment retail
using 865-868 MHz
[START]
336,000,000 Calculation 480 million x 70%
Average economic
growth [B]
2.5% Estimate Based on IMF estimates for period
2011 to 2015
Penetration of RFID
ILTs in the UK
garment retail sector
by 2019 [C]
50% Assumption Assumption made based on
indications of positive impact on
stock management / business
profitability driving penetration.
Also assumes diffusion to smaller
retail chains.
Penetration of RFID
ILTs in 865-868 MHz
range in garment
retail sector by 2019
[D]
70% Assumption Conservative assumption
considering that HF tags will
continue to be preferred for
certain applications.
Total estimated
number of RFID ILTs
in UK garment retail
using 865-868 MHz
by 2019 [CEILING]
1 billion Calculation 2.4 billion x (1.025)^9 x 50% x
70%
[A] x (1+[B])^9 x [C] x [D]

Ægis Systems Limited 863–870 MHz SRDs
2210/SRDMR/R/3 63
Forecast for ILTs in the 865-868 MHz band:
Gompertz Series parameters
Ceiling 1,049,044,895
Initial Value 336,000,000
(„000) 2010 2011 2012 2013 2014 2015 2016 2017 2018 2019
Forecast
(Conservative)
336,000
389,876
452,039
523,562
605,500
698,684
803,155
916,254
1,022,957
1,049,044
Growth YoY
(Conservative) 16% 16% 16% 16% 15% 15% 14% 12% 3%
Forecast
(Aggressive)
336,000
410,044
499,392
606,338
732,374
875,419
1,015,594
1,049,044
1,049,044
1,049,044
Growth YoY
(Aggressive) 22% 22% 21% 21% 20% 16% 3% 0% 0%

863–870 MHz SRDs Ægis Systems Limited
64 2210/SRDMR/R/3
Comparison with 3rd
party forecasts for UHF RFID:
Reference studies
(EUROPEAN level)
Million of tags per year - UHF RFID in band 865 – 868 MHz
(forecasted figures are shown in italics)
Source Issued 2006
2007
2008
2009
2010
2011
2012 2017 2022
ETSI TR 102 649-1
(Logistics only)
April
2007
190 220 320 450 680 960 1 200
YoY growth 16% 45% 41% 51% 41% 25%
BRIDGE project
February
2007
144 3 220 22 400 86 700
CAGR 47.5% 31%
IDTechEx
2009 680
Table 5 of ECO study Nov 2009 475 665 354 000
Ovum - UK Level
2006 2007 2008 2009 2010 2011 2012 2017 2022
R-Cs [Conservative] 29 34 40 83
ILTs [Conservative] 336 390 452 916
Total [Conservative] 365 424 492 999
R-Cs [Aggressive] 29 36 44 115
ILTs [Aggressive] 336 410 499 1,049
Total [Aggressive] 365 446 534 1,164

Ægis Systems Limited 863–870 MHz SRDs
2210/SRDMR/R/3 65
C.3 High-band
C.3.1 Fire alarms
Parameter
Designation
Value Sources Comments
Number of
commercial and
industrial properties
in England and Wales
1,794,592 Government The government provides
information on the number of
commercial properties in England
and Wales. This value was
obtained from
www.communities.gov.uk27.
Percentage of these
properties in England
and Wales in the UK
80% Estimate This estimate is based on the fact
that England and Wales has
approximately 89% of the total
UK population and 62% of the
total UK land area. As a large
portion of Scotland is unsuitable
for commercial sites, we expect
England and Wales to have more
than 62% of the properties of
interest. We also expect the
number of sites to be below 89%
as England‟s population per
commercial property is likely to be
higher than that for the UK as a
whole.
Number of
commercial and
industrial properties
in the UK
2,243,240 Calculation 1,794,592 / 80%
Number of schools
and hospitals in the
UK
25,816 Government
and hospital
databases
We assume that “commercial and
industrial” properties do not
include schools and hospitals. As
these are important non-
residential users of fire alarms (as
identified by industry players), we
include them in the forecast.
The data on the number of
schools was obtained from
www.dcsf.gov.uk and the data on
the number of hospitals was
obtained from
www.hospitalsworldwide.com.
Total number of
properties
2,269,056 Calculation 2,243,240 + 25,816
Average number of
alarms per property
50 Estimate This estimate is based on
discussion with a supplier and
other industry participants present
at the IFSEC conference.
Specifically, these participants
indicated that there are typically
40-60 devices in an average sized
building.
27 http://www.communities.gov.uk/documents/planningandbuilding/xls/1179479.xls

863–870 MHz SRDs Ægis Systems Limited
66 2210/SRDMR/R/3
Total estimated
addressable market
[A]
113,452,800 Calculation 2,269,056 x 50
Percentage of
properties with some
fire alarm system in
place
100% Assumption Our assumption is based on the
regulation that all commercial and
industrial properties in the UK are
required to have working fire
alarms installed in their premises
Estimated number of
fire alarms that are
wireless
30% Estimate This estimate is based on
discussion with a supplier and
other industry participants at the
IFSEC conference.
Estimated
percentage of
wireless alarms
operating in the 868-
870 MHz band
30% Estimate This estimate is based on
discussion with a supplier and
other industry participants at the
IFSEC conference.
Total number of
wireless fire alarms
operating in the 868-
870 MHz band
[START]
10,210,752 Calculation 113,452,800 x 100% x 30% x
30%
Average economic
growth [B]
2.5% Estimate Based on IMF estimates for period
2011 to 2015
Estimated
penetration of
wireless fire alarms
by 2019 [C]
80% Estimate This estimate is based on
discussion with a supplier and
other industry participants at the
IFSEC conference.
Estimated
penetration of
wireless fire alarms
in the 868-870 MHz
band by 2019 [D]
100% Estimate This estimate is based on
discussion with a supplier and
other industry participants at the
IFSEC conference. Specifically,
information gathered indicated
that all wireless devices will need
to be able to operate at 868-870
from 2011
Total number of
wireless fire alarms
operating in the 868-
870 MHz band by
2019 [CEILING]
113,349,601 Calculation 113,452,800 x (1.025)^9 x 80%
x 100%
[A] x (1+[B])^9 x [C] x [D]
Calculation based on the economic
growth (2.5%), the estimated
penetration of wireless alarms
(80%), the penetration of alarms
in the 868-870 MHz band (100%)
and the number of years until
2019 (9)

Ægis Systems Limited 863–870 MHz SRDs
2210/SRDMR/R/3 67
Forecast for fire alarms in the 868-870 MHz band:
Gompertz Series parameters
Ceiling 113,349,601
Initial Value 10,210,752
(„000) 2010 2011 2012 2013 2014 2015 2016 2017 2018 2019
Forecast
(Conservative) 10,210 12,740 15,887 19,799 24,654 30,667 38,093 47,224 58,375 71,822
Growth YoY
(Conservative) 25% 25% 25% 25% 24% 24% 24% 24% 23%
Forecast
(Aggressive) 10,210 13,394 17,553 22,972 30,011 39,110 50,782 65,546 83,647 103,736
Growth YoY
(Aggressive) 31% 31% 31% 31% 30% 30% 29% 28% 24%

863–870 MHz SRDs Ægis Systems Limited
68 2210/SRDMR/R/3
C.3.2 Intruder alarms
Parameter
Designation
Value Sources Comments
Current penetration
of alarm systems in
residential areas
13% Interview with
a supplier
“Current penetration of alarm
systems in the residential market
is 12 – 14 %.”
Number of
residential premises
in the UK [A]
26,665,714 ONS Using ONS data28 we calculate
that there were 26,142,857
households in the UK in 2009.
Based on an evaluation of historic
growth rates, an increase of 2%
was considered to adjust the
figure for 2010.
Number of alarm
systems in
residential areas
3,466,543 Calculation 26,665,714 x 13%
Current market
share of wireless
systems
30% Assumption Assumption based on information
obtained during the interviews:
the first supplier estimates 25%
wireless, another supplier
estimates 34-36% wireless
Number of wireless
alarm systems in
residential areas
[START –
RESIDENTIAL]
1,039,963 Calculation 3,466,543 x 30%
(For the last 4-5 years all new
wireless alarm systems can
operate in the 868-870 MHz band
for harmonization with other
European countries)
Average economic
growth [B]
2.5% Estimate Based on IMF estimates for period
2011 to 2015
Penetration of alarm
systems in
residential areas by
2019 [C]
30% Assumption The first supplier estimates that in
5 years time this penetration will
be around 18 to 20%. We
projected another 10% growth in
penetration for the next 5 years.
Market share of
wireless systems by
2019 [D]
70% Assumption Based on an expectation of
continued growth in penetration.
The first supplier estimated a
growth of 20% in penetration in
the last 5 years.
Number of wireless
alarm systems in
residential areas by
2019 [CEILING –
RESIDENTIAL]
6,993,383 Calculation 26,665,714 x 1.025^9 x 30% x
70%
[A] x (1+[B])^9 x [C] x [D]
Current penetration
of alarm systems in
commercial buildings
80% Assumption Assumption based on the broad
need for commercial concerns to
protect stock and assets.
Number of
commercial premises
in the UK [A]
2,269,056 Calculation See calculation in the forecast for
fire alarm systems.
28 http://www.statistics.gov.uk/cci/nugget.asp?id=8

Ægis Systems Limited 863–870 MHz SRDs
2210/SRDMR/R/3 69
Number of intruder
alarm systems in
commercial areas
1,815,245 Calculation 2,269,056 x 80%
Current market
share of wireless
systems
10% Assumption Based on indications that current
installations in the commercial
sector are, in its majority, wired.
Number of wireless
intruder systems in
commercial areas
[START –
COMMERCIAL]
181,524 Calculation 1,815,245 x 10%
Average economic
growth [B]
2.5% Estimate Based on IMF estimates for period
2011 to 2015
Penetration of alarm
systems in
commercial buildings
by 2019 [C]
80% Assumption Assumes that alarm systems are
broadly available already and that
there are no major drivers for
further penetration
Market share of
wireless systems by
2019 [D]
30% Assumption Assumption made considering
convenience of wireless where
interruption of commercial
services needs to be avoided
Number of wireless
intruder systems in
commercial areas by
2019 [CEILING –
COMMERCIAL]
680,098 Calculation 2,269,056 x 1.025^9 x 80% x
30%
[A] x (1+[B])^9 x [C] x [D]
Forecast for intruder alarms in the 868-870 MHz band:
Gompertz Series parameters
Ceiling 7,673,480
= (6,993,383 + 680,098)
Initial Value 1,221,487
= (1,039,963 + 181,524)
(„000) 2010 2011 2012 2013 2014 2015 2016 2017 2018 2019
Forecast
(Conservative)
1,221
1,496
1,831
2,239
2,734 3,333
4,054
4,910 5,904 6,978
Growth YoY
(Conservative) 22% 22% 22% 22% 22% 22% 21% 20% 18%
Forecast
(Aggressive)
1,221
1,585
2,054
2,656
3,422
4,386 5,565
6,891 7,617 7,673
Growth YoY
(Aggressive) 30% 30% 29% 29% 28% 27% 24% 11% 1%

863–870 MHz SRDs Ægis Systems Limited
70 2210/SRDMR/R/3
C.3.3 Remote Controllers
Parameter
Designation
Value Sources Comments
Number of units sold
by one supplier in
the UK in a year
500 Interview with
supplier
Response provided by supplier
during an interview
Estimated UK market
share for that
supplier
32.5% Interview with
supplier
The supplier stated that their
market share was between 30%
and 35%
Estimated number of
units sold per year
1,538 Calculation 500 / 32.5%
Replacement cycle 5 years Assumption Based on replacement cycle of
other similar peripheral equipment
Number of units
currently in the
market
7,692 Calculation We assume that the current
market is simply replacement.
Consequently, the number of units
in the market is calculated as
1,538.46 x 5
Percentage of units
operating in the 868-
870 MHz band
25% Interviews with
two suppliers
The first supplier indicated that
approximately 50% of the units
operate in this band. In
comparison, another supplier was
of the opinion that none of the
units operate in this band. As
these are the main industry
operators, we took an average of
their responses to be the most
accurate reflection of market
sentiment
Number of units in
the market in the
868-870 MHz band
1,923 Calculation 7,692 x 25%
Year-on-year growth
of overall market
2.5% Estimate Based on IMF estimates for period
2011 to 2015
Percentage of units
sold in a year that
represents
replacement of wired
units or new
deployments
75% Estimate Based on interview responses and
the prediction of a 5-year
replacement cycle.
Number of additional
units in a year
296 Calculation 1,538 x 1.025 x 25% x 75% This
is calculated as the number of
units sold over the course of the
preceding year as well as the % of
these units operating in the 868-
870 MHz band and the % of units
representing replacement of wired
units or new deployments. The
calculation for 2011 is
(1,538*1.025) x 25% x 75%
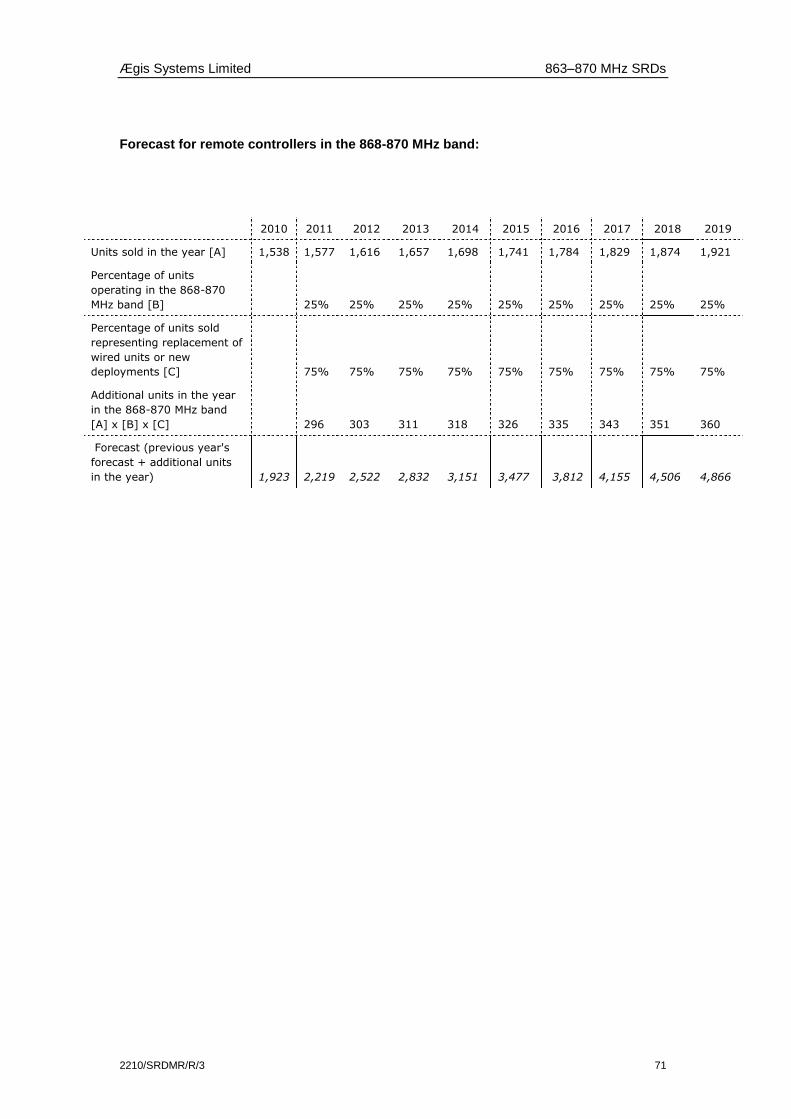
Ægis Systems Limited 863–870 MHz SRDs
2210/SRDMR/R/3 71
Forecast for remote controllers in the 868-870 MHz band:
2010 2011 2012 2013 2014 2015 2016 2017 2018 2019
Units sold in the year [A] 1,538 1,577 1,616 1,657 1,698 1,741 1,784 1,829 1,874 1,921
Percentage of units
operating in the 868-870
MHz band [B] 25% 25% 25% 25% 25% 25% 25% 25% 25%
Percentage of units sold
representing replacement of
wired units or new
deployments [C] 75% 75% 75% 75% 75% 75% 75% 75% 75%
Additional units in the year
in the 868-870 MHz band
[A] x [B] x [C] 296 303 311 318 326 335 343 351 360
Forecast (previous year's
forecast + additional units
in the year)
1,923 2,219 2,522 2,832 3,151 3,477 3,812 4,155 4,506 4,866

863–870 MHz SRDs Ægis Systems Limited
72 2210/SRDMR/R/3
C.3.4 Social alarms
Parameter
Designation
Value Sources Comments
Current addressable
market [A]
8,500,000 Office of
National
Statistics
(ONS)
The addressable market comprises
the elderly (who we define as over
65) and the disabled. Using ONS
data we estimate that the number
of individuals over the age of 65 is
4.3 – 4.5 million. ONS data also
indicates that the number of
disabled people in the UK is
approximately 4 million.
Number of individuals
currently using social
alarms
2,000,000 Interview with
a supplier
The supplier estimated that there
were currently around 2 million
social alarms in use. Data from
the Social Alarm and Telecare
Association provides verification
for this estimate by showing that
the number of individuals using
social alarms in 2004 was
approximately 1.5 million.
Current penetration of
social alarms
24% Calculation 2 million / 8.5 million
Percentage operating
in the 868-870 MHz
band
90% Interview with
a supplier
The supplier indicated that almost
all of the market currently uses
the 868-870 MHz band – The
supplier is aware of just one
company that uses a lower
frequency
Current number of
social alarms in the
868-870 MHz band
[START]
1,800,000 Calculation 2 million x 90%
Average growth [B] 0.9% Estimate Based on ONS data showing
growth in the aging population of
0.88% in 2008. 29
Penetration of social
alarms by 2019 [C]
60% Estimate Based on 2004 population
estimates (from ONS), we
calculate that penetration in 2004
was 2.5%. Over the past 6 years
penetration has increased from
2.5% to 24% and we expect this
increase to continue, although at
a slower rate.
Penetration of social
alarms operating in
the 868-870 MHz by
2019 [D]
90% Estimate The percentage currently
operating in this band is already
high (90%) and we have no
reason to believe this will change
Number of social
alarms operating in
the 868-870 MHz band
by 2019 [CEILING]
4,975,459 Calculation 8.5 million x 1.009^9 x 60% x
90%
[A] x (1+[B])^9 x [C] x [D]
29 http://www.statistics.gov.uk/downloads/theme_health/Pop-age-sex14.xls

Ægis Systems Limited 863–870 MHz SRDs
2210/SRDMR/R/3 73
Forecast for social alarms in the 868-870 MHz band:
Gompertz Series parameters
Ceiling 4,975,459
Initial Value 1,800,000
(„000) 2010 2011 2012 2013 2014 2015 2016 2017 2018 2019
Forecast
(Conservative) 1,800 2,123 2,500 2,939 3,443
4,009
4,601
4,971
4,975
4,975
Growth YoY
(Conservative) 18% 18% 18% 17% 16% 15% 8% 0% 0%
Forecast
(Aggressive) 1,800 2,370 3,096 3,977 4,850
4,975
4,975
4,975
4,975
4,975
Growth YoY
(Aggressive) 32% 31% 28% 22% 3% 0% 0% 0% 0%

863–870 MHz SRDs Ægis Systems Limited
74 2210/SRDMR/R/3
C.3.5 Smart metering
Parameter
Designation
Value Sources Comments
Ceiling of smart
meters by 2020
47,000,000 Government The UK government plans to roll-
out smart meters to every home
by 2020. As per government
statements, this equates to
approximately 47 million meters
in 2020.
Percentage of smart
meters operating in
the 868-870 MHz
band
100% Landys+Gyr
(Public domain)
Discussions with industry experts
within Ovum indicate that there is
a definite movement towards
standardization – our expectation
is thus that all smart meters that
will be rolled out over the next 10
years will use the same frequency.
Two main frequency bands could
be used for smart meter
deployment: the 2.4 GHz and
868-870 MHz bands. If the 2.4
GHz band is selected, the forecast
for smart meters in the 868-870
MHz band will be zero. If it is
decided that the 868-870 MHz
band will be used, we predict that
100% of all smart meters will use
this band.
Currently Landys+Gyr, who use
the 868-870 MHz band, have a
partnership with British Gas to
provide smart meters within the
UK. We assume 100% of smart
meters will use this 868-870 MHz
band but note that the reader
should be aware of the
alternatives.
Number of smart
meters in the UK in
2012
2,019,945 British Gas
(Public domain)
British Gas plans to install 2
million meters by 2012. While
British Gas is one of three
providers discussing the roll out
smart meters (the others are
npower and Scottish and Southern
Electric), it is the only one
currently teamed up with a
provider (Landys+Gyr) and in a
position to supply a significant
number of smart meters by 2012.
We therefore estimate that the
number of smart meters in 2012
will be slightly higher than 2
million.

Ægis Systems Limited 863–870 MHz SRDs
2210/SRDMR/R/3 75
Number of smart
meters in the UK in
2010 [START]
800,000 Estimate Smart meters were only
introduced towards the end of
2008 and are still in the pilot
phase. We estimate that
approximately 3% of households
currently have a single smart
meter. This estimate is based on
the number of smart meters
expected in 2012 and the fact that
mass roll-out of smart meters is
only expected to commence in
2013, peaking at 47 million in
2020. The calculation is based on
47 million meters x 3% x 50% (as
it is estimated that each house will
have roughly 2 meters)
Forecast for smart meters:
Gompertz Series parameters
Ceiling 47,000,000
Initial Value 800,000
(„000) 2010 2011 2012 2013 2014 2015 2016 2017 2018 2019
Forecast
(Conservative) 800 1,272 2,019 3,199 5,051 7,941 12,404 19,167 29,006 41,562
Growth YoY
(Conservative) 59% 59% 58% 58% 57% 56% 55% 51% 43%
Forecast
(Aggressive) 800 1,465 2,672 4,846 8,708 15,410 26,464 41,799 47,000 47,000
Growth YoY
(Aggressive) 83% 82% 81% 80% 77% 72% 58% 12% 0%

863–870 MHz SRDs Ægis Systems Limited
76 2210/SRDMR/R/3
C.4 Use of the Gompertz Curve
The Gompertz Curve is an S-shaped curve that is used for time series data where growth is
slowest at the start and end of a time period and more rapid in the middle period. This curve
has proved to be a good fit for a number of applications; for example, mobile phone
penetration where growth is initially slow (as costs are high), then increases rapidly as
demand rises and costs fall, and then slows down as the market becomes saturated.
The Gompertz Curve is based on the following function:
ctbeaety )(
The constants ‗b‘ and ‗c‘ are negative values. As the variable‗t‘ grows, y(t) tends to ‗a‘, the
asymptote (in our case, the Ceiling value).
When t = 0, i.e. in the intercept with the y bar (in our case, the Initial Value), the function is
simplified as follows:
baey )0(
Therefore, we calculate the constant ‗b‘ from the values entered for the Initial Value and for
the Ceiling as follows:
)_
ln(valueInitial
Ceilingb
The growth slope of the Gompertz curve changes with the changes in t. We identify the value
of the constant ‗c‘, from our input Growth_factor as follows:
))1_ln(
1ln(b
factorGrowthc
We calculate the series of values in the curve by using the value of the previous element of
the series as the ‗Initial_value‘ of the next element in the series.