short-term load forecasting for campus building with small
TRANSCRIPT
Short-Term Load Forecasting for Campus Buildingwith Small-Scale Loads by Types Using Artificial
Neural NetworkSung-Jun Baek
Department of Electrical EngineeringSoongsil University
Seoul, Republic of [email protected]
Sung-Guk YoonDepartment of Electrical Engineering
Soongsil UniversitySeoul, Republic of Korea
Abstract—Nowadays, the large portion of total energy isconsumed by buildings, so it is essential to use the energyefficiency in buildings. With the deployment of a smart meterin the building, a small-scale load data are now available suchas lighting, general and the other loads. We first analyze thesmall-scale loads through the fixed k-means clustering algorithm.Based on the analysis of load characteristics, we propose fiveartificial neural network-based forecasting models for campusbuildings. The five models use total load, temperature andsmall-scale loads as input data with different input combinations.The case studies show that using small-scale loads improves theforecasting performance.
Keywords: artificial neural network, campus building, small-scale load, smart meter, k-means clustering algorithm, short-termload forecasting.
I. INTRODUCTION
The energy consumption in buildings accounts for about35% of total energy consumption [1]. The building sectorrepresents 39% and 40% of the energy consumption in theU.S. and Europe [2]. In Korea, about 24% of the total energyconsumption is used in buildings and the portion of electricenergy used in buildings is 66.4% in 2015 [3]. Therefore, theelectrical load forecasting for buildings becomes important touse the electrical energy efficiently.
Several studies have been investigated building load fore-casting recently. Lim et al. have proposed a load forecastingmodel for campus building by using regional temperaturedata [4]. In [5], the accuracy of SVR and ANN based forecast-ing scheme has been analyzed in campus load. Ke et al. haveanalyzed several factors which highly affect the building loadpattern [6]. In [7], load forecasting performances for the entirecampus and one building on campus have been analyzed.In [8], the ANN trained by two different input combinationsand compared performance of both cases.
When the load size becomes smaller, the forecasting perfor-mance is generally degraded compared to the performance of alarge scale load [7] [9]. Therefore, to improve the forecasting
This work was supported by Korea Electric Power Corporation (Grantnumber: R17XA05-62 and R18XA04).
accuracy, different approaches should be considered. Nowa-days, many intelligent meters are installed in diverse sectorssuch as the substation, feeder and even inside a building. Theycan measure and send the power usage data in real time.Since the total load consists of the small-scale loads in abuilding, it is expected that small-scale data help to revealunique characteristics of buildings and improve the forecastingaccuracy.
In [10], to group small-scale loads, the k-means clusteringalgorithm has been used. The loads in the same cluster aresummed and the load forecasting is performed in each cluster.In [11], the similar load and the other loads were called theregular and irregular nodes, respectively. Differently than [10]and [11], we use the fixed centroid k-means clustering algo-rithm to group small-scale loads based on pattern similaritywith a total building load.
In this paper, we propose five artificial neural network(ANN)-based forecasting models for campus buildings. Theproposed forecasting model uses total load, temperature andsmall-scale loads as input data with five different combina-tions. The small-scale load groups are obtained by the fixedcentroid k-means clustering algorithm. Through simulations,it is confirmed that the small-scale data improve forecastingperformance than the previous model which does not use thesmall-scale data.
The rest of the paper is organized as follows. We analyzethe load data of campus building in Section II, and Section IIIdescribes the proposed load forecasting model. After evaluat-ing the proposed model in Section IV, we conclude our paperin Section V.
II. ANALYSIS OF LOAD DATA FOR A CAMPUS BUILDING
We have been gathering load data of an engineering buildingin Soongsil University, Seoul, Korea since August 2015. Thissection analyzes the building load data.
A. Configuration of the Campus Building Load
In the underground electrical room in the engineering build-ing, smart meters have been installed to measure the electrical
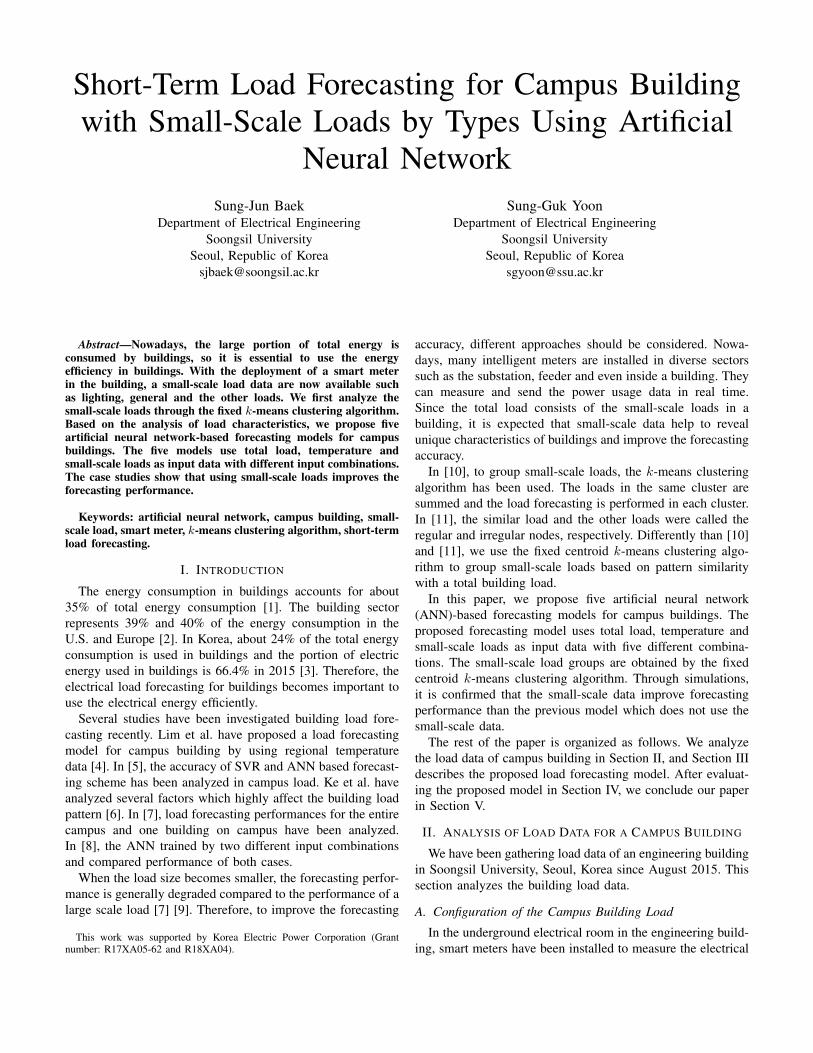
(a) Total load of building from August 2015 to July 2016
(b) Small-scale loads in the building for one week
Fig. 1. Daily Load Curves for the Campus Building
loads which consist of different types of loads1. The small-scale loads consist of general loads (office or classrooms),lighting load, rectifier load, motor control sensors, ventilationload, pump load, and elevator load. There are several spareloads that are currently used as cafe and laboratories. Thetotal number of the small-scale loads in the building is 56.
B. Characteristics of the Campus Load
Fig. 1(a) shows the total load of the building from August2015 to July 2016. The thick red line with circles and the thickblue line with x show the average power consumptions forsummer and winter, respectively. The daily load curves showdifferent patterns depending on seasons. On the weekday, theload rapidly increases from 7:00 to 9:00, which is usuallythe beginning of the lectures. The peak value appears approx-imately from 14:00 to 16:00. After most of the lectures areover, i.e., at 6:00 pm, power consumption gradually decreases,and the load at night is small and stable.
Fig. 1(b) shows the load curves for small-scale loads in thebuilding for one week. As shown in the figure SV2-2 andSV3-1 show a similar pattern to the total building load sincethey are general purpose load. On the other hand, SV6-4 and
1In this paper, these loads are called small-scale loads.
SV5-7 show a different pattern. The load shown in SV6-4 isonly used on certain days, and that in SV5-7 shows a randompattern that cannot easily define its characteristic.
C. Clustering Analysis of Campus Load Data
Since the patterns for small-scale loads in the building arevery different, it is important to analyze load patterns forselecting important features from the small-scale load data. Weuse the k-means clustering algorithm which makes k groups,i.e., clusters, from the input data set [12]. It gathers closedistant small-scale loads into the same cluster.
In this work, the input data is daily load curves of small-scale loads that are 24-hour load data. Since the absolutevalues of the total load and small-scale load are very differ-ent, each data is normalized before the k-means clusteringalgorithm. We use a similar normalization method as shownin [11], which is
LNi (t, d) =
xi(t, d)−mint∈T
xi(t, d)
maxt∈T
xi(t, d)−mint∈T
xi(t, d)(1)
where LNi (t, d) is normalized load i at time t on day d and
N stands for normalization. xi and T are the original powerconsumption of load i (kWh) and the set of time for one day.Since following analysis performs on the same day, we dropthe day index d to improve readability.
We use the Euclidean distance to measure the distancebetween the total building load and a small-scale load i, i.e.,D(Li, C) which can be obtained by
D(Li, C) =
√∑t∈T
(LNi (t)− CN (t))2 (2)
where CN (t) is a centroid, which is normalized total buildingload at t.
The number of clusters is an important parameter for thek-means clustering algorithm. Although the more clusters givebetter grouping result, it does not guarantee that the solutionis better. To get a proper number of clusters, we use theSilhouette coefficient [13], which is given by
s(j) =b(j)− a(j)
max(a(j), b(j))(3)
where a(j) is the average distance of j with all other datawithin the same cluster (cohesion), and b(j) is the averagedistance of j to other cluster which not containing the j(separation). We use the average value of total data, i.e.,Sk = 1
m
∑mj=1 s(j), where m and k denote the numbers
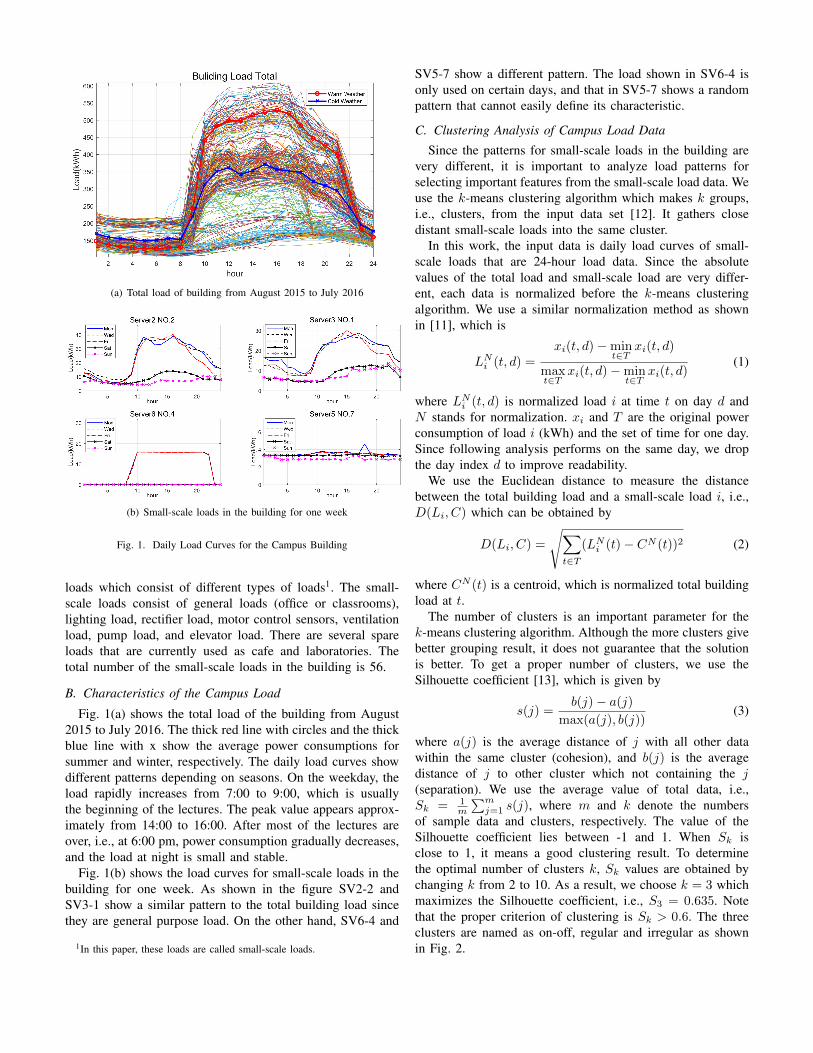
of sample data and clusters, respectively. The value of theSilhouette coefficient lies between -1 and 1. When Sk isclose to 1, it means a good clustering result. To determinethe optimal number of clusters k, Sk values are obtained bychanging k from 2 to 10. As a result, we choose k = 3 whichmaximizes the Silhouette coefficient, i.e., S3 = 0.635. Notethat the proper criterion of clustering is Sk > 0.6. The threeclusters are named as on-off, regular and irregular as shownin Fig. 2.

Fig. 2. The clustering results of a day.
Among the three clusters, the regular pattern cluster showsa similar pattern to the total building load by setting a fixedcentroid as the total building load. There are 31 small-scaleloads out of 56 in this cluster. In a regular pattern group, thethick red line with a circle is the normalized total buildingload. The other two groups show quite different patterns. Theon-off pattern group has six small-scale loads. Load curvesin this group have on- and off-periods. In off-period, theload consumes almost zero electricity. On the other hand, itconsumes high electricity in on-period. The last cluster is theirregular pattern group which is not easy to find any importantcharacteristics. However, since the loads in this pattern haverelative small peak, such as less than tens of kW, we do notuse this cluster as the input data of the proposed ANN.
III. FORECASTING MODEL
A. Artificial Neural Network
The ANN is an algorithm designed to imitate the humanbrain and to train the machine with various data. In ANN, aperceptron receives inputs from its child perceptron, and thenthe perceptron also sends its data to the next perceptron byusing the activation function.
Multi-layer perceptron (MLP) has several hidden layersto solve nonlinear problems. To train the MLP, a back-propagation (BP) algorithm is used which adjusts weightsuntil the error reached a threshold. The error is defined as thedifference between the output of MLP and the target value.
The output value obtained by the feed-forward algorithm iscalculated as
y(x) =
s∑k=1
wy,khk(x) + b (4)
hk(x) = φ(wk · x+ bk) (5)
where wy,k, hk(x), b, and s denote the weight for the outputneuron, the output of a hidden neuron k, the bias and thenumber of hidden neurons2, respectively. There is no concreteway of determining the number of neurons in the hiddenlayer, so they must be determined empirically by the networkdesigner [14]. In this paper, we choose one hidden layer withseven neurons, which has the best performance.
In (5), x, wk, and bx denote the input vector, the weightvector for the hidden neuron k, and the bias, respectively. Inthis work, we use the ReLU function3 φ(·) as the activationfunction. The ReLU function is defined as
φ(x) = max(0, x). (6)
The gradient of this function is always 1 when x ≥ 0 and0 otherwise. The ReLU function is a good solution to solvethe vanishing gradient problem since the error at each layeris effectively delivered to the previous layer. Therefore, anANN can be trained well with the BP algorithm without thevanishing gradient problem [15].
The error is defined by the difference between the outputvalue y and the target value l, it is given by
E(w) = |y(x)− l|2. (7)
Training the ANN means that adjusting the weights to mini-mize E(w). To this end, we use the gradient descent methodas a BP algorithm. That is,
w(t + 1) = w(t)− η dEdw
, (8)
where η is the learning rate, and it is 0.01 in this work.
B. Input Data Selection
To get a good performance in ANN, it is very important todecide input data combination [8]. In this work, to forecastthe total building load, the one day before total building loadfor 24 hours, the temperature, and the small-scale load areconsidered as the input data. A detailed explanation of theselected input data is as follows.• Total building load: The load pattern of today is similar
to that for the previous day in general, so the one daybefore (D-1) total building loads for 24-hour is selectedas input data. [24 inputs]
• Temperature: Among the weather data, temperatureshows the highest correlation to the power load, espe-cially in summer and winter seasons. We use six tem-perature data that are average, minimum, and maximum
2We choose seven hidden neurons in this work.3Typical activation functions include step function, sigmoid function and
ReLU function.

Fig. 3. The proposed ANN-based short-term load forecasting model forcampus building
temperatures for D-1 and D day. Note that temperaturedata for D day is forecasted one. [6 inputs]
• Small-scale loads (regular): The 31 small-scale loadsin the regular pattern cluster are highly correlated to thetotal load. Therefore, we use the summation of the 31regular small-scale loads as input data. [24 inputs]
• Small-scale loads (on-off): The six small-scale loads inthe on-off pattern cluster are also used as input data. Toreflect the impact of the on-off load on the total load, weuse a binary value per a small-scale load which has 0 and1 when the load is off and on for the day, respectively.[6 inputs]
C. Normalization
The ranges of input data are very different. For instance,temperature changes about from -10 to 35 oC while thebuilding load changes from 100,000 Wh to 600,000 Wh.Therefore, we use normalized data for training. There areseveral normalization methods such as min-max and Z-scoremethods. We use the Z-score normalization method sincethis method shows better forecasting result than the min-maxmethod. The Z-score method for the input data x is formallydefined as
Zx =x− µx
σx, (9)
where µx and σx denote the average and variance of the wholeinput data during the training period, respectively.
D. Load Forecasting Model
The proposed ANN-based short-term load forecastingmodel predicts day-ahead hourly load. That is, the outputof the ANN is 24 hours load for D-day. The structure ofthe proposed forecasting model is shown in Fig. 3. Thereis one hidden layer and the number of hidden nodes in thehidden layer is seven [5]. We propose five forecasting modelto investigate the effect of input data selection.• Case 1: 24-hour total building load of D-1 day (24 input
nodes)• Case 2: Case 1 + three temperature data (average, mini-
mum, and maximum temperatures) of D-1 day and D day(30 input nodes).
• Case 3: Case 2 + 24-hour regular loads of D-1 day (54input nodes).
Fig. 4. Training and forecasting procedure.
TABLE IFORECASTING PERFORMANCE FOR FIVE MONTHS
Jan Apr Jun Aug Oct
MAPE 8.3544 6.1975 4.347 4.225 7.6316Case 1 CV 9.7287 8.6003 5.2824 5.2902 12.408
RMSE 27.112 20.328 17.347 15.96 28.79
MAPE 8.9894 6.0506 4.4717 4.2201 7.2298Case 2 CV 10.314 8.1480 5.2707 5.4217 11.719
RMSE 28.596 19.315 17.319 16.374 27.149
MAPE 8.2917 6.1923 4.3120 4.3369 7.0632Case 3 CV 9.6368 8.3959 5.1213 5.4371 11.485
RMSE 26.855 19.883 16.852 16.419 26.635
MAPE 8.4942 6.5405 4.4186 4.1029 7.9225Case 4 CV 9.6228 8.9241 5.2061 4.9694 13.128
RMSE 26.857 21.1 17.112 15.013 30.409
MAPE 8.6472 6.0708 4.4305 4.1961 7.4703Case 5 CV 9.9515 8.1679 5.3455 5.2701 12.022
RMSE 27.754 19.345 17.523 15.915 27.9
• Case 4: Case 2 + On/Off loads of D-1 day (36 inputnodes).
• Case 5: Case 2 + 24-hour regular loads of D-1 day +On/Off loads of D-1 day (60 input nodes).
Fig. 4 shows the training procedure for the proposed model.To train the ANN, we use four days which consist of oneto four days prior to the forecasted day (D-day), and thetraining data set is used sequentially. Among the four trainingdays, three days and one day are used for training and test,respectively. There are two reasons to use the four days astraining data. First, it is because the most recent data have themost similar pattern to D day. The other reason is that we onlyhave the building data set for one year. It is not easy to trainwell and to get a good forecasting performance for the ANNwith one year data.
IV. RESULTS AND DISCUSSION
In this section, we evaluate the performance of the proposedANN-based short-term load forecasting models in terms of themean absolute percentage error (MAPE), root mean squareerror (RMSE) and the coefficient of variation (CV)4.
Table I shows the forecasting performances of five monthsfor the five ANN models. The five months are selected asrepresentative months for the season, semester and vacation.Among the five ANN models, Case 3 generally shows goodperformance. The other four cases show back and forth result.For the best performing model in each month, those without
4The most commonly-used three evaluation indices [2].
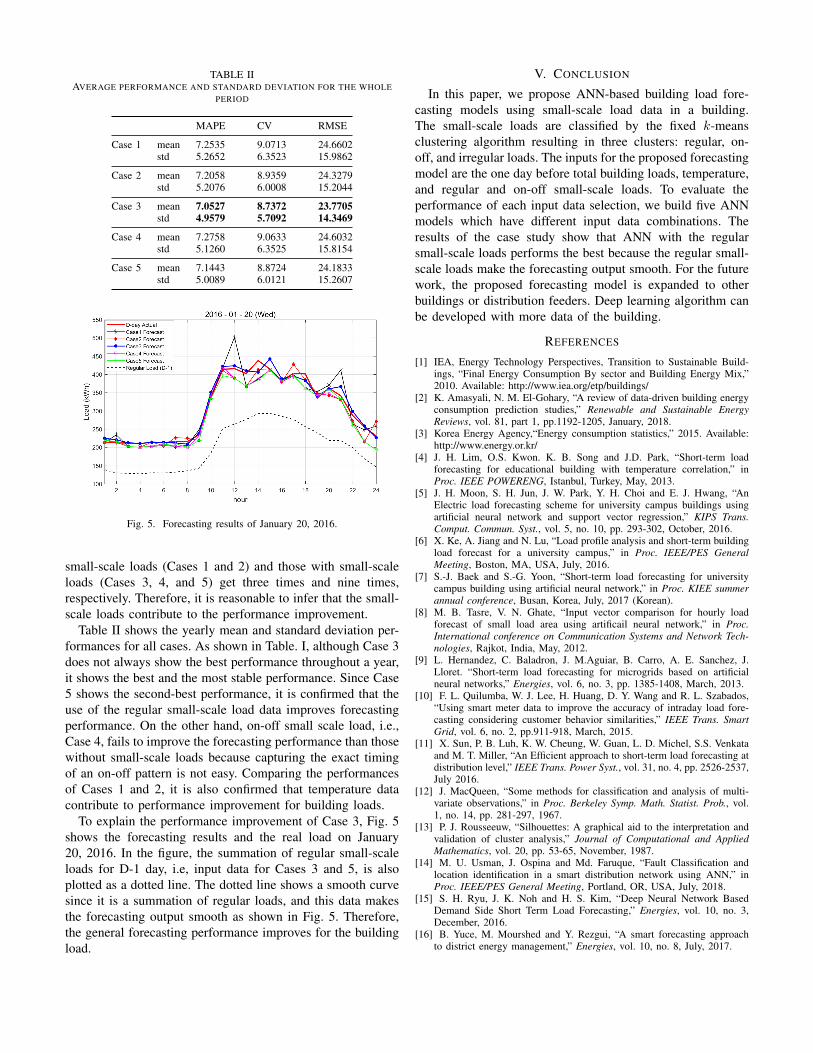
TABLE IIAVERAGE PERFORMANCE AND STANDARD DEVIATION FOR THE WHOLE
PERIOD
MAPE CV RMSE
Case 1 mean 7.2535 9.0713 24.6602std 5.2652 6.3523 15.9862
Case 2 mean 7.2058 8.9359 24.3279std 5.2076 6.0008 15.2044
Case 3 mean 7.0527 8.7372 23.7705std 4.9579 5.7092 14.3469
Case 4 mean 7.2758 9.0633 24.6032std 5.1260 6.3525 15.8154
Case 5 mean 7.1443 8.8724 24.1833std 5.0089 6.0121 15.2607
Fig. 5. Forecasting results of January 20, 2016.
small-scale loads (Cases 1 and 2) and those with small-scaleloads (Cases 3, 4, and 5) get three times and nine times,respectively. Therefore, it is reasonable to infer that the small-scale loads contribute to the performance improvement.
Table II shows the yearly mean and standard deviation per-formances for all cases. As shown in Table. I, although Case 3does not always show the best performance throughout a year,it shows the best and the most stable performance. Since Case5 shows the second-best performance, it is confirmed that theuse of the regular small-scale load data improves forecastingperformance. On the other hand, on-off small scale load, i.e.,Case 4, fails to improve the forecasting performance than thosewithout small-scale loads because capturing the exact timingof an on-off pattern is not easy. Comparing the performancesof Cases 1 and 2, it is also confirmed that temperature datacontribute to performance improvement for building loads.
To explain the performance improvement of Case 3, Fig. 5shows the forecasting results and the real load on January20, 2016. In the figure, the summation of regular small-scaleloads for D-1 day, i.e, input data for Cases 3 and 5, is alsoplotted as a dotted line. The dotted line shows a smooth curvesince it is a summation of regular loads, and this data makesthe forecasting output smooth as shown in Fig. 5. Therefore,the general forecasting performance improves for the buildingload.
V. CONCLUSION
In this paper, we propose ANN-based building load fore-casting models using small-scale load data in a building.The small-scale loads are classified by the fixed k-meansclustering algorithm resulting in three clusters: regular, on-off, and irregular loads. The inputs for the proposed forecastingmodel are the one day before total building loads, temperature,and regular and on-off small-scale loads. To evaluate theperformance of each input data selection, we build five ANNmodels which have different input data combinations. Theresults of the case study show that ANN with the regularsmall-scale loads performs the best because the regular small-scale loads make the forecasting output smooth. For the futurework, the proposed forecasting model is expanded to otherbuildings or distribution feeders. Deep learning algorithm canbe developed with more data of the building.
REFERENCES
[1] IEA, Energy Technology Perspectives, Transition to Sustainable Build-ings, “Final Energy Consumption By sector and Building Energy Mix,”2010. Available: http://www.iea.org/etp/buildings/
[2] K. Amasyali, N. M. El-Gohary, “A review of data-driven building energyconsumption prediction studies,” Renewable and Sustainable EnergyReviews, vol. 81, part 1, pp.1192-1205, January, 2018.
[3] Korea Energy Agency,“Energy consumption statistics,” 2015. Available:http://www.energy.or.kr/
[4] J. H. Lim, O.S. Kwon. K. B. Song and J.D. Park, “Short-term loadforecasting for educational building with temperature correlation,” inProc. IEEE POWERENG, Istanbul, Turkey, May, 2013.
[5] J. H. Moon, S. H. Jun, J. W. Park, Y. H. Choi and E. J. Hwang, “AnElectric load forecasting scheme for university campus buildings usingartificial neural network and support vector regression,” KIPS Trans.Comput. Commun. Syst., vol. 5, no. 10, pp. 293-302, October, 2016.
[6] X. Ke, A. Jiang and N. Lu, “Load profile analysis and short-term buildingload forecast for a university campus,” in Proc. IEEE/PES GeneralMeeting, Boston, MA, USA, July, 2016.
[7] S.-J. Baek and S.-G. Yoon, “Short-term load forecasting for universitycampus building using artificial neural network,” in Proc. KIEE summerannual conference, Busan, Korea, July, 2017 (Korean).
[8] M. B. Tasre, V. N. Ghate, “Input vector comparison for hourly loadforecast of small load area using artificail neural network,” in Proc.International conference on Communication Systems and Network Tech-nologies, Rajkot, India, May, 2012.
[9] L. Hernandez, C. Baladron, J. M.Aguiar, B. Carro, A. E. Sanchez, J.Lloret. “Short-term load forecasting for microgrids based on artificialneural networks,” Energies, vol. 6, no. 3, pp. 1385-1408, March, 2013.
[10] F. L. Quilumba, W. J. Lee, H. Huang, D. Y. Wang and R. L. Szabados,“Using smart meter data to improve the accuracy of intraday load fore-casting considering customer behavior similarities,” IEEE Trans. SmartGrid, vol. 6, no. 2, pp.911-918, March, 2015.
[11] X. Sun, P. B. Luh, K. W. Cheung, W. Guan, L. D. Michel, S.S. Venkataand M. T. Miller, “An Efficient approach to short-term load forecasting atdistribution level,” IEEE Trans. Power Syst., vol. 31, no. 4, pp. 2526-2537,July 2016.
[12] J. MacQueen, “Some methods for classification and analysis of multi-variate observations,” in Proc. Berkeley Symp. Math. Statist. Prob., vol.1, no. 14, pp. 281-297, 1967.
[13] P. J. Rousseeuw, “Silhouettes: A graphical aid to the interpretation andvalidation of cluster analysis,” Journal of Computational and AppliedMathematics, vol. 20, pp. 53-65, November, 1987.
[14] M. U. Usman, J. Ospina and Md. Faruque, “Fault Classification andlocation identification in a smart distribution network using ANN,” inProc. IEEE/PES General Meeting, Portland, OR, USA, July, 2018.
[15] S. H. Ryu, J. K. Noh and H. S. Kim, “Deep Neural Network BasedDemand Side Short Term Load Forecasting,” Energies, vol. 10, no. 3,December, 2016.
[16] B. Yuce, M. Mourshed and Y. Rezgui, “A smart forecasting approachto district energy management,” Energies, vol. 10, no. 8, July, 2017.