should the government fight recessions with spending hikes or tax cuts
DESCRIPTION
it is in favour that support the fact that government should support hike in spending in order to fight with recessionTRANSCRIPT

Should the Government Fight Recessions with Spending Hikes or Tax Cuts..??
ECONOMICS PROJECT
Presented By:Ankit Mahajan 12PGDM011Anuj Kumar 12PGDM012Apoorva Verma 12PGDM013Ariyama Yadav 12PGDM014

FAVOURArguments for fighting recessions with spending


What is recession
• A Recession is a contraction phase of the business cycle.
• National Bureau of Economic Research (NBER)• is the official agency in charge of declaring that
the economy is in a state of recession.• They define recession as :“significant decline in
economic activity lasting more than a few months, which is normally visible in real GDP, real income, employment, industrial production, and wholesale-retail sales”.
• For this reason, the official designation of recession may not come until after
• we are in a recession for six months or longer.

What Causes Recession ? An economy typically expands for 6-10
years and tends to go into a recession for about
six months to 2 years A recession normally takes place when
consumers loose confidence in the growth of the economy and spend less.
This leads to a decreased demand for goods and services, which in turn leads to a decrease in production, lay-offs and a sharp rise in unemployment
Investors spend less as they fear stocks values will fall and thus stock markets fall on negative sentiment.

US Crisis Hits India….
• US Crisis Hits India• US faced major crisis because of - Subprime
mortgage crisis (home loan defaults)• Rising oil prices at $100 a barrel• Global Inflation• High unemployment rates• A declining dollar value• All this slowed down the growth of the
economy and as the GDP growth rate fell to 2%, recession set in.

Total Expenditure And Revenue Of The Central Government
Years Total Expenditure (Rs. Crores)
2005-06 501083
2006-07 570185
2007-08 688909
2008-09 864530
2009-10(RE) 1005298
2009-11(BE) 1079955
Years TAX REVENUE(Rs. Crores)
2005-06 665280
2006-07 736708
2007-08 870329
2008-09 915450
2009-10(RE) 996884
2009-11(BE) 1160267
Source: Ministry of Finance, Government of India

Total Expenditure (Rs.crore)
2005-06 2006-07 2007-08 2008-09 2009-10(RE)
2009-11(BE)
0
200000
400000
600000
800000
1000000
1200000 Total Expenditure (Rs. Crores)

Tax Revenue
2005-06
2006-07
2007-08
2008-09
2009-10(RE)
2009-11(BE)
0
200000
400000
600000
800000
1000000
1200000
1400000TAX REVENUE

OPERATIONS OF ROAD TRANSPORT
Years 2004-05 2006-07 2007-08
Length of roads 3929.4 4140.5 4236.4
Length of national highways 65.6 66.6 66.8
Length of state highways 144.4 152.2 154.5
Source : Department of Road Transport & Highways.# Includes roads constructed under the Pradhan Mantri Gram Sadak Yojana (PMGSY) since December 2000 and erstwhile Jawahar RozgarYojana (JRY) of the 1990s.
Length of roads(Thousand km)
36003800400042004400
2004-5
2006-07
2007-08

Defence and subsidies
2005-2006 2006-07 2007-08 2008-09 2009-2010(BE)
2009-2010(PE)
2010-2011(BE)
Major subsidies
44480 53495 67498 123581 106004 123396 109092
Defene expenditue
48211 51682 54219 73305 86879 90668 87344
Source: Ministry of Finance, Government of India
Major subsidies Defene expenditure 0
20000400006000080000
100000120000140000
2005-20062006-072007-082008-092009-2010(BE)2009-2010(PE)2010-2011(BE)Series 8
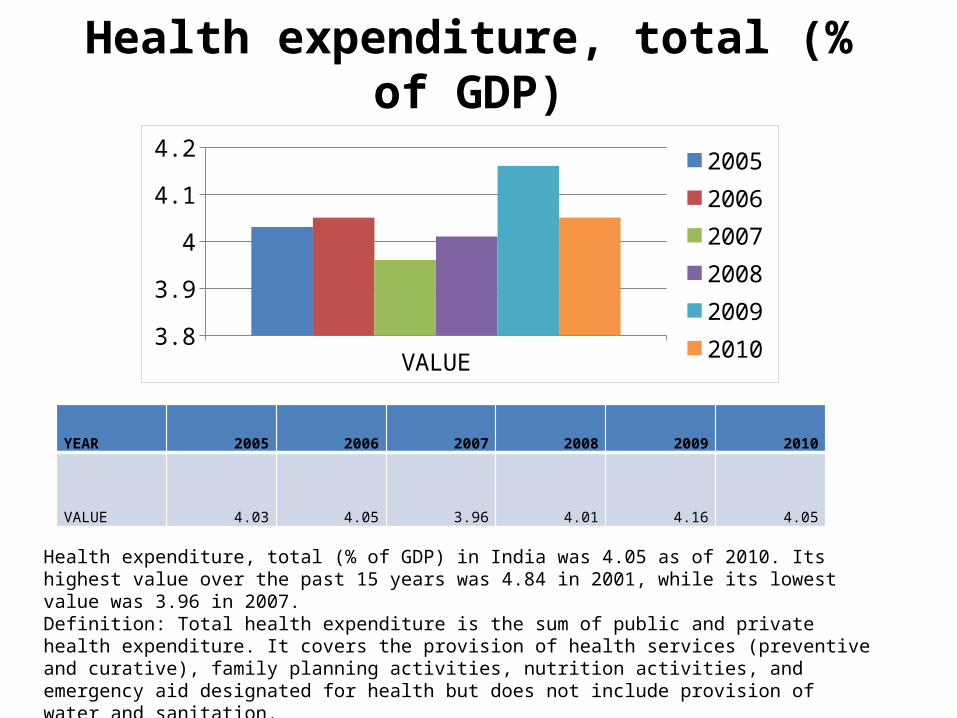
Health expenditure, total (% of GDP)
YEAR 2005 2006 2007 2008 2009 2010
VALUE 4.03 4.05 3.96 4.01 4.16 4.05
Health expenditure, total (% of GDP) in India was 4.05 as of 2010. Its highest value over the past 15 years was 4.84 in 2001, while its lowest value was 3.96 in 2007.Definition: Total health expenditure is the sum of public and private health expenditure. It covers the provision of health services (preventive and curative), family planning activities, nutrition activities, and emergency aid designated for health but does not include provision of water and sanitation.Source: World Health Organization National Health Account database (see http://apps.who.int/nha/database for the most recent updates).
VALUE3.85
3.93.95
44.05
4.14.15
4.2
200520062007200820092010

EMPLOYMENT IN ORGANISED SECTORS—PUBLIC AND PRIVATE
2005 2006 2007 2008 2009 2010public SECTOR(1) 180.07 181.88 180.02 176.74 177.95 178.62PRIVATE SECTOR(2) 84.52 88.05 92.74 98.75 103.77 108.46TOTAL(1+2) 264.58 269.93 272.76 275.49 281.72 287.08
(Lakh persons as on 31 March)Source: Ministry of Finance, Government of India
TOTAL250255260265270275280285290
200520062007200820092010

Under the NREGA, which is a major rural employment initiative, during the year 2009-10, 4.34 crore households have been provided employment so far. Out of the 182.88 crore person days created under the scheme during this period…

(MGNREGA) is an Indian job guarantee scheme, enacted by legislation on August 25, 2005.MGNREGA started with an initial outlay of $2.5bn(Rs 11300cr) in year 2006–07.The funding has considerably been increased as shown in the table below
Year Total Outlay(TO) Wage Expenditure(Percent of TO)
2006–07 $2.5bn 66
2007–08 $2.6bn 68
2008–09 $6.6bn 67
2009–10 $8.68bn 70
2010–11 $8.91bn 71

Pay arrears are due from January 2006 till September 2008. Almost all the Government employees received 40% of the pay arrears in 2008 and balance 60% arrears (as promised by Government) has also been credited in Government employees account in 2009. The Sixth Pay Commission mainly focused on removing ambiguity in respect of various pay scales and mainly focused on reducing number of pay scales and bring the idea of pay bands. It recommended for removal of Group-D cadre.

GDP % PER YEAR
2005-06
2006-07
2007-08
2008-09
2009-2010
2010-2011
2011-2012
0
2
4
6
8
10
12
%GDP
%GDP
Source: Ministry of Finance, Government of India
YEAR 2005-06 2007-08 2008-09 2009-2010 2010-2011 2011-2012
%GDP 9.5 9.6 9.3 6.7 8.4 86.9

So we can see that the Indian Government has increased the spending in order to come out of recession…..
