show all work below. name - …€¦ · web viewalgebra 1 teachers. weekly assessment package. unit...
TRANSCRIPT

Show all work below. Name _________________________
Algebra 1 TeachersWeekly Assessment Package
Unit 4
Created by: Jeanette Stein
©2018 HighSchoolMathTeachers
1 Unit 4 | Algebra 1 Weekly Assessments | ©2018 HighSchoolMathTeachers

Show all work below. Name _________________________
Semester 1 Skills 3
UNIT 4 5
WEEK #11 6WEEK #12 8WEEK #13 11
UNIT 4 - KEYS 13
WEEK #11 KEY 14WEEK #12 KEY 16WEEK #13 KEY 19
2 Unit 4 | Algebra 1 Weekly Assessments | ©2018 HighSchoolMathTeachers
Show all work below. Name _________________________
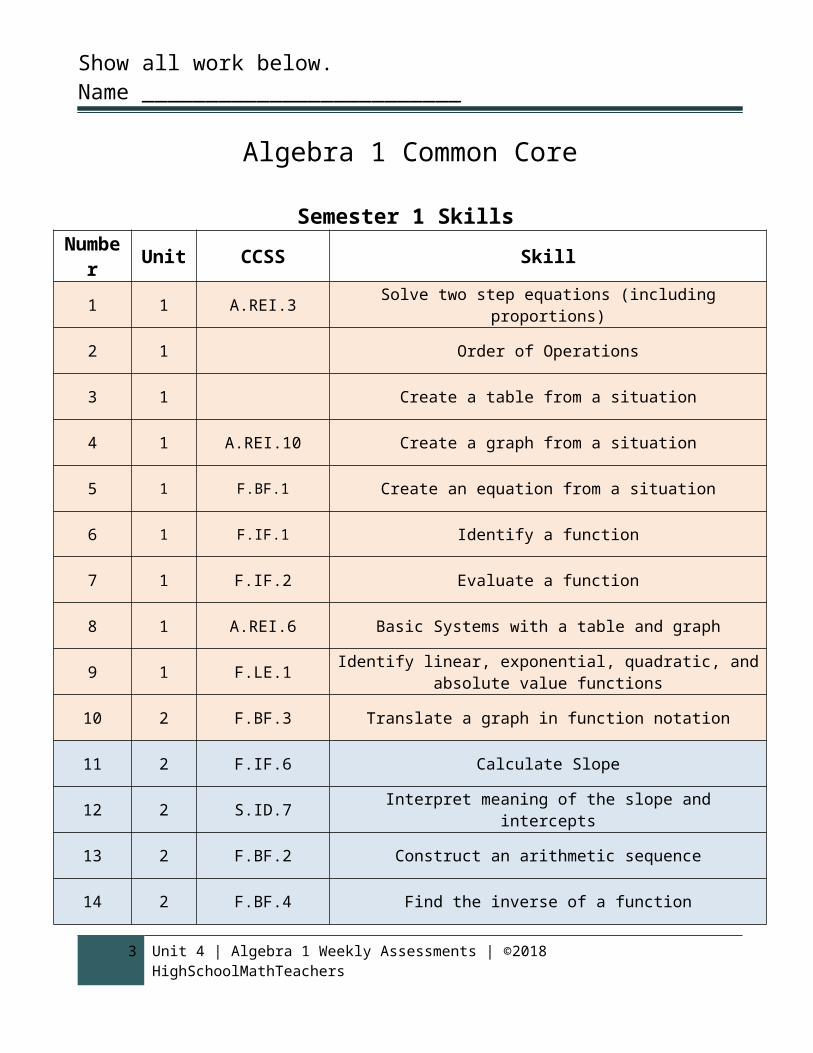
Algebra 1 Common Core
Semester 1 SkillsNumbe
r Unit CCSS Skill
1 1 A.REI.3 Solve two step equations (including proportions)
2 1 Order of Operations
3 1 Create a table from a situation
4 1 A.REI.10 Create a graph from a situation
5 1 F.BF.1 Create an equation from a situation
6 1 F.IF.1 Identify a function
7 1 F.IF.2 Evaluate a function
8 1 A.REI.6 Basic Systems with a table and graph
9 1 F.LE.1 Identify linear, exponential, quadratic, and absolute value functions
10 2 F.BF.3 Translate a graph in function notation
11 2 F.IF.6 Calculate Slope
12 2 S.ID.7 Interpret meaning of the slope and intercepts
13 2 F.BF.2 Construct an arithmetic sequence
14 2 F.BF.4 Find the inverse of a function
3 Unit 4 | Algebra 1 Weekly Assessments | ©2018 HighSchoolMathTeachers
Show all work below. Name _________________________
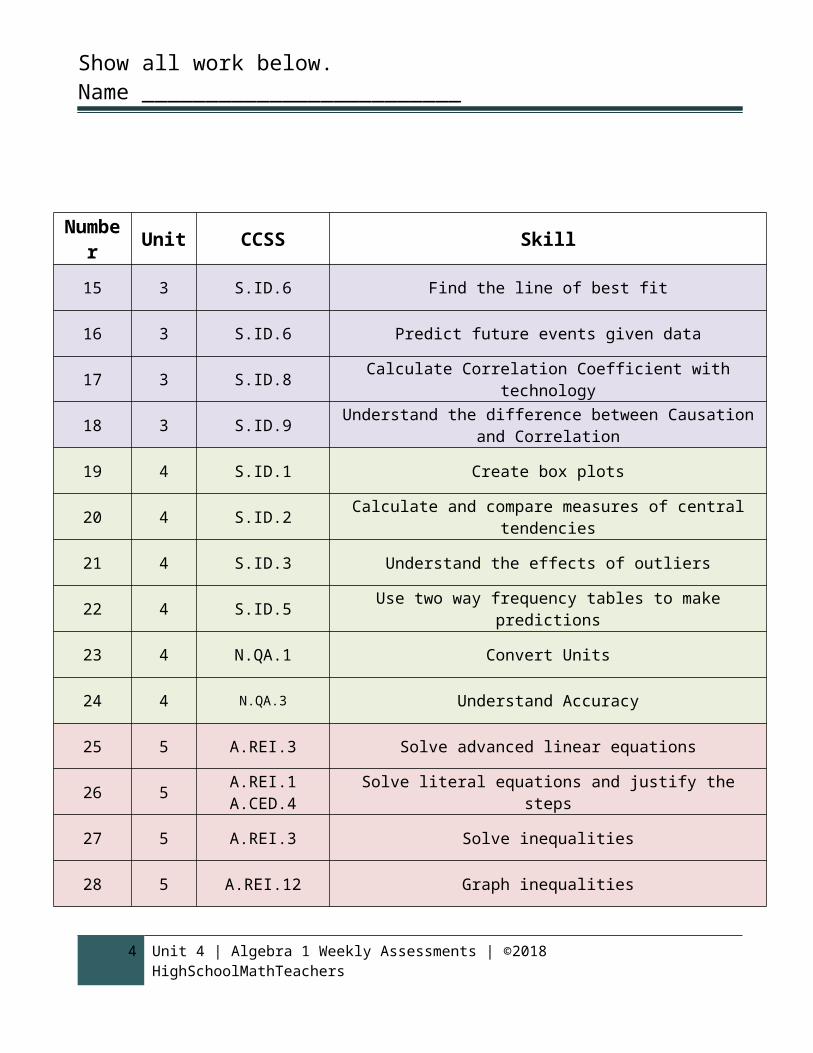
Number Unit CCSS Skill
15 3 S.ID.6 Find the line of best fit
16 3 S.ID.6 Predict future events given data
17 3 S.ID.8 Calculate Correlation Coefficient with technology
18 3 S.ID.9 Understand the difference between Causation and Correlation
19 4 S.ID.1 Create box plots
20 4 S.ID.2 Calculate and compare measures of central tendencies
21 4 S.ID.3 Understand the effects of outliers
22 4 S.ID.5 Use two way frequency tables to make predictions
23 4 N.QA.1 Convert Units
24 4 N.QA.3 Understand Accuracy
25 5 A.REI.3 Solve advanced linear equations
26 5 A.REI.1 A.CED.4 Solve literal equations and justify the steps
27 5 A.REI.3 Solve inequalities
28 5 A.REI.12 Graph inequalities
29 6 A.REI.6 Solve a system of equations by graphing
30 6 A.REI.6 Solve a system of equations by substitution
31 6 A.REI.5 Solve a system of equations by elimination
4 Unit 4 | Algebra 1 Weekly Assessments | ©2018 HighSchoolMathTeachers

Show all work below. Name _________________________
Unit 4Weekly Assessments
5 Unit 4 | Algebra 1 Weekly Assessments | ©2018 HighSchoolMathTeachers

Show all work below. Name _________________________
Week #111. Determine the standard deviation of the following data.34, 23, 45, 33, 38, 35, 34, 30, 37, 362. For the group data 4, 4, 6, 10, 13, what is the relationship between the mean and median?
3. Create a box plot for the given data. 21, 20, 5, 18, 7, 16, 8, 5, 22, 19, 12, 9, 8, 20, 20
6 Unit 4 | Algebra 1 Weekly Assessments | ©2018 HighSchoolMathTeachers

Show all work below. Name _________________________
4. Find the rate of change between 1980 and 2009 of the given data. Write your answers as a full sentence.The National Data Book
Number of dropouts (1,000)1980 1990 1995 2000 2001 2002 2003 2004 2005 2006 2007 2008 200916 to 17 years 709 418 406 460 399 346 323 452 303 464 448 416 452
http://www.census.gov/compendia/statab/cats/education/elementary_and_secondary_education_completions_and_dropouts.html5. Predict how much money the average household will spend on clothes in 2020.
http://www.census.gov/compendia/statab/cats/income_expenditures_poverty_wealth.html7 Unit 4 | Algebra 1 Weekly Assessments | ©2018 HighSchoolMathTeachers

Show all work below. Name _________________________
8 Unit 4 | Algebra 1 Weekly Assessments | ©2018 HighSchoolMathTeachers

Show all work below. Name _________________________
Week #121. Emma’s first test scores were 80%, 84%, 95%, and 82%. Which of the following test scores would result in the greatest difference in Emma’s mean score?a. 50%b. 70%c. 85%d. 100%2. Your grades are graphed below.
Semester 1 Grades: Semester 2 Grades:
The median has changed from _______to_______.The upper quartile has changed from _______to _______.The lower quartile has changed from _______ to _______.What can you conclude about your grades? Can you conclude that every grade dropped?_____________________________________________________________________________________________________________________________________________________________________________________________________________________________________________________________________________________________________________________________________________________________________________
9 Unit 4 | Algebra 1 Weekly Assessments | ©2018 HighSchoolMathTeachers

Show all work below. Name _________________________
Week #12 Continued3.
0
2
4
6
100 95 90 85 80
2
1
6
5
4
What is the median grade? ___________What is the mean grade? __________
4. A public opinion survey explored the relationship between age and support for increasing the minimum wage.For Against No opinion Total
21 - 40 25 20 5 5041 - 60 20 35 20 75Over 60 55 15 5 75Total 100 70 30 200
In the 21 to 40 age group, what percentage supports increasing the minimum wage?
http://stattrek.com/statistics/two-way-table.aspx
10 Unit 4 | Algebra 1 Weekly Assessments | ©2018 HighSchoolMathTeachers

Show all work below. Name _________________________
Use the graph below to answer the questions.
0
5
10
15
0
5. Calculate the line of best fit.
11 Unit 4 | Algebra 1 Weekly Assessments | ©2018 HighSchoolMathTeachers

Show all work below. Name _________________________
Week #13
1. Which number is more precise? A. 40.67 feet B. 8.632 feetExplain:
2. What percent of students that studied between 2 and 4 hours earned higher than a 75% on the test?Hours spent studying Test Score TOTAL0 - 25 26 - 50 51 - 75 76 - 1000 - 2 2 8 12 2 242 - 4 0 10 8 24 424 - 6 1 0 2 9 126 + 0 0 1 4 5TOTAL 3 18 23 39 83
3. Identify the outlier in the data below. Find the mean of the population of the 7 largest cities in the United States with and without the outlier. How does the outlier change the mean?City, State Population(Millions)New York, NY 8.1Los Angeles, CA 3.8Chicago, IL 2.7Houston, TX 2.1Philadelphia, PA 1.5Phoenix, AZ 1.4San Antonio, TX 1.3
Outlier: _______________________________________________________________Mean population with outlier: _____________________________________Mean population without outlier:
12 Unit 4 | Algebra 1 Weekly Assessments | ©2018 HighSchoolMathTeachers

Show all work below. Name _________________________
_________________________________How does the outlier change the mean? ____________________________________________________________________________________________________
4. The speed of a giraffe is 50 km/h. If the giraffe continues at the same speed, after 2 hours, how many miles has the giraffe traveled? (Hint: 1 mile = 1.60934 kilometers)
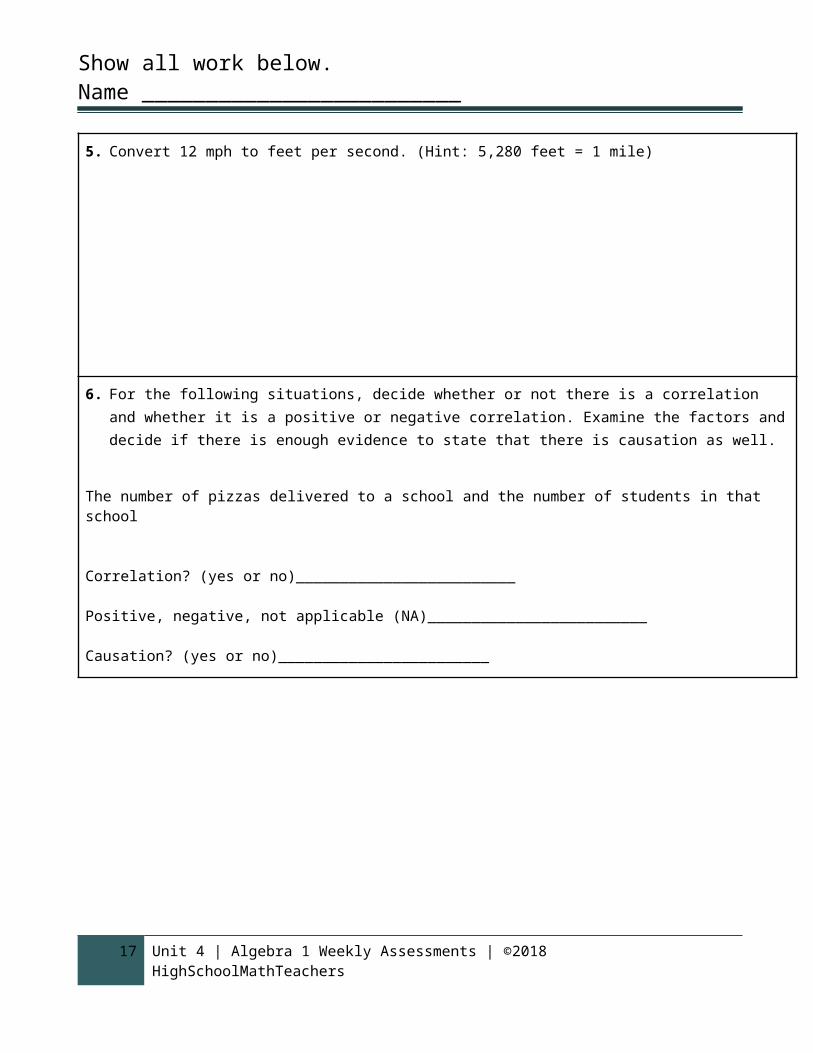
5. Convert 12 mph to feet per second. (Hint: 5,280 feet = 1 mile)
13 Unit 4 | Algebra 1 Weekly Assessments | ©2018 HighSchoolMathTeachers

Show all work below. Name _________________________
6. For the following situations, decide whether or not there is a correlation and whether it is a positive or negative correlation. Examine the factors and decide if there is enough evidence to state that there is causation as well. The number of pizzas delivered to a school and the number of students in that schoolCorrelation? (yes or no)_________________________Positive, negative, not applicable (NA)_________________________Causation? (yes or no)________________________
Unit 4 - KEYSWeekly Assessments
14 Unit 4 | Algebra 1 Weekly Assessments | ©2018 HighSchoolMathTeachers

Show all work below. Name _________________________
Week #11 Key1. Determine the standard deviation of the following data.34, 23, 45, 33, 38, 35, 34, 30, 37, 36
6.957
2. For the group data 4, 4, 6, 10, 13, what is the relationship between the mean and median?
Mean = 7.4Median = 6The mean is 1.4 greater than the median.
3. Create a box plot for the given data. 21, 20, 5, 18, 7, 16, 8, 5, 22, 19, 12, 9, 8, 20, 20
15 Unit 4 | Algebra 1 Weekly Assessments | ©2018 HighSchoolMathTeachers

Show all work below. Name _________________________
4. Find the rate of change between 1980 and 2009 of the given data. Write your answers as a full sentence.The National Data Book
Number of dropouts (1,000)1980 1990 1995 2000 2001 2002 2003 2004 2005 2006 2007 2008 200916 to 17 years 709 418 406 460 399 346 323 452 303 464 448 416 452542−7092009−1980
=−25729
≈−20
There are approximately 20 fewer dropouts per year from 1980 to 2009. http://www.census.gov/compendia/statab/cats/education/elementary_and_secondary_education_completions_and_dropouts.html5. Predict how much money the average household will spend on clothes in 2020.
≈ $2000
http://www.census.gov/compendia/statab/cats/income_expenditures_poverty_wealth.html16 Unit 4 | Algebra 1 Weekly Assessments | ©2018 HighSchoolMathTeachers
Show all work below. Name _________________________
17 Unit 4 | Algebra 1 Weekly Assessments | ©2018 HighSchoolMathTeachers

Show all work below. Name _________________________
Week #12 Key
1. Emma’s first test scores were 80%, 84%, 95%, and 82%. Which of the following test scores would result in the greatest difference in Emma’s mean score?a. 50%b. 70%c. 85%d. 100%2. Your grades are graphed below.
Semester 1 Grades: Semester 2 Grades:
The median has changed from __86__to__78___.The upper quartile has changed from _95____to __88___.The lower quartile has changed from _76____ to __71___.What can you conclude about your grades? Can you conclude that every grade dropped?Overall the grades have dropped. I cannot conclude that every grade dropped. Maybe one went up a lot and one when down a lot and they “switched places”.
18 Unit 4 | Algebra 1 Weekly Assessments | ©2018 HighSchoolMathTeachers

Show all work below. Name _________________________
3.
0
2
4
6
100 95 90 85 80
2
1
6
5
4
What is the median grade? __4______
What is the mean grade? __3.6______
4. A public opinion survey explored the relationship between age and support for increasing the minimum wage.
In the 21 to 40 age group, what percentage supports increasing the minimum wage?2550
=50%
http://stattrek.com/statistics/two-way-table.aspx
19 Unit 4 | Algebra 1 Weekly Assessments | ©2018 HighSchoolMathTeachers

Show all work below. Name _________________________
Use the graph below to answer the questions.
0
5
10
15
0
5. Calculate the line of best fit.y=x+2
20 Unit 4 | Algebra 1 Weekly Assessments | ©2018 HighSchoolMathTeachers

Show all work below. Name _________________________
Week #13 Key
1. Which number is more precise? A. 40.67 feet B. 8.632 feetExplain: Because the units are the same, the number of decimal places will determine which number is more precise.
2. What percent of students that studied between 2 and 4 hours earned higher than a 75% on the test?
2442≈57%
3. Identify the outlier in the data below. Find the mean of the population of the 7 largest cities in the United States with and without the outlier. How does the outlier change the mean?City, State Population(Millions)New York, NY 8.1Los Angeles, CA 3.8Chicago, IL 2.7Houston, TX 2.1Philadelphia, PA 1.5Phoenix, AZ 1.4San Antonio, TX 1.3
21 Unit 4 | Algebra 1 Weekly Assessments | ©2018 HighSchoolMathTeachers
Outlier: __New York, NY_____
Mean Population with Outlier: __≈3.0million_______
Mean Population without Outlier: __≈2.1million____

Show all work below. Name _________________________
How does the outlier change the mean? When removing the outlier the mean decreased by 0.9 million.4. The speed of a giraffe is 50 km/h. If the giraffe continues at the same speed, after 2 hours, how many miles has the giraffe traveled? (Hint: 1 mile = 1.60934 kilometers)
50km1hr
× 1hr1.60934 km
×2hr ≈62.1mi
5. Convert 12 mph to feet per second. (Hint: 5,280 feet = 1 mile)12mi1hr
× 1hr60min
× 1min60 sec
× 5280 ft1mi
=17.6 ft /sec
6. For the following situations, decide whether or not there is a correlation and whether it is a positive or negative correlation. Examine the factors and decide if there is enough evidence to state that there is causation as well. The number of pizzas delivered to a school and the number of students in that schoolCorrelation? (yes or no)_____yes______________Positive, negative, not applicable (NA)___positive____________Causation? (yes or no)______no_________________
22 Unit 4 | Algebra 1 Weekly Assessments | ©2018 HighSchoolMathTeachers

Show all work below. Name _________________________
23 Unit 4 | Algebra 1 Weekly Assessments | ©2018 HighSchoolMathTeachers