sierra nevada supplies california with ~40% of its water
TRANSCRIPT

Joshua H. Joshua H. ViersViers, Ph.D., Ph.D.Center for Watershed Sciences UC Da isCenter for Watershed Sciences UC Da isCenter for Watershed Sciences, UC DavisCenter for Watershed Sciences, UC Davis
30 April 2012California Energy Commission
DATE RECD.
DOCKET12-IEP-1C
APR 30 2012
MAY 03 2012
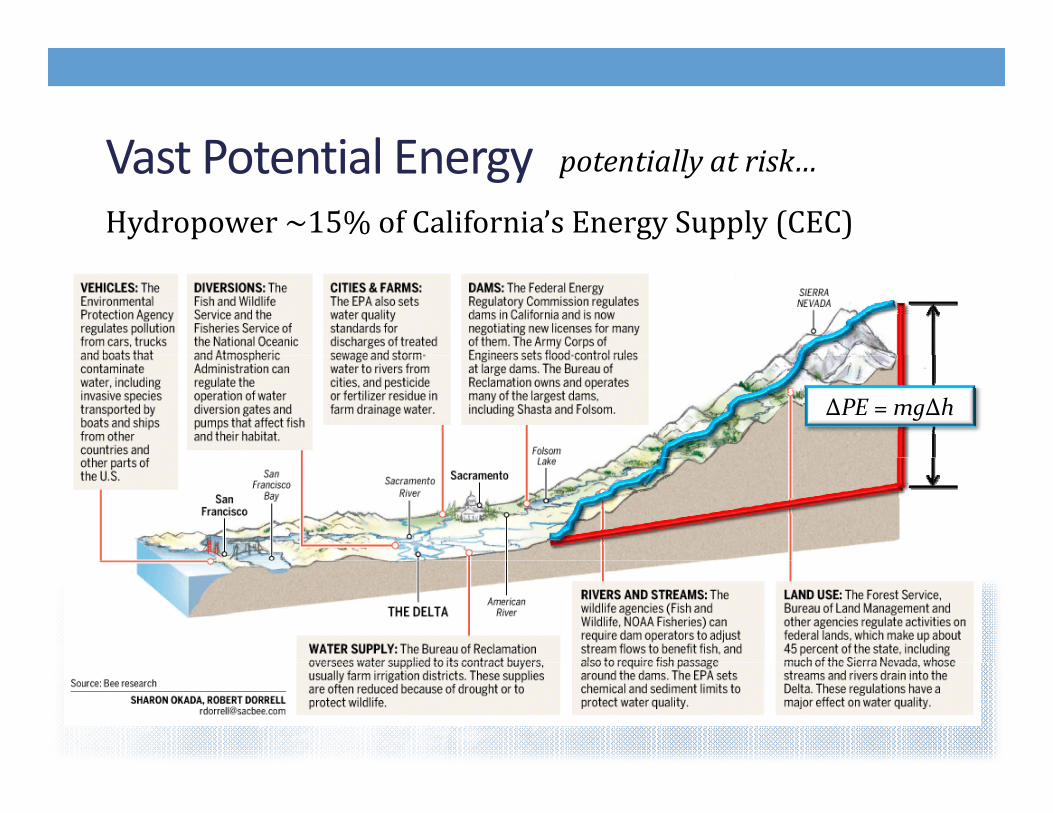
Vast Potential Energy ll kVast Potential Energy Hydropower ~15% of California’s Energy Supply (CEC)
potentially at risk…
ΔPE = mgΔh

Sierra Nevada supplies California with ~40% of its water supply and generates ~50% of its hydropower.

Change is taking place regionally, albeit with uncertainty at fine temporal and spatial scales Milly et al. 2008
Progressive negative shift in onset of spring snowmelt pulse
Negative shift in center of mass
Regional increase in average annual air temperatureg g p
Continued intra‐ and inter‐annual variability in precipitation

Water year type distributions are expected to push to extremes.
• San Joaquin Valley Index• A2 and B1 SRESA2 and B1 SRES • 6 GCMs
• CNRM CM3• GFDL CM2.1• CCSR MIROC 3.2CCSR MIROC 3.2• MPI‐OM ECHAM5• NCAR CCSM3.0• NCAP PCM1
• BCSD VIC streamflowBCSD VIC streamflow estimates
Null & Viers In Review Nature Climate Change

Impact of Hydroclimatic
Recent Research focusing on Sierra NevadaHydroclimaticAlteration on Hydropower Resources
Macro• Medellín‐Azuara et al. 2009• Madani & Lund 2010
All FacilitiesAnnual SummariesCoarse Operations
Resources
Research Findings:
Total energy produced is mostly
Madani & Lund 2010• Null et al. 2010
Total energy produced is mostly linear in response to total resource availability (i.e., less water = less energy).
Meso• Vicuña et al. 2011• Mehta et al. 2011
Many FacilitiesSeasonal SummariesContigent Operations
Timing and amount of resource is critical for infrastructure and operations to compensate for alteration in resource availability.
• Rheinheimer et al. In Review
Adaptation is possible, but contingent resource demands make it difficult to meet all needs and maintain generation levels.
Micro• Olivares 2008• Rheinheimer et al In Prep
Limited FacilitiesRefined TimestepsSeasonal Operations
and maintain generation levels. • Rheinheimer et al. In Prep

1800
MW
)
FEAKNG
a)
Null SE, Viers JH, Mount JF (2010) Hydrologic Response and Watershed Sensitivity to Climate Warming in California's Sierra Nevada. PLoS ONE 5(4): e9932.
450
900
1350
ropo
wer
Cap
acity
(MYUB
STN
TUO
AMR SJN
Valu
+2°
00 1 2 3 4 5 6 7
Hyd
r
Change in Centroid Timing (wk)
MOKBARCOS MERKAWCAL KRN TUL
e (-) Vulnerability (+)
1800
W)
FEA KNG
b)
ming
er 20 WYs
450
900
1350
pow
er C
apac
ity (M
W
YUB
STN
TUO
FEA
AMR SJNValuor
m Warm
sponse ove
+4°
0
450
0 1 2 3 4 5 6 7
Hyd
rop
Change in Centroid Timing (wk)
MOKBARCOS MERKAWCAL
KRNTUL
ue (-) Vulnerability (+)
1800
W) (+)FEA KNG
c)
Unifo
Average re
450
900
1350
pow
er C
apac
ity (M
W (+)
YUB
STN
TUO
FEA
AMR SJNValue
(-) Vulnerability (+) (-)
A
+6°
0
450
0 1 2 3 4 5 6 7
Hyd
rop
Change in Centroid Timing (wk)
MOKBARCOS MERKAWCAL KRN TUL
( ) Vulnerability (+) ( )

lVicuña et al. 2011
average of results over 1984-1998 period under four climate scenariosMadani & Lund 2010
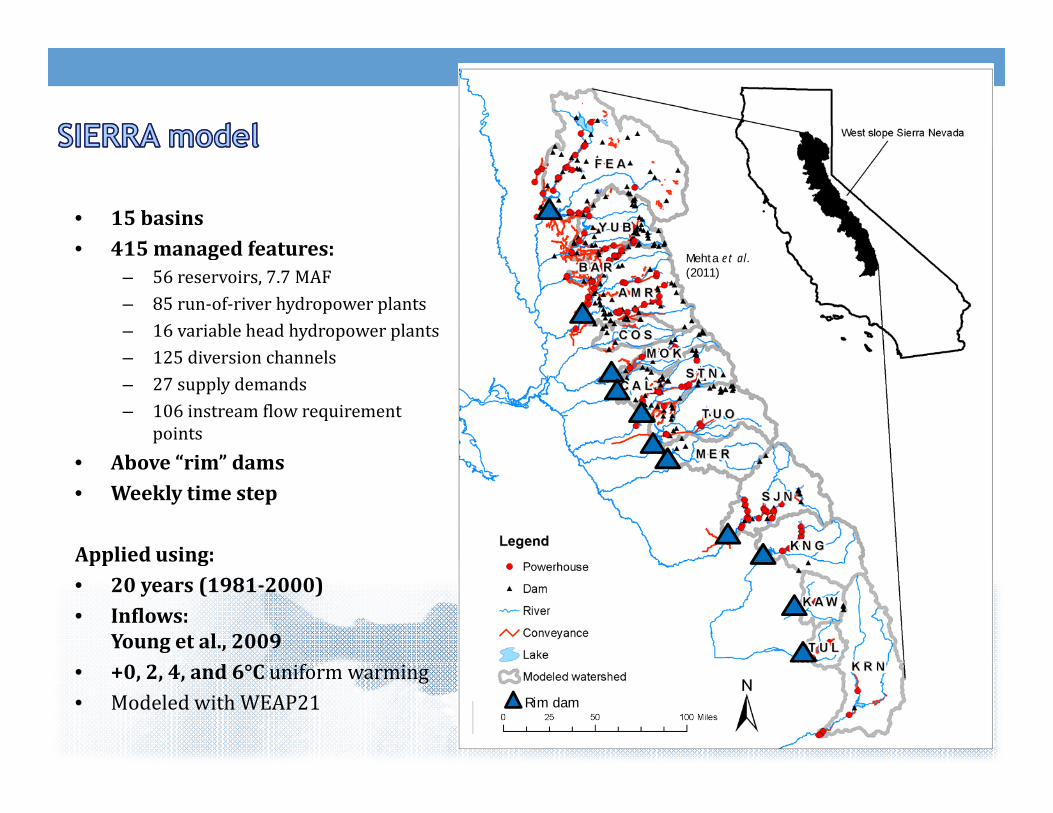
• 15 basins• 415 managed features:415 managed features:
– 56 reservoirs, 7.7 MAF– 85 run‐of‐river hydropower plants– 16 variable head hydropower plants
125 diversion channels
Mehta et al.(2011)
– 125 diversion channels– 27 supply demands– 106 instream flow requirement
pointsAb “ i ” d• Above “rim” dams
• Weekly time step
Applied using:Applied using:• 20 years (19812000)• Inflows:
Young et al., 2009• +0, 2, 4, and 6°C uniform warming• Modeled with WEAP21 Rim dam

Change inWeekly GenerationChange in Weekly Generation
Rheinheimer, Viers, et al. In Revision
Mean weekly system wide energy generation with warming.

Seasonal andAnnual Changes inGenerationSeasonal and Annual Changes in Generation
Figure 11: Seasonal and annual hydropower generation with warming.
Generation Warming scenario OND (Fall) JFM (Winter) AMJ (Spring) JAS (Summer) AnnualTotal (GWh) dT0 3,157 4,271 6,584 4,724 18,735 dT2 3,066 4,902 6,268 4,089 18,325
dT4 2 969 5 334 5 785 3 548 17 636
Generation Warming scenario OND (Fall) JFM (Winter) AMJ (Spring) JAS (Summer) AnnualTotal (GWh) dT0 3,157 4,271 6,584 4,724 18,735 dT2 3,066 4,902 6,268 4,089 18,325
dT4 2 969 5 334 5 785 3 548 17 636 dT4 2,969 5,334 5,785 3,548 17,636 dT6 2,897 5,662 5,298 3,177 17,033Change (GWh) dT0 -- -- -- -- -- dT2 -91 631 -316 -635 -410 dT4 -188 1,063 -799 -1,176 -1,100 dT6 -260 1,391 -1,286 -1,547 -1,702Change (%) dT0 -- -- -- -- -- dT2 -3% 15% -5% -13% -2% dT4 -6% 25% -12% -25% -6%
dT4 2,969 5,334 5,785 3,548 17,636 dT6 2,897 5,662 5,298 3,177 17,033Change (GWh) dT0 -- -- -- -- -- dT2 -91 631 -316 -635 -410 dT4 -188 1,063 -799 -1,176 -1,100 dT6 -260 1,391 -1,286 -1,547 -1,702Change (%) dT0 -- -- -- -- -- dT2 -3% 15% -5% -13% -2% dT4 -6% 25% -12% -25% -6%
11
dT6 -8% 33% -20% -33% -9% dT6 -8% 33% -20% -33% -9% dT4 6% 25% 12% 25% 6%dT6 -8% 33% -20% -33% -9% dT4 6% 25% 12% 25% 6%dT6 -8% 33% -20% -33% -9%
Rheinheimer, Viers, et al. In Revision

FERC (Re)Licensing in the coming decades…( ) g g
~60% of licenses remain up for renewal by 2050.
14
p y
14
75
2000‐20102010‐2020
10
52010 20202020‐20302030‐20402040‐2050
16
Hydropower is also a renewable source of energy that does not emit greenhouse gases through generation, and presently contributes to 15% of California’s total power system supply (California Energy Commission, 2008).
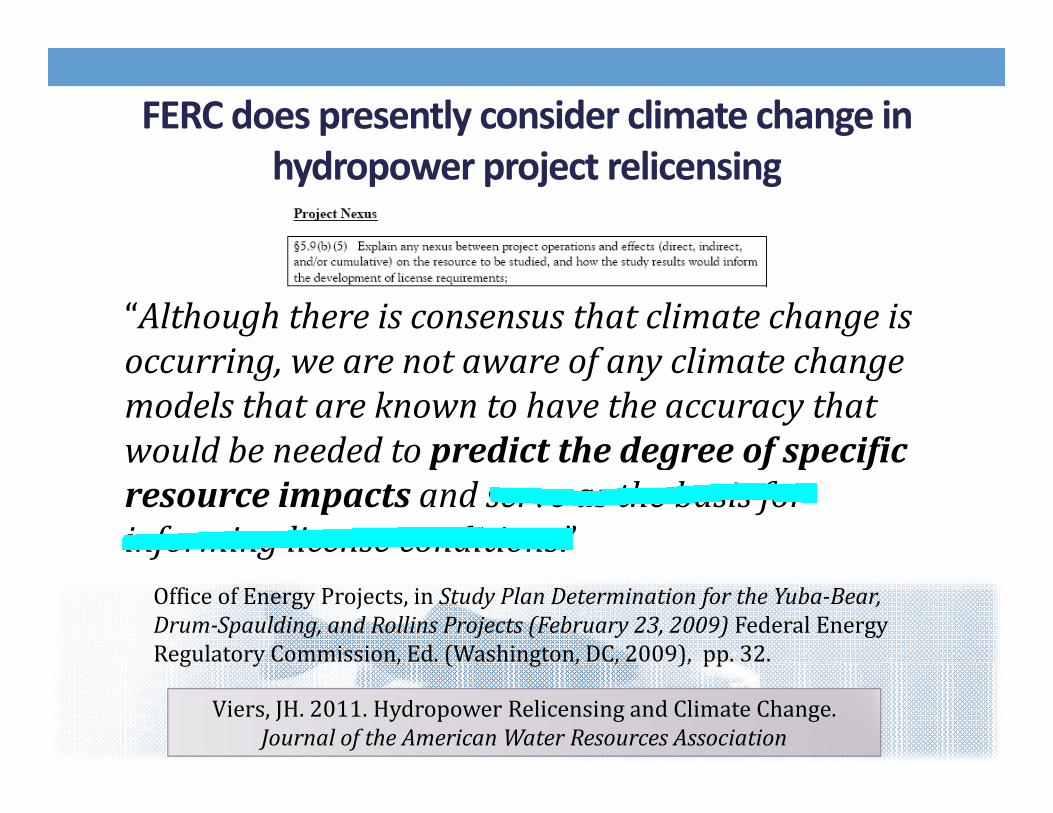
FERC does presently consider climate change in hydropower project relicensing
“Although there is consensus that climate change is occ rring e are not a are of an climate changeoccurring, we are not aware of any climate change models that are known to have the accuracy that would be needed to predict the degree of specificwould be needed to predict the degree of specific resource impacts and serve as the basis for informing license conditions.” Office of Energy Projects, in Study Plan Determination for the YubaBear, DrumSpaulding, and Rollins Projects (February 23, 2009) Federal Energy Regulatory Commission, Ed. (Washington, DC, 2009), pp. 32.g y , ( g , , ), pp
Viers, JH. 2011. Hydropower Relicensing and Climate Change.Journal of the American Water Resources Association

PIER Case study:Yuba RiverWatershed
14NEPA | National Environmental Policy Act
Yuba River Watershed
Inflow to L. Spaulding(semi‐regulated)
Other inflow (regulated)
Spill L. Spaulding
Local inflow (unregulated)
Spaulding 1
Original South For(unused)
S th F k Y b R
Drum Canal toBear R.
Spaulding 2 PH
South Yuba Canal
Langs Crossing
South Fork Yuba R.
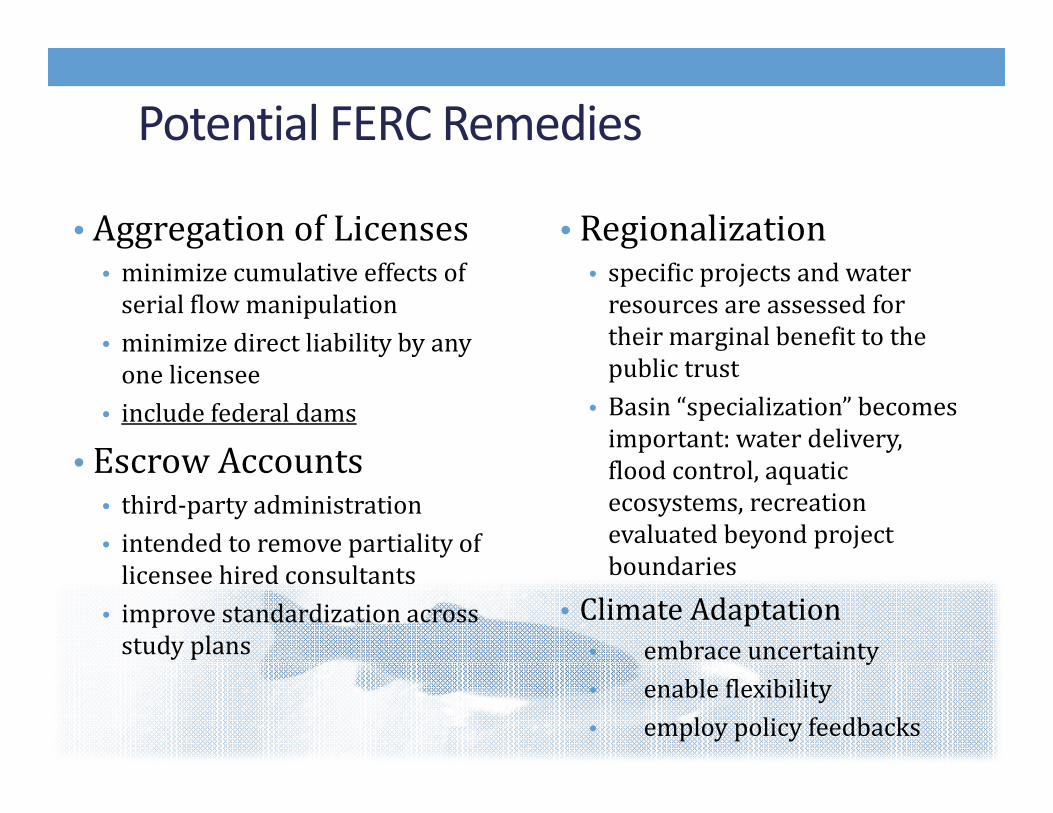
Potential FERC Remedies
• Regionalization• Aggregation of Licenses• specific projects and water resources are assessed for their marginal benefit to the
• minimize cumulative effects of serial flow manipulation
• minimize direct liability by any public trust
• Basin “specialization” becomes important: water delivery,
y y yone licensee
• include federal dams
• Escrow Accounts flood control, aquatic ecosystems, recreation evaluated beyond project b d i
• Escrow Accounts• third‐party administration• intended to remove partiality of
boundaries
• Climate Adaptation• embrace uncertainty
licensee hired consultants• improve standardization across study plans y
• enable flexibility• employ policy feedbacks
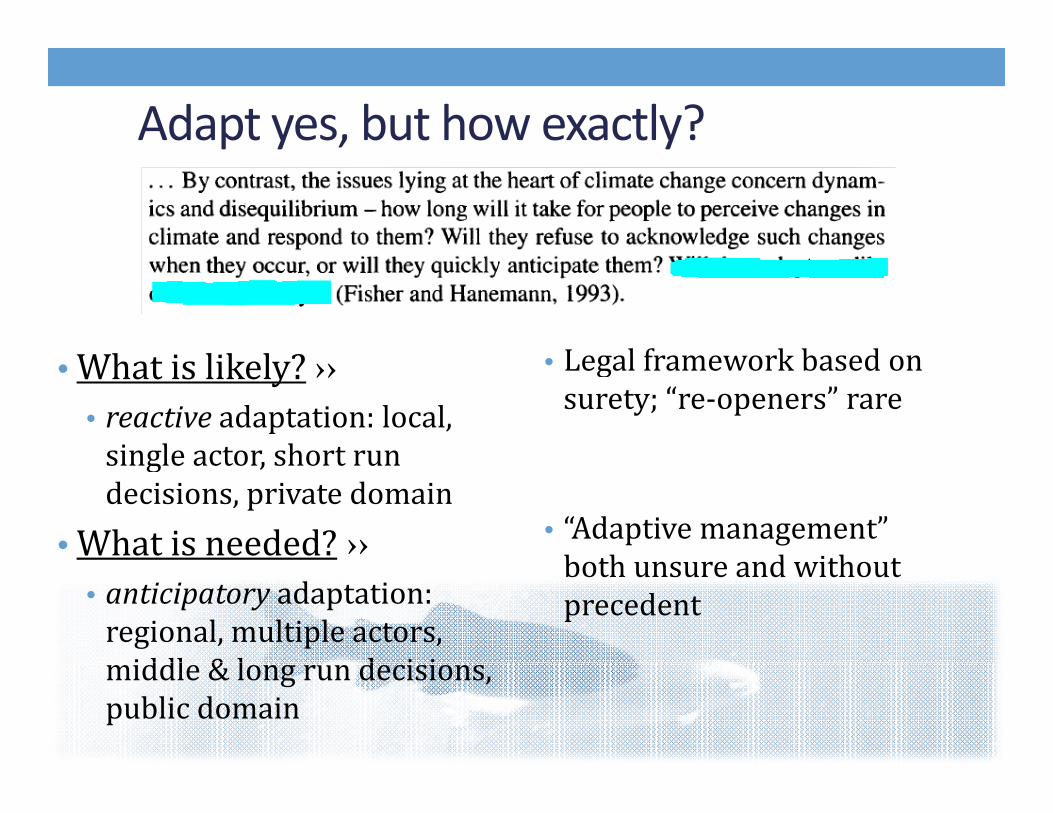
Adapt yes, but how exactly?
Wh i lik l ? Legal frame ork based on• What is likely? ›› • reactive adaptation: local, single actor short run
• Legal framework based on surety; “re‐openers” rare
single actor, short run decisions, private domain
• What is needed? ›› • “Adaptive management” b th d ith t
• anticipatory adaptation: regional, multiple actors, iddl & l d i i
both unsure and without precedent
middle & long run decisions, public domain

California Energy Commission PIER, ResourcesLegacy Fund SFPUC Pacific SouthwestLegacy Fund, SFPUC, Pacific SouthwestResearch Station, US Forest Service, NationalFish & Wildlife Foundation, Department ofWater ResourcesWater ResourcesJay Lund, Jeff Mount, Sarah Null, DavidRheinheimer, Sarah Yarnell, Ryan Peek, Gerhard, , y ,Epke, Alex Geddes, Jason Emmons, SebastianVicuna, David Purkey, Chuck Young, VishalMehta, Mike Kiparsky, Mike Deas and many
ACKNOWLEDGEMENTS
Mehta, Mike Kiparsky, Mike Deas and manyothers!
ACKNOWLEDGEMENTS