signal processing of functional nirs data acquired during
TRANSCRIPT

Signal processing of functional NIRSdata acquired during overt speaking
Xian ZhangJack Adam NoahSwethasri DravidaJoy Hirsch
Xian Zhang, Jack Adam Noah, Swethasri Dravida, Joy Hirsch, “Signal processing of functional NIRS dataacquired during overt speaking,” Neurophoton. 4(4), 041409 (2017),doi: 10.1117/1.NPh.4.4.041409.
Downloaded From: https://www.spiedigitallibrary.org/journals/Neurophotonics on 1/10/2018 Terms of Use: https://www.spiedigitallibrary.org/terms-of-use

Signal processing of functional NIRS data acquiredduring overt speaking
Xian Zhang,a Jack Adam Noah,a Swethasri Dravida,b and Joy Hirscha,c,d,e,*aYale School of Medicine, Department of Psychiatry, New Haven, Connecticut, United StatesbYale School of Medicine, Interdepartmental Neuroscience Program, New Haven, Connecticut, United StatescYale School of Medicine, Department of Neuroscience, New Haven, Connecticut, United StatesdYale School of Medicine, Department of Comparative Medicine, New Haven, Connecticut, United StateseUniversity College London, Department of Medical Physics and Biomedical Engineering, London, United Kingdom
Abstract. Functional near-infrared spectroscopy (fNIRS) offers an advantage over traditional functional imagingmethods [such as functional magnetic resonance imaging (fMRI)] by allowing participants to move and speakrelatively freely. However, neuroimaging while actively speaking has proven to be particularly challenging dueto the systemic artifacts that tend to be located in the critical brain areas. To overcome these limitations andenhance the utility of fNIRS, we describe methods for investigating cortical activity during spoken languagetasks through refinement of deoxyhemoglobin (deoxyHb) signals with principal component analysis (PCA) spatialfiltering to remove global components. We studied overt picture naming and compared oxyhemoglobin (oxyHb)and deoxyHb signals with and without global component removal using general linear model approaches. Activityin Broca’s region and supplementary motor cortex was observed only when the filter was applied to the deoxyHbsignal and was shown to be spatially comparable to fMRI data acquired using a similar task and to meta-analysisdata. oxyHb signals did not yield expected activity in Broca’s region with or without global component removal. Thisstudy demonstrates the utility of a PCA spatial filter on the deoxyHb signal in revealing neural activity related to aspoken language task and extends applications of fNIRS to natural and ecologically valid conditions. © The Authors.
Published by SPIE under a Creative Commons Attribution 3.0 Unported License. Distribution or reproduction of this work in whole or in part requires full
attribution of the original publication, including its DOI. [DOI: 10.1117/1.NPh.4.4.041409]
Keywords: near-infrared spectroscopy; functional NIRS; functional neuroimaging; speech production; principal component analysis;spatial filter.
Paper 17041SSR received Mar. 21, 2017; accepted for publication Jul. 24, 2017; published online Sep. 11, 2017.
1 IntroductionSpeech is a primary human function; however, brain activityrelated to tasks using overt speaking is difficult to investigateusing traditional imaging methods, such as functional magneticresonance imaging (fMRI), due to motion artifacts resultingfrom mouth and head movements. Language production has pri-marily been studied using imagined (covert or internal) speech1 orsparse sampling methods.2,3 These studies generally support clas-sic literature on the canonical language system,4–6 in which brainactivity associated with speech production has been localized toBroca’s region and supplementary motor cortex. This prior liter-ature plus the gold-standard from lesion studies and neurosurgicalinterventions where cortical stimulations document functionalloci for speech production based on picture-naming tasks7 pro-vide a valid reference for the findings of this study. Our primarygoal in this study was to develop a technique to reliably acquirehemodynamic signals during overt speech production. Here, wecompare the blood oxygen level-dependent signals of fMRI usingthe picture-naming task and other prior language studies usingNeurosynth8 with hemodynamic signals of functional near-infra-red spectroscopy (fNIRS) (acquired during covert object naming)based on concentrations of both oxyHb and deoxyHb with andwithout spatial filtering.
Although fNIRS has been available as a neuroimagingmethodology for more than 20 years,9,10–15 many technicaland computational challenges remain in order to investigate
spatially localized neural cognitive functions in adultsubjects.16–18 However, one of the primary advantages offNIRS includes signal acquisition in natural conditions thatallow relatively free movement and communication. One ofthe specific challenges for this application includes filteringof systemic artifacts, such as effects of blood pressure and res-piratory changes, that are often prominent in fNIRSsignals.16,19,20 Overt speaking tasks, as compared to nonverbalcognitive tasks such as mental arithmetic, have been shownto effect breathing and the end-tidal CO2 concentration inblood (PetCO2) with differential global effects on task-relatedchanges in oxyHb and deoxyHb signals.20 The complex combi-nation of effects due to speaking and breathing activities as wellas volitional cognitive tasks challenges interpretations of fNIRSsignals. In this paper, we attempt to address the issue of globalsystemic artifact using a spatial component removal method21
and using the deoxyhemoglobin (deoxyHb) signal, whichmay be less susceptible to global systemic components aswell as local variations within and across subjects. However,both deoxyHb and oxyHb signals are shown for illustrativepurposes.
The global systemic artifact in fNIRS is often addressed byusing short channel recording,22,23 which is assumed to be onlysensitive to systemic components that can be removed from thedata. This approach is a method of choice for region-of-interest(ROI) studies that do not employ full head coverage. However,since short channel separation relies on the temporal character-istics of the waveform of the systemic artifact, this method ischallenged by the fact that these artifacts can have similar*Address all Correspondence to Joy Hirsch, E-mail: [email protected]
Neurophotonics 041409-1 Oct–Dec 2017 • Vol. 4(4)
Neurophotonics 4(4), 041409 (Oct–Dec 2017)
Downloaded From: https://www.spiedigitallibrary.org/journals/Neurophotonics on 1/10/2018 Terms of Use: https://www.spiedigitallibrary.org/terms-of-use

waveforms to the task-related fNIRS signal.16,21,22 Thus, aregression method using temporal domain information fromthe short channels may remove both the global effects aswell as the spatially localized task-related neuronal signals,reducing sensitivity to main effects.
To address this problem, we previously reported the results ofa principal component analysis (PCA) spatial filter that was usedto remove global components from oxyhemoglobin (oxyHb)and deoxyHb signals during a finger-thumb tapping task,with optode coverage that was distributed over most of thehead.21 The effects of global systemic artifacts within theoxyHb signal were more pronounced relative to the deoxyHbsignal. However, following the application of the PCA filter,the oxyHb signal also showed expected spatial specificity asdid deoxyHb signals.
In this study, we applied the previously developed PCA spa-tial filter to fNIRS signals recorded during an overt picture-nam-ing task, which was similar to the classic Boston Naming Test.24
In addition, we compared recorded fNIRS signals with fMRIdata previously acquired during silent speech25 to evaluate thespatial correlation of results between these two methods usingsimilar tasks and paradigms. Tasks that elicit hemodynamic sig-nals with well-defined functional patterns, such as finger-thumbtapping or flashing checkerboard viewing, have typically beenused to develop and verify fNIRS recording and systemic arti-fact removal techniques. Spatial patterns generated by simplelanguage tasks, such as picture naming and description, canalso be compared to meta-analyses of functional imagingresults. Figure 1 shows the results of a Neurosynth forwardinference map generated from a meta-analysis of 6983 studiesusing the search term “Broca.” Neurosynth is an online meta-analysis tool that uses references to specific terms in many pub-lished studies to generate activity maps.8 To generate the for-ward inference map, a statistical analysis is performed usingthe coordinates reported in studies that do and do not referenceBroca’s region.
We employed picture naming and description in order to con-firm well-known, previously verified, functional results thatserve as fiducial markers for verification of the spatial filter tech-nique. We aim to compare results from oxyHb and deoxyHbsignals and two signal processing methods (with and withoutspatial filtering) to validate mapping procedures associatedwith spoken language using fNIRS.
2 Methods
2.1 Participants
A total of 22 individuals (14 female, mean age ¼ 24.5� 7.8,ranging from 18 to 55 years) participated in the experiment.All were fluent English speakers but language history and later-alization was not obtained for this study. All but two participants
were right-handed, as determined by the Edinburgh HandednessInventory.26 No participants were excluded from the experiment.Written informed consent was obtained from each participant inaccordance with guidelines approved by Yale University HumanInvestigations Committee (HIC #1501015178). All data wereobtained from the Brain Function Laboratory at Yale Schoolof Medicine, New Haven, Connecticut, and each person wascompensated for their participation in the study.
2.2 Functional NIRS Signal Acquisition
fNIRS signals were acquired using a LABNIRS system(Shimadzu Corp., Kyoto, Japan). Thirty emitter and 29 detectoroptodes were positioned 3 cm apart, providing a grid of 98acquisition channels [Fig. 2(a)]. Each emitter optode connectedto laser diodes at three wavelengths (780, 805, and 830 nm) usedto measure changes in concentration of deoxyHb and oxyHb.Signals were acquired every 0.093 s. For analysis, signalswere down-sampled to 0.93 samples∕s by averaging 10 datapoints into one value.
2.3 Task and Paradigm
To investigate cortical activity during language productionacquired by fNIRS, we used an overt picture-naming taskthat was similar to the object-naming tasks commonly usedin fMRI for neurosurgical planning applications.7 Participantswere instructed to name and give a short description of eachpicture, which was presented for 3 s. A 15-s task block (fivepictures) alternated with a 15-s rest block [Fig. 2(b)]. Eachrun consisted of six task/rest cycles, and two runs were per-formed for a total of 6 min.
2.4 Optode Localization and Definition of Regionof Interest
The locations of emitters and receivers, along with standard 10to 20 (Ref. 27) landmarks, including inion, nasion, Cz, T3, andT4, were determined using a Patriot three-dimensional (3-D)digitizer (Polhemus, Vermont). The Montreal NeurologicalInstitute (MNI) coordinates for each recording channel andthe corresponding anatomical locations of these channelswere determined with the statistical parametric mapping pack-age, NIRS-SPM.28 The native form of fNIRS data is channel-based since signals are recorded through channels and not indi-vidual voxels, which are interpolated between channel locations.Due to individual anatomical variations (e.g., head size andshape), the channel locations (represented by MNI coordinates)
Fig. 1 Neural activity determined by Neurosynth (meta-analysis of6983 studies identified by the search term “Broca”) serves to identifyone determination of the fiducial location of Broca’s area, the ROI forthis investigation.
Fig. 2 (a) 98-channel layout, covering frontal, temporal, and parietallobes. The white outline in (a) represents the field of view reliablycovered for all subjects in the fNIRS recordings. (b) Task paradigm:in each task block, five pictures were presented for 3 s each, whichwas followed by a 15-s rest block. Each run consisted of six task/restcycles.
Neurophotonics 041409-2 Oct–Dec 2017 • Vol. 4(4)
Zhang et al.: Signal processing of functional NIRS data acquired during overt speaking
Downloaded From: https://www.spiedigitallibrary.org/journals/Neurophotonics on 1/10/2018 Terms of Use: https://www.spiedigitallibrary.org/terms-of-use

are not necessarily identical across participants (Fig. 3). To cor-rect for these variations, we projected the data from each par-ticipant onto regions that represent the median channel locationsfor the group (Table 1 in Appendix A).
2.5 Functional NIRS Data Preprocessing
Temporal baseline drift was removed with the wavelet detrend-ing algorithm procedure provided in NIRS-SPM.28 Global com-ponents were removed using the PCA spatial filter algorithmreported previously.21 The value of the width at half-maximumof the spatial filter was set at 46 deg rather than 50 deg. SeeAppendix B for a detailed explanation on the optimization ofthis parameter. Beta values (i.e., the amplitude of neural activitydefined as the scale of best fit hemodynamic response function)were projected into MNI standard brain space (2 × 2 × 2 mm3).Transforming fNIRS data into a 3-D volume is done with tri-angulation-based linear interpolation (using the grid data com-mand in MATLAB). For voxels located directly on a channel,the spatial smoothing range was zero. For a voxel at the center ofa triangular pyramid, the smoothing value was the mean of sur-rounding channels. In general, the range of spatial smoothingwas less than 1.5 cm, half the distance between two channels.No additional smoothing was applied.
2.6 Voxel-Wise Analysis
First-level (single subject) and second-level (group) general lin-ear model analyses were performed using SPM8.29 Beta values(i.e., hemodynamic signal amplitude as fit to the hemodynamicresponse function) were projected into MNI standard brainspace using linear interpolation. Any voxel located fartherthan 18 mm away from the brain surface was excluded. Inorder to compare the effect of the task on the deoxyHb andthe oxyHb signals, we have adopted a convention of invertingthe polarity of the deoxyHb signals for the group analyses sothat both oxyHb and deoxyHb data show the same polarityin terms of representing neural activity. A reduction in
deoxyHb concentration and an increase in oxyHb concentrationboth correspond to “positive” fNIRS activity as represented bythe figures and the reverse was true for “negative” activity.Results for the contrast, object naming versus rest, were ren-dered at threshold level p < 0.05 corrected by a false discoveryrate (FDR).30
3 Results
3.1 Deoxyhemoglobin
We report results from both the deoxyHb and oxyHb signals thatwere processed (1) to remove global components (“clean”results) and (2) to show the unmodified signals (“raw” results).Figures 4(a) and 4(c) show the uncorrected results at a lenientthreshold to illustrate the overall pattern of activity. The cleandeoxyHb (upper left) data shows positive (red-yellow) activitycovering left pars triangularis, premotor, and supplementaryareas. While raw deoxyHb data show distributed activity cover-ing most of the entire recorded area, data from deoxyHb signalswith the application of the spatial filter were corrected for multi-ple comparison error using FDR (p < 0.05),30 and are shown inFigs. 5(a) and 5(b) and Table 3 (Appendix C).
3.2 Oxyhemoglobin Results
Uncorrected and lenient results obtained from the oxyHb signalswith and without the spatial filter are shown in Figs. 4(b) and4(d) to illustrate the general distribution patterns. Both the cleanand raw signals show a large cluster of negative activity cover-ing most of the recording area. Negative activity indicates thatthe oxygen concentration was higher during baseline (resting)epochs compared to speaking epochs. Thresholded and cor-rected results from the spatially filtered oxyHb signal [Fig. 5(b)]showed a cluster of negative activity in dorsolateral prefrontalcortex with peak MNI coordinate (−18, 46, 36) (p ≤ 0.05,FDR, t ¼ −4.00). Corrected results from the raw oxyHb signal[Fig. 5(a)] showed a single cluster of negative activity in thefrontopolar area with peak MNI coordinate (4, 60, 32)(p ≤ 0.05, FDR, t ¼ −3.91, n of voxels ¼ 36).
Fig. 3 Channel location variability. Variability of channel locationsacross different participants is shown with a top-down projectionview of all channels and subjects. Each circle is centered on thegroup median location of a channel. Each dot indicates the locationof a channel for an individual participant. Locations for three exemplarchannels, 14, 43, and 71, are shown in red. For example, each of thered dots around channel 71 represents the location of channel 71 foreach individual participant.
Fig. 4 fNIRS results. fNIRS activity is shown with and without theglobal component removed at a lenient uncorrected threshold ofp < 0.1. The contrast is overt picture naming over a rest period for allpanels. Both deoxyHb and oxyHb results are represented in left andright columns, respectively. Clean, global-mean removed, and rawsignals are shown in top and bottom rows, respectively. All conditionsinclude left sagittal and dorsal views. Red-yellow indicatespicture naming > rest and blue-green indicates rest > picture naming.
Neurophotonics 041409-3 Oct–Dec 2017 • Vol. 4(4)
Zhang et al.: Signal processing of functional NIRS data acquired during overt speaking
Downloaded From: https://www.spiedigitallibrary.org/journals/Neurophotonics on 1/10/2018 Terms of Use: https://www.spiedigitallibrary.org/terms-of-use
3.3 Event Triggered Average Results
Figure 6(a) shows the event-triggered average plot for eachchannel from a representative subject prior to general linearmodeling analyses. Following the fNIRS data presentation con-vention as stated above, both an upward oxyHb signal (red) anda downward deoxyHb signal (blue) indicate positive neuralactivity. A global component is clearly visible in all of the chan-nels and is especially noticeable in the oxyHb (“w-shaped” sig-nal). The oxyHb signal shows a decrease (negative activity)in almost all channels consistent with the raw data shown inFig. 4(d). The deoxyHb signal shows a decrease (positive
activity) in almost all channels, consistent with the raw datashown in Fig. 4(b). Figures 6(b)–6(d) show data from threechannels [outlined in Fig. 6(a)] in three individual subjectsthat are enlarged to show additional local variation in the tem-poral aspects of the oxyHb signal contrasted with the deoxyHbsignal.
3.4 Comparison of Functional NIRS, Neurosynth,and Functional Magnetic Resonance ImagingResults
An independent fMRI dataset based on a similar task and para-digm is presented here for comparison with the fNIRS
Fig. 6 Event-triggered data prior to spatial filtering. (a) Event-trig-gered average plot showing all 98 channels in a representative sub-ject. Data were averaged over the six 30-s task blocks. Red linesshow oxyHb; blue lines show deoxyHb. (b)–(d) Data from three chan-nels are enlarged with axis shown (same axis for all channels) fromthree individual subjects indicating variation in relative hemoglobinchange profiles.
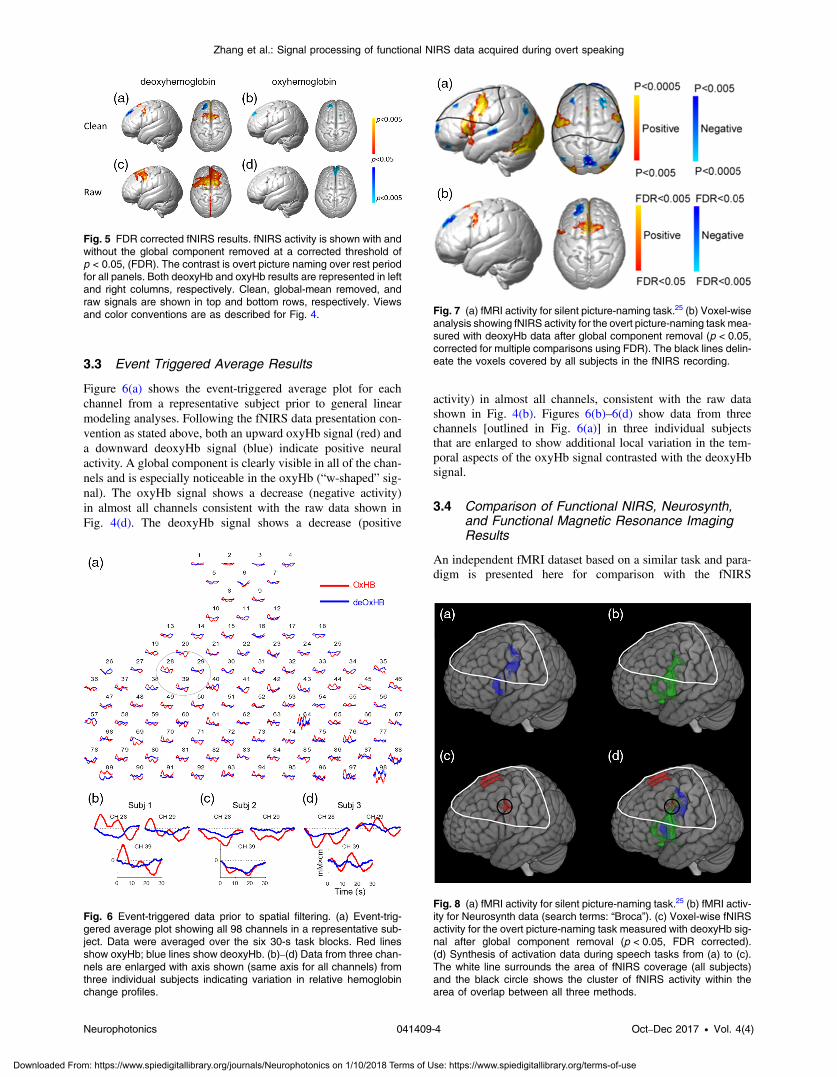
Fig. 7 (a) fMRI activity for silent picture-naming task.25 (b) Voxel-wiseanalysis showing fNIRS activity for the overt picture-naming task mea-sured with deoxyHb data after global component removal (p < 0.05,corrected for multiple comparisons using FDR). The black lines delin-eate the voxels covered by all subjects in the fNIRS recording.
Fig. 5 FDR corrected fNIRS results. fNIRS activity is shown with andwithout the global component removed at a corrected threshold ofp < 0.05, (FDR). The contrast is overt picture naming over rest periodfor all panels. Both deoxyHb and oxyHb results are represented in leftand right columns, respectively. Clean, global-mean removed, andraw signals are shown in top and bottom rows, respectively. Viewsand color conventions are as described for Fig. 4.
Fig. 8 (a) fMRI activity for silent picture-naming task.25 (b) fMRI activ-ity for Neurosynth data (search terms: “Broca”). (c) Voxel-wise fNIRSactivity for the overt picture-naming task measured with deoxyHb sig-nal after global component removal (p < 0.05, FDR corrected).(d) Synthesis of activation data during speech tasks from (a) to (c).The white line surrounds the area of fNIRS coverage (all subjects)and the black circle shows the cluster of fNIRS activity within thearea of overlap between all three methods.
Neurophotonics 041409-4 Oct–Dec 2017 • Vol. 4(4)
Zhang et al.: Signal processing of functional NIRS data acquired during overt speaking
Downloaded From: https://www.spiedigitallibrary.org/journals/Neurophotonics on 1/10/2018 Terms of Use: https://www.spiedigitallibrary.org/terms-of-use

findings7,25 [Fig. 7(a)]. Although the task completed duringacquisition of these fMRI images was covert (silent) namingrather than our overt (spoken) picture naming, the activityaround Broca’s region is expected to be similar and serves asa second fiducial marker for the findings of this study.Figure 7(b) shows the neural activity measured with fNIRSdeoxyHb data after global component removal. Within the cov-erage of the fNIRS channels, activity around Broca’s regionoverlays the activity shown in the fMRI data. Note that theoptode coverage [Fig. 2(a)] does not include the most lateralventral regions observed in either the fMRI data [Fig. 7(a)]or the Neurosynth marker (Fig. 1). The fNIRS data [Fig. 7(b),dorsal view] show increased activity near the supplementarymotor area (SMA) as compared to the fMRI data [Fig. 7(a), dor-sal view]. This is as expected for an overt speaking task wherethe supplementary motor system is actively engaged duringspeech articulation.
The result obtained from the spatially filtered deoxyHb sig-nals was compared with the fMRI data set, Fig. 1(a), and theNeurosynth map of Broca’s area (Fig. 1). Figure 8 shows thefMRI activity during covert speaking [Fig. 8(a)], the Neurosynthmap of Broca’s area [Fig. 8(b)], and the present fNIRS result[Fig. 8(d)]. The overlap of all three is shown within the opencircle in Fig. 8(c), illustrating a common area of activity.Note that since SPM group analysis is limited to the channelsthat are present for all subjects, the fNIRS coverage shown inFig. 8 (the white boundary) is smaller than the individual cover-age shown as median channel locations in Fig. 2(a). As shown inFig. 8, the coverage in common across all subjects does notinclude the most ventral regions observed in either the fMRIdata [Fig. 8(a)] or the Neurosynth marker [Fig. 8(b)].
4 DiscussionPreviously, we have shown that global component removalduring preprocessing using spatial filtering reveals activity con-sistent with expected cortical activity for finger tapping tasks.21
Here, we extend these findings to include overt speaking anddetermine that this spatial filter can be applied for deoxyHb sig-nals, revealing expected cortical activity in areas of the brainspecialized for speech production. Specifically, “clean”deoxyHb signals yielded activity localized to left frontal regionsincluded in Broca’s region, and pre- and supplementary motorcortex consistent with a previous fMRI study using asimilar task and paradigm with silent speech25 as well as theNeurosynth meta-analysis using a wide range of silent languagetasks performed during scanning with fMRI. Both are consistentwith well-described findings from intraoperative stimulation.
Although the deoxyHb signals with global componentremoval show specific activity in Broca’s region and theSMA [Fig. 5(a)], the unfiltered deoxyHb data show widespreadglobal component [Figs. 5(c)] during the picture-naming task.This is different from our previous findings based on fingerthumb tapping, which suggested that global components inthe deoxyHb were not significant.21 The current results implythat the global component in the deoxyHb signal is more appar-ent in some tasks than others, suggesting that global componentremoval is generally beneficial to an analysis pipeline to maxi-mize the likelihood of reflecting neural activity.
The coupling between neurological and physiological proc-esses that underlie changes in oxyHb and deoxyHb concentra-tions in the brain during cognitive and motor tasks is an activetopic of investigation. The anticorrelation between these two
signals that is typically observed during task-rest cycles isbelieved to reflect (1) increases in blood flow related to neutrallyactive tissue and serves as a proxy for task-specific neural activ-ity that underlies cognitive function; (2) increases in blood flowrelated to systemic physiological factors; and (3) relativedecreases in deoxyHb concentrations also related to neurovas-cular coupling and serves as a proxy for neural activity, respec-tively. Multiple systemic physiological factors not directlyrelated to the neurovascular coupling have been described.18 For example, variations in partial pressure of end-tidal carbondioxide (PetCO2) associated with respiration have beenobserved during speech production and shown to decreasewith similar tasks performed with only internal and cognitiveresponses.20 Other nonneural physiological factors, such asheart rate, blood pressure, respiration rate, and concentrationof CO2, have also been shown to influence blood oxygen con-centrations as measured by fNIRS (Refs. 18, 31 and 32). It iswidely understood that these factors are modulated by subjectcharacteristics, such as age, gender, fitness, body size, time fromexercise, medications, anxiety levels, and further complicatecomputational approaches to separate neural and systemic com-ponents in both oxyHb and deoxyHb signals. Furthermore,assumptions of equal variance across whole brains of individualsubjects may also be violated by both individual differences andtask demands.33 To the extent that these sources of variation aresystemic in origin, they would be expected to differentiallyaffect the oxyHb and deoxyHb signals. For example, the taskrelated increase in the oxyHb signal is attributed to both neuraland systemic physiological factors, whereas the task-relateddecrease in the deoxyHb signal is primarily attributed to neuro-vascular coupling.
The paradoxical group observation in the unthresholded,averaged raw oxyHb signals [Fig. 4(d)], showing both theabsence of signal in the ROI, Broca’s Area, and the negativegroup average in frontal areas is consistent with the hypothesisthat systemic factors such as end-tidal carbon dioxide may haveresulted in a negative signal. Regional differences in systemicfactors were also present, as illustrated by the differencebetween the oxyHb signal in the three channels in Figs. 6(b)–6(d). These localized systemic effects may have prevented thespatial filter from adequately removing this global negative sig-nal, as shown by the group-averaged result in Fig. 5(b). Whenthe oxyHb was subjected to a threshold and multiple compar-isons correction, individual differences in systemic factorsmay have washed out a group effect. However, the widely dis-tributed group signal for the simultaneously acquired rawdeoxyHb data, Fig. 4(c), suggests that the deoxyHb signalmay be less affected by these sources of variation than theoxyHb signal for a speaking task. This suggestion and observa-tion is an important topic for future research and the develop-ment of computational and experimental approaches as fNIRSemerges as a method of choice for studies of cognitive processesin natural conditions.
5 LimitationsThe finding that group data for the oxyHb signal during theovert speaking did not reveal canonical regions associatedwith Broca’s area, i.e., left pre- and supplementary motor cortexand left pars opercularis, was unexpected. Although increasedindividual variability of systemic factors associated with breath-ing that occur during a speaking task as well as individually spe-cific regional brain differences may contribute, there are other
Neurophotonics 041409-5 Oct–Dec 2017 • Vol. 4(4)
Zhang et al.: Signal processing of functional NIRS data acquired during overt speaking
Downloaded From: https://www.spiedigitallibrary.org/journals/Neurophotonics on 1/10/2018 Terms of Use: https://www.spiedigitallibrary.org/terms-of-use

possible contributing factors. The movement of head, mouth,and the temporalis muscle during overt speech creates particu-larly challenging circumstances for an imaging study. Thesefindings suggest that future investigations of speech functionswould benefit from movement extraction algorithms, and, inparticular, the oxyHb signal may benefit from simultaneousmeasurements of PetCO2, as previously suggested byScholkmann et al.20 Algorithms that employ physiologicalregressors to further refine the separation between neural andsystemic effects, in addition to PetCO2, such as heart rate,blood pressure, and respiration,18 may also be particularly ben-eficial to the oxyHb signal. Additionally, while traditional shortchannel regression techniques in the temporal domain may alsoremove cortical responses, newer techniques that only regressdata that only has a positive (nonstandard) correlation betweenoxyHb and deoxyHb have been suggested and may furtherincrease signal to noise in the oxyHb recordings.33
An additional limitation of the study was the variability ofdetector locations in the inferior aspect of the left frontallobe. This was due to the effects of variability of channel loca-tion in that area resulting from variations in head and cap size.As the field of view indicates (Fig. 3), the inferior aspects ofBroca’s area were not reliably sampled. This is a potential pitfallthat can be avoided in future investigations with cap sizesdesigned to fit various head sizes.
6 ConclusionIn this study, we compared fNIRS activity from an overt pic-ture-naming task to both a Neurosynth activity map and fMRIactivity during a silent picture-naming task.25 Spatial filteringof global components from the fNIRS deoxyHb signal yieldedresults similar to those obtained with fMRI. Even after spatialfiltering, fNIRS oxyHb signals did not show expected activitypatterns related to picture naming. One possible explanation isthat the oxyHb signal is more sensitive to modulation by sys-temic sources. The deoxyHb yielded activity patterns similar tofMRI and Neurosynth results only after global componentremoval was applied. This study is the first to our knowledgeto show the benefits of systemic artifact removal on fNIRS sig-nals recorded during a task involving spoken language toeliminate neural responses from Broca’s area. Findings suggestthat fNIRS may be used to study spoken language outside theconfines of an fMRI scanner and thereby extends the applica-tions of fNIRS to neuroimaging in natural and freely movingconditions.
Appendix A: Median Channel LocationsThe median locations for each channel are listed in Table 1.
Table 1 Median channel locations for all subjects. The X , Y , and Z columns represent MNI coordinates. MNI coordinates were converted toTalairach coordinates to generate anatomical areas. The last column lists the atlas-based probability that the XYZ coordinates are within thatanatomical location (only probabilities greater than 20% were listed here).
Channel X Y Z BA-anatomy Probability
1 −32 63 15 10-frontopolar area 1
2 −12 68 23 10-frontopolar area 1
3 15 68 24 10-frontopolar area 1
4 34 63 18 10-frontopolar area 1
5 −20 62 30 9-dorsolateral prefrontal cortex 0.3
10-frontopolar area 0.7
6 2 61 34 9-dorsolateral prefrontal cortex 0.49
10-frontopolar area 0.51
7 22 61 32 9-dorsolateral prefrontal cortex 0.42
10-frontopolar area 0.58
8 −11 57 42 9-dorsolateral prefrontal cortex 0.84
9 13 56 42 8-includes Frontal eye fields 0.21
9-dorsolateral prefrontal cortex 0.79
10 −19 48 47 8-includes frontal eye fields 0.69
9-dorsolateral prefrontal cortex 0.31
11 1 48 49 8-includes frontal eye fields 0.85
12 20 48 48 8-Includes frontal eye fields 0.81
Neurophotonics 041409-6 Oct–Dec 2017 • Vol. 4(4)
Zhang et al.: Signal processing of functional NIRS data acquired during overt speaking
Downloaded From: https://www.spiedigitallibrary.org/journals/Neurophotonics on 1/10/2018 Terms of Use: https://www.spiedigitallibrary.org/terms-of-use

Table 1 (Continued).
Channel X Y Z BA-anatomy Probability
13 −44 40 33 9-dorsolateral prefrontal cortex 0.39
46-dorsolateral prefrontal cortex 0.6
14 −28 39 48 8-includes frontal eye fields 0.85
15 −11 41 56 8-includes frontal eye fields 0.95
16 13 41 57 8-includes frontal eye fields 0.92
17 26 39 50 8-includes frontal eye fields 1
9-dorsolateral prefrontal cortex 0.69
19 −51 29 32 46-dorsolateral prefrontal cortex 0.57
20 −39 28 49 8-includes frontal eye fields 0.94
21 −19 30 60 6-premotor and supplementary motor cortex 0.49
8-includes frontal eye fields 0.51
22 0 31 60 6-premotor and supplementary motor cortex 0.52
8-includes frontal eye fields 0.48
23 20 31 61 6-premotor and supplementary motor cortex 0.54
8-includes frontal eye fields 0.46
24 37 28 52 8-includes frontal eye fields 1
25 52 30 35 9-dorsolateral prefrontal cortex 0.6
46-dorsolateral prefrontal cortex 0.4
26 −60 16 7 44-pars opercularis, part of Broca’s area 0.41
45-pars triangularis Broca’s area 0.33
27 −57 18 29 9-dorsolateral prefrontal cortex 0.66
45-pars triangularis Broca’s area 0.23
28 −46 20 49 8-includes frontal eye fields 0.82
29 −31 20 61 6-premotor and supplementary motor cortex 0.53
8-includes frontal eye fields 0.47
30 −13 22 67 6-premotor and supplementary motor cortex 1
31 13 22 67 6-premotor and supplementary motor cortex 1
32 31 21 62 6-premotor and supplementary motor cortex 0.66
8-includes frontal eye fields 0.34
33 47 20 51 8-includes frontal eye fields 0.87
34 58 18 33 9-dorsolateral prefrontal cortex 0.85
35 62 16 11 45-pars triangularis Broca’s area 0.41
44-pars opercularis, part of Broca’s area 0.54
36 −65 −1 −5 21-middle temporal gyrus 0.64
22-superior temporal gyrus 0.35
Neurophotonics 041409-7 Oct–Dec 2017 • Vol. 4(4)
Zhang et al.: Signal processing of functional NIRS data acquired during overt speaking
Downloaded From: https://www.spiedigitallibrary.org/journals/Neurophotonics on 1/10/2018 Terms of Use: https://www.spiedigitallibrary.org/terms-of-use

Table 1 (Continued).
Channel X Y Z BA-anatomy Probability
37 −63 4 25 6-premotor and supplementary motor cortex 0.63
38 −54 7 45 6-premotor and supplementary motor cortex 0.57
8-includes frontal eye fields 0.21
9-dorsolateral prefrontal cortex 0.22
39 −41 12 60 6-premotor and supplementary motor cortex 0.73
8-includes frontal eye fields 0.27
40 −21 12 69 6-premotor and supplementary motor cortex 1
41 −1 11 70 6-premotor and supplementary motor cortex 1
42 21 10 71 6-premotor and supplementary motor cortex 1
43 40 10 61 6-premotor and supplementary motor cortex 0.86
44 55 7 48 6-premotor and supplementary motor cortex 0.67
8-includes frontal eye fields 0.22
45 65 5 28 6-premotor and supplementary motor cortex 0.6
9-dorsolateral prefrontal cortex 0.31
46 67 1 1 21-middle temporal gyrus 0.32
22-superior temporal gyrus 0.59
47 −67 −8 17 43-subcentral area 0.42
48 −62 −5 39 6-premotor and supplementary motor cortex 0.98
49 −49 −1 56 6-premotor and supplementary motor cortex 0.93
50 −31 1 68 6-premotor and supplementary motor cortex 1
51 −13 0 75 6-premotor and supplementary motor cortex 1
52 13 0 75 6-premotor and supplementary motor cortex 1
53 30 −2 70 6-premotor and supplementary motor cortex 1
54 49 −3 59 6-premotor and supplementary motor cortex 0.9
55 62 −5 43 6-premotor and supplementary motor cortex 0.95
56 69 −7 20 6-premotor and supplementary motor cortex 0.32
43-subcentral area 0.4
57 −70 −22 0 21-middle temporal gyrus 0.48
22-superior temporal gyrus 0.32
42-primary and auditory association cortex 0.2
58 −67 −19 29 2-primary somatosensory cortex 0.24
59 −59 −16 49 3-primary somatosensory cortex 0.23
6-premotor and supplementary motor cortex 0.36
60 −43 −13 65 6-premotor and supplementary motor cortex 0.72
61 −22 −12 75 6-premotor and supplementary motor cortex 1
Neurophotonics 041409-8 Oct–Dec 2017 • Vol. 4(4)
Zhang et al.: Signal processing of functional NIRS data acquired during overt speaking
Downloaded From: https://www.spiedigitallibrary.org/journals/Neurophotonics on 1/10/2018 Terms of Use: https://www.spiedigitallibrary.org/terms-of-use

Table 1 (Continued).
Channel X Y Z BA-anatomy Probability
62 −2 −11 75 6-premotor and supplementary motor cortex 1
63 22 −12 76 6-premotor and supplementary motor cortex 1
64 42 −15 68 6-premotor and supplementary motor cortex 0.75
65 58 −18 53 3-primary somatosensory cortex 0.39
66 68 −20 33 1-primary somatosensory cortex 0.25
2-primary somatosensory cortex 0.22
67 72 −22 4 21-middle temporal gyrus 0.22
22-superior temporal gyrus 0.41
42-primary and auditory association cortex 0.37
68 −69 −33 14 22-superior temporal gyrus 0.57
40-supramarginal gyrus part of Wernicke’s area 0.09
42-primary and auditory association cortex 0.34
69 −65 −30 39 2-primary somatosensory cortex 0.21
40-supramarginal gyrus part of Wernicke’s area 0.61
70 −53 −26 59 1-primary somatosensory cortex 0.26
2-primary somatosensory cortex 0.39
3-primary somatosensory cortex 0.2
71 −35 −23 72 4-primary motor cortex 0.31
6-premotor and supplementary motor cortex 0.52
72 −13 −23 79 4-primary motor cortex 0.28
6-premotor and supplementary motor cortex 0.72
73 13 −24 79 4-primary motor cortex 0.24
6-premotor and supplementary motor cortex 0.76
74 33 −24 73 4-primary motor cortex 0.43
6-premotor and supplementary motor cortex 0.49
75 52 −27 62 1-primary somatosensory cortex 0.28
2-primary somatosensory cortex 0.23
3-primary somatosensory cortex 0.33
76 65 −31 44 2-primary somatosensory cortex 0.2
40-supramarginal gyrus part of Wernicke’s area 0.59
77 71 −34 18 22-superior temporal gyrus 0.44
40-supramarginal gyrus part of Wernicke’s area 0.29
42-primary and auditory association cortex 0.27
78 −68 −45 −3 21-middle temporal gyrus 0.79
Neurophotonics 041409-9 Oct–Dec 2017 • Vol. 4(4)
Zhang et al.: Signal processing of functional NIRS data acquired during overt speaking
Downloaded From: https://www.spiedigitallibrary.org/journals/Neurophotonics on 1/10/2018 Terms of Use: https://www.spiedigitallibrary.org/terms-of-use

Table 1 (Continued).
Channel X Y Z BA-anatomy Probability
79 −67 −43 24 22-superior temporal gyrus 0.37
40-supramarginal gyrus part of Wernicke’s area 0.63
80 −61 −40 46 40-supramarginal gyrus part of Wernicke’s area 0.98
81 −46 −35 64 1-primary somatosensory cortex 0.21
2-primary somatosensory cortex 0.33
40-supramarginal gyrus part of Wernicke’s area 0.31
82 −24 −36 75 3-primary somatosensory cortex 0.39
4-primary motor cortex 0.24
83 −1 −37 78 4-primary motor cortex 0.33
6-premotor and supplementary motor cortex 0.45
84 22 −38 77 3-primary somatosensory cortex 0.45
4-primary motor cortex 0.26
85 44 −37 66 2-primary somatosensory cortex 0.3
86 59 −42 50 40-supramarginal gyrus part of Wernicke’s area 1
87 67 −46 27 40-supramarginal gyrus part of Wernicke’s area 0.81
88 69 −47 −2 21-middle temporal gyrus 0.63
22-superior temporal gyrus 0.22
89 −64 −55 5 21-middle temporal gyrus 0.66
22-superior temporal gyrus 0.24
90 −62 −54 31 40-supramarginal gyrus part of Wernicke’s area 0.81
91 −53 −51 52 40-supramarginal gyrus part of Wernicke’s area 1
92 −36 −49 68 5-somatosensory association cortex 0.51
7-somatosensory association cortex 0.26
93 −14 −50 76 5-somatosensory association cortex 0.36
7-somatosensory association cortex 0.51
94 13 −50 76 5-somatosensory association cortex 0.37
7-somatosensory association cortex 0.5
95 33 −51 69 5-somatosensory association cortex 0.45
7-somatosensory association cortex 0.54
96 50 −54 55 40-supramarginal gyrus part of Wernicke’s area 0.93
97 60 −58 34 39-angular gyrus, part of Wernicke’s area 0.32
40-supramarginal gyrus part of Wernicke’s area 0.68
98 64 −60 7 21-middle temporal gyrus 0.45
22-superior temporal gyrus 0.21
Neurophotonics 041409-10 Oct–Dec 2017 • Vol. 4(4)
Zhang et al.: Signal processing of functional NIRS data acquired during overt speaking
Downloaded From: https://www.spiedigitallibrary.org/journals/Neurophotonics on 1/10/2018 Terms of Use: https://www.spiedigitallibrary.org/terms-of-use

Appendix B: Optimization of the GlobalComponent Removal MethodThe PCA global component removal method is essentially a spa-tial high-pass Gaussian filter method.21 The following equationdescribed the Gaussian filter:
EQ-TARGET;temp:intralink-;x2;63;688G2−DðrÞ ¼ expð−distance2∕2σ2Þ;
where σ represents the width at half-maximum of the Gaussiankernel. In the previous paper, we set the parameter σ as 50 degbased on the observed extent of global component, noting thatthis value should be greater than the width of the expected cort-ical activation but smaller than the width of the global compo-nents. To optimize this width, we used data from 22 participants
performing a right-handed finger-tapping task. Data were aver-aged across 3 × 3 × 3 voxels (each voxel ¼ 2 mm3) in the leftmotor cortex. We tested different values for σ and calculated thepeak T value for each σ, as shown in Table 2.
Using this procedure, we found that the value for the filterparameter σ that optimized the peak T value of motor cortexactivity was 46 deg instead of the previously adopted valueof 50 deg. Because of this, we used a parameter value σ of46 deg in this study.
Appendix C: Voxel-Wise and Channel-WiseResults from Clean deoxyHb SignalsThe results of the corrected voxel-wise analyses of the deoxyHb(Table 3) and oxyHb (Table 4) signals with the spatial filter(“clean”) are reported.
DisclosuresNo conflicts of interest, financial or otherwise, are declared bythe authors.
AcknowledgmentsThis research reported in this publication was partiallysupported by the National Institute of the Mental Healthof the National Institutes of Health under AwardNo. R01MH107513 and the NIH Medical Scientist TrainingProgram Training Grant No. T32GM007205. The content issolely the responsibility of authors and does not necessarily re-present the official views of the National Institutes of Health.
Table 2 Peak T values for each angle (σ).
σ (deg) T
42.5 2.57
44.4 2.61
46.2 2.62
48.0 2.51
50.0 2.52
51.2 2.53
52.8 2.56
Table 3 Contrast comparisons (deoxyHb signals, clean, FDR corrected) for voxel-wise analysis.
ContrastContrast threshold(FDR adjusted)
Peak VoxelAnatomical regions
in cluster BAbAnatomicalprobabilityMINI Coordinatea t value
[Picture-naming > rest] p ¼ 0.05 −56 6 30 3.48 Pre- and supplementary motor cortex 6 0.70
Pars opercularis, part of Broca’s area 44 0.22
Primary motor cortex 4 0.04
Subcentral area 43 0.04
aCoordinates are based on the MNI system and (−) indicates left hemisphere.bBA, Brodmann area.
Table 4 Contrast comparisons (oxyHb signals, clean, FDR corrected) for voxel-wise analysis.
ContrastContrast threshold(FDR adjusted)
Peak VoxelAnatomical regions
in cluster BAbAnatomicalprobabilityMINI Coordinatea t value
[Picture-naming > rest] p ¼ 0.05 −18 46 36 −4.00 Dorsolateral prefrontal cortex 9 0.70
Frontal eye fields 8 0.30
aCoordinates are based on the MNI system and (−) indicates left hemisphere.bBA, Brodmann area.
Neurophotonics 041409-11 Oct–Dec 2017 • Vol. 4(4)
Zhang et al.: Signal processing of functional NIRS data acquired during overt speaking
Downloaded From: https://www.spiedigitallibrary.org/journals/Neurophotonics on 1/10/2018 Terms of Use: https://www.spiedigitallibrary.org/terms-of-use

References1. C. J. Price, “A review and synthesis of the first 20 years of PET and
fMRI studies of heard speech, spoken language and reading,”NeuroImage 62(2), 816–847 (2012).
2. W. B. Edmister et al., “Improved auditory cortex imaging using clus-tered volume acquisitions,” Hum. Brain Mapp. 7(2), 89–97 (1999).
3. D. A. Hall et al., ““Sparse” temporal sampling in auditory fMRI,” Hum.Brain Mapp. 7(3), 213–223 (1999).
4. T. J. Abel et al., “Direct physiologic evidence of a heteromodal conver-gence region for proper naming in human left anterior temporal lobe,”J. Neurosci. 35(4), 1513–1520 (2015).
5. P. Hagoort, “Nodes and networks in the neural architecture for lan-guage: Broca’s region and beyond,” Curr. Opin. Neurobiol. 28,136–141 (2014).
6. D. Poeppel, “The neuroanatomic and neurophysiological infrastructurefor speech and language,” Curr. Opin. Neurobiol. 28, 142–149 (2014).
7. J. Hirsch et al., “An integrated functional magnetic resonance imagingprocedure for preoperative mapping of cortical areas associated withtactile, motor, language, and visual functions,” Neurosurgery 47(3),711–722 (2000).
8. T. Yarkoni et al., “Large-scale automated synthesis of human functionalneuroimaging data,” Nat. Methods 8(8), 665–670 (2011).
9. F. Scholkmann et al., “A review on continuous wave functional near-infrared spectroscopy and imaging instrumentation and methodology,”NeuroImage 85 (Pt. 1), 6–27 (2014).
10. M. Ferrari and V. Quaresima, “A brief review on the history of humanfunctional near-infrared spectroscopy (fNIRS) development and fieldsof application,” NeuroImage 63(2), 921–935 (2012).
11. M. A. Franceschini and D. A. Boas, “Noninvasive measurement of neu-ronal activity with near-infrared optical imaging,” NeuroImage 21(1),372–386 (2004).
12. X. Cui et al., “A quantitative comparison of NIRS and fMRI acrossmultiple cognitive tasks,” NeuroImage 54(4), 2808–2821 (2011).
13. M. Ferrari, L. Mottola, and V. Quaresima, “Principles, techniques, andlimitations of near infrared spectroscopy,” Can. J. Appl. Physiol. 29(4),463–487 (2004).
14. G. Strangman et al., “A quantitative comparison of simultaneous BOLDfMRI and NIRS recordings during functional brain activation,”NeuroImage 17(2), 719–731 (2002).
15. A. Villringer and B. Chance, “Non-invasive optical spectroscopy andimaging of human brain function,” Trends Neurosci. 20(10), 435–442 (1997).
16. E. Kirilina et al., “The physiological origin of task-evoked systemicartefacts in functional near infrared spectroscopy,” NeuroImage61(1), 70–81 (2012).
17. D. A. Boas et al., “Twenty years of functional near-infrared spectros-copy: introduction for the special issue,” NeuroImage 85(Pt. 1), 1–5(2014).
18. I. Tachtsidis and F. Scholkmann, “False positives and false negatives infunctional near-infrared spectroscopy: issues, challenges, and the wayforward,” Neurophotonics 3(3), 031405 (2016).
19. D. A. Boas, A. M. Dale, and M. A. Franceschini, “Diffuse optical im-aging of brain activation: approaches to optimizing image sensitivity,resolution, and accuracy,” NeuroImage 23(Suppl. 1), S275–S288(2004).
20. F. Scholkmann et al., “End-tidal CO2: an important parameter for a cor-rect interpretation in functional brain studies using speech tasks,”NeuroImage 66, 71–79 (2013).
21. X. Zhang, J. A. Noah, and J. Hirsch, “Separation of the global and localcomponents in functional near-infrared spectroscopy signals using prin-cipal component spatial filtering,” Neurophotonics 3(1), 015004 (2016).
22. T. Funane et al., “Quantitative evaluation of deep and shallow tissuelayers’ contribution to fNIRS signal using multi-distance optodesand independent component analysis,” NeuroImage 85(Pt. 1), 150–165 (2014).
23. L. Gagnon et al., “Further improvement in reducing superficial contami-nation in NIRS using double short separation measurements,”NeuroImage 85, 127–135 (2014).
24. E. Kaplan, H. Goodglass, and S. Weintraub, Boston Naming Test, Pro-ed, Austin (2001).
25. J. Hirsch, D. R. Moreno, and K. H. Kim, “Interconnected large-scalesystems for three fundamental cognitive tasks revealed by functionalMRI,” J. Cognit. Neurosci. 13(3), 389–405 (2001).
26. R. C. Oldfield, “The assessment and analysis of handedness: theEdinburgh inventory,” Neuropsychologia 9(1), 97–113 (1971).
27. H. H. Jasper, “Report of the committee on methods of clinical exami-nation in electroencephalography: 1957,” Electroencephalogr. Clin.Neurophysiol. 10(2), 370–375 (1958).
28. J. C. Ye et al., “NIRS-SPM: statistical parametric mapping for near-infrared spectroscopy,” NeuroImage 44(2), 428–447 (2009).
29. K. Friston et al., “Statistical parametric maps in functional imaging: ageneral linear approach,” Hum. Brain Mapp. 2, 189–210 (1994).
30. Y. Benjamini and Y. Hochberg, “Controlling the false discovery rate—apractical and powerful approach to multiple testing,” J. R. Stat. Soc. Ser.B Method. 57(1), 289–300 (1995).
31. T. Yamada, S. Umeyama, and K. Matsuda, “Separation of fNIRS signalsinto functional and systemic components based on differences in hemo-dynamic modalities,” PLoS One 7(11): e50271 (2012).
32. M. Moody et al., “Cerebral and systemic hemodynamic changes duringcognitive and motor activation paradigms,” Am. J. Physiol.-Regul.Integr. Comp. Physiol. 288(6), R1581–R1588 (2005).
33. T. Yamamoto and T. Kato, “Paradoxical correlation between signal infunctional magnetic resonance imaging and deoxygenated haemoglobincontent in capillaries: a new theoretical explanation,” Phys. Med. Biol.47(7), 1121–1141 (2002).
Xian Zhang received his PhD in psychology and visual science fromColumbia University, New York, USA, in 2003. He is an associateresearch scientist in the Brain Function Laboratory and Departmentof Psychiatry, Yale School of Medicine. His research interests includecomputational neuroscience, signal processing, and neuroimagingtechnologies, such as electroencephalography (EEG), fNIRS, andfMRI and their applications in psychiatry, vision science, social inter-actions, and decision making.
Jack Adam Noah received his PhD in biomedical sciences fromMarshall University School of Medicine in 2003. He is an associateresearch scientist in the Department of Psychiatry and the BrainFunction Laboratory at the Yale School of Medicine. His researchinterests include functional near-infrared spectroscopy and integra-tion of other multimodal and behavioral recording techniques for appli-cations in communication and social interactions, neurofeedback, andcognitive neuroimaging.
Swethasri Dravida received her BS degree in mathematics andbrain and cognitive sciences from the Massachusetts Institute ofTechnology in 2013. She is a graduate student at Yale School ofMedicine. Her current research interests include using functionalnear-infrared spectroscopy and EEG to study social interaction, espe-cially in clinical contexts such as autism.
Joy Hirsch received her PhD in psychology and visual science fromColumbia University and is now a professor of psychiatry and neuro-biology at the Yale School of Medicine, and a professor of neurosci-ence at University College London. She is also the director of theBrain Function Laboratory at Yale University. Her research is focusedon investigations of neural circuitry that underlies human social inter-actions using multimodal neuroimaging techniques including fNIRS,fMRI, EEG, eye-tracking, and behavioral measures. Prior to recruit-ment to Yale, she was a director of the fMRI Research Center atColumbia University.
Neurophotonics 041409-12 Oct–Dec 2017 • Vol. 4(4)
Zhang et al.: Signal processing of functional NIRS data acquired during overt speaking
Downloaded From: https://www.spiedigitallibrary.org/journals/Neurophotonics on 1/10/2018 Terms of Use: https://www.spiedigitallibrary.org/terms-of-use