signal processing on databases
TRANSCRIPT

D4M-1
Jeremy Kepner
Lecture 4: Analysis of Structured Data
Signal Processing on Databases
This work is sponsored by the Department of the Air Force under Air Force Contract #FA8721-05-C-0002. Opinions, interpretations, recommendations and conclusions are those of the authors and are not necessarily endorsed by the United States Government.
D4M-2
• Introduction – Schema
– Stats (Analytic 1)
• First Order Analytics
• Second Order Analytics
• Summary
Outline
D4M-3
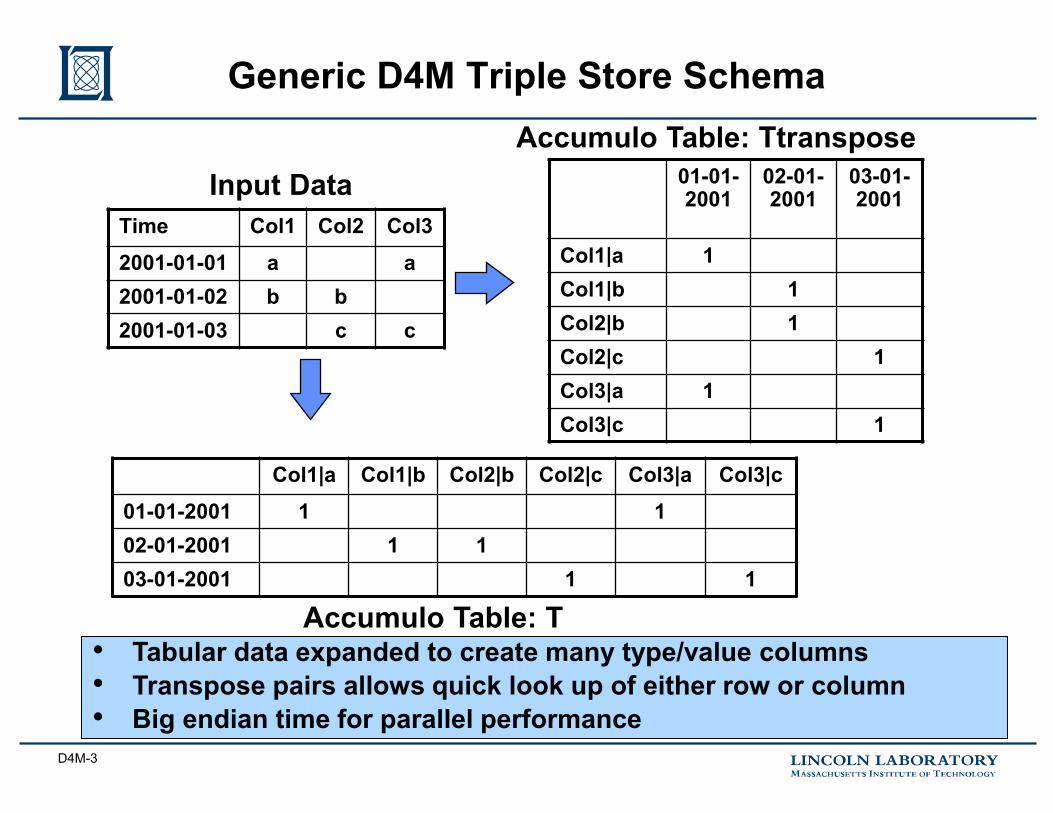
Generic D4M Triple Store Schema
Time Col1 Col2 Col3 2001-01-01 a a 2001-01-02 b b 2001-01-03 c c
Col1|a Col1|b Col2|b Col2|c Col3|a Col3|c 01-01-2001 1 1 02-01-2001 1 1 03-01-2001 1 1
Input Data
Accumulo Table: T • Tabular data expanded to create many type/value columns • Transpose pairs allows quick look up of either row or column • Big endian time for parallel performance
01-01-2001
02-01-2001
03-01-2001
Col1|a 1 Col1|b 1 Col2|b 1 Col2|c 1 Col3|a 1 Col3|c 1
Accumulo Table: Ttranspose

D4M-4
Stats (Analytic 1) Diagram
• Copy a set of rows from T into associative array A • Perform the following statistical calculations on A
– Column count: how many times each column appears in A – Column type count: how many times each column type appears in A – Column covariance: how many times each pair of columns in A
appear in the same row together – Column covariance: how many times each pair of column types in A
appear in the same row together
Row Key 1 01-10-2001 01 01 00
2 01-10-2001 01 02 00
3 01-10-2001 01 03 00
4 01-10-2001 01 04 00
5 01-10-2001 01 05 00
6 01-10-2001 01 06 00
Accumulo Table: T
Associative Array: A
• Good for identifying column types, gaps, clutter, and correlations
D4M-5
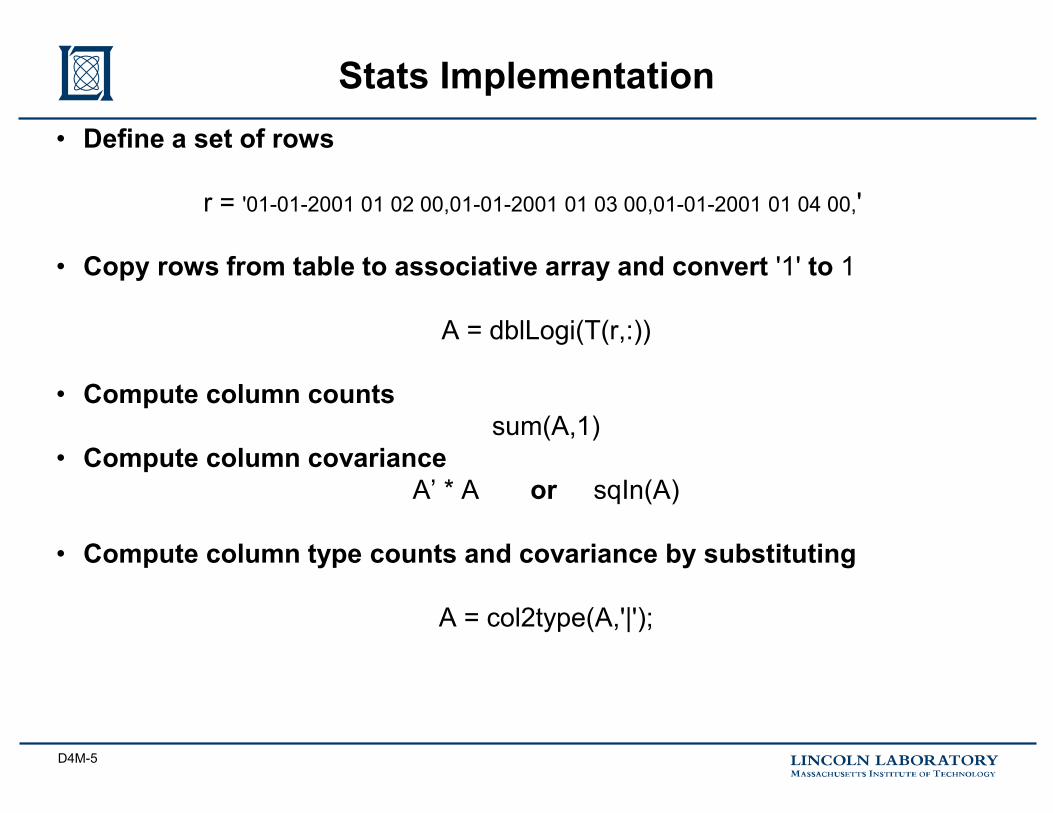
Stats Implementation • Define a set of rows
r = '01-01-2001 01 02 00,01-01-2001 01 03 00,01-01-2001 01 04 00,'
• Copy rows from table to associative array and convert '1' to 1
A = dblLogi(T(r,:))
• Compute column counts
sum(A,1) • Compute column covariance
A’ * A or sqIn(A)
• Compute column type counts and covariance by substituting
A = col2type(A,'|');

D4M-6
• Introduction
• First Order Analytics – Data Graph (Analytic 2)
– Space (Analytic 3)
– Convolution (Analytic 4)
• Second Order Analytics
• Summary
Outline

D4M-7
Data Graphs (Analytic 2) Diagram
• Define data graph inputs – Start columns c0 – Allowed column types ct – Clutter columns cl
• Get all columns c1 in rows containing c0 of type ct and excluding columns cl
Row Key 1 01-10-2001 01 01 00
2 01-10-2001 01 02 00
3 01-10-2001 01 03 00
4 01-10-2001 01 04 00
5 01-10-2001 01 05 00
6 01-10-2001 01 06 00
Accumulo Table: T c0
• The fundamental operation upon which all graphs are built • Perform recursively to grow graph from starting columns
ct
cl c1
ct
c1 c1 c1

D4M-8
Data Graph Implementation
• Define start columns, allowed column types and clutter
c0='Col1|c,’ ct=StartsWith('Col1|,Col3|,') cl='Col1|a,'
• Copy all columns from rows containing c0 into associative array
A = dblLogi(T(Row(T(:,c0)),:))
• Reduce to allowed columns
A = A(:,ct)
• Eliminate clutter columns and return column labels
c1 = Col(A - A(:,cl))
• Look for new clutter
sum(dblLogi(T(:,c1)),1)) > 10

D4M-9
Data Graphs Example 1
Row Key 1 01-10-2001 01 01 00
2 01-10-2001 01 02 00
3 01-10-2001 01 03 00
4 01-10-2001 01 04 00
5 01-10-2001 01 05 00
6 01-10-2001 01 06 00
Accumulo Table: T c0 c1 c1 c2 c2 c2 c2
a b
c
d
• Limited by the natural topology of the data • Star data is good for generating star data graphs
0 1 2

D4M-10
Data Graphs Example 2
Row Key 1 01-10-2001 01 01 00
2 01-10-2001 01 02 00
3 01-10-2001 01 03 00
4 01-10-2001 01 04 00
5 01-10-2001 01 05 00
6 01-10-2001 01 06 00
7 01-10-2001 01 07 00
8 01-10-2001 01 08 00
Accumulo Table: T c0
a
b
c
d • Limited by the natural topology of the data • Star data is limiting for generating cycle data graphs
0 1
c1 c1 c1

D4M-11
Space (Analytic 3) Diagram
• Select row range r and a space polygon s • Copy a set of rows from T into associative array A • Extract space coordinates from rows and determine if inside s • Return columns c that satisfy these constraints
Row Key (time) 1 01-10-2001 01 01 00
2 01-10-2001 01 02 00
3 01-10-2001 01 03 00
4 01-10-2001 01 04 00
5 01-10-2001 01 05 00
6 01-10-2001 01 06 00
Accumulo Table: T
Associative Array: A
• Good for finding columns in a particular space window • Can apply filter to space first is coordinates are “Mertonized”
r
c c c s s s s
D4M-12
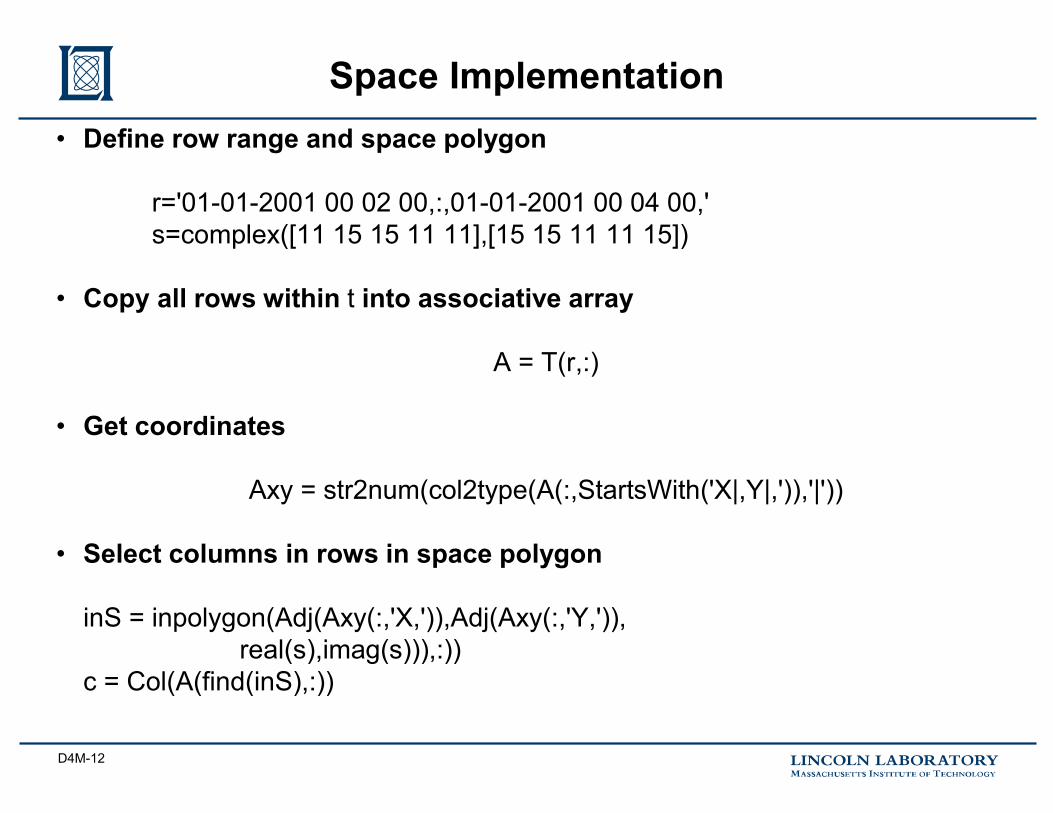
Space Implementation • Define row range and space polygon
r='01-01-2001 00 02 00,:,01-01-2001 00 04 00,' s=complex([11 15 15 11 11],[15 15 11 11 15])
• Copy all rows within t into associative array
A = T(r,:)
• Get coordinates
Axy = str2num(col2type(A(:,StartsWith('X|,Y|,')),'|'))
• Select columns in rows in space polygon
inS = inpolygon(Adj(Axy(:,'X,')),Adj(Axy(:,'Y,')), real(s),imag(s))),:)) c = Col(A(find(inS),:))

D4M-13
Convolution (Analytic 4) Diagram
• Copy a set of rows from T into associative array A • Select a numeric column type and convolve with a filter
Row Key 1 01-10-2001 01 01 00
2 01-10-2001 01 02 00
3 01-10-2001 01 03 00
4 01-10-2001 01 04 00
5 01-10-2001 01 05 00
6 01-10-2001 01 06 00
Accumulo Table: T
Associative Array: A
• Standard signal processing technique for finding groups
c c c

D4M-14
Convolution Implementation • Define a set of rows and a filter of width 4
r = '01-01-2001 01 02 00,01-01-2001 01 03 00,01-01-2001 01 04 00,' f = ones(1,4)
• Copy rows from table to associative array and convert '1' to 1
A = dblLogi(T(r,:))
• Create vector of numeric type rows
Av = dblLogi(col2val(sum(A(:,StartsWith('X|,’)),1)))
• Convolve with filter and find columns > 1
c = Col(conv(Av,f) > 1)

D4M-15
• Introduction
• First Order Analytics
• Second Order Analytics – Type Pair (Analytic 5)
– Data Pair (Analytic 6)
– Semantic Extension (Analytic 7)
– Semantic Pair (Analytic 8)
• Summary
Outline

D4M-16
Type Pair (Analytic 5) Diagram
• Copy a set of rows from T into associative array A • Find rows in A that contain both pair types ct1 and ct2 • Find columns of each type are paired with more than one
column of the other type
Row Key 1 01-10-2001 01 01 00
2 01-10-2001 01 02 00
3 01-10-2001 01 03 00
4 01-10-2001 01 04 00
5 01-10-2001 01 05 00
6 01-10-2001 01 06 00
Accumulo Table: T
Associative Array: A
• Good for tracking columns that occur in pairs
c c c
ct1 ct2

D4M-17
Type Pair Implementation
• Define row range and type pair r = '01-01-2001 00 01 00,:,01-01-2001 00 06 00,' ct1 = StartsWith('X|,’) ct2 = StartsWith('Y|,’)
• Copy rows from table to associative array and convert '1' to 1 A = dblLogi(T(r,:))
• Find rows containing both column types in the pair
r = Row(sum(A(Row(sum(A(:,ct1),2)==1),[ct1 ct2]),2)==2);
• Get columns in order for creating a pair mapping matrix [tmp c1 tmp] = A(r,ct1) [tmp c2 tmp] = A(r,ct2) A12 = Assoc(c1,c2,1)
• Find ct1 with more than one ct2 and vice versa
sum(A12,1) > 1 sum(A12,2) > 1
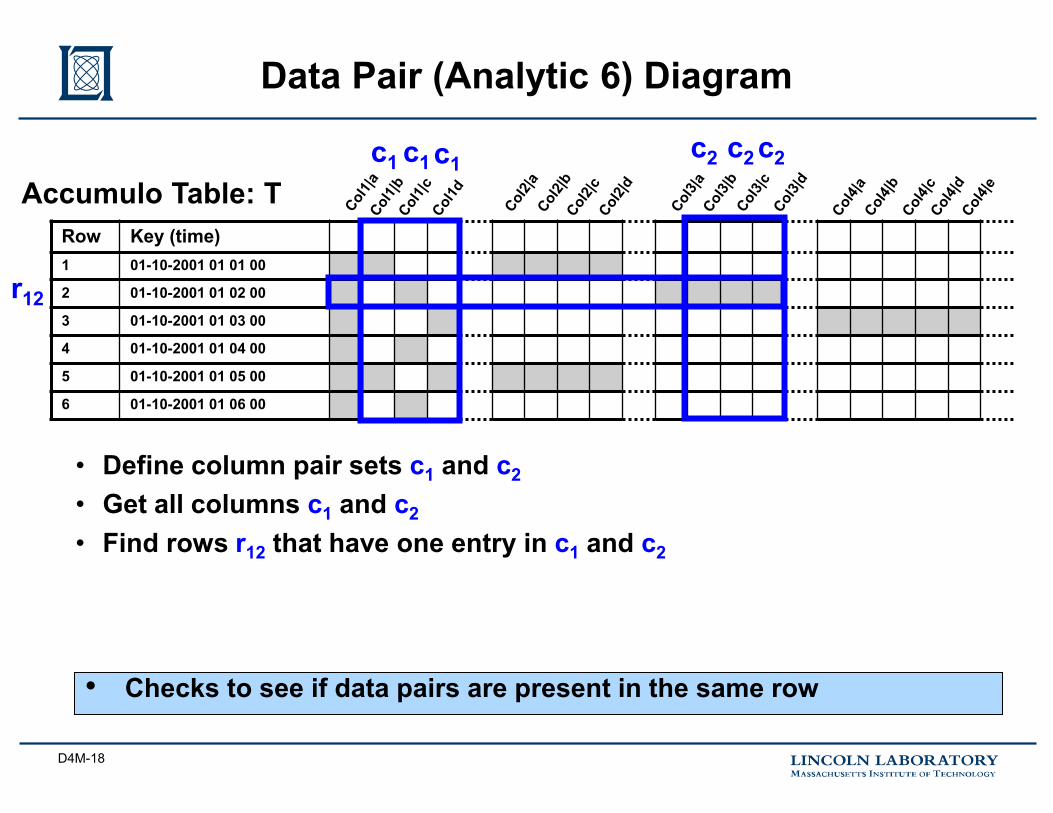
D4M-18
Data Pair (Analytic 6) Diagram
• Define column pair sets c1 and c2 • Get all columns c1 and c2
• Find rows r12 that have one entry in c1 and c2
Row Key (time) 1 01-10-2001 01 01 00
2 01-10-2001 01 02 00
3 01-10-2001 01 03 00
4 01-10-2001 01 04 00
5 01-10-2001 01 05 00
6 01-10-2001 01 06 00
Accumulo Table: T c1
• Checks to see if data pairs are present in the same row
c2
r12
c1 c1 c2 c2

D4M-19
Data Pair Implementation • Define column pair sets c1 = 'Col1|b,Col1|c,Col1|d,' c2 = 'Col3|b,Col3|c,Col3|d,’ c12 = CatStr(c1,’;’,c2)
• Create pair mapping matrices A1p = Assoc(c1,c12,1) A2p = Assoc(c2,c12,1)
• Get columns from T A1 = dblLogi(T(:,c1)) A2 = dblLogi(T(:,c2))
• Find pairs ((A1*A1p) + (A2*A2p)) > 1)

D4M-20
Semantic Extension (Analytic 7) • Column types may have several types of semantic
relationships which can be used to extend pairs
• Pair reversal Example: pair 'Col1|a;Col3|b' implies'Col3|b;Col1|a'
• Type extension. Example: column 'Col1|a' implies'Col2|a'
• Data graph extension. Example: column 'Col1|a' implies'Col2|b'if 'Col1|a'
and'Col2|b'appear in the same row
• Allows additional semantic data to be used to greatly increase the number columns that can be matched in a table

D4M-21
Semantic Pair (Analytic 8) Diagram
• Define column pair sets c1 and c2 • Extend all columns via semantic information • Get all columns c1 and c2
• Find rows r12 that have one entry in c1 and c2
Row Key (time) 1 01-10-2001 01 01 00
2 01-10-2001 01 02 00
3 01-10-2001 01 03 00
4 01-10-2001 01 04 00
5 01-10-2001 01 05 00
6 01-10-2001 01 06 00
Accumulo Table: T c1
• Checks to see if semantic pairs are present in the same row
c2
r12
c1 c1 c2 c2

D4M-22
• Exploded Schema allows rapid access to both rows and column
• Graph analytics can be implemented as a sequence of row and column queries
• Complex analytics can be implemented via matrix multiply
Summary

D4M-23
Example Code & Assignment
• Example Code (end of Lecture 3 and start of lecture 4) – d4m_api/examples/2Apps/1EntityAnalysis – d4m_api/examples/2Apps/2TrackAnalysis
• Assignment 3 – For your associative arrays in Assignment 1 compute
three different cross correlations using matrix multiply – Explain the meaning of each cross-correlation

MIT OpenCourseWarehttps://ocw.mit.edu
RES.LL-005 Mathematics of Big Data and Machine Learning IAP 2020
For information about citing these materials or our Terms of Use, visit: https://ocw.mit.edu/terms.