simulation and analysis of the effect of change of ... · nishat sultana1, abdul ahad2, md. kamrul...
TRANSCRIPT

International Journal of Science and Research (IJSR) ISSN (Online): 2319-7064
Index Copernicus Value (2013): 6.14 | Impact Factor (2013): 4.438
Volume 4 Issue 2, February 2015
www.ijsr.net Licensed Under Creative Commons Attribution CC BY
Simulation and Analysis of the Effect of Change of
Different Parameters on the Characteristics of PV
Cell Using LTspiceIV
Nishat Sultana1, Abdul Ahad
2, Md. Kamrul Hassan
3
1P.G Student, American International University-Bangladesh, Department of EEE, Bonani, Dhaka 1213, Bangladesh
2P.G Student, Department of EE, University of Windsor, 401 Sunset Avenues, N9B3P4, Windsor, Ontario, Canada
3Assistance professor, American International University-Bangladesh, Department of EEE, Bonani, Dhaka 1213, Bangladesh
Abstract: This paper presents the effect of change of temperature, solar irradiance, series resistance and shunt resistance on
Photovoltaic (PV) cell. To observe these phenomena models of PV system are constructed using LTspice IV. The main aim of the work
is to observe the output power for different environmental condition. The changes of these parameters have significant effect on the I-V
and P-V characteristics curve of PV cell. Simulations are performed to exhibit these effects.
Keywords: temperature, irradiance, series-resistance, shunt-resistance, PV cell.
1. Introduction
The renewable energy sources have become more desirable
because of the critical situation of the conventional fuels.
Over the past 20 years the demand of solar energy is
increased by 20% to 25% [6]. PV cell involves the
technology to convert the energy of the sun directly to
electricity. But the electricity production has a great
influence of the environment and the manufacturing of the
solar cell. As the temperature is increased it is observed that
the short circuit current is slightly increased and the open
circuit voltage of PV cell is decreased rapidly [8]. With the
reduction of solar irradiance the short circuit current is
reduced. But the open circuit voltage is not changed
significantly. After a certain point it is reduced drastically.
Increase of series resistance of PV cell creates higher voltage
drop between the junction and terminal and the current
controlled portion of the I-V characteristics curve is moved
towards the origin [10]. With the decrease of shunt resistance
the current passing through the shunt resistance is improved
and in the I-V characteristics curve the voltage controlled
portion is moved towards the origin [10].
The change of different parameters has consequences on the
characteristics curves of PV cell. This paper contains a brief
description of the PV cell and provides the modelling in
LTspice IV and simulations, which can be used as a
reference.
LTspice IV is powerful, high-performance and fast enough
software, it is easy to construct different circuit models and to
simulate, also provides the accurate simulation result. The
features of LTspice are that it can perform the simulations
which are based on transient, AC, noise and DC analysis.
Even the Fourier analysis is possible to implement [11]. To
execute the simulations LTspice IV is used because of its
benefits. This is a completely free simulation tool. It is
available effortlessly from LTC website and is supported by
many operating systems, such as Windows NT4.0, Me, XP,
Vista, Windows 7, Windows 8, Windows 8.1. This software
also runs on Linux.
2. PV Cell Modeling
A solar cell works as a current source. At the junction of n-
type and p-type semiconductor material it behaves like a
diode, which is considered to be parallel to the current
source. The ideal equivalent circuit of a solar cell is shown in
figure 1.
The diode current is given by the equation 1. Here, voltage
across the diode is Vd, electron charge is q, T is the
temperature at junction in Kelvin, K is the Boltzmann’s
constant and Io is called the reverse saturation current.
Id = Io (eqVd/kT
– 1) (1)
Equation of load current is,
IL = Iph – Id
IL = Iph - Io (eq Vd /kT
– 1) (2)
When terminals are short circuited,
Isc = Iph - Io (e q 0/kT
– 1)
Isc = Iph (3)
When terminals are open circuited,
Vd =VL =Voc
Voc = (kT/q) ln ( (Iph / Io) + 1 ) (4)
Figure 1: Ideal Equivalent Circuit of a Solar Cell
Paper ID: SUB15942 63

International Journal of Science and Research (IJSR) ISSN (Online): 2319-7064
Index Copernicus Value (2013): 6.14 | Impact Factor (2013): 4.438
Volume 4 Issue 2, February 2015
www.ijsr.net Licensed Under Creative Commons Attribution CC BY
A practical equivalent circuit of a solar cell (Fig. 2) contains
a current source, a diode and a shunt resistance Rp parallel to
it. A series resistance Rs connected in between the junction
and the load [5].
Equation of load current is,
IL = Iph – Id – Ip
IL = Iph - Io (e q(VL + IL Rs)
/kT
– 1) – ( (VL + IL Rs ) / RP ) (5)
When terminals are short circuited,
Isc = Iph - Io (e q Iph Rs
/ kT
– 1) – ( Iph Rs / RP ) (6)
When terminals are open circuited, the obtained Voc is same
as ideal case.
Voc = (kT/q) ln ((Iph / Io) + 1 ) (7)
Figure 2: Practical Equivalent Circuit of a Solar Cell
3. Background of Research
Figure 3 shows the I-V and P-V characteristics curve of the
solar cell.
Figure 3: I-V and P-V Characteristics Curve of Solar Cell
Maximum power is obtained at the output of a solar cell for a
single operating point. If a certain amount of load is
connected, for the load current IL and load voltage VL the
obtained power at load is PL. But for a specific value of load
connected the load current (IL = Impp) and load voltage (VL =
Vmpp) and the power acquired is maximum, Pmax. Fill factor
which indicates the quality of a solar cell, is defined as the
ratio of maximum power and the product of Voc and Isc.
Change in parameters effect the I-V characteristics curve as
well as the value of maximum power. So, it is important to
realize the influence of the change of these parameters.
4. Development of Equivalent Cell
When single cells are connected in series, the voltage at the
output is increased. This is because the cell voltage of every
cell will be added (Figure 4).
Figure 4: Cascading single Cells in series
Instead of the construction above the cascaded cell can be
represented as figure 5.
Figure 5: Reconstruction of three single cells in series.
Equation for load voltage for n numbers of cells connected in
series,
VL = nVd – nRSIL
VL = n ( Vd – RSIL ) (8)
If the single cells are connected in parallel the cell current is
increased, as because the current of each cell is being added
(figure 6).
Figure 6: Cascading single cells in parallel.
Instead of the construction above the cascaded cell can be
represented as figure 7.
Figure 7: Reconstruction of three single cells in parallel.
Paper ID: SUB15942 64
International Journal of Science and Research (IJSR) ISSN (Online): 2319-7064
Index Copernicus Value (2013): 6.14 | Impact Factor (2013): 4.438
Volume 4 Issue 2, February 2015
www.ijsr.net Licensed Under Creative Commons Attribution CC BY
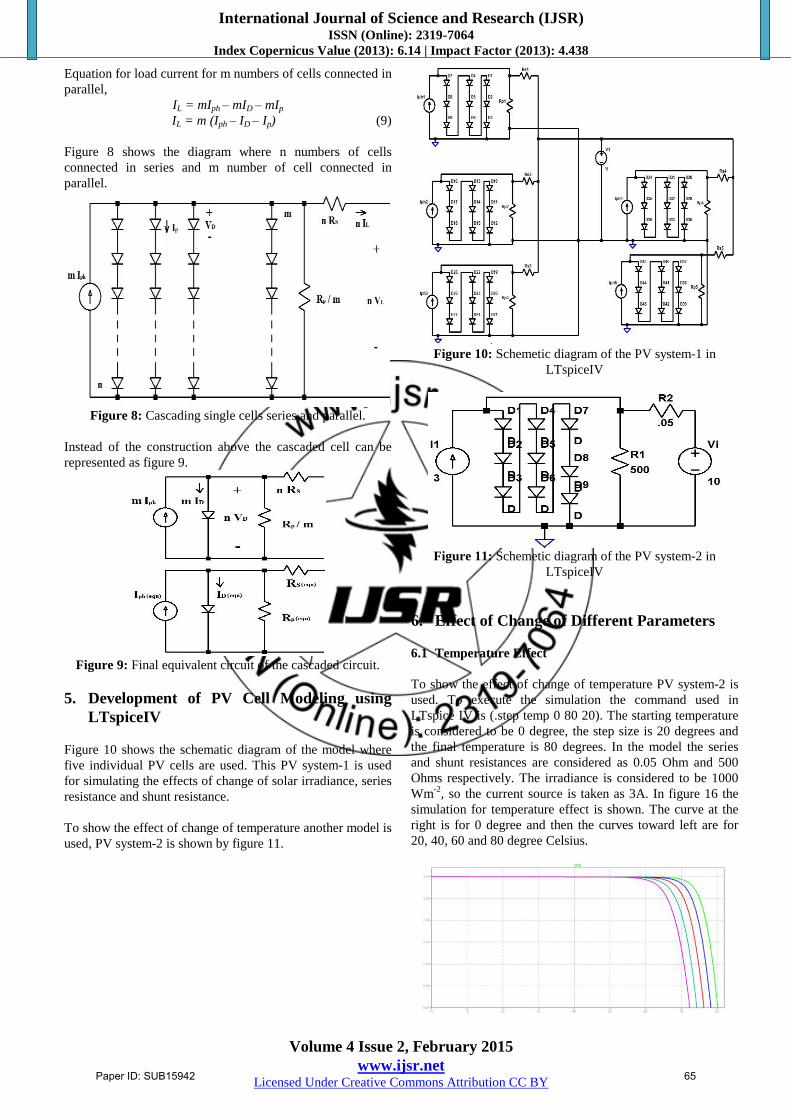
Equation for load current for m numbers of cells connected in
parallel,
IL = mIph – mID – mIp
IL = m (Iph – ID – Ip) (9)
Figure 8 shows the diagram where n numbers of cells
connected in series and m number of cell connected in
parallel.
Figure 8: Cascading single cells series and parallel.
Instead of the construction above the cascaded cell can be
represented as figure 9.
Figure 9: Final equivalent circuit of the cascaded circuit.
5. Development of PV Cell Modeling using
LTspiceIV
Figure 10 shows the schematic diagram of the model where
five individual PV cells are used. This PV system-1 is used
for simulating the effects of change of solar irradiance, series
resistance and shunt resistance.
To show the effect of change of temperature another model is
used, PV system-2 is shown by figure 11.
Figure 10: Schemetic diagram of the PV system-1 in
LTspiceIV
Figure 11: Schemetic diagram of the PV system-2 in
LTspiceIV
6. Effect of Change of Different Parameters
6.1 Temperature Effect
To show the effect of change of temperature PV system-2 is
used. To execute the simulation the command used in
LTspice IV is (.step temp 0 80 20). The starting temperature
is considered to be 0 degree, the step size is 20 degrees and
the final temperature is 80 degrees. In the model the series
and shunt resistances are considered as 0.05 Ohm and 500
Ohms respectively. The irradiance is considered to be 1000
Wm-2
, so the current source is taken as 3A. In figure 16 the
simulation for temperature effect is shown. The curve at the
right is for 0 degree and then the curves toward left are for
20, 40, 60 and 80 degree Celsius.
Paper ID: SUB15942 65

International Journal of Science and Research (IJSR) ISSN (Online): 2319-7064
Index Copernicus Value (2013): 6.14 | Impact Factor (2013): 4.438
Volume 4 Issue 2, February 2015
www.ijsr.net Licensed Under Creative Commons Attribution CC BY
Figure 12: Temperature effect on I-V and P-V curves
6.2 Irradiance Effect
The value Iph is varied due to the change in value of solar
irradiance. At short circuit condition the current is
proportional to solar irradiance, G. It is observed that, for
1000 Wm-2
solar irradiance a solar cell behaves like a 3A
current source. If the obtained ratio is, Kr = (3 / 1000), with
the help of the equation, Isc = Kr * G, it is calculated that for
radiations of 800 Wm-2
, 600 Wm-2
, 400 Wm-2
and 200 Wm-2
the value of the current sources are 2.4A, 1.8A, 1.2A and
0.6A. In the model the series and the shunt resistances are
considered as 0.05 Ohm and 500 Ohms respectively. The
simulations of I-V and P-V characteristics curves for
different solar irradiance are demonstrated in figure 13.
Figure 13: Irradiance effect on I-V and P-V curves
6.3 Effect of change in series resistance
Figure 14 demonstrates the simulation for different values of
series resistance. The solar irradiance is kept fixed at
1000Wm-2
, the temperature is 25 degree Celsius, and the
shunt resistance is 500 Ohms. The values of series resistance
used are 0.05 Ohm, 0.5 Ohm, 1 Ohm, 5 Ohms and 10 Ohms.
Figure 14: Effect of change of series resistance
6.4 Effect of change in shunt resistance
Figure 15 shows the simulation for different values of shunt
resistance. The solar irradiance is 1000Wm-2
, temperature is
25 degree Celsius, and series resistance is 0.05 Ohm. Values
of shunt resistance are 500 Ohms, 50 Ohms, 10 Ohms, 3
Ohms, and 1 Ohm.
Figure 15: Effect of change of shunt resistance
7. Simulation Results
From the simulations implemented for temperature effect
(Figure 12), the observed differences in parameters due to the
increase in temperature are summarised in table 1.
Paper ID: SUB15942 66

International Journal of Science and Research (IJSR) ISSN (Online): 2319-7064
Index Copernicus Value (2013): 6.14 | Impact Factor (2013): 4.438
Volume 4 Issue 2, February 2015
www.ijsr.net Licensed Under Creative Commons Attribution CC BY
Table 1: Effect of temperature
Temperature
(degree)
Open circuit
voltage, Voc
(V)
Short circuit
current, Isc
(A)
Maximum
Power, Pmax
(W)
0 8.02 3 20.66
20 7.83 3 19.96
40 7.63 3 19.22
60 7.43 3 18.51
80 7.23 3 17.81
From the simulation data it is obtained that the open circuit
voltage is decreased with increase in temperature, but the
short circuit current is reduced negligibly. At 0 degree the
output power is maximum. Then it is reducing gradually.
Due to the decrease of solar irradiance the observed
differences in parameters are summarised in the Table 2.
Table 2: Effect of Irradiance
Irradiance, G
(Wm-2)
Open circuit
voltage, Voc
(V)
Short circuit
current, Isc
(A)
Maximum
Power, Pmax
(W)
1000 7.76 3 19.70
800 7.71 2.4 15.68
600 7.64 1.8 11.67
400 7.54 1.2 7.69
200 7.38 0.6 3.71
From the simulation data it is observed that the open circuit
voltage and short circuit current is reduced with the reduction
of solar irradiance. The output power is maximum at height
irradiance and then it is gradually decreased with the
irradiance reduction.
Observed differences due to the change in series resistance is
summarised in the Table 3.
Table 3: Effect of change of series resistance Series
resistance,
RS (Ohm)
Open circuit
voltage, Voc
(V)
Short circuit
current, Isc
(A)
Maximum
Power, Pmax
(W)
.05 7.76 3 19.74
.5 7.76 3 15.99
1 7.76 2.99 12.24
5 7.76 1.52 2.97
10 7.76 0.77 1.48
With the increased series resistance short circuit current is
reduced insignificantly, but for much high value of series
resistance the short circuit current is decreased appreciably.
But the open circuit voltage remains the same and the value
of maximum output power is also reduced.
Observed differences due to the change in series resistance is
summarised in the Table 4.
Table 4: Effect of change of shunt resistance Shunt resistance
RP (Ohm)
Open circuit
voltage, Voc (V)
Short circuit
current, Isc (A)
Maximum
Power, Pmax (W)
500 7.76 3 19.70
50 7.75 3 18.85
10 7.69 2.99 15.17
3 7.36 2.95 6.68
1 2.99 2.86 2.15
With the decreased of shunt resistance the open circuit
voltage is slightly reduced, but for a very low value of shunt
resistance it is decreased significantly. The short circuit
current is affected very less. The output power is reduced and
for a very small shunt resistance the power is very low.
8. Conclusion
As the temperature is increased in a semiconductor, the
energy band is reduced. Due to this the solar cell absorbs
more photon of incident radiation. The photo current Iph is
slightly increased. But the reverse saturation current
increases appreciably with the increase of temperature. Due
to this the open circuit voltage is reduced [9].
The short circuit current is proportional to solar irradiance G.
In case of open circuit voltage Voc, it is proportional to ln(G).
With the decrement of irradiance there is no significant
change in Voc. Later from a certain value of radiation Voc is
reduced radically.
If the series resistance of PV cell is increased, that will cause
higher voltage drop between the junction and the load
terminal for equal of initial current. Due to this, in the I-V
characteristics curve the current controlled portion is moved
down towards the origin. The short circuit current decreases
slightly with the increase of series resistance. If a large value
of series resistance is used then short circuit current will
decrease significantly [10]. But the open circuit voltage is not
influenced much because of series resistance value [1].
When the shunt resistance is decreased, the portion of the
total current passing through the shunt resistance is increased.
As a result of this, in the I-V characteristics curve the voltage
controlled portion is moved down towards the origin. The
open circuit voltage decreases slightly with the reduction of
shunt resistance. If a very small value of shunt resistance is
used then open circuit voltage will decrease significantly
[10]. The short circuit current is less affected.
It is essential to know the impact of change of different
parameters on the I-V and P-V characteristics curve of solar
cell. They vary the open circuit voltage, short circuit current
as well as the maximum power. In case of tracking the
maximum power point of solar cell using different
algorithms, the effect of these parameters can be very useful.
9. Future Scope
In this research PV system-2 is designed by using a code in
LTspice IV to study the temperature effect. In future new
models should be designed using codes to observe the effect
of the other three parameters. To design a circuit which is
smaller than PV system-1 using codes in LTspice IV will
save time and reduce complexity. With the knowledge of
these impacts on the output it is possible to improve the
efficiency of the solar cell.
Paper ID: SUB15942 67

International Journal of Science and Research (IJSR) ISSN (Online): 2319-7064
Index Copernicus Value (2013): 6.14 | Impact Factor (2013): 4.438
Volume 4 Issue 2, February 2015
www.ijsr.net Licensed Under Creative Commons Attribution CC BY
References
[1] Luis Castaner and Santiago Silveltre, “Modelling
Photovoltaic Systems using PSpice”, John Wiley &
Sons LTD, England, 2002, Chapter-3.
[2] M. Lokanadham and K. Vijaya Bhaskar, “Incremental
Conductance Based Maximum Power Point Tracking
(MPPT) for photovoltaic System”, International Journal
of Engineering research and Applications, volume 2,
Issue 2, Mar-Apr 2012, pp. 1420-1424
[3] AZM Shahriar Muttalib, SM Ferdous, A Mortuza
Saleque, Nawjif Md Anamul Hasan, Md Masoom
Chowdhury, “Design and Simulation of an Inverter with
High Frequency Sinusoidal PWM Switching Technique
for Harmonic Reduction in a Standalone/ Utility Grid
Synchronized Photovoltaic System”, IEEE,
International Conference on Informatics, Electronics &
Vision, page 1168-1173, 18 May 2012.
[4] AA Mansur, SM Ferdous, Zubaeer Bin Shams, Md
Rokibul Islam, Mohammad Rokonuzzaman, Md
Ashraful Hoque, “An experimental investigation of the
real time electrical characteristics of a PV panel for
different atmospheric conditions in Islamic University
of Technology (OIC), Gazipur, Bangladesh”, IEEE,
2011 International Conference on Utility Exhibition on
Power and Energy Systems: Issues & Prospects for Asia
(ICUE), page 1-8, 28 September 2011.
[5] SM Ferdous, Mahir Asif Mohammad, Farhan Nasrullah,
Ahmed Mortuza Saleque, AZMS Muttalib, “Design and
simulation of an open voltage algorithm based
maximum power point tracker for battery charging PV
system”, IEEE, 2012 7th International Conference on
Electrical & Computer Engineering (ICECE), page 908-
911, 20 December 2012.
[6] Tarak Salmi, Mounir Bouzguenda, Adel Gastli and
Ahmed Masmoudi, “Matlab/ Simulink Based Modelling
of Solar Photovoltaic Cell”, International Journal of
Renewable Energy Research, volume 2, No. 2, 2012.
[7] Oday Mohammed, Abdul wahhab, “Improvement of the
MATLAB/ Simulink Photovoltaic System Simulator
Based on a Two-Diode Model”, International Journal of
Soft Computing and Engineering, volume 4, Issue 1,
March 2014.
[8] https://nationalvetcontent.edu.au/alfresco/d/d/workspace
/SpacesStore/4e1e0e97-bc55-4c44-a692-
4d31f4d0d934/13_02/content_sections/learn_about/08_
solar_page_006.htm
[9] Pradhan Arjyadhara, Ali S.M, Jena Chitralekha,
“Analysis of Solar PV cell Performance with Changing
Irradiance and Temperature “, International Journal Of
Engineering And Computer Science , Volume 2 Issue 1,
Jan 2013, Page No. 214-220.
[10] http://en.wikipedia.org/wiki/Theory_of_solar_cells
[11] http://en.wikipedia.org/wiki/LTspice
Author Profile
Nishat Sultana received her B.Sc. degree in Electrical
and Electronic Engineering from American
International University-Bangladesh (AIUB) in 2013.
Presently she is a P.G student in AIUB. Her research
area of interest is renewable energy sources.
Abdul Ahad has obtained his B.Sc. degree in
Electrical and Electronic Engineering from American
International University-Bangladesh (AIUB) in 2012.
Currently he is a P.G student in University of Windsor,
Ontario, Canada. His current research interests include
power system and solar energy.
Dr. Md. Kamrul Hassan has obtained his B.Sc.
degree in Electrical and Electronic Engineering from
Bangladesh University of Engineering and
Technology, (BUET), Dhaka in 1987 and his Dr. of
Engineering degree in Plasma Science and
Engineering (Plasma Deposition & Electrical Characterization of
Diamond-Like Carbon (DLC) Thin Films) from Kochi University
of Technology, Japan, in 2007. Presently he is an Assistant
Professor at the American International University-Bangladesh
(AIUB).
Paper ID: SUB15942 68