simulation modelling to improve productivity in rice
TRANSCRIPT
SIMULATION MODELLING TO IMPROVE PRODUCTIVITY IN RICE
PACKAGING MILL
LAI SAW WAI (PC 10031)
Thesis submitted in fulfillment of the requirements for the award of the
Bachelor of Industrial Technology Management with Honors
Faculty of Technology
UNIVERSITI MALAYSIA PAHANG
2013
VI
ABSTRACT
In this study, it discusses about bottlenecks occurs t the Rice Packaging Line by using the
simulation to improve the productivity. The scope of this study is focusing on the
packaging process in the Rice Packaging Line. The aim and objectives of this study is to
identify bottlenecks and increase productivity in total. The time frame given to complete
this project is one year starting from the year of 2012. This study is conducted by using
the ARENA simulation software to simulate the modeled process in the simulation
software. It is a quantitative study in which the performance is measured by the
productivity for the whole system of production line. The altering of productivity and the
resource utilization are able to provide an improvement of about 40percent in the current
system which is 87 packs of rice per day.
Keywords: Productivity, Utilization, ARENA Software, Simulation, Rice Packaging line

VII
ABSTRAK
Kajian ini membincangkan tentang produktiviti untuk Proses Pembungkusan Beras dengan
menggunakan simulasi bagi meningkatkan produktiviti. Skop kajian ini memberi tumpuan
kepada proses pembungkusan di Process Pembungkusan Beras. Tujuan dan objektif kajian ini
adalah untuk mengenal pasti kesesakan dan meningkatkan produktiviti. Tempoh masa yang
diberikan untuk menyiapkan projek ini adalah satu tahun bermula dari tahun 2012. Kajian ini
dijalankan dengan menggunakan perisian simulasi ARENA untuk mensimulasikan proses
dimodelkan dalam perisian. Ia adalah satu kajian kuantitatif di mana prestasi diukur dengan
produktiviti bagi keseluruhan sistem pengeluaran. Yang mengubah produktiviti dan
penggunaan sumber yang dapat memberikan peningkatan sebanyak kira-kira 40percent
dalam sistem semasa atau 87 pek beras bagi setiap hari.
Kata kunci: Productiviti, Pengunaan Sumber, ARENA Perisian, Simulasi, Proses
Pembungkusan Beras
VIII
TABLE OF CONTENT
TITLE PAGE
SUPERVISOR’S DECLARATION
STUDENT’S DECLARATION
DEDICATION
ACKNOWLEDGEMENTS
ABSTRACT
ABSTRAK
TABLE OF CONTENTS
LIST OF TABLE
LIST OF FIGURE
ii
iii
iv
v
vi
vii
viii
xii
xiii
CHAPTER 1 INTRODUCTION
1.1 Introduction 1
1.2 Background of Study 1
1.3 Problem Statement 5
1.4 Research Objective 7
1.5 Research Question 7
1.6 Scope of the Study 8
1.7 Significant of Study 8
1.8 Operation Definition 9
2 LITERATURE REVIEW
2.1 Introduction 11
2.2 Introduction to Simulation
11
2.3 Difference Between Modeling and Simulation 13
2.4 Productivity 15
IX
2.5
2.6
Role of Simulation In Productivity Improvement
Bottlenecks
15
16
2.7 Area of Application By Simulation 17
2.7.1. Simulation In Manufacturing Industries 17
2.7.1.1 Manufacturing System Design
2.7.1.2 Manufacturing System Operation
18
20
2.7.1.3 Simulation Language/Package Development 21
2.7.2 Simulation In Transportation 21
2.7.3 Simulation In Service Industries
22
3 METHODOLOGY
3.1 Introduction 24
3.2 System Description 24
3.3 Step In Simulation 27
3.4 Formulate the Problem 27
3.5 Collect Information/ Data and Construct Conceptual Model 29
3.5.1. Verified 29
3.5.2. Validated 30
3.6 Is The Conceptual Model Valid? 30
3.7 Program The Model 31
3.8 Is The Programmed Model Valid? 31
3.9 Design, Conduct, and Analyze Simulation Experiment 32
3.10 Document and Present The Simulation Result 32
3.11 Discrete Event Model Simulation 33
X
3.12 Simulation In Arena 34
3.13 Data Collection Method 35
3.13.1 Historical Data 35
3.13.2 System Observation 36
4
4.1
4.2
4.3
4.4
4.5
4.6
4.7
4.8
4.9
4.10
4.11
5
5.1
5.2
5.3
DATA ANALYSIS AND MODELLING
Introduction
Process Performance
Model Development By Simulation
Model Verification And Validation
Data Analysis
4.5.1 Introduction
Productivity And Efficiency
Total Time Per Entity
Accumulated Time
Resource Utilization
Queuing
Work In Progress (WIP)
RECOMMENDATION AND CONCLUSION
Introduction
Result Discussion
Model Modification
37
37
45
50
52
52
52
54
56
58
59
60
61
61
63
XI
5.4
5.5
5.3.1 What if removing one polisher machine
5.3.2 What if increase two more packaging line by assigning
two more well trained workers
5.3.3 What if all the two scenario put together in the
simulation
Recommendation
Conclusion
REFERENCE
63
66
71
75
77
79

XII
TABLE NO
Table 4.1
Table 4.2
Table 4.3
Table 4.6.1
Table 4.7.1
Table 4.8.1
Table 4.8.2
Table 4.9.1
Table 4.10.1
Table 5.1
Table 5.2
Table 5.3
Table 5.4
Table 5.5
Table 5.6
Table 5.7
Table 5.8
Table 5.9
LIST OF TABLE
TITLE
Worker in Working Station
Table for Production and Demand in Year 2012
Number of Machine in Each Process
Table of Productivity
Table of Total Time per Entity
Table of Process Accumulated Value Added Time
Table of Accumulated Wait Time
Table of Resource Utilization
Table of Process Average Wait Time
Table of Productivity Difference between One Polishing
Machine and Two Polishing Machine
Table of Utilization Difference between One Polishing
Machine and Two Polishing Machine
Table of Productivity Between 2 and 4 Workers In The
Packaging Line
Table of Cost per Benefit after Reduction of Workers Wages
Table of Difference Utilization between Workers
Table of Changes of Queuing Numbers
Comparison Production Output (Packs) from Different
Scenario
Average Workers Utilization in Each Situation
Table of Average Machine Utilization
Pg
41
44
46
53
55
57
57
59
60
64
65
67
68
69
70
72
73
74
XIII
FIGURE NO
1.1
2.1
3.1
3.2
3.3
3.4
3.5
3.6
3.7
3.8
4.1
4.2
4.3
4.4
4.5
4.6
4.7
4.8
4.9
4.10
4.11
LIST OF FIGURE
TITLE
Increase of production run-time Anwar. A (2008)
National Advanced Driving Simulator (NADS)
Process Flow of Rice Processing and Packaging Mill
Process Descriptions In Rice Processing and Packaging Mill
Conveyor belt with scoop attach on it
Conveyor belt with scoop attach on it
A Seven-Step Approach for Conducting a Successful
Simulation
Verification and Validation
Discrete Representation of The Material Arriving
The Way of Discrete Representation Work
Example of model develop by Arena
Results From Input Analyzer
Fill In Input Analyzer Result In CREATE Module
Schedule for Worker Pull in Station Tank 1
Schedule for Packaging worker 1 in Packaging 1 station
Schedule for packaging worker 2 in Packaging 2 station.
Graph of Production and Demand from January to December
2012
Model of Packaging line in ARENA software
Starting Window
Properties of the CREATE module in rice packaging process
Properties of the Process Module
Properties of Assign Module
Pg
4
22
24
24
25
27
30
33
33
35
40
41
42
42
43
44
45
47
48
48
49
XIV
Figure 4.12
Figure 4.6.2
Figure 4.7.2
Figure 4.8.1
Figure 4.8.2
Figure 5.1
Figure 5.2
Figure 5.3
Figure 5.4
Figure 5.5
Figure 5.6
Figure 5.7
Figure 5.8
Figure 5.9
Figure 5.10
Figure 5.11
Figure 5.12
Figure 5.13
Properties of Decide Module
Graph of Process Productivity
Result for Wait Time Per Entity
Graph of Accumulated Value Added Time
Graph of Accumulated Wait Time
Removing of Polishing Machine
Graph of Productivity Difference between One Polishing
Machine and Two Polishing Machine
Graph of Utilization Difference between One Polishing
Machine and Two Polishing Machine
Adding of two Packaging Station
Graph of Increase for Productivity
Graph of Cost per Benefits after Reduction of Workers
Wages
Graph of Difference Utilization between Workers
Graph of Change of Queuing Units
Figure of 2 Scenario Put In Together
Graph of Production Output (Packs) from Different
Scenario
Graph of Average Workers Utilization in Each Situation
Graph of Average Machine Utilization
Graph of WIP in Different Situation
50
53
55
57
58
63
64
65
66
67
68
69
70
71
72
73
74
74
- 1 -
CHAPTER 1
INTRODUCTION
1.1 INTRODUCTION
In this chapter, we will discuss on how the rice processing and
packaging mill handle rice production process to fulfill the demand of their
customers especially during festival seasons. Besides that, we also try to find
out where is the bottleneck occurs in the production process that prohibit this
rice mill to produce expected amount required.
The purpose of this study is to establish a practical tool namely
simulation model to resolve production problem faced in rice production
systems. As an investigation, many studies have reported about simulation.
The common area been applied include the manufacturing industries and
service industries. By using the method with refer to those reports so that we
can propose a somewhat different solution that is, first built production
system model simulator.
1.2 BACKGROUND OF STUDY
Rice milling is an essential stage in production of rice. The basic
objective of a rice milling system is to remove the husk and the bran layers to
produce an edible, white rice kernel that is sufficiently milled and free of
impurities. Rice processing mill have play an important role in our daily life.
According to Food Frequency Questionnaire (FFQ) (2012) which is

- 2 -
conducted by Malaysian Adults Nutrition Survey (MANS) towards the eating
habits for Malaysian, among 126 food items pattern that have been
investigated in the year 2008, results demonstrate cooked rice is the most
common food that consume daily with 97% of the population twice daily
(average 2½ plates per day). Other food items consumed less frequently were
marine fish, green leafy vegetables and sweetened condensed milk.
Addition information from Pan Properties (2013), forecasted
population of Klang Valley in year 2020 would be 7.8million. It has shows
an increase of 11% citizen as compared to 6.9 million of population in year
2013. Due to rapid population growth, increasing demand during normal or
peak season and the rising number of competitors in the market, the rice mill
are now aiming to have a higher production enhancement towards their
packaging process by trying the ways such as import other countries/state
rice, invest in a new machine center (with typically higher capacities) and
even develop an additional production line to find out the bottleneck and
alleviate the supply inefficient.
Because of the existing method used by the company are cost
ineffective, time wasting and technically challenging, we suggested the use
of simulation to take over the existing method so that management level can
solve the problem more effectively. Our objectives now is to improve the rice
packaging output, speed up the process by eliminating the bottleneck and
maximizing the utilization of machines to produce rice in larger amount,
faster speed, less mechanical stresses and in the better quality.
According to the information we get from the rice mill industries, the
productivity improvement can be make in the aspect of total processing time,
queuing and maximized machine utilization. Therefore, in this research we
help this rice mill to improve the above requirement with the assists of
simulation software. With simulation modeling, then there will have no
- 3 -
problem in interrupting the real operation.
Simulation is a tool that can be use to encompass interpretations in
variety field. It is a problem-solving methodology for the solution of many
real-world problems. It is used to describe and analyze the behavior of a
system, ask what-if questions about the real system, and aid in the design of
real systems. Both existing and conceptual systems can be modeled using
simulation, says Lean. M (2010). The questions like: What could be the
effective design for a new telecommunications network? What are the
associated resource requirements? How will a telecommunication network
perform when the traffic load increases by 50%? Can be solving by using
simulation. As written by Kelton, Sadowski, and Swets (2010), simulation is
a method of collection of data and applications of the theories that are going
to mimic the behavior of real systems. It is a specific application of models to
arrive at some outcome that enables us to have a clear vision through a
computer with appropriate software for example Arena.
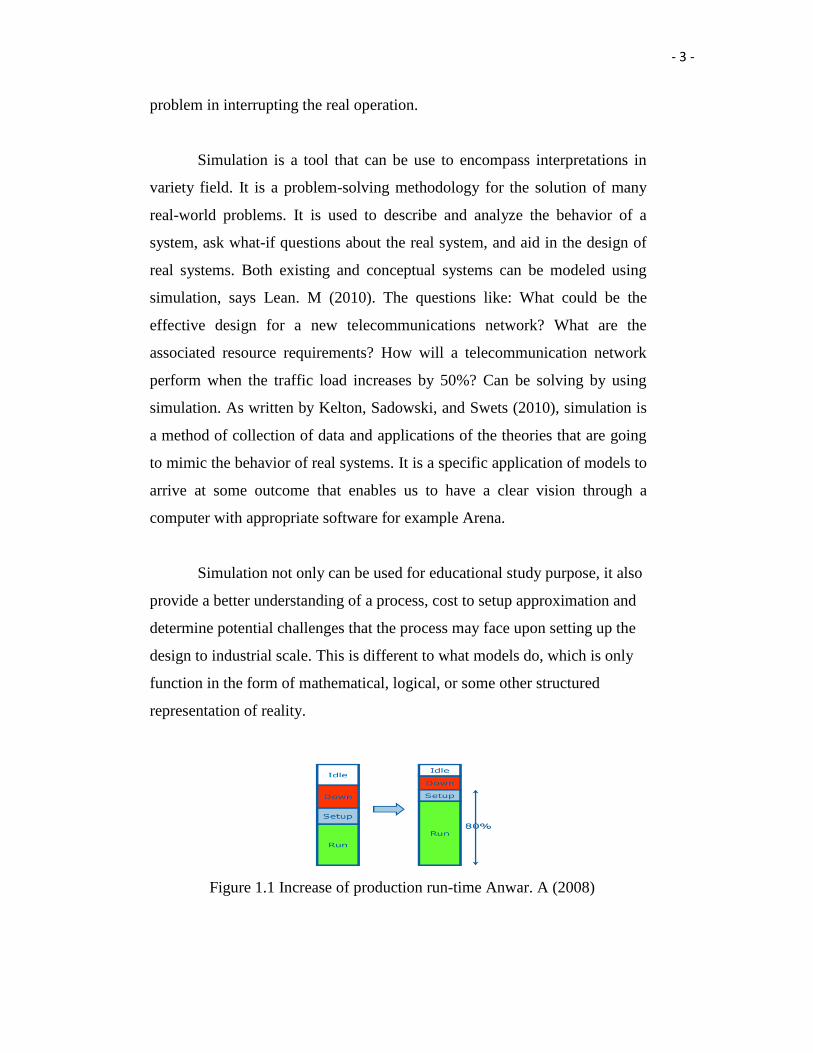
Simulation not only can be used for educational study purpose, it also
provide a better understanding of a process, cost to setup approximation and
determine potential challenges that the process may face upon setting up the
design to industrial scale. This is different to what models do, which is only
function in the form of mathematical, logical, or some other structured
representation of reality.
Figure 1.1 Increase of production run-time Anwar. A (2008)
- 4 -
By referring to Anwar. A (2008), he proposes that the development of
model using simulation can be use as utilization improve tool. This tool can
assists company in reduce machine downtime by reduce the assists, failure
and save the awaiting time of operator/ technician to repair jammed machine.
It also helps to reduce the ideal time because simulation can make a better
forecasting that avoid material shortage and also avoid operator
unavailability. Anwar, also claims that simulation helps to reduce yield
loss/rework and reduce work pace/ skill variation.
The successful of implementing a predominant method for increasing
the productivity is one of the major criteria to be concern in business.
Problems that often faced by organization are related with decision on the
appropriate number of machine, task assignments, and production plan. By
reducing the bottleneck problem of some machine in the rice packaging line
and finding appropriate setting of parameters at each operation in the system,
the total processing time will be decreased.
In the past few years, there have been a number of researches study
about varying aspects on how to increase productivity and it had achieved a
significant success by using simulation model. With the help of simulation in
various industries such as, manufacturing, healthcare, restaurant drive
through, airport security and mining, companies have been able to design
efficient production and business systems, troubleshoot potential problems,
improve systems performance indicators, and can meet company requirement
by cut cost, meet targets, and boost sales and profits. Simulation modeling
has been playing a major role in designing, analyzing, and optimizing
engineering systems in a wide range of industrial and business applications
since its existence the last decade.
In the scope of our research, first step of the normal rice processing
- 5 -
mill that is husking stage will exclude, this is so because the rice mill that
we study is a two step process, in two step process husking stage will be
process by their supplier which comes from various places at Kedah such as
Sungai Rengar and Pokok Sena. After harvesting, the paddy will undergo
the process of cleaning, a machine called paddy cleaner will process the
harvest rice where foreign objects like stones and tree stumps are remove.
Then, follow by husking, this process brings the cleaned paddy after to the
next step where husk is separated from it. After the husk is removed, the
product is named as brown rice and is ready to send to the next process
cycle. This clean and hull removed brown rice will be send to our rice
processing mill. The following process will be continued explain at chapter
3.
1.3 PROBLEM STATEMENT
In this study, we will make an investigation at a rice processing and
packaging mill. We try to solve some problem face by the rice mill such as
unachievable amount of production due to appear of bottlenecks that make
the company letting out the chance of getting more customers as they are not
able to supply enough stock to customers. This has caused some of the
customers to buy competitors rice as a substitute. With that, we also need to
know what is the requirement needed to achieve to prevent the company
reputation and profit affected.
Besides that, the management level of the company also hopes to
increase accuracy and reliability of their operation system. Due to the rice
mill are expanding their business recently, they have received increase order
from their customer compare to before therefore, it is a need for the company
make sure the reliability of the operation process so that production system
can ensure they can provide their rice supply consistently. Therefore, there is
need for us to implement simulation model so that it can help us to smoothen
the production line.
- 6 -
Third problem is how to alter process so that it would be suitable for
the use of rice mill. It is a difficult job to measure the detailed properties as
the process may have too many different packaging formats, coupled with the
frequent replacement in the process. Ineffective planning in production line
may cause time and cost wasting. In this case, we have to determine which
part is needed to alter in the process so that it could back into actual path.
The other problem is to define bottleneck for fully utilized machine
and to maximize the return. Occurring of bottleneck may cause the total time
to increase and decrease the productivity. The performance of a rice
processing and packaging system is closely related to the performance of all
the resource that will be schedule in the whole process. For example, an
upstream bottleneck occurs due to the machine at the previous step cannot
finish working on time this may delay rice supply on packaging.
Consequently, the problem in this packaging production line may cause the
silo jam at upstream production facilities, or even cause wasting of resources.
Modeler need to know what is the amount of rice situated at silo and
the causes of process jam. This gives concern of the need to verify the design
of facility to ensure the process will perform in accordance with expectations
and any unforeseen issues are adequately addressed prior to approval of
capital investment.
Lastly, we have to know, the specific speed for the line work and how
much rice that each machine should have accumulated to ensure that minor
stoppage profiles do not interfere with the operation of the upstream and
downstream. For instance, if the upstream machine experience jam, we
should continue the process by produce enough accumulated of input so that
conveyor can continue production until the minor error in upstream machine
is rectified. Similarly, it should have enough space on the out-feed conveyor
- 7 -
for the production, to avoid clogging if the downstream machines stop. The
goal here is to design line, in order to maximize the use of key equipment,
maximize and absorption of minor stop.
1.4 RESEARCH OBJECTIVE
This study discuss on the application of simulation on the production
performance of the rice processing and packaging mill. The objective need to
be achieved at the end of the study is:
1.) To model the rice packaging process using simulation.
2.) To propose a better strategy on how to increase performance of the
packaging process.
3.) To identify bottleneck exists in rice processing and packaging plant.
1.5 RESEARCH QUESTION
1.) What would be the suitable model for rice packaging process and method
to model it?
2.) What would be the strategy to increase the performance of the rice
packaging process?
3.) What are the potential bottleneck occur at the operating process?

- 8 -
1.6 SCOPE OF STUDY
The scope of study for this research will be focus on one of the rice
processing and packaging mill located at the industries area at Klang,
Malaysia. This rice processing mill perform the job by collecting half process
paddy (Brown rice) from supplier and this brown rice will be undergo a
series of process in the production line to turn it into a white polished rice.
The production line consists of 7 stages and each stage may have their
own responsibilities from the beginning to the packaging stage. The process
may involve input stage, de stoner, dryer, polisher, color sorter to a silo, from
a silo to auto scale and finally to the workers who package the rice according
to the amount needed. We tried to increase the throughput of production by
investigating the capability of the machine so that we can have a full
utilization of the machine by building a discrete event simulation model.
We also collected necessary data through data collection method, that
is observation, measurement of the capability and size, taking reading on the
process and having site visit to the industries to look how the process operate.
By dealing with simulation, we were using the software called ARENA to
build our model.
1.7 SIGNIFICANT OF STUDY
In order for us to have a successful project, we need to identify what
are the significant of this project? And how this project is going to benefit the
company. The significant of this study is we can build a model using
simulation method that can easily identify the bottleneck position in the rice
mill process. Simulation can be analyzer where we can make assumption on
different part of production line to see the result after make changes to the
system. Furthermore, its flexible and easy understanding animation helps us
to propose idea on how to make suitable changes to the process flow.
- 9 -
This simulation study can help industries to make comparison on the
productivity before and after implementation of new machines/workers. The
company management team which does not sure their decision making is
correct or not can refer to the model as compare alternative designs to
existing systems.
This project is also useful to the company as simulation becomes a
good alternative for the rice process that cannot interrupt anytime as we can.
Moreover, problem was solved as we can try the process on the simulator
model for several times without worry of causing damage on the actual
machine. In addition, management level can save the cost of replacing the
new system and need not employed an expertise to fix the problem if the
machine is damage during testing.
We sure that by propose this study, there would be a develop of a
complete productivity improvement methods to smoothen the job queuing,
processing time, maximize utilization at the rice processing line and find out
causes that make rice processing time slow down during the operation
because such simulation systems are commonly intractable to mathematical
analysis.
Lastly, we can also remind the firms about the importance of
productivity improvement of their product to generate a higher profit and to
stay competitive in the rice milling industry.
1.8 OPERATION DEFINITION
Simulation. Can be defined as the act of imitating the behavior of some
situation or some process by means of something suitably analogous
(especially for the purpose of study or personnel training)
Modeling. A model also can be a representation of a process—a weather
pattern, traffic flow, air flowing over a wing.
Discrete event simulation. Can be defined as suitable for problems in which
- 10 -
variables change in discrete times and by discrete steps.
Continuous event simulation. Can be defined as suitable for systems in
which the variables can change continuously
Model. A model is a representation of a real system.
Event. An event is an occurrence that changes the state of the system.
System state variables. The system state variables are the collection of all
information needed to define what is happening within the system to a
sufficient level (i.e., to attain the desired output) at a given point in time.
Process improvement. Can be defined as taking a close look at how
processes were performed, with an objective of improving efficiency and
reducing equipment downtime.
Throughput. User-measured processing speed of a machine expressed
as total output in a unit period (usually an hour) under normal
operating conditions.
Bottleneck. Can be defined as the neck and mouth of a bottle, or an area
where things become congested, caught or blocked, or a situation that causes
a delay.
- 11 -
CHAPTER 2
LITERATURE REVIEW
2.1 INTRODUCTION
In this chapter, we will discuss more on the previous research that have been done
by other researcher before. By referring all the material such as journal,
magazines, books or other information sources. We can have a clearer
understanding to what is our study about and we can take the strength and
weaknesses suggested.
2.2 INTRODUCTION TO SIMULATION
Simulation is most commonly used in places where actual environment
is difficult or costlier to duplicate such as aviation and medicine (Shahbazi et al.,
2012). It gives the user the flexibility to try new alternatives without actually
having to modify the physical system and also study the outcomes. According to
Craig. W (2006) simulation is the process of building a model of a real or
proposed system to study the performance of the system under specific
conditions. Simulation is especially powerful because it allows the observation of
the behavior of the model as time progresses. Smith (2003) also claims that
simulation as the “development of descriptive computer models of a system and
exercising those models to predict the operational performance of the underlying
system being modeled.
- 12 -
Computer simulation provides an extra layer of abstraction from reality
that allows fuller control of the progression and interaction with the simulation.
For example, a computer based airplane flight simulator may contain emergency
conditions that would be too dangerous and costly in a physical simulation
training scenario. This enables the new learner to tackle the challenge without
facing any danger in life.
Application areas for simulation are practically unlimited. Today
simulation can be used for decision-support with supply chain management,
workflow and throughput analysis, facility layout design, resource usage and
allocation, resource management and process change said by Ali. M (2003). Back
to our study, simulation seems can be a good tool to be used as we can obtain
many of the earlier research that have conducted before related to our research
title.
Moreover, Hakan. A (2003) also make some analysis toward the
ARENA windows based simulation software, he said that ARENA have made
simulation modeling not only affordable but relatively easy for managers to
initiate simulation studies of a variety of situations including operations and
processes, feasibility studies, business processes, human resource deployment,
call center staffing, capacity planning and others. He added, ARENA also makes
the task of “what-if” analysis become easiest simulation software that can be run
with minimal programming involved and equipped with scenario managers which
are designed for the purposes of “what-if” analysis. Under varying input
parameters and/or constraints “What-if” analysis can perform well with the ability
to show how a system would behave.
For the convenience reason, simulation enable analyst to add or change
variables in the mathematical or symbolic model and evaluate their effect on the
entire syste. Rajashekar.P (2012), simulation is a useful tool to assist managers in
evaluating different business options. Typically an accuracy of at least 99% of the
throughput values is achieved with the simulation models in real-life projects
- 13 -
depending on the level of detail and accurate modeling capabilities and statistic
analysis capabilities of simulation.
Jahangirian et al. (2010) has carried out a detailed review on the
application of simulation in manufacturing. The authors have classified the use of
simulation in manufacturing into 24 categories. Each of these categories has
found enough applications in the industry and the authors have sample papers in
each of these categories. One of the classifications is process engineering -
manufacturing which deals with Design, evaluation, and implementation of new
technologies; multiple changes to service delivery process including scheduling
rules, capacity, layout, analysis of bottlenecks, performance measurement. The
current work is an example of process engineering - manufacturing in which the
bottlenecks are indentified and eliminated by using the best alternatives. The
simulation cycle is repeated until a desired production rate is achieved.
In addition, simulation models which have successfully implemented in
manufacturing and service industries was also published in a lot of articles. In
fact, this shows the ability of modeling and simulation in diagnosis, identify
problems and take preventive measures to generate ideas to improve the system
and productivity. The modeling of interaction among the component of the system
is inherent in simulation modeling because simulation intimates the behavior of
real system (as closely as necessary).
Furthermore, the prediction of the future behavior of system is also
achieved by monitoring the behavior of various modeling scenarios. Real world
system is often too complex to experiment with directly therefore simulation
model allow the modeling of this complexity and enable low cost experimentation
to make inference about how actual system might behave.
2.3 DIFFERENCE BETWEEN MODELS AND SIMULATION
- 14 -
To ensure we are using the right technique in our study, we have to clearly
differentiate the difference between model and simulation. There are some
difference between simulation and modeling; model is a substance that used to
indicate the clear purpose of other entity. Under normal circumstances, the model
just display a simplified abstract which only embrace the scope and level needed
to meet the required details of the specific learning goals. A model is similar to
but simpler than what is done by a system, it represent construction and working
of some system of interest.
People use model to predict the effect of changes to the system. Besides
that, the results obtain should have a close approximation to the real system and
incorporate most of its salient features. The model is usually being use when the
actual system is impractical or prohibited. This might be because of the researcher
feel expensive, slow, destructive, unsafe, or even illegal when having research on
the actual investigation. Besides that, model only can be applied in the concept
form of the system model that is used for educational purpose.
Simulation is a technology research and analysis of the behavior of a real
world or an imaginary system by mimicking the application on computer. It is a
mathematical model that describes the system works. Sometimes, simulation is
also used to train people for some specific activities and react to unexpected
situations. The simulation involves create a model to imitate behavior;
experimental model to generate the observation of the behavior, trying to
understand, summarize, and promote these behaviors. In many cases, simulation
test and compare different design and validation, interpretation, supports
simulation results and recommendations of the study. The simulation can help
designers to optimize their system to make the necessary changes, and achieved
good results. They can try different designs to change the attributes in a virtual
environment, it saves time and money. The user can run to simulate slow or fast in
the real world and may help to find out more suitable result.