simulation of an optimized vapour compression ... · simulation of an optimized vapour compression...
TRANSCRIPT

Journal of Advanced & Applied Sciences Volume 03, Issue 06, Pages 216-230, 2015
ISSN: 2289-6260
Simulation of an Optimized Vapour Compression Refrigeration System
T. S. Mogaji*
* Department of Mechanical Engineering, Federal University Of Technology Akure, School of Engineering and Engineering
Technology, P M B 704, Ondo State, Nigeria.
* Corresponding author. Tel.: +2348143181937;
E-mail address: [email protected]
A b s t r a c t
Keywords:
Simulation data,
Vapor compression
Refrigeration system,
Sub-cooling, condenser, Coefficient of performance,
Performance improvement.
This paper presents reports on simulation of an optimized vapor compression refrigeration system using a dedicated mechanical sub-cooling cycle in the system. The study aims at
validating a developed double stage vapour compression refrigeration system using numerical
investigation approach. A mathematical model was devised by applying the concept of energy balance in the thermodynamic cycle to the components of the vapour compression refrigeration
system. The developed model implemented in MATLAB software was used to perform the
numerical analysis using Hydrocarbons, R134a as working fluid. Simulation data was
generated to observe the performance of the double stage vapor compression refrigeration system for an important parameters such as condensation (35 to 55°C) and evaporation
temperatures (-5 to 15°C). Performance evaluation of the system was characterized in terms of
cooling capacity and coefficient of performance (COP). The model results compared with the
experimental result from literature revealing good agreement with the later. For the vapour compression refrigeration system being validated, simulated data showed that the performance
of the VCR system with subcooling cycle improves from 3.3% to 11.4% and 3.1% to 12.2%, as
the evaporation and condensation temperature increases and decreases respectively. Statistical
analysis of the comparison results revealed that 80% of the experimental data obtained were successfully predicted within an error band of ±10% and the absolute mean error of 25.2%.
This shows that the model predicts the system performance to a reasonable accuracy.
Accepted:30 December 2015 © Academic Research Online Publisher. All rights reserved.
I. Introduction
Performance of a vapor compression refrigeration
system can be improved in a number of ways, other
than by testing the system in a controlled
environment experimentally; one of those ways is
simulation of the system component analysis to
achieve rapid and accurate result. Simulation has
been widely used for performance prediction and
optimum design of refrigeration systems [1].
Simulation techniques have also been used by
researchers for design of vapor compression
refrigeration system under steady state conditions [2].
[3], gathered empirical information directly by testing
the vapor compression refrigeration system in a
controlled humidity and temperature chamber

T. S. Mogaji / Journal of Advanced & Applied Sciences (JAAS), 3 (6): 216-230, 2015
217 | P a g e
, and in other to achieve this, the system was properly
instrumented. In the system simulation they
employed the conservation laws to establish the
governing equations that describe the system
behavior, with each component modeled using a
lumped approach, based on physical principles and
employing empirical parameters such as friction
factor and heat transfer coefficient. They concluded
that the model showed good agreement with
experimental data. Also the results from the study of
[4] which is on validation of vapour compression
refrigeration system design model showed that the
model results were comparable to the actual system
data from both quantitative and qualitative points of
view under the same operational conditions. Typical
vapour compression refrigeration cycle uses capillary
tube, thermostatic expansion valve and other
throttling devices to reduce refrigerant pressure from
condenser to evaporator. Theoretically, the pressure
drop is considered as an isenthalpic process (constant
enthalpy). However, isenthalpic process causes a
decrease in the evaporator cooling capacity due to
energy loss in the throttling process. To recover this
energy subcooled liquid prior to expansion process
can be used by adding extra components such as
internal heat exchangers in single-stage cycles and in
two-stage cycles of the VCRS as pointed out in the
study [5] Moreso, [6], reported in their study that
liquid cooling below saturation in the conventional
vapour compression cycles reduces the throttling
losses and potentially increases COP of the system.
In the study of [7], development of sub-cool system
was carried out. The authors in their study presented
a concept of a sub-cool system in which the liquid
receiver is installed before the last pass to a parallel
flow micro channel condenser rather than at the exit
of the condenser. They observed COP improvement
benefitted from subcooling due to an increase in
enthalpy difference across evaporator. [8]
investigated the performance of a VCRS with R134a,
R152a and R12 employed as working fluid and
observed that the R134a refrigerant made the VCRS
to be highly efficient when compared to other
refrigerants, provided there is proper addition of
subcooling. The results from the study of [9] which
is on experimental analysis of vapor compression
refrigeration system with diffuser at condenser inlet
revealed approximately 4% and 16% increase in the
rate of heat rejection and COP respectively.
Additionally, nearly 14% reduction in compressor
work of the system was also observed by the authors.
[10], worked on the effect of condenser liquid
subcooling on system performance for refrigerants
CFC-12, HFC-134a and HFC-152a. Their result
revealed that the refrigeration cooling capacity of
refrigerants; R134a (12.5%), R12 (10.5%) and R152a
(10%), benefited from subcooling increase from 6°C
to 18°C, while condensing temperature was kept
artificially constant. [11] investigated the effects of
condensation and evaporation temperatures, motive,
suction and diffuser efficiencies as well as subcooling
on the performance of the vapour compression
refrigeration system. The result from his study
revealed that condensation temperature has the
highest effect on the performance improvement ratio
of the system such that, the performance
improvement ratio of the system is found to be
doubled as the condensation temperature increases
from 30 to 50°C.
The objectives of the present paper are to obtain
support data for the use of dedicated mechanical sub
cooling cycle in VCR system in improving
performance of the system using numerical
investigation approach. Simulation and comparative

T. S. Mogaji / Journal of Advanced & Applied Sciences (JAAS), 3 (6): 216-230, 2015
218 | P a g e
analysis between the model results and experimental
results obtained by [12] over a wide range of
operating conditions was carried out. The effects of
condensation and evaporation temperatures on
refrigerating effect and coefficient of performance
(COP) of the system were also reported.
2. Vapour compression refrigeration system with
subcooling cycle description
Fig. 1a shows schematic diagram of a vapour
compression refrigeration system with subcooling
cycle and the corresponding P-h diagram of the
system is presented in Fig. 1b, where the basic
vapour compression refrigeration system and the
dedicated mechanical subcooled cycle system are
represented by processes 1-2-3-4-5 and processes 6-
7-8-9 respectively. The arabic numbers in Fig. 1a and
b from 1 to 9 show the different state of the vapour
compression refrigeration system with subcooling
cycle and the number sequence indicates the flow
direction of refrigerant in the system. The refrigerant
enters the compressor at state 1, as saturated vapor
and also with respect to the evaporation temperature.
It follows the irreversible compression process 1-2.
At state 2 the refrigerant is with extremely high
pressure and superheated. The compressed refrigerant
vapor runs from state 2 to state 3 where condensation
process occurred. The process 3-4 represents the
subcooling of the liquid refrigerant at the condenser
outlet before passing through the expansion valve,
hence arriving in state 3 as saturated liquid, the liquid
refrigerant undergo further subcooling process at
process 3-4. In this study, subcooling process is
carried out using a dedicated mechanical subcooling
cycle (6-7-8-9). With the dedicated subcooling
modification, liquid refrigerant leaving the condenser
is further cooled at constant pressure to an
intermediate temperature, T4, as shown in Fig. 1a.
The process 4-5 represents the expansion of the
subcooled liquid refrigerant by throttling from the
condenser pressure to the evaporator pressure.
Finally, the vaporized refrigerant is circulated
through the compressor (1-2) and then condensate in
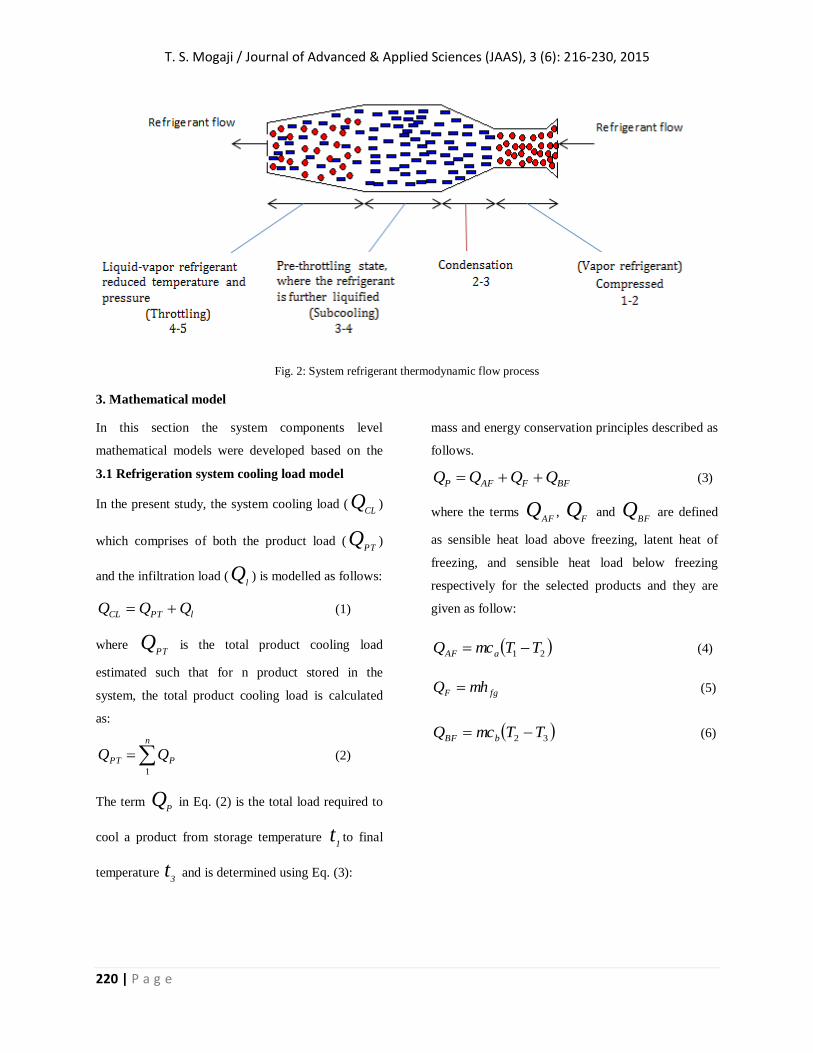
the condenser (2-3). Shown in Fig. 2. is the system
refrigerant thermodynamic flow process. In this way,
less work is used to operate the compressor of the the
vapour compression refrigeration system with
dedicated mechanical subcooling cycle and,
consequently, enhance the performance of the
system.

T. S. Mogaji / Journal of Advanced & Applied Sciences (JAAS), 3 (6): 216-230, 2015
219 | P a g e
Fig. 1a: schematic diagram of the vapor compression refrigeration system with subcooling
cycle
Fig. 1b: pressure-enthalpy diagram of the model
T. S. Mogaji / Journal of Advanced & Applied Sciences (JAAS), 3 (6): 216-230, 2015
220 | P a g e
Fig. 2: System refrigerant thermodynamic flow process
3. Mathematical model
In this section the system components level
mathematical models were developed based on the
mass and energy conservation principles described as
follows.
3.1 Refrigeration system cooling load model
In the present study, the system cooling load (CL
Q )
which comprises of both the product load (PT
Q )
and the infiltration load (l
Q ) is modelled as follows:
lPTCL QQQ
(1)
where PT
Q is the total product cooling load
estimated such that for n product stored in the
system, the total product cooling load is calculated
as:
n
PPT QQ1
(2)
The term P
Q in Eq. (2) is the total load required to
cool a product from storage temperature 1
t to final
temperature 3
t and is determined using Eq. (3):
BFFAFP QQQQ (3)
where the terms AF
Q , F
Q and BF
Q are defined
as sensible heat load above freezing, latent heat of
freezing, and sensible heat load below freezing
respectively for the selected products and they are
given as follow:
21 TTmcQ aAF (4)
fgF mhQ (5)
32 TTmcQ bBF (6)
T. S. Mogaji / Journal of Advanced & Applied Sciences (JAAS), 3 (6): 216-230, 2015
221 | P a g e
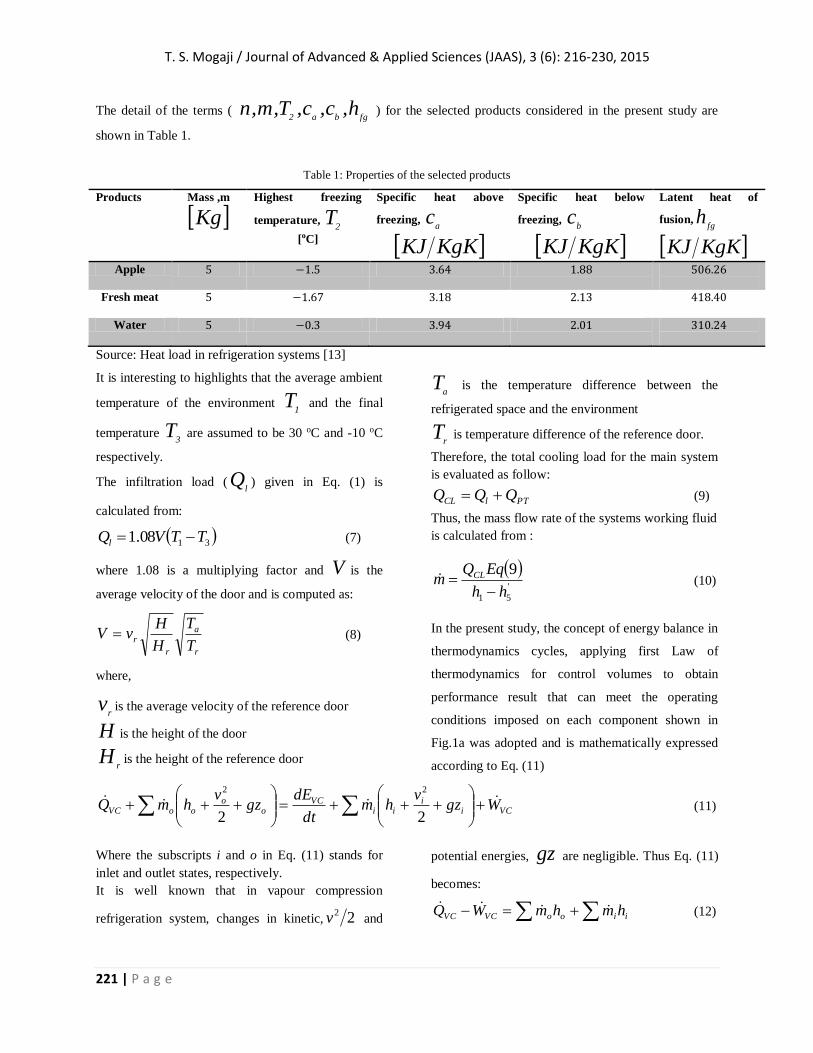
The detail of the terms ( fgba2
h,c,c,T,m,n ) for the selected products considered in the present study are
shown in Table 1.
Table 1: Properties of the selected products
Products Mass ,m
Kg
Highest freezing
temperature, 2
T
[oC]
Specific heat above
freezing, a
c
KgKKJ
Specific heat below
freezing, b
c
KgKKJ
Latent heat of
fusion,fg
h
KgKKJ
Apple 5 −1.5 3.64 1.88 506.26
Fresh meat 5 −1.67 3.18 2.13 418.40
Water 5 −0.3 3.94 2.01 310.24
Source: Heat load in refrigeration systems [13]
It is interesting to highlights that the average ambient
temperature of the environment 1
T and the final
temperature 3
T are assumed to be 30 oC and -10 oC
respectively.
The infiltration load (l
Q ) given in Eq. (1) is
calculated from:
3108.1 TTVQl
(7)
where 1.08 is a multiplying factor and V is the
average velocity of the door and is computed as:
r
a
r
rT
T
H
HvV (8)
where,
rv is the average velocity of the reference door
H is the height of the door
rH is the height of the reference door
aT is the temperature difference between the
refrigerated space and the environment
rT is temperature difference of the reference door.
Therefore, the total cooling load for the main system
is evaluated as follow:
PTlCL QQQ (9)
Thus, the mass flow rate of the systems working fluid
is calculated from :
'
51
9
hh
EqQm CL
(10)
In the present study, the concept of energy balance in
thermodynamics cycles, applying first Law of
thermodynamics for control volumes to obtain
performance result that can meet the operating
conditions imposed on each component shown in
Fig.1a was adopted and is mathematically expressed
according to Eq. (11)
VCii
iiVC
oo
ooVC Wgzv
hmdt
dEgz
vhmQ
22
22
(11)
Where the subscripts i and o in Eq. (11) stands for
inlet and outlet states, respectively.
It is well known that in vapour compression
refrigeration system, changes in kinetic, 22v and
potential energies, gz are negligible. Thus Eq. (11)
becomes:
iiooVCVC hmhmWQ (12)
T. S. Mogaji / Journal of Advanced & Applied Sciences (JAAS), 3 (6): 216-230, 2015
222 | P a g e
Referring to the P-h diagram shown in Fig. 1b and
application of Eq. (12) to each component of the
system, the mathematical equations used to obtain the
energy balance in each component are presented in
the next subsections.
3.2. Heat exchangers model: evaporator,
condenser and subcooler
The heat rejected by the main VCR and sub-cooling
VCR system condenser are calculated as follows:
32 hhmQCmain (13)
98 hhmQCsub (14)
The refrigeration capacity of the main and sub-
cooling VCR systems are accounted as follows:
'51 hhmQEmain (15)
67 hhmQEsub (16)
3.3. Compressor model
The work done by the main and the sub-cooling VCR
systems compressor is calculated as follows:
12 hhWCmain (17)
78 hhWCsub (18)
where, the subscript 2 and 8 refers to the enthalpy at
the exit of the main and the sub-cooling VCR system
compressor. Thus, the compressor power required by
the main and the sub-cooling VCR system is
estimated using Eqns. 19 and 20 given below
respectively as:
cmainCmain WmP (19)
csubCsub WmP
(20)
3.4. Capillary tube model
For the expansion process, the overall energy balance
in the capillary tube for both main and sub-cooling
systems is accounted for using Eqns. 21 and 22
respectively:
69 hmhm (21)
54 hmhm (22)
The Mathematical models described above was
implemented in MATLAB software to predict the
response of principles components for both main and
sub-cooling systems i.e compressor, condenser,
expansion valve (capillary tube) and evaporator. The
simulation model of the vapour compression
refrigeration system with subcooling cycle shown in
Fig.1a was devised assuming the following
conditions (i) the refrigeration system operates at
steady state regime, (ii) irreversibilities within the
evaporator, condenser and compressor are ignored,
(iii) no frictional pressure drops, (iv) refrigerant
flows at constant pressure through the two heat
exchangers (evaporator and condenser) , heat loss to
the surrounding are ignored and compression process
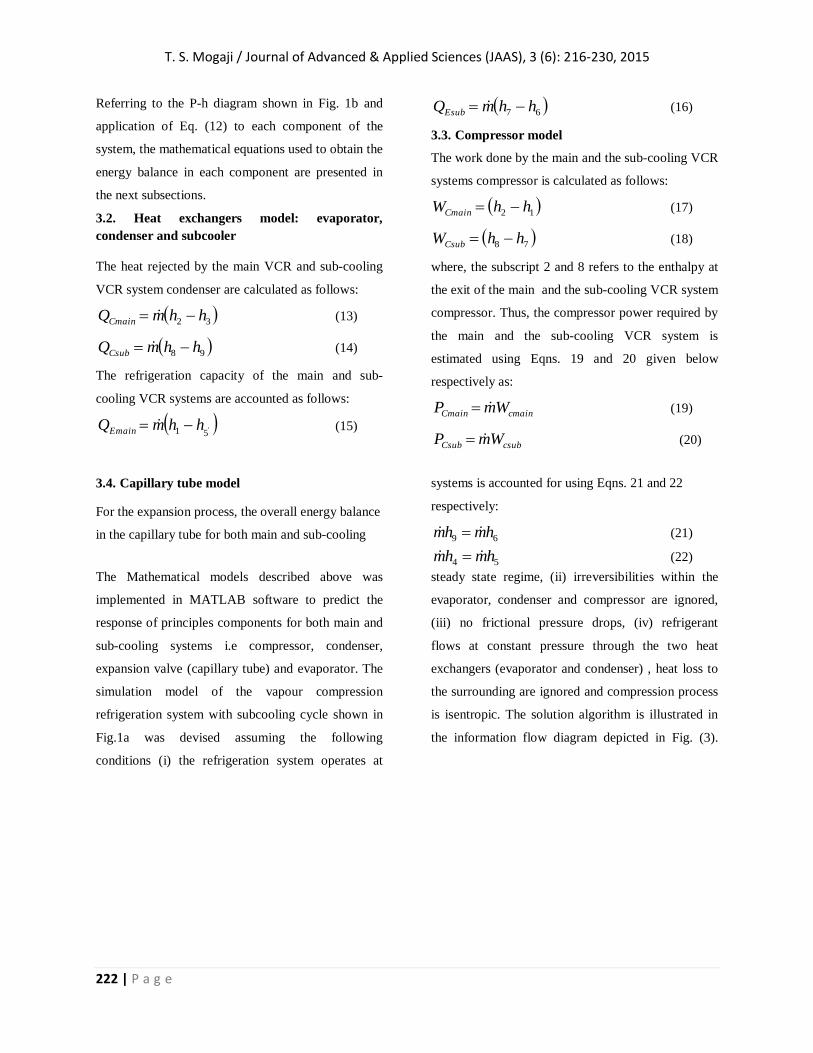
is isentropic. The solution algorithm is illustrated in
the information flow diagram depicted in Fig. (3).
T. S. Mogaji / Journal of Advanced & Applied Sciences (JAAS), 3 (6): 216-230, 2015
223 | P a g e
Compute product, Infiltration, Cooling load
Select Refrigerant
R134a
Input Condenser Temperature and
Evaporator Temperature (Te, Tc)
Input Product Properties and Air
infiltration parameter
Print Product, Infiltration &
Cooling load.
Is Te & Tc available in the Cool pack
Software saturation table[13]?
Set Values of enthalpy, entropy, Specific volume & Pressure
from the Cool pack Software Saturation table [13].
Compute Refrigeration effect, COPmain
Print Refrigeration effect,
COPmain
Input Subcooling System
Temperature (Tes, Tcs)
and Subcooling degree
Is Tes & Tcs available in the Cool pack
Software saturation table[13]?
Set Values of enthalpy, entropy, Specific
volume & Pressure from the Cool pack
Software Saturation table [13].
Compute Refrigeration effect, COPsub
Print Refrigeration
effect, COPsub
STOP
No
Yes
Yes
No
START
Fig. 3: Flow chart of the simulation program
T. S. Mogaji / Journal of Advanced & Applied Sciences (JAAS), 3 (6): 216-230, 2015
224 | P a g e
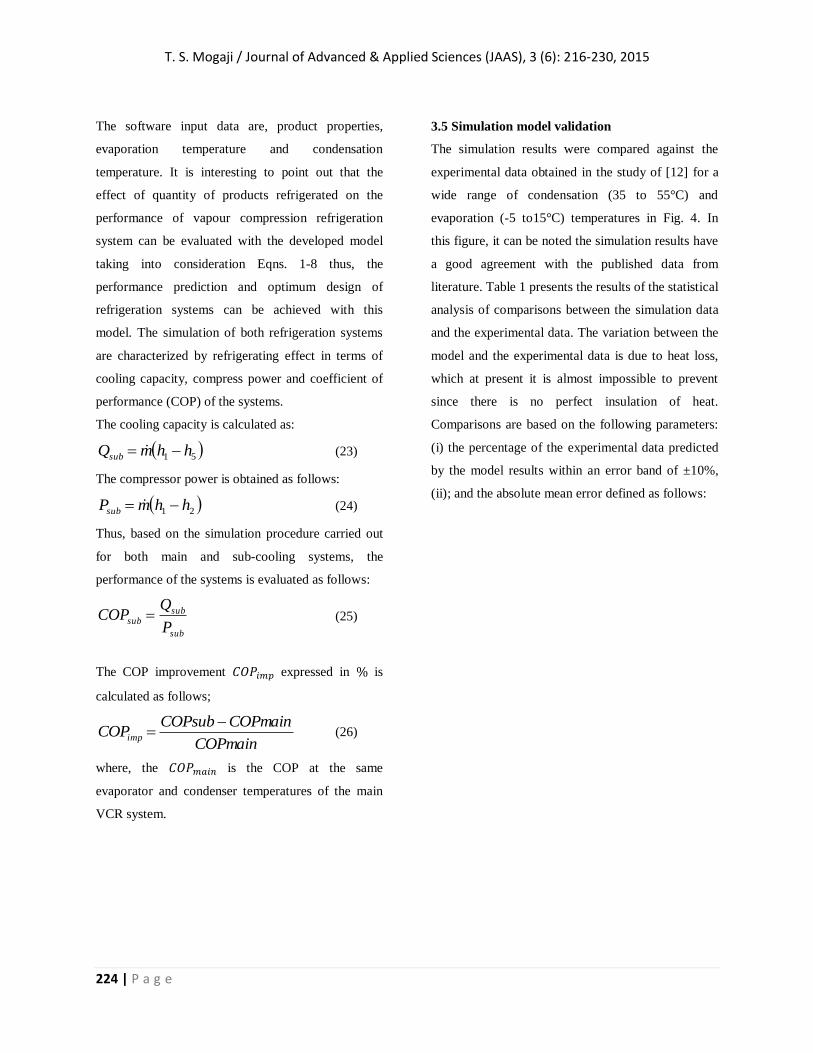
The software input data are, product properties,
evaporation temperature and condensation
temperature. It is interesting to point out that the
effect of quantity of products refrigerated on the
performance of vapour compression refrigeration
system can be evaluated with the developed model
taking into consideration Eqns. 1-8 thus, the
performance prediction and optimum design of
refrigeration systems can be achieved with this
model. The simulation of both refrigeration systems
are characterized by refrigerating effect in terms of
cooling capacity, compress power and coefficient of
performance (COP) of the systems.
The cooling capacity is calculated as:
51 hhmQsub (23)
The compressor power is obtained as follows:
21 hhmPsub (24)
Thus, based on the simulation procedure carried out
for both main and sub-cooling systems, the
performance of the systems is evaluated as follows:
sub
subsub
P
QCOP (25)
The COP improvement 𝐶𝑂𝑃𝑖𝑚𝑝 expressed in % is
calculated as follows;
COPmain
COPmainCOPsubCOPimp
(26)
where, the 𝐶𝑂𝑃𝑚𝑎𝑖𝑛 is the COP at the same
evaporator and condenser temperatures of the main
VCR system.
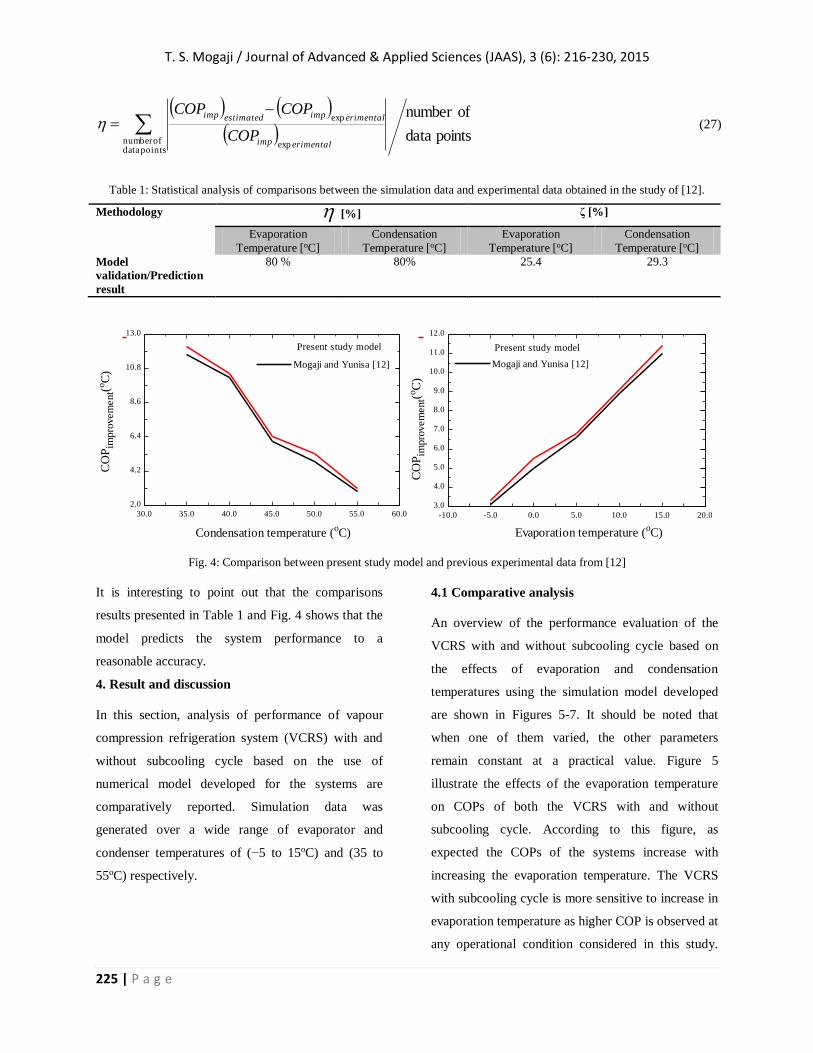
3.5 Simulation model validation
The simulation results were compared against the
experimental data obtained in the study of [12] for a
wide range of condensation (35 to 55°C) and
evaporation (-5 to15°C) temperatures in Fig. 4. In
this figure, it can be noted the simulation results have
a good agreement with the published data from
literature. Table 1 presents the results of the statistical
analysis of comparisons between the simulation data
and the experimental data. The variation between the
model and the experimental data is due to heat loss,
which at present it is almost impossible to prevent
since there is no perfect insulation of heat.
Comparisons are based on the following parameters:
(i) the percentage of the experimental data predicted
by the model results within an error band of ±10%,
(ii); and the absolute mean error defined as follows:
T. S. Mogaji / Journal of Advanced & Applied Sciences (JAAS), 3 (6): 216-230, 2015
225 | P a g e
points data
ofnumber
points data ofnumber exp
exp
erimentalimp
erimentalimpestimatedimp
COP
COPCOP (27)
Table 1: Statistical analysis of comparisons between the simulation data and experimental data obtained in the study of [12].
Methodology [%] ζ [%]
Evaporation
Temperature [oC]
Condensation
Temperature [oC]
Evaporation
Temperature [oC]
Condensation
Temperature [oC]
Model
validation/Prediction
result
80 % 80% 25.4 29.3
Fig. 4: Comparison between present study model and previous experimental data from [12]
It is interesting to point out that the comparisons
results presented in Table 1 and Fig. 4 shows that the
model predicts the system performance to a
reasonable accuracy.
4. Result and discussion
In this section, analysis of performance of vapour
compression refrigeration system (VCRS) with and
without subcooling cycle based on the use of
numerical model developed for the systems are
comparatively reported. Simulation data was
generated over a wide range of evaporator and
condenser temperatures of (−5 to 15oC) and (35 to
55oC) respectively.
4.1 Comparative analysis
An overview of the performance evaluation of the
VCRS with and without subcooling cycle based on
the effects of evaporation and condensation
temperatures using the simulation model developed
are shown in Figures 5-7. It should be noted that
when one of them varied, the other parameters
remain constant at a practical value. Figure 5
illustrate the effects of the evaporation temperature
on COPs of both the VCRS with and without
subcooling cycle. According to this figure, as
expected the COPs of the systems increase with
increasing the evaporation temperature. The VCRS
with subcooling cycle is more sensitive to increase in
evaporation temperature as higher COP is observed at
any operational condition considered in this study.
30.0 35.0 40.0 45.0 50.0 55.0 60.0
2.0
4.2
6.4
8.6
10.8
13.0
Condensation temperature (oC)
CO
Pim
pro
vem
ent(
oC
)
Mogaji and Yunisa [12]
Present study model
-10.0 -5.0 0.0 5.0 10.0 15.0 20.0
3.0
4.0
5.0
6.0
7.0
8.0
9.0
10.0
11.0
12.0
Evaporation temperature (oC)
CO
Pim
pro
vem
ent(
oC
)
Mogaji and Yunisa [12]
Present study model
T. S. Mogaji / Journal of Advanced & Applied Sciences (JAAS), 3 (6): 216-230, 2015
226 | P a g e
Such behavior is related to the fact that less work is
used to operate the compressor of the VCRS with
subcooling cycle compared to its counterpart without
subcooling cycle. This trend is similar to those
observed in the studies of [11] and [14]. Moreover, as
can be noticed in Figure 4, the COP improvement
ratio of the modified system is observed to increase
from 3.3 to 11.4%,as the evaporation temperature
increases from -5 to15℃ , these simulated values
validate those obtained experimentally in our
previous study predicting 80% of the data within an
error band of ±10 and the absolute mean error of
25.2% which proves the high energy efficiency of the
VCRS with subcooling cycle.
Fig 6 shows that the COPs for both VCRS with and
without subcooling cycle decrease as the
condensation temperature increases. It can also be
notice that the COP of the modified system at lower
condensation temperature of 35oC is more sensitive
higher than the COP of the VCRS without subcooling
cycle. Additionally, as condensation temperature
decreases from 55 to 35°C, the improvement ratio in
COP increases from 3.1% to 12.2% these simulated
values as displayed in Figure 4 predicted 80% of the
experimental data obtained in our previous study
within an error band of ±10% and the absolute mean
error of 25.2% .These trends are similar to those
observed in the study of [11] and [15]. This rate of
improvement can be attributed to the fact that during
a process through the VCRS with dedicated
subcooling cycle, temperature of refrigerant
increases. Due to this difference between temperature
of refrigerant flows through condenser tubes and that
of outside air flowing over condenser tubes increases
resulting into increase in the rate of heat transfer from
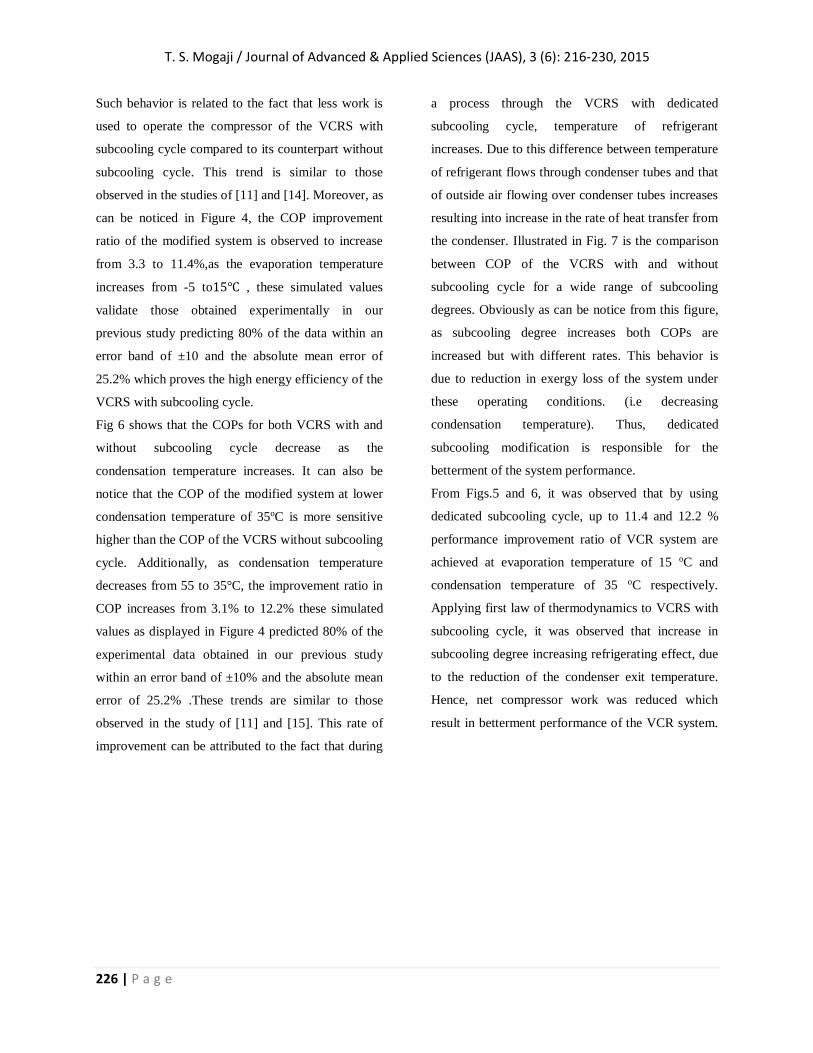
the condenser. Illustrated in Fig. 7 is the comparison
between COP of the VCRS with and without
subcooling cycle for a wide range of subcooling
degrees. Obviously as can be notice from this figure,
as subcooling degree increases both COPs are
increased but with different rates. This behavior is
due to reduction in exergy loss of the system under
these operating conditions. (i.e decreasing
condensation temperature). Thus, dedicated
subcooling modification is responsible for the
betterment of the system performance.
From Figs.5 and 6, it was observed that by using
dedicated subcooling cycle, up to 11.4 and 12.2 %
performance improvement ratio of VCR system are
achieved at evaporation temperature of 15 oC and
condensation temperature of 35 oC respectively.
Applying first law of thermodynamics to VCRS with
subcooling cycle, it was observed that increase in
subcooling degree increasing refrigerating effect, due
to the reduction of the condenser exit temperature.
Hence, net compressor work was reduced which
result in betterment performance of the VCR system.

T. S. Mogaji / Journal of Advanced & Applied Sciences (JAAS), 3 (6): 216-230, 2015
227 | P a g e
Fig. 5: Variation of coefficient of performance with evaporation temperature
Fig. 6: Variation of coefficient of performance with condensation temperature
-10 -5 0 5 10 15 20
4
5
6
7
8
9
10
Evaporation temperature (oC)
Co
effi
cien
t o
f p
erfo
rman
ce
COPmain
COPsub
30 35 40 45 50 55 60
2
3
4
5
6
Condensation temperature (oC)
Co
effi
cien
t o
f p
erfo
rman
ce
COPmain
COPsub
T. S. Mogaji / Journal of Advanced & Applied Sciences (JAAS), 3 (6): 216-230, 2015
228 | P a g e
Fig.7: Variation of performance improvement with sub-cooling temperature
5. Conclusion
In this study, a simulation model is developed for
VCRS with sub-cooling cycle where a main system is
mechanically sub-cooled with another complete cycle
system using R-134a as the working fluid. Numerical
analysis on the performance of the system
considering the effect of evaporation temperature,
condensation temperature and subcooling degree
using the simulation model has been identified. The
performance evaluation of the system was
characterized by refrigerating effect in terms of
cooling capacity, compressor power and coefficient
of performance (COP). Subsequently, the obtained
simulation data were comparatively analyzed with
experimental result from the study according to [12].
The model results compared with the experimental
results revealed good agreement with the later. From
the present study, the following main conclusions can
be drawn:
i. The COP of VCR system with dedicated
mechanical sub-cooling cycle is higher
compares with the main VCR system
counterpart.
ii. By using dedicated mechanical subcooling
cycle, up to 11.4 and 12.2 % performance
improvement ratio of vapour compression
system are observed at evaporation
temperature of 15 oC and condenser
temperature of 35 oC respectively
iii. As the subcooling degree temperature
increases the COP of the VCR system
increases. Similarly, Refrigerating effect of
the system increases.
iv. Evaporation temperature has the highest
effect on the system performance
improvement ratio. As the evaporation
temperature increases from -5 to 15 oC, the
performance improvement ratio of the
system increases geometrically.
v. According to experimental and simulation
data the preceding comparative analysis on
performance evaluation of both basic VCR
system with and without subcooling cycle. It
2 4 6 8 10 12 14 16
0
3
6
9
12
15
Subcooling temperature (oC)
CO
Pim
pro
vem
ent(
oC
)
COPsub
COPmain

T. S. Mogaji / Journal of Advanced & Applied Sciences (JAAS), 3 (6): 216-230, 2015
229 | P a g e
can be concluded that the use of dedicated
mechanical sub cooling cycle in VCR
system is most efficient and suitable for any
cooling system application (air conditioning
refrigeration and freezing).
Acknowledgement
The authors would like to acknowledge the
assistance of the Refrigeration and Air
Conditioning Unit of the Department of
Mechanical Engineering, Federal University of
Technology Akure in supplying the equipment
used in the present study. The technical support
given to this investigation by Mr K. R. Yunisa
and Mr. K. A. Adewole are also appreciated and
deeplyrecognized.
References
[1] Guo-liang Ding. Recent developments in
simulation techniques for vapour-compression
refrige ration systems. International Journal of
Refrigeration 2007; 30:1119-1133
[2] Sanaye S, Malekmohammadi H.R. Thermal
and economical optimization of air conditioning
units with vapour compression refrigeration
system. Journal of Applied Thermal Engineering
2004; 24(13): 1807-1825
[3] Joaquim, M. G., Claudio, M. Christian J.L.
A semi-empirical model for steady-state
simulation of household refrigerators. Applied
Thermal Engineering 2009; 29(8-9): 1622-1630
[4] Akintunde, M. A. Validation of vapour
compression refrigeration system design model.
American Journal of Scientific and Industrial
Research 2011;2(4): 504-510.
[5] Domanski, P.A., Didion, D.A. Evaluation of
suction-line/liquid-line heat exchange in the
refrigeration cycle. International Journal of
Refrigeration 1994; 17: 487-493.
[6] Hrnjak, P S. Gustavo P. Effect of Condenser
Subcooling of the performance of vapor
compression systems: experimental and
numerical investigation. international
refrigeration and air conditioning conference at
purdue, July 16-19, 2012
[7] Yamanaka Y, Matsuo H, Tuzuki K, Tsuboko
T. Development of sub-cool system. SAE
Technical Paper Series 1997; paper 970110.
[8] Kamei, A; Piao, C.C; Sato, H, Watanabe, K.
Thermodynamic Charts and Cycle
Performance of FC-134a and FC-152a
ASHRAE Transaction. 1990; 96(1): 144-149.
[9] Saudagar, R.T., Wankhede, U.S.
Experimental Analysis of Vapour Compression
Refrigeration System with Diffuser at Condenser
Inlet. International Journal of Engineering and
Advanced Technology 2013; 2(4): 182-186
[10] Linton, J.W., Snelson, W.K., Hearty, P. F.
Effect of condenser liquid subcooling on system
performance for refrigerants CFC-12, HFC-134a
and HFC-152a. ASHRAE Transactions 1992; 98:
160-146.
[11] Elgendy E. Parametric Study of a Vapor
Compression Refrigeration Cycle Using a Two-
Phase Constant Area Ejector. International
Journal of Mechanical, Aerospace, Industrial
and Mechatronics Engineering 2103;7(8): 571-
577
[12] Mogaji T.S. and Yinusa R. K. Performance
evaluation of vapour compression refrigeration
system using double effect condensing unit (Sub-
cooler). International Journal of Engineering
and Technology Sciences. 2015; 3(1):55-64.

T. S. Mogaji / Journal of Advanced & Applied Sciences (JAAS), 3 (6): 216-230, 2015
230 | P a g e
[13] Ebook manual file on Heat load in
Refrigeration System's by Roger D. Holder, CM,
MSME. 32-37.
[14] Mohan, C. Exergy analysis of vapour
compression refrigeration system using R12 and
R134a as refrigerants. International Journal of
Students Research in Technology &
Management 2014; 2(04): 134-139.
[15] Mishra, R. S. Methods of improving
thermodynamic performance of vapour
compression system using twelve eco-friendly
refrigerants in primary circuit and nanofluid
(water-nano particles based) in secondary circuit.
International Journal of Emerging Technology
and Advanced Engineering 2014; 4(6): 878-891.