simulation of kerosene-water two-phase flow in vertical and inclined pipes · 2014-05-18 ·...
TRANSCRIPT

Simulation of kerosene-water two-phase flow in vertical and inclined pipes
D. Albarzenji, H. Kartash & F. Hamad School of Science and Engineering, Teesside University, UK
Abstract
In this paper, the flow of liquid-liquid two-phase flow in vertical and inclined pipes has been investigated numerically. The simulations of kerosene-water flow in a pipe of 77.8 mm inner diameter and 4500 mm length have been carried out using two-fluid model. The ANSYS Fluent 14.0 was used to solve the mass and momentum equations incorporating the interface forces and the standard k-ε model with the standard wall function to describe the turbulence in the flow. The simulation was carried out for superficial water velocities of 0.29, 0.6, 0.9 and 1.2 m/s and three volumetric qualities of 9.2%, 18.6% and 40% at three different inclination angles of 0°, 5° and 30°. The predictions included volume fraction, water velocity and drops velocity. The results from Fluent for vertical pipe were compared with the experimental data from literature to check the accuracy of meshing, physical model and boundary conditions used in predictions. The model predictions showed a good agreement with experimental data obtained for the vertical pipe. Accordingly, the same geometry, meshing, physical model and boundary conditions were used for inclined pipes. Keywords: kerosene-water flow, vertical and inclined pipe, CFD simulation.
1 Introduction
Multiphase flow study is of great importance for the design of steam generators, internal combustion engines, heat exchangers, pipelines for transport of gas and oil mixtures and chemical industries. The flow characteristics depend on the combination of the phases, which form the mixture (gas-liquid, gas-solid, liquid-liquid or gas-liquid-solid) due to the differences in their properties such as density, viscosity and the surface tension. For gas-liquid and liquid-liquid flows, the flow regimes can be classified as bubbly flow, slug flow, churn flow and
Petroleum and Mineral Resources 243
www.witpress.com, ISSN 1743-3533 (on-line) WIT Transactions on Engineering Sciences, Vol 81, © 201 WIT Press2
doi:10.2495/PMR120221
annular flow depending on the percentage of each phase, the velocity of each phase and the flow orientation (vertical, horizontal or inclined). While most of the two-phase flow publications in the literature are based on the experimental investigations, the recent development in CFD modelling allows researchers to predict the flow behaviour in pipes. A summary of some of the publications of flow in pipes are given below. Agranat and Kawaji [1] performed a numerical simulation in a vertical of 500 mm inner diameter using PHOENICS to predict flow characteristics of two-phase bubbly flow. The comparison between the predicted results and experimental data from literature showed a good agreement. Mouza et al. [2] employed CFX to predict the gas-liquid two-phase flow characteristics in a horizontal pipe. The k-ε model was used to calculate the turbulence in the fluid. They found that the predicted results are in good agreement with those obtained experimentally. Matos et al. [3] investigated air-water flow in a vertical square channel of 34.1 mm side experimentally. The Eulerian model in Phoenics was used to simulate experimental cases. The comparison between the experimental and predicted results showed good agreement. Li-yang et al. [4] and Walvekar et al. [5] used Fluent to investigate the oil-water two-phase flow I T-junction and horizontal pipe. Li-yang et al. [4] compared the prediction from Fluent with their experimental data for T-junction, which showed a reasonable agreement for both the oil fraction distribution and the fluids separation efficiency. Walvekar et al. [5] simulated the oil-water flow in a horizontal pipe of 24 mm diameter. The predicted results for phase distribution were in good agreement with experimental measurements at high mixture velocity while discrepancies were observed for low mixture velocities. Hamad et al. [6] studied the development of the kerosene-water flow in a vertical pipe of 78.8 mm downstream a 90˚ bend experimentally. ANSYS Fluent 12.0 was also used to simulate the experimental cases and provide details information on the flow structure at the bend. The predictions from Fluent were found to be in close agreement with experimental data for L/D 16 but there was a significant discrepancy at L/D = 1 and at the bend. The literature review presented above, showed that most of the previous CFD studies were carried out for vertical and horizontal pipes and highlighted the need for more work on flow in inclined pipes. Hence, the purpose of this paper is twofold. The first is to simulate the kerosene-water flow in a vertical pipe and compare the data with experimental results from literature to check meshing, physical models and boundary conditions used for simulation. The second is to use the model to simulate the flow in inclined pipe under same flow condition. The model then was used to extend the prediction for higher volumetric quality and superficial water velocity.
2 CFD Model and simulation
A three-dimensional computational domain including the bend, reducer and test section has been constructed to be used for simulation. The diameter of the bend is 0.15 m and the test section is 0.0778 m with 4.5 m length, giving L/D = 58. A
244 Petroleum and Mineral Resources
www.witpress.com, ISSN 1743-3533 (on-line) WIT Transactions on Engineering Sciences, Vol 81, © 201 WIT Press2

pipe reducer of 0.15-0.0778 m is used to connect the 90o bend to the test section. The boundary conditions at the inlet were assumed to be uniform for the various parameters (velocity and volume fraction), whereas zero gradient boundary conditions were used at the outlet. For the liquid-liquid flow considered in the present study, the Eulerian model that was used by many researchers [3, 5] is considered the most appropriate and has been employed. In addition, the standard k- model incorporating the standard wall function has been used. The convection terms were discretized using the UPWIND for stability, which can prove to be a serious issue when dealing with two-phase flow modelling and the pressure velocity coupling, was done using SIMPLE. Figure 1A shows the computational domain used in this study. The size of the elements was controlled by changing the volume of the element. Figure 1B, illustrates a sample of mesh distribution at the inlet of the bend. The Grid independence test was carried out on four different grid sizes to check the change in the radial velocity distribution of water for single flow as shown in Figure 1C. The results indicate that there is no significant change in velocity distribution with the change in number of elements. Accordingly, the number of elements selected was 785994 to be used in this work, which gave good results, and saved the computation time.
3 Results and discussion
3.1 Single-phase flow
Referring to Figure 2, the result shows that the discrepancy between the experimental data [7] from literate and prediction is very small.
3.2 Two-phase flow in vertical pipe
The effect of the increasing volumetric quality increases the discrepancy between the measured volume fraction and the FLUENT predictions as shown in Figure 3. The measured and predicted velocities of water and drops presented in Figures 4 and 5 were very close when volumetric quality, β = 9.2%. However, it was observed that the discrepancy increased when β = 18.6% and the predicted velocities of water and drops were higher than the experimental measurements.
3.2.1 The effect of pipe inclination on volume fraction, water velocity and drop velocity distributions (β =9.2%)
The pipe inclination has direct influence on the structure of two-phase flow which is reflected in the distribution of flow parameters (volume fraction, water velocity and drop velocity profile) due to the gravity effect. From Figure 6, it can be observed that asymmetric distribution of volume fraction α(r) appeared for 5˚ and became very pronounced for 30˚ inclination compared to the vertical case where the distributions were symmetrical. This can be attributed to density difference between kerosene drops and water phase and the low level of
Petroleum and Mineral Resources 245
www.witpress.com, ISSN 1743-3533 (on-line) WIT Transactions on Engineering Sciences, Vol 81, © 201 WIT Press2

.
Figure 1: A) Computational domain. B) Mesh distribution at inlet of the bend. C) Radial velocity distribution for different number of mesh element.
Figure 2: The comparison of predicted water velocity with experimental measurements in a vertical pipe.
0
0.1
0.2
0.3
0.4
0.5
0 0.2 0.4 0.6 0.8 1
Wat
er v
eloc
ity
(m/s
)
Radial distance (r/R)
FLUENT Exp
246 Petroleum and Mineral Resources
www.witpress.com, ISSN 1743-3533 (on-line) WIT Transactions on Engineering Sciences, Vol 81, © 201 WIT Press2

Figure 3: The comparison of predicted volume fraction with experimental measurements in a vertical pipe.
Figure 4: The comparison of predicted water velocity with experimental measurements in a vertical pipe.
Figure 5: The comparison of predicted drop velocity with experimental measurements in a vertical pipe.
0
5
10
15
20
25
0 0.2 0.4 0.6 0.8 1
Vol
ume
frac
tion
%
Radial distance (r/R)
FLUENT 9.2% Exp 9.2% Exp 18.6% FLUENT 18.6%
0
0.1
0.2
0.3
0.4
0.5
0 0.2 0.4 0.6 0.8 1
Wat
er v
eloc
ity
(m/s
)
Radial distance (r/R)
FLUENT 18.6% Exp 18.6% FLUENT 9.2% Exp 9.2%
0
0.1
0.2
0.3
0.4
0.5
0.6
0 0.2 0.4 0.6 0.8 1
Dro
p ve
loci
ty (
m/s
)
Radial distance (r/R)
FLUENT 18.6% Exp 18.6% FLUENT 9.2% Exp 9.2%
Petroleum and Mineral Resources 247
www.witpress.com, ISSN 1743-3533 (on-line) WIT Transactions on Engineering Sciences, Vol 81, © 201 WIT Press2
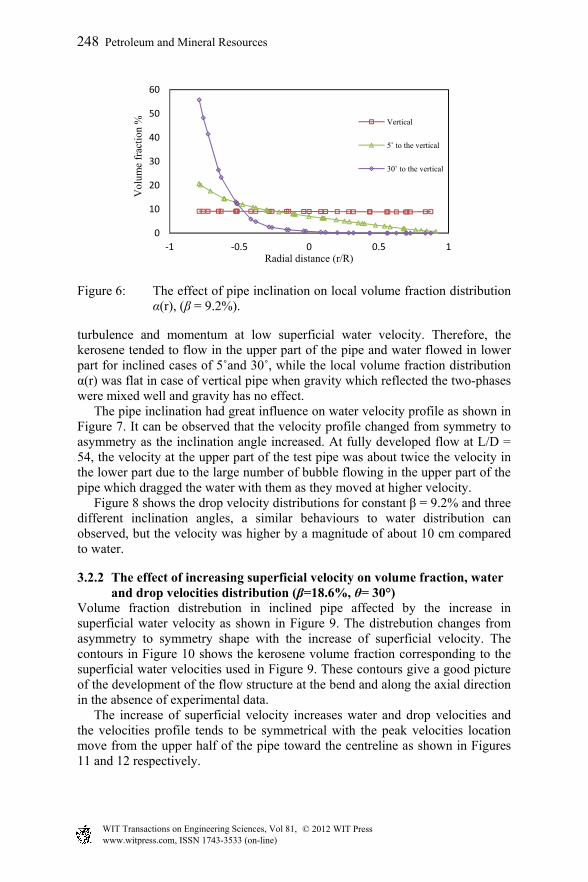
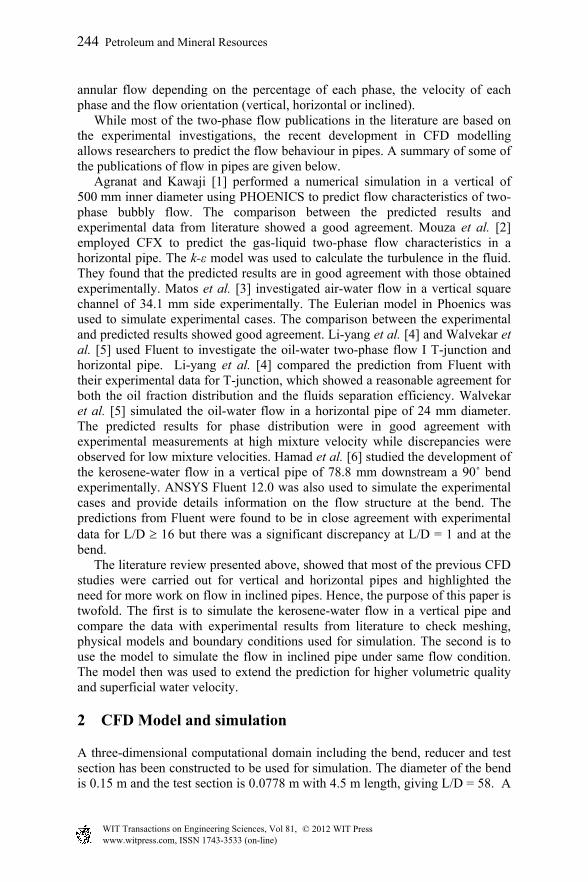
Figure 6: The effect of pipe inclination on local volume fraction distribution α(r), (β = 9.2%).
turbulence and momentum at low superficial water velocity. Therefore, the kerosene tended to flow in the upper part of the pipe and water flowed in lower part for inclined cases of 5˚and 30˚, while the local volume fraction distribution α(r) was flat in case of vertical pipe when gravity which reflected the two-phases were mixed well and gravity has no effect. The pipe inclination had great influence on water velocity profile as shown in Figure 7. It can be observed that the velocity profile changed from symmetry to asymmetry as the inclination angle increased. At fully developed flow at L/D = 54, the velocity at the upper part of the test pipe was about twice the velocity in the lower part due to the large number of bubble flowing in the upper part of the pipe which dragged the water with them as they moved at higher velocity. Figure 8 shows the drop velocity distributions for constant β = 9.2% and three different inclination angles, a similar behaviours to water distribution can observed, but the velocity was higher by a magnitude of about 10 cm compared to water.
3.2.2 The effect of increasing superficial velocity on volume fraction, water and drop velocities distribution (β=18.6%, θ= 30°)
Volume fraction distrebution in inclined pipe affected by the increase in superficial water velocity as shown in Figure 9. The distrebution changes from asymmetry to symmetry shape with the increase of superficial velocity. The contours in Figure 10 shows the kerosene volume fraction corresponding to the superficial water velocities used in Figure 9. These contours give a good picture of the development of the flow structure at the bend and along the axial direction in the absence of experimental data. The increase of superficial velocity increases water and drop velocities and the velocities profile tends to be symmetrical with the peak velocities location move from the upper half of the pipe toward the centreline as shown in Figures 11 and 12 respectively.
0
10
20
30
40
50
60
‐1 ‐0.5 0 0.5 1
Vol
ume
frac
tion
%
Radial distance (r/R)
Vertical
5˚ to the vertical
30˚ to the vertical
248 Petroleum and Mineral Resources
www.witpress.com, ISSN 1743-3533 (on-line) WIT Transactions on Engineering Sciences, Vol 81, © 201 WIT Press2
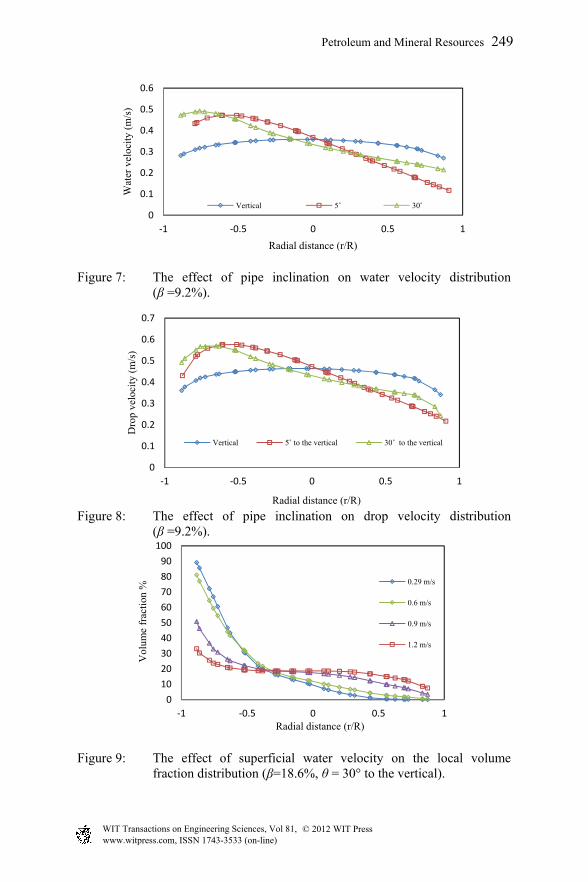
Figure 7: The effect of pipe inclination on water velocity distribution (β =9.2%).
Figure 8: The effect of pipe inclination on drop velocity distribution
(β =9.2%).
Figure 9: The effect of superficial water velocity on the local volume fraction distribution (β=18.6%, θ = 30° to the vertical).
0
0.1
0.2
0.3
0.4
0.5
0.6
‐1 ‐0.5 0 0.5 1
Wat
er v
eloc
ity
(m/s
)
Radial distance (r/R)
Vertical 5˚ 30˚
0
0.1
0.2
0.3
0.4
0.5
0.6
0.7
‐1 ‐0.5 0 0.5 1
Dro
p ve
loci
ty (
m/s
)
Radial distance (r/R)
Vertical 5˚ to the vertical 30˚ to the vertical
0
10
20
30
40
50
60
70
80
90
100
‐1 ‐0.5 0 0.5 1
Vol
ume
frac
tion
%
Radial distance (r/R)
0.29 m/s
0.6 m/s
0.9 m/s
1.2 m/s
Petroleum and Mineral Resources 249
www.witpress.com, ISSN 1743-3533 (on-line) WIT Transactions on Engineering Sciences, Vol 81, © 201 WIT Press2

Figure 10: Volume fraction Contour for different superficial water velocities (β = 18.6%, θ = 30° to the vertical).
Figure 11: The effect of superficial water velocity on the water velocity distribution (β=18.6%, θ = 30° to the vertical).
Figure 12: The effect superficial water velocity on the drop velocity distribution (β=18.6%, θ = 30° to the vertical).
0
0.2
0.4
0.6
0.8
1
1.2
1.4
1.6
1.8
‐1 ‐0.5 0 0.5 1
Wat
er v
eloc
ity
(m/s
)
Radial distance (r/R)
0.29 m/s 0.6 m/s 0.9 m/s 1.2 m/s
0
0.2
0.4
0.6
0.8
1
1.2
1.4
1.6
1.8
‐1 ‐0.5 0 0.5 1
Dro
p ve
loci
ty (
m/s
)
Radial distance (r/R)
0.29 m/s 0.6 m/s 0.9 m/s 1.2 m/s
250 Petroleum and Mineral Resources
www.witpress.com, ISSN 1743-3533 (on-line) WIT Transactions on Engineering Sciences, Vol 81, © 201 WIT Press2

3.2.3 The influence of volumetric quality (β) on volume fraction, water velocity and drop velocity distributions (Usup= 0.29 m/s, θ=30°)
The increase of the volumetric quality increases the mixing layer between kerosene and water which lead to flatter shape of local volume fraction distribution as shown in Figure 13. The change in volume fraction distribution can be attributed to the migration of drops from the upper part of the pipe towards the lower part due to the increase in drops number at higher volumetric qualities. The contours in Figure 14 show the kerosene volume fraction corresponding to the volumetric qualities in Figure 13. These contours give a clear picture on the development of flow structure along the axial direction as the volumetric quality increased. The contours also indicate the existence of three layers of flow in inclined pipes [8, 9]: i) kerosene layer close to the upper wall of the pipe with water drops dispersed in it, ii) a water layer close to the bottom wall of the pipe with kerosene drops dispersed in it and iii) mixed layer between the two layer where the percentages of kerosene and water are nearly equal.
Figure 13: The effect of volumetric quality (β) on volume fraction distribution (θ=30° to the vertical).
Figure 14: Volume fraction Contours for different volumetric qualities (θ = 30° to the vertical).
0
20
40
60
80
100
120
‐1 ‐0.5 0 0.5 1
Vol
ume
frac
tion
%
Radial distance (r/R)
40%
18.60%
9.20%
Petroleum and Mineral Resources 251
www.witpress.com, ISSN 1743-3533 (on-line) WIT Transactions on Engineering Sciences, Vol 81, © 201 WIT Press2
The results in Figure 15 show that the increase of the volumetric quality increases the water velocity significantly expect the region near to the lower wall of the pipe. The corresponding drops velocities distributions are given in Figure 16, which have same shape, but with higher values.
Figure 15: The effect volumetric quality (β) on water velocity distribution (θ=30° to the vertical).
Figure 16: The effect of volumetric quality (β) on drop velocity distribution (θ=30° to the vertical).
4 Conclusions
kerosene-water flow has been studied in vertical and inclined pipes of 77.8 mm inner diameter and 4500 mm using a CFD ANSYS Fluent 14.0. The simulation was carried out for four superficial water velocities of 0.29, 0.6, 0.9 and 1.2 m/s and three different volumetric quality (β) of 9.2%, 18.6% and 40% at inclination angles of 0°, 5° and 30°. The main conclusions of this study are:
0
0.1
0.2
0.3
0.4
0.5
0.6
0.7
0.8
‐1 ‐0.5 0 0.5 1
Wat
er v
eloc
ity
(m/s
)
Radial distance (r/R)
40% 18.60% 9.20%
0
0.1
0.2
0.3
0.4
0.5
0.6
0.7
0.8
0.9
‐1 ‐0.5 0 0.5 1
Dro
p ve
loci
ty (
m/s
)
Radial distance (r/R)
40% 18.60% 9.20%
252 Petroleum and Mineral Resources
www.witpress.com, ISSN 1743-3533 (on-line) WIT Transactions on Engineering Sciences, Vol 81, © 201 WIT Press2

1. The flow parameters such as volume fraction, water velocity and drops velocity distribution are fairly well predicted for vertical pipe with some discrepancy for inclined cases.
2. The inclination affects the distribution of volume fraction and the velocity of both phases. At superficial water velocity of 0.29 m/s, the increase of pipe inclination results in a severe asymmetry of volume fraction with peak near the upper wall and almost zero value at lower wall. Similar effect was observed for velocity of both phases but with less asymmetry compared to volume fraction.
3. The increase of the superficial velocity in inclined pipe leads to uniform volume fraction distribution across the pipe, which becomes similar to flow in a vertical pipe. The velocity of both phases becomes symmetrical and very much similar to vertical pipe. The modification in flow structure reduces the damage of the pipes caused by corrosion when water cover the inside wall of the pipe.
4. The increase of the volumetric quality has a small effect on volume fraction, water velocity and drop velocities distribution compared to the increase of superficial water velocity.
5. The velocity contours highlight the existence of the three layers of flow in inclined pipes, which were investigated by previous researcher.
References
[1] Agranat, V., Kawaji, M. and Chan A., Modelling of Gas/liquid Two-Phase Flows in vertical Pipes Using PHOENICS. The PHOENICS Journal of computational Fluid Dynamics and its Applications, 13 (1), pp. 1-12, 2000.
[2] Mouza, A.A., Paras, S.V. and Karabelas, A.J., CFD code application to wavy stratified gas-liquid flow. Institution of Chemical Engineers Trans IChemE, 79, Part A, pp. 561-568, 2001.
[3] Matos, A., Rosa, E.S. and Franca, F.A., The Phase Distribution of Upward Co-Current Bubbly Flows in a Vertical Square Channel. J. Braz. Soc. Mech. Sci. Eng., XXVI, pp. 308–316, 2004.
[4] Li-yang, W., Ying-xiang, W., Zhi-chu, Z., Jun, G. Jun Z. and Chi, T., Oil-water two-phase flow inside T-junction. Journal of Hydrodynamics, 20, pp. 147-153, 2008.
[5] Walvekar, R.G., Thomas, S.Y., Husssain, S.A., Khalid M. and Chuah, T.G., Numerical Study of Dispersed Oil–Water Turbulent Flow in Horizontal Tube. J. Petrol. Sci. Eng., 65, pp. 123–128, 2009.
[6] Hamad, F.A., He, S., Khan, M.K., Bruun, H.H., Development of kerosene–water two-phase up-flow in a vertical pipe downstream of A 90° bend. The Canadian Journal of Chemical Engineering, 9999, pp. 1-14, 2012.
Petroleum and Mineral Resources 253
www.witpress.com, ISSN 1743-3533 (on-line) WIT Transactions on Engineering Sciences, Vol 81, © 201 WIT Press2

[7] Al-Deen, M.F.N, Hamad, F.A and Bruun, H.H., Kerosene/water two-phase flow in vertical and inclined pipes. Proceedings of Third International Conference on Multiphase Flows, ICMF’98: Lyon, France, pp. 1-7, 1998.
[8] Taitel, Y. and Dukler, A.E., A Model for Predicting Flow Regime Transition in Horizontal and Near Horizontal Gas-Liquid Flow. AIChE. Journal, 22 (1), pp. 47-55, 1976.
[9] Brauner, N. and Maron, D.M., Two-phase liquid-liquid stratified flow. Physico Chem. Hydrodynamics, 11(4), 487-506, 1989.
254 Petroleum and Mineral Resources
www.witpress.com, ISSN 1743-3533 (on-line) WIT Transactions on Engineering Sciences, Vol 81, © 201 WIT Press2