single nucleotide polymorphism in the seed...
TRANSCRIPT
SINGLE NUCLEOTIDE POLYMORPHISM IN THE
SEED REGION OF MICRORNA ALTERS THE
EXPRESSION OF ITS MATURE MICRORNA
LEONG PEI LI
DISSERTATION SUBMITTED IN FULFILMENT OF THE
REQUIREMENTS FOR THE DEGREE OF
MASTER OF SCIENCE
INSTITUTE OF BIOLOGICAL SCIENCES
FACULTY OF SCIENCE
UNIVERSITY MALAYA
KUALA LUMPUR
2013
i
ABSTRACT
MicroRNAs (miRNA) are a class of non-coding RNAs with approximately 18 to 28 nt,
which are important in post-transcriptional gene regulation. In this study, potential
single nucleotide variant within seed region sequence of mature miRNAs of Homo
sapiens was identified. Mature miRNA sequences of Homo sapiens were collected from
miRBase database. A total of 1344 mature miRNA sequences were used to compare
with single nucleotide variant sequence in UCSC database to search for candidate
miRNA variant. Fourty-two mature miRNAs that have single nucleotide variant on
seed-region were identified. Prediction of the secondary structure with MFOLD had
identified a total of fourteen potential miRNAs that have a single nucleotide variant on
the seed region. Two mature miRNAs with SNP on their seed-region had been chosen
to validate experimentally with real-time PCR approach; miR124-3 (miRBase ID
MI0000445) and miR-662 (miRBase ID MI0003670). These two potential single
nucleotide variant on the seed region sequence of mature miRNAs were found to
enhance the expression of its mature miRNA. The nucleotide change on the seed region
of miR124-3 and miR-662 is suspected to provide stable secondary structure of pri-
miRNA and pre-miRNA compare to the wild-type allele of miRNAs. The increased
expression of specific miRNAs could possibly render the miRNA to act as an oncomiR
or vice versa as a tumour suppressor miRNA, hence this study emphasizes that a single
nucleotide change on the seed-region of mature miRNA could potentially lead to
widespread phenotypic effects and broadens our understanding on miRNA biogenesis.
ii
ABSTRAK
MicroRNAs (miRNA) adalah kelas bukan pengekodan pernas dengan kira-kira 18-28 nt,
yang penting dalam peraturan gen pasca-transkripsi. Dalam kajian ini, potensi varian
tunggal nukleotida dalam urutan rantau benih miRNAs matang Homo sapiens telah
dikenal pasti. MiRNA urutan matang Homo sapiens telah dikumpulkan dari pangkalan
data miRBase. Sebanyak 1344 urutan miRNA matang telah digunakan untuk
membandingkan dengan urutan varian nukleotida tunggal dalam pangkalan data UCSC
untuk mencari calon miRNA varian. Empat puluh dua miRNAs matang yang
mempunyai varian nukleotida tunggal pada benih rantau telah dikenalpasti. Ramalan
struktur menengah dengan MFOLD telah mengenal pasti sebanyak empat belas
miRNAs potensi yang mempunyai varian tunggal nukleotida pada rantau benih. Dua
miRNAs matang dengan SNP pada benih-kawasan telah dipilih untuk mengesahkan uji
kaji dengan pendekatan PCR masa sebenar; miR124-3 (miRBase ID MI0000445) dan
Mir-662 (miRBase ID MI0003670). Kedua-dua varian potensi tunggal nukleotida pada
urutan rantau benih miRNAs matang telah didapati untuk meningkatkan ungkapan
miRNA matang itu. Perubahan nukleotida kepada rantau benih daripada miR124-3 dan
mir-662 disyaki menyediakan struktur menengah stabil pri-miRNA dan pra-miRNA
berbanding allele liar-jenis miRNAs. Ungkapan peningkatan miRNAs tertentu mungkin
boleh menyebabkan miRNA untuk bertindak sebagai oncomiR atau sebaliknya sebagai
penindas miRNA tumor, maka kajian ini menekankan bahawa perubahan nukleotida
tunggal pada benih rantau miRNA matang berpotensi membawa kepada kesan fenotip
meluas dan meluaskan pemahaman kita pada biogenesis miRNA.

iii
ACKNOWLEDGEMENT
I would like to express my gratitude to all those who made this thesis possible. I am
greatly indebted to my supervisor, Dr, Ng Ching Ching. I have learnt much under her
supervision. Her advice and encouragement have helped me in my research as well as
the writing of this thesis.I can only say a proper thank you to Department of Biology,
University Malaya who offer me a tutorship that grant my works.
I would like to say thank you to my lab buddies - Chin Yoon Ming, Yew Poh Yin, Tai
Mei Chee, Lim Yat Yuen, Taznim, Yeo Kok Siong, Lim Chun Shen, and Goh Siang
Ling. They have guided me tirelessly throughout my learning process. They were
always very accommodating despite their very heavy workload. A simple thank you
would not suffice but I mean it with the utmost appreciation and respect.
All my lab buddies and seniors at NPC1, NPC2 and C8 – Wong Cheng Siang, Lim Hui
Jia and See To Wah Sing. They helped me by giving me encouragement and friendship.
I treasure the time we spent together, bouncing ideas off each other, generating useful
ideas and solutions to our respective projects. Everyone made the lab a convivial place
to work. As a result, research life became very rewarding to me.
I would like to gratefully acknowledge the support of some individuals – Lau Su Ee,
Tan Wei Wei, and Goh Pei See. It was important for shaping my thesis writing.
Finally, my deepest gratitude goes to my family for their unconditional love and support
throughout my life.

iv
TABLE OF CONTENT
ABSTRACT ....................................................................................................................... i
ABSTRAK ........................................................................................................................ ii
ACKNOWLEDGEMENT ............................................................................................... iii
TABLE OF CONTENT ................................................................................................... iv
LIST OF FIGURES ........................................................................................................ vii
LIST OF TABLES ........................................................................................................... ix
ABBREVIATIONS .......................................................................................................... x
Chapter 1 INTRODUCTION ............................................................................................ 1
1.1 Introduction ............................................................................................................. 1
1.2 Literature Review .................................................................................................... 2
1.2.1 Organization of human genome ....................................................................... 2
1.2.2 MicroRNA (miRNA) in human ....................................................................... 6
1.2.3 Type of genetic variations in microRNA ....................................................... 11
1.2.4 Future prospects of microRNA ...................................................................... 16
1.3 Objectives .............................................................................................................. 17
Chapter 2 MATERIALS AND METHODS ................................................................... 18
2.1 Materials ................................................................................................................ 18
2.2 Methods ................................................................................................................. 21
2.2.1 MicroRNA database ....................................................................................... 21
2.2.2 Local Alignment of miRNA and SNP databases ........................................... 21
2.2.3 Prediction of potential single nucleotide variant within pre-miRNAs using
secondary RNA structures....................................................................................... 23
2.2.4 Construction of DNA plasmid ....................................................................... 24
2.2.5 Cell culture and transfection .......................................................................... 31
v
2.2.6 Quantification experiment .............................................................................. 35
Chapter 3 RESULTS ....................................................................................................... 41
3.1 BLAT search for single nucleotide variation within seed region sequence of
mature miRNAs .......................................................................................................... 41
3.2 Prediction of secondary RNA structures for the wild-type allele and variant allele
of pre-miRNAs ............................................................................................................ 44
3.3 Genomic DNA extracted from control human blood ............................................ 52
3.4 Polymerase Chain Reaction of wild type allele of pri- microRNAs ..................... 53
3.5 Cloning and transformation of pri-miRNAs ......................................................... 54
3.6 Plasmids of TA vector ........................................................................................... 55
3.7 Subcloning of pri-miRNAs sequencing vectors to pcDNA TM
3.1/Zeo (-) vector 57
3.8 Mutagenesis of pcDNA pri-miRNAs .................................................................... 61
3.9 DNA sequencing and sequence alignment of pri-miRNAs from database, pcDNA
pri-miRNAs and mutagenized pcDNA pri-miRNAs. ................................................. 64
3.10 Cell culture .......................................................................................................... 66
3.11 RNA extraction from cell culture ........................................................................ 67
3.12 Statistical analysis of quantitative real time polymerase chain reaction (qRTPCR)
..................................................................................................................................... 68
3.12.1 TaqMan miRNA assay for mature miRNAs ................................................ 68
3.12.2 Expression level of mutagenized miRNA gene relative to wild-type miRNA
gene in percentage (%) ............................................................................................ 69
Chapter 4 Discussion ...................................................................................................... 72
4.1 Features of miRNA function ................................................................................. 72
4.2 Genetic variation of miRNA sequences ................................................................ 73

vi
4.3 Pre-miRNA secondary structure prediction .......................................................... 75
4.4 Validation of wild-type and variant allele in two miRNA forms.......................... 76
4.4.1 Single nucleotide variant in seed-region miR-124-3 and miR-662 enhanced
the processing of mature miRNA ............................................................................ 76
4.4.2 Single nucleotide variation in seed-region miR-124-3 and miR-662 do not
affect pri- and pre-miRNA processing .................................................................... 77
4.5 Relationship between microRNA expression and disease predisposition ............ 79
4.6 Future aspects ........................................................................................................ 83
Chapter 5 Conclusion ...................................................................................................... 84
References ....................................................................................................................... 85
Appendix ......................................................................................................................... 99

vii
LIST OF FIGURES
Figure 1-1: Structure of DNA and chromosome. .............................................................. 3
Figure 1-2: Classes of human genetic variant ................................................................... 4
Figure 1-3: Single nucleotide polymorphisms (SNPs) in human population. .................. 6
Figure 1-4: The ‘ssRNA–dsRNA junction-anchoring’ model for pri-miRNA processing.
......................................................................................................................................... 10
Figure 1-5: Secondary structure of Let-7b ...................................................................... 10
Figure 1-6: Summary of types of miRNAvariant. .......................................................... 12
Figure 2-1: Flowchart for bioinformatics approaches to identify potential single
nucleotide variation within seed region sequence of mature miRNAs ........................... 22
Figure 2-2: Primers A and B contained desire single nucleotide mutation were used to
amplify the entire plasmid. .............................................................................................. 30
Figure 2-3: Counting chamber with nine squares. .......................................................... 33
Figure 2-4: Transfection plates consist of one empty vector, three wild-type allele of
pri-miRNA, three pri-miRNA variant and five empty wells. ......................................... 34
Figure 2-5: Reverse transcription of short single stranded mature miRNA using specific
looped RT primer manufactured by Applied Biosystems. .............................................. 37
Figure 2-6: The position of primers that recognized pri-miRNA alone (F1 and R1)
or both pre-miRNA and pri-miRNA (F2 and R2). .......................................................... 38
Figure 3-1: Secondary structures of the wild type allele and variant allele pre-miRNAs
as predicted by MFOLD.................................................................................................. 45
Figure 3-2: Genomic DNA from human blood. .............................................................. 52
Figure 3-3: PCR of wild type pri-miRNA fragment. ...................................................... 53
Figure 3-4: Colony PCR of pri-miRNA fragment from bacteria colony ........................ 54
Figure 3-5: Plasmids containing wild type pri-miRNA .................................................. 55
Figure 3-6: PCR of plasmid pri-miRNA ......................................................................... 56
viii
Figure 3-7: Digested expression vector and wild type pri-miRNA fragment ................. 57
Figure 3-8: PCR of pri-miRNA fragment from expression vector ................................. 58
Figure 3-9: Plasmid containing wild type pri-miRNA .................................................... 59
Figure 3-10: PCR of positive clone of expression vector containing wild type pri-
miRNA ............................................................................................................................ 60
Figure 3-11: PCR of mutagenized pri-miRNA fragment. ............................................... 61
Figure 3-12: Positive transformant containing mutagenized pri-miRNA ....................... 62
Figure 3-13: PCR of mutagenized pri-miRNA fragment ................................................ 63
Figure 3-14: Sequence alignment of pri-miR-125a from miRBase database, recombinant
plasmid of pri-miR-125a (pcDNA-miR-125a) and recombinant plasmid of mutagenized
pri-miR-125a (pcDNA-miR-125aM). ............................................................................. 64
Figure 3-15: Sequence alignment of pri-miR-124-3 from miRBase database,
recombinant plasmid of pri-miR-124-3 (pcDNA-miR-124) and recombinant plasmid of
mutagenized pri-miR-124-3 (pcDNA-miR-124M) ......................................................... 65
Figure 3-16: Sequence alignment of pri-miR-662 from miRBase database, recombinant
plasmid of pri-miR-662 (pcDNA-miR-662) and recombinant plasmid of mutagenized
pri-miR-662 (pcDNA-miR-662M).................................................................................. 65
Figure 3-17: Transfection rate was checked by comparing on the same spot of cells
under microscope. ........................................................................................................... 66
Figure 3-18: Agarose gel of total RNA samples extracted from HEK 293T cells. ........ 67
Figure 3-19: Comparision of relative quantification between miR-125a, miR-124-3 and
miR-662. ......................................................................................................................... 69
Figure 3-20: Quantitative Real Time PCR was used to measure the levels of pri-, pre-
and mature forms of wild-type miRNA and mutagenized miRNA. ............................... 71
Figure 4-1: Productive Processing versus Abortive Processing. The fragment from
abortive processing are designated as F1′, F2′, and F3′. ........................................ 78
ix
LIST OF TABLES
Table 2.1: Primers sequences for PCR: ranging from 20-22nt; 50-60% of GC content
and melting temperature within 55-58°C. ....................................................................... 26
Table 2.2: Primers sequences for mutagenesis: ranging from 30-45nt, at least 40% of
GC content and melting temperature greater or equal to 78°C. ...................................... 26
Table 2.3: Recipe for transfection complexes. ................................................................ 35
Table 2.4: Primer sequences used in quantitative SYBR Green Real Time PCR........... 38
Table 3.1: Potential single nucleotide variant within seed region sequence of mature
miRNAs by homology search (BLAT result) ................................................................. 42
Table 4.1: Allele frequency of miR-662 in 4 populations (overall 178 individuals) ...... 74
Table 4.2: Minimal folding energy (MFE) value of miRNA secondary structure.......... 75
Table 4.3: Predicted potential 3’ UTR mRNA targets for miR-124-3 and miR-662 ...... 82

x
ABBREVIATIONS
% precent sign
~ approximate
∆ delta
°C degree Cesiues
BLAST basic local alignment seach tool
BLAT BLAST-like alignment tool
bp base pair
CD164 Sialomucin core protein 24
CDK6 Cyclin-dependent kinase 6
CREB5 Cyclic AMP-responsive element-binding protein 5
CSF3 colony stimulating factor 3
DCC Deleted in Colorectal Cancer
DEPC Diethyl pyrocarbonate
DNA deoxy ribonucleic acid
dNTP deoxyribonucletide triphosphate
dsRNA double-stranded ribonucleic acid
e.g. exempli gratia
et al et alia
etc et cetera
g gram
HEK293T human embryonic kidney 293T
IGFBP7 Insulin-like growth factor-binding protein 7
ITGB1 Integrin Beta 1
kcal/mol kilocalorie/mole
M molar
MFE minimal folding energy
MFEI minimal folding free energy index
min minute
miRNA microRNA
MKX Homeobox protein Mohawk
ml milliliter
mm millimetre
mM millimolar

xi
mRNA messenger ribonucleic acid
NEGR1 Neuronal growth regulator 1
nm nanometer
nt nucleotide
OSCC oral squamous cell carcinoma
PCR polymerase chain reaction
pre-miRNA precursor miRNA
pri-miRNA primary miRNA
PTPN12 Tyrosine-protein phosphatase non-receptor type 12
qRTPCR quantitative real time PCR
RNA ribonucleic acid
RQ relative quantification
SNP single nucleotide polymorphism
ssRNA single-stranded ribonucleic acid
UTR untranslated region
UV ultraviolet
VAMP3 Vesicle-associated membrane protein 3
μl micro liter

1
CHAPTER 1 INTRODUCTION
1.1 Introduction
In 1990s, two research groups - Lee et al. (1993) and Wightman et al. (1991)
have independently discovered a small 22 nt RNA from the lin-4 gene. They found that
lin-4 gene sequence complement that of the lin-14 gene, and negatively regulates lin-14
expression in Caenorhabditis elegans. These classes of small non-coding RNAs are
later known as microRNAs (miRNAs). In general, miRNAs function to downregulate
gene expression by cleaving or inhibiting the translation of their target gene transcript.
They are important in signaling, cell fate identity, organ differentiation and
development, stress responses, disease and carcinogenesis (Lai, 2003). Up to date,
more than 24,521 miRNAs have been identified from 133 species including primates,
rodent, birds, fish, worms, flies, plant and viruses (miRBase Release 20.0, June 2013).
Hypothetically, defect in miRNA biogenesis or aberrant miRNA expression
level may lead to disorganized cellular processes and eventually cause human diseases.
For example, miR-107 was significantly down regulated in Alzheimer’s disease
(Garofalo et al., 2008; Nelson et al., 2008); miR-133b show very low expression level
in Parkinson’s disease and miR-1 is over expressed in individuals with coronary artery
disease (Garcia and Miska, 2005; Rooij et al., 2006).
Single nucleotide polymorphisms (SNPs) are the most common DNA variation
found in human genome and contribute to human disorders or cancers. Single
nucleotide variation within the seed region of a mature miRNA sequence may
contribute to a different expression of miRNA, including post transcription miRNA
processing and miRNA stability and functions. Besides that, nucleotides variation

2
within the seed region of mature miRNA that are phenotypic neutral may contribute to
the evolution of miRNAs with new or altered function that resulted in the production of
novel miRNAs with more specialized functions (Sun et al., 2010).
This study on single nucleotide variant within the seed region of mature miRNA
sequence ultimately explored the post-processing of the affected miRNA. The
knowledge gained from this study provides insights into how SNPs within seed regions
may influence the biogenesis of a miRNA.
1.2 Literature Review
1.2.1 Organization of human genome
A genome is an organism’s complete set of double stranded deoxyribonucleic
acid (DNA). Each genome contains important information to build and to maintain one
organism. In human, the entire genome consists of approximately 3.2 billion DNA base
pairs which are organized in 24 distinct chromosomes (Vogel and Motulsky, 1997;
Venter et al., 2001; Bonham et al., 2005). Human genome project has revealed that
there are about 30,000 genes (two percentage of the total DNA content) that are
responsible for coding ribonucleic acid (RNA). RNA involves in producing functional
proteins, such as coding, structural and regulatory (Vogel and Motulsky, 1997; Venter
et al., 2001; Collins, 2003; Kidd et al., 2004; Bonham et al., 2005; Sampo Sammalisto,
2008).
One individual receives one chromosome of each type from each parent.
Therefore, each individual has its own sets of 22 autosomal chromosome pairs (Figure
1-1) and a pair of sex chromosome, either XX (female) or XY (male) (Vogel and
Motulsky, 1997; Sampo Sammalisto, 2008). Majority of the human genetic information

3
is identical among all human beings, yet each individual’s genetic code still differs
slightly. It has been shown that any two human individuals that are about 99.8% to
99.5% genetically identical, they share only the most important genetic material. The
remaining 0.2% to 0.5% difference, which represents sixteen to fifteen million gene
variant, can occur in different combinations which are enough to cause individual
uniqueness (Venter et al., 2001; Collins, 2003; Kidd et al., 2004; Bonham et al., 2005).
Figure 1-1: Structure of DNA and chromosome. Double stranded DNA is tightly
coiled within each chromosome.
(Figure from Sharma, N.S., 2005 - Molecular Structure of Genes and Chromosomes)
1.2.1.1 Human genetic variation
Genetic variation slowly leads to the genetic diversity of human beings (Vogel
and Motulsky, 1997; Brooker, 2005; Li, 2012). It represents the total amount of genetic
characteristic obtained within human. The genetic differences that occurred in between
human can be found in both individual and population level (Snustad and Simmons,
2003; Jorde et al., 2004; Kidd et al., 2004; Brooker, 2005; Frazer et al., 2009). In the
individual level, there is no two humans with identical genetic. Even monozygotic twins
have genetic differences due to copy number variation and mutations. In population
level, alleles occur at different frequencies in different population that is especially
4
geographically and ancestrally divert (Vogel and Motulsky, 1997; Snustad and
Simmons, 2003; Jorde et al., 2004; Wong et al., 2007; Frazer et al., 2009).
Genetic variation in human genome exists as various levels, from single base
pair to thousand kilo base pairs (Snustad and Simmons, 2003; Brooker, 2005; Wong et
al., 2007). The causes of these variations are the genetic recombination, random
assortment, mutational event and evolutionary forces (natural selection and genetic drift)
(Vogel and Motulsky, 1997; Snustad and Simmons, 2003; Svetlanov and Cohen, 2004;
Brooker, 2005; Sampo Sammalisto, 2008; Frazer et al., 2009). There are common and
rare variant: common variant are synonymous with polymorphisms with a minor allele
frequency of at least one percent, while rare variant are those with a minor allele
frequency less than one percent (Vogel and Motulsky, 1997; Snustad and Simmons,
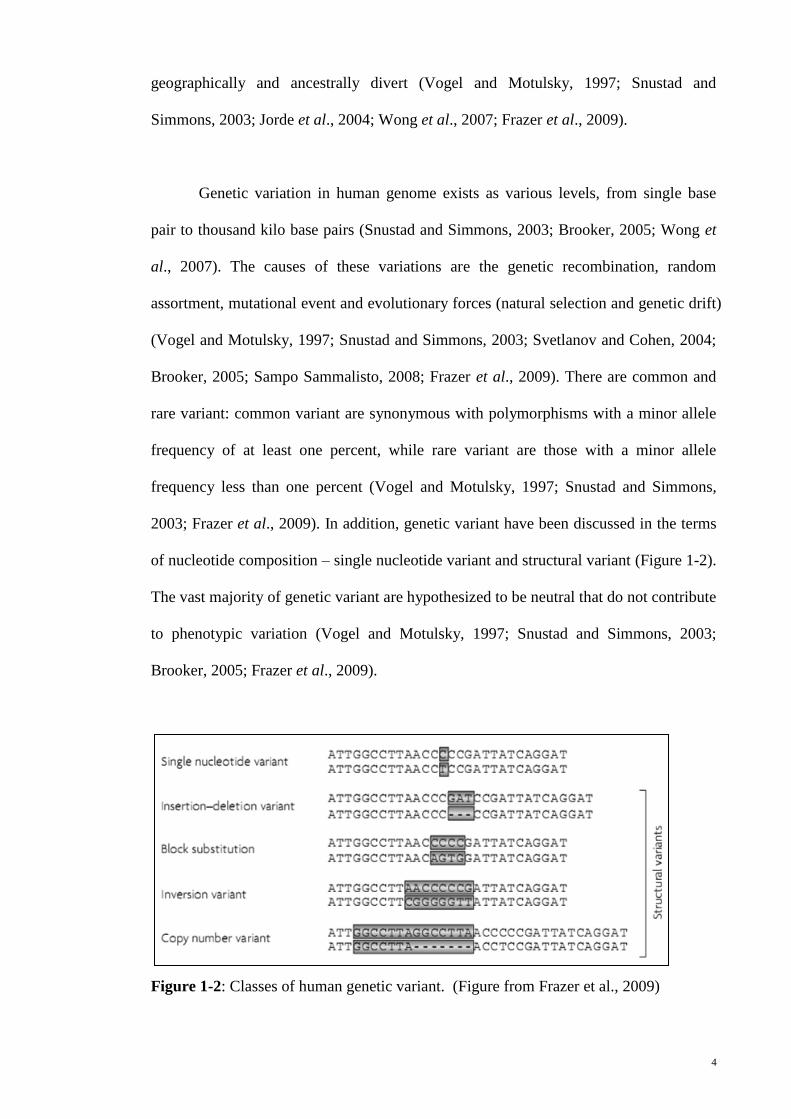
2003; Frazer et al., 2009). In addition, genetic variant have been discussed in the terms
of nucleotide composition – single nucleotide variant and structural variant (Figure 1-2).
The vast majority of genetic variant are hypothesized to be neutral that do not contribute
to phenotypic variation (Vogel and Motulsky, 1997; Snustad and Simmons, 2003;
Brooker, 2005; Frazer et al., 2009).
Figure 1-2: Classes of human genetic variant. (Figure from Frazer et al., 2009)

5
1.2.1.2 Single nucleotide variant
Single nucleotide variant are classified when a single nucleotide (adenine-A,
thymine-T, cytosine-C or guanine-G) is altered in the DNA sequence (Vogel and
Motulsky, 1997; Snustad and Simmons, 2003; Brooker, 2005; Frazer et al., 2009).
Single nucleotide polymorphisms (SNPs) are the most common single nucleotide
variation among individuals (Figure 1-3). SNPs are estimated to occur at 1 out of every
1,250 bases in human genome (Vogel and Motulsky, 1997; Syvänen, 2001; Venter et al.,
2001; Sampo Sammalisto, 2008; Frazer et al., 2009). Survey of the sequencing results
show that there are at least 30 million SNPs occur in human genome (Venter et al., 2001;
Duan et al., 2007; Frazer et al., 2009). There are almost two million of validated SNPs
in public available databases – SNP Consortium, International Hapmap Project, UCSC
Genome Bioinformatics site and National Center for Biotechnology Information (NCBI)
(Syvänen, 2001; Kidd et al., 2004; Frazer et al., 2009).
SNPs are innumerable rare and novel, in some cases segregate only in a nuclear
family or a single individual (Frazer et al., 2009). Only a small proportion of SNPs
(<1%) give impact at the phenotypic level (Syvänen, 2001; Venter et al., 2001). This is
because only SNPs that occur in the coding regions and regulatory regions of the genes
will alter the amino acid sequences of proteins and gene expression. These alterations
cause most of the dominantly or recessively inherited monogenic disorders (Vogel and
Motulsky, 1997; Syvänen, 2001; Venter et al., 2001; Snustad and Simmons, 2003;
Brooker, 2005; Li, 2012). Therefore, these SNPs are routinely analyzed for diagnostic
and pharmacogenetic purposes. However, SNPs that located in the non-coding regions
of the genome are yet to study their impact on phenotype (Vogel and Motulsky, 1997;
Syvänen, 2001; Brooker, 2005; Li, 2012). SNPs are useful as markers in common and

6
multifactorial disorders, besides population genetics and evolutionary studies (Syvänen,
2001; Kwok and Chen, 2003; Snustad and Simmons, 2003; Brooker, 2005).
Figure 1-3: Single nucleotide polymorphisms (SNPs) in human population.
(Figure from http://www.celera.com/celera/cdx_discover)
1.2.2 MicroRNA (miRNA) in human
To date, miRNAs have been found in plant and animal multicellular organisms
(Carrington and Ambros, 2003; Millar and Waterhouse, 2005). According to the
miRNA Registry Database – Release 20.0, June 2013 (http://www.sanger.ac.uk), 24,521
miRNA genes have been identified in 133 species, such as plant, primates, metazoan,
vertebrates, amphibian, arthropoda, mammalian, DNA viruses, and single cellular algae.
These include 1872 Homo sapiens miRNAs, 223 Caenorhabditis elegans miRNAs, 238
Drosophila melanogaster miRNAs, 346 Danio rerio miRNAs, 734 Gallus gallus
(chicken) miRNAs and etc (Jones, 2004; Jones et al., 2006; Jones et al., 2008). Animal
miRNAs are evolutionarily conserved for at least 400 million years old (Millar and
Waterhouse, 2005).
MicroRNAs are produced to provide essential regulation of developmental
processes (Bartel, 2004; Millar and Waterhouse, 2005; Kusenda et al., 2006; Meola et
al., 2009; Kunej et al., 2012). These miRNAs have the length of about 18-28 nt which

7
are excised from endogenously encoded hairpin RNAs. MicroRNA negatively regulate
their 3’ UTR target genes by translational inhibition or degradation of mRNA (Ambros,
2004; Cullen, 2004; Lippman and Martienssen, 2004; Gregory and Shiekhattar, 2005;
Millar and Waterhouse, 2005; Lee et al., 2006; Saetrom et al., 2006; Zambon et al.,
2006; Reddy et al., 2007; Asikainen et al., 2008; Kunej et al., 2012). Significant
numbers of human miRNAs are encoded within the introns of precursor mRNAs
(Ambros, 2004; Bartel, 2004; Lee et al., 2004; Du and Zamore, 2005; Kusenda et al.,
2006; Zeng, 2006; Kim et al., 2007; Meola et al., 2009). These intron-coded miRNAs
are in the same orientation as the pre- mRNA, which suggest each processed transcript
will produce one translatable mRNA and one functional miRNA (Millar and
Waterhouse, 2005; Kim and Nam, 2006).
1.2.2.1 Characteristic of microRNA
There are several structural characteristics that are conserved among all miRNAs
to distinguish them from random or genomic hairpins of similar lengths (Ambros et al.,
2003; Saetrom et al., 2006; Kim and Nam, 2006; Zhang et al., 2006). It must follow
certain features in order to be classified as miRNA. First, the 18-28 nt of mature
miRNA sequence should be found within one arm of the hairpin structure that is lack of
large bulges or internal loops. The stem-looped secondary structures of miRNAs are
well conserved in humans (Ambros et al., 2003; Kim and Nam, 2006; Zhang et al.,
2006; Kunej et al., 2012). Secondly, the stable precursor hairpins have multiple foldings
with the lowest negative minimal folding free energy (MFE) and highest negative
minimal folding free energy index (MFEI) compared to other RNAs (Ambros et al.,
2003; Bonnet et al., 2004; Zhang et al., 2006; Zhang et al., 2007; Kunej et al., 2012).
Several parameters were considered to obtain MFEI: adjusted minimal folding free
energy (combination of minimal folding free energy and length of pre-miRNA), length

8
of RNAs and GC content. Most pre-miRNAs had an MFEI greater than 0.95 kcal/mol
while other RNAs ranged between 0.5-0.7 kcal/mol (Ambros et al., 2003; Bonnet et al.,
2004; Layton et al., 2005; Zhang et al., 2006). Third, these small miRNAs are believed
to be evolutionarily or phylogenetically conserved in closely related species (Ambros et
al., 2003; Kim and Nam, 2006; Saetrom et al., 2006; Zeng, 2006). Fourth, all miRNAs
have high complementarity to their targeted 3’ UTR mRNA, either precise
complementarity in plant or imperfect complementarity in animals. In animal miRNAs,
Watson–Crick base pairing between six or seven nucleotides in the target mRNA's
3′UTR and nucleotides 2–7 or 2–8 (the “seed sequence”) of the miRNA's 5′ end is
required (Du and Zamore, 2005; Kim and Nam, 2006; Zhang et al., 2006). As a result, a
single miRNA can regulate hundreds or thousands of different 3’ UTR mRNA targets.
Conversely, several miRNAs can bind cooperatively to a single 3’ UTR mRNA target
(Du and Zamore, 2005; Kim and Nam, 2006; Lee et al., 2006; Zhang et al., 2006).
1.2.2.2 MicroRNA biogenesis
MicroRNA resides in the intergenic (40%) or intragenic (60%) regions. It is an
endogenous transcript that can self-complement to form imperfect stem loop structures
(Ambros, 2004; Bartel, 2004; Cullen, 2004; Gregory and Shiekhattar, 2005; Lee et al.,
2006; Saetrom et al., 2006; Zambon et al., 2006; Asikainen et al., 2008; Meola et al.,
2009). A single miRNA is located on one arm of a hairpin precursor transcript.
Sometimes one pri-miRNA transcript consists of several hairpins that give rise to
different miRNAs which are known as polycistronic miRNA transcripts (Ambros et al.,
2003; Du and Zamore, 2005; Millar and Waterhouse, 2005; Kim and Nam, 2006; Kim
and Kim, 2007; Meola et al., 2009).

9
Initially, miRNAs are transcribed from long primary transcripts (pri-miRNAs)
that varies from 400-3,000 bases by RNA polymerase II enzyme. Primary transcript is 5’
capped and polyadenylated (Bartel, 2004; Du and Zamore, 2005; Kim and Nam, 2006;
Kusenda et al., 2006; Lee et al., 2006; Saetrom et al., 2006; Meola et al., 2009; Winter
et al., 2009; Ryan et al., 2010). These pri-miRNAs are then cleaved into 60-100 nt, stem
loop precursor miRNAs (pre-miRNAs) by Drosha-DGCR8 complex (RNase III
endonuclease) (Denli et al., 2004; Du and Zamore, 2005; Kusenda et al., 2006; Zeng,
2006; Kim and Kim, 2007; Reddy et al., 2007; Meola et al., 2009; Winter et al., 2009).
The Drosha-DGCR8 complex which is also known as microprocessor complex,
recognized and cleaved at the ‘ssRNA–dsRNA junction-anchoring’ structure which is
embedded within pri-miRNA (Figure 1-4) It is a stem of approximately 33 base pairs
(bp) with a terminal loop and flanking segment. Drosha-DGCR8 cleaves at ~11 bp from
the stem ssRNA junction that is critical for the processing of pre-miRNA (Han et al.,
2006; Yeom et al., 2006; Duan et al., 2007). Processed pre-miRNAs are exported out of
the nucleus to cytoplasm by RAN-GTPase/exportin-5 (Bartel, 2004; Krol et al., 2004;
Lee et al., 2006; Kim and Nam, 2006; Kim and Kim, 2007; Reddy et al., 2007; Winter
et al., 2009) and succeedingly cleaved by RNase III Dicer to release a double stranded
miRNA/miRNA complementary duplex of 18-28 nt, with a 2 nt 3’ overhang (Du and
Zamore, 2005; Gregory et al., 2005; Kim and Nam, 2006; Saetrom et al., 2006Reddy et
al., 2007; Winter et al., 2009; Kunej et al., 2012; Slaby et al., 2012). Only mature
miRNA will associate with RNA-induced Silencing Complex (RISC) (Gregory et al.,
2005; Kim and Nam, 2006; Saetrom et al., 2006; Zhang et al., 2006; Reddy et al., 2007;
Slaby et al., 2012) or ribonucleoprotein (RNP) complex (Mourelatos et al., 2002; Bartel,
2004; Lee et al., 2004; Kim and Nam, 2006; Kusenda et al., 2006; Reddy et al., 2007;
Meola et al., 2009; Winter et al., 2009). While the other miRNA complementary
(miRNA*) strand is usually degraded, although recently miRNA* has been found to
10
play similar role as miRNA (Du and Zamore, 2005; Lee et al., 2006; Saetrom et al.,
2006; Meola et al., 2009; Slaby et al., 2012).
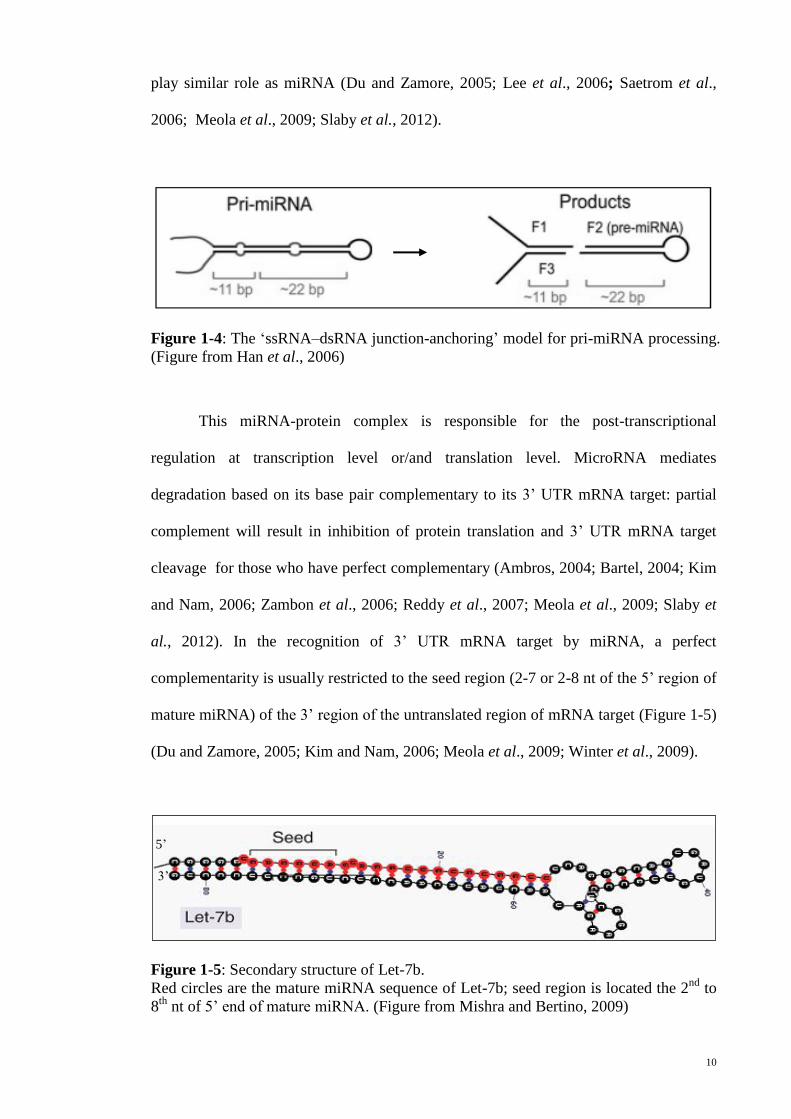
Figure 1-4: The ‘ssRNA–dsRNA junction-anchoring’ model for pri-miRNA processing.
(Figure from Han et al., 2006)
This miRNA-protein complex is responsible for the post-transcriptional
regulation at transcription level or/and translation level. MicroRNA mediates
degradation based on its base pair complementary to its 3’ UTR mRNA target: partial
complement will result in inhibition of protein translation and 3’ UTR mRNA target
cleavage for those who have perfect complementary (Ambros, 2004; Bartel, 2004; Kim
and Nam, 2006; Zambon et al., 2006; Reddy et al., 2007; Meola et al., 2009; Slaby et
al., 2012). In the recognition of 3’ UTR mRNA target by miRNA, a perfect
complementarity is usually restricted to the seed region (2-7 or 2-8 nt of the 5’ region of
mature miRNA) of the 3’ region of the untranslated region of mRNA target (Figure 1-5)
(Du and Zamore, 2005; Kim and Nam, 2006; Meola et al., 2009; Winter et al., 2009).
Figure 1-5: Secondary structure of Let-7b.
Red circles are the mature miRNA sequence of Let-7b; seed region is located the 2nd
to
8th
nt of 5’ end of mature miRNA. (Figure from Mishra and Bertino, 2009)
5’
3’

11
1.2.2.3 Biological functions of human microRNA
At present, many reports indicate that a single miRNA is able to repress a large
set of 3’ UTR targets, resulting in low protein expression levels within the miRNA-
expressing cells (Ambros, 2004; Bartel, 2004; Kim and Nam, 2006; Kusenda et al.,
2006; Zhang et al., 2006; Meola et al., 2009). Example in C. elegans, absent of let-7
causes failure in transition of larva to adult (Hammond, 2006; Kusenda et al., 2006). In
addition, miRNAs are known to involve in cell proliferation and apoptosis, as they
regulate pathways that are controlled by p53, MYC and RAS genes (Lai, 2003; Ambros,
2004; Bartel, 2004; Hammond, 2006; Zhang et al., 2006; Cho, 2007). For instance,
some miRNA clusters have been shown to act as a functional switch between
proliferation and apoptosis of cell (Plasterk, 2006; Treiber et al., 2012). Besides,
miRNAs play role in the determination of timing and maintenance of tissue or cell
identity. High miRNA expression level is found in certain tissue or cell type or at
particular developmental stage (Zeng and Cullen, 2003; Ambros, 2004; Bartel, 2004;
Du and Zamore, 2005; Zhang et al., 2006). These small miRNA also take place in
responding to environmental stresses, immune system, and neurological processes
besides playing an important role in biological processes (Zeng and Cullen, 2003; Bartel,
2004; Du and Zamore, 2005; Kusenda et al., 2006; Zhang et al., 2006; Wiemer, 2007;
Garofalo et al., 2008; Meola et al., 2009; Treiber et al., 2012).
1.2.3 Type of genetic variations in microRNA
MicroRNA sequences are known to be well conserved, but variations do take
place in miRNA with low frequency (Lai, 2003; Saunders et al., 2007; Yu et al., 2007;
Chen et al., 2008). Many miRNA variant may not have significant phenotypes as
several different miRNAs are able to target the same 3’ UTR mRNA transcript where
miRNAs would compensate for each other. Moreover, most of the predicted single

12
nucleotide variant within seed region of mature miRNA sequence are likely neutral or in
a mutation selection balance (Du and Zamore, 2005; Kim and Nam, 2006; Lee et al.,
2006; Zhang et al., 2006; Borel and Antonarakis, 2008). Not much miRNA variants are
discovered since the rare or common genomic variant are not fully identified. After
miRNAs are better characterized and more public available genomic variations database,
more studies on miRNA variant can be done in the near future (Borel and Antonarakis,
2008; Lai, 2003; Saunders et al., 2007; Yu et al., 2007; Chen et al., 2008).
Figure 1-6: Summary of types of miRNAvariant. (Figure from Meola et al., 2009)
There are four main types of sequence variations (Figure 1-6) that may affect
miRNA function: variation within pri-miRNA or pre-miRNA sequences (Iwai and
Naraba, 2005; Diederichs and Haber, 2006; Wu et al., 2008), variations in mature
miRNA sequence (Iwai and Naraba, 2005; Duan et al., 2007; Borel and Antonarakis,
2008; Mencìa et al., 2009), variations in the binding target site of 3’ UTR mRNA
(Abelson et al., 2005 ; Saunders et al., 2007; Yu et al., 2007; Chen et al., 2008; Shen et

13
al., 2008), and variations in genes or proteins that are involved in miRNA processing
and regulation (Diederichs and Haber, 2007; Yu et al., 2007; Meola et al., 2009;
Boominathan, 2010). In this study, variations in mature miRNA sequence are
emphasized.
1.2.3.1 Genetic variations in mature microRNA sequences
Point mutations within the mature miRNA sequences are known to be causal
factors of diseases (Iwai and Naraba, 2005; Duan et al., 2007; Borel and Antonarakis,
2008; Wu et al., 2008; Mencìa et al., 2009; Meola et al., 2009). Variation within
mature miRNA was first discovered to have extensive biological effect by Duan and
colleagues (2007). They worked on variation in miRNA, in particular a single
nucleotide polymorphism (SNP), rs12975333, at the 8th
nt of the 5’ end of mature
miR-125a. This variation on mature miR-125a had lowered the expression of miR-125a.
Down-regulation of miR-125a is suspected to play an important role in the pathogenesis
of breast cancer and non-small cell lung cancer (Duan et al., 2007; Borel and
Antonarakis, 2008; Jiang et al., 2010; Mencìa et al., 2009; Meola et al., 2009). In
addition, single nucleotide variation in human mature miR-96 (a single base change
A>T in the seed region of 5’-end) was the first example of miRNA implicating human
Mendelian disorder (Mencìa et al., 2009; Meola et al., 2009). However, the occurrence
of variations in functional seed region is less than 1% which is relatively rare, as the
seed region is well conserved (Saunders et al., 2007; Yu et al., 2007; Chen et al., 2008).
Hypothetically, variation within mature miRNA sequence causes pri-miRNA
unable to process into pre-miRNA normally, thus destabilize the interaction with 3’
UTR mRNA targets and hence reduced the efficiency of mRNA target inhibition (Duan
et al., 2007; Georges et al., 2007; Borel and Antonarakis, 2008; Horikawa et al., 2008;

14
Wu et al., 2008; Yu et al., 2008; Mencìa et al., 2009; Meola et al., 2009). Few studies
also stated that variation in mature miRNA may potentially alter the normal biological
processes by either changing the processing or target recognition of miRNAs (Borel and
Antonarakis, 2008; Wu et al., 2008; Mencìa et al., 2009; Meola et al., 2009; Slaby et al.,
2012). The pri-miRNA processing is an important and critical step in miRNA
biogenesis, as it determines the sequence of the mature miRNA. Therefore any
alteration in the miRNA processing is believed to affect the expression level of mature
miRNAs (Borel and Antonarakis, 2008; Wu et al., 2008; Mencìa et al., 2009; Slaby et
al., 2012). Consequently, this may affect the function of miRNA in miRNA-mRNA
target interaction. Therefore one small sequence variation at the mature miRNA-binding
sites would not only affect the interaction of miRNA and mRNA, but also has a huge
effect on hundreds of their miRNA targets (Duan et al., 2007; Yu et al., 2007; Borel
and Antonarakis, 2008; Wu et al., 2008; Mencìa et al., 2009; Meola et al., 2009). If the
miRNA targets are oncogene or tumour suppressor genes, these genes might contribute
to the development of cancers (Diederichs and Haber, 2006; Yu et al., 2007; Wu et al.,
2008; Kunej et al., 2012; Slaby et al., 2012).
1.2.3.2 Relationship of microRNA to diseases and cancer
miRNA has been found to play a critical role in the development of human
diseases and cancer (Kusenda et al., 2006; Garofalo et al., 2008; Sassen et al., 2008;
Sethupathy and Collin, 2008; Meola et al., 2009; Slaby et al., 2012). Defection in
miRNA functions or aberrant miRNA expression level may lead to abnormal miRNA
biogenesis and eventually cause disorder or diseases (Kusenda et al., 2006; Garofalo et
al., 2008; Sassen et al., 2008; Sethupathy and Collin, 2008; Meola et al., 2009). This
can be caused by either cis factors (chromosome alterations, epigenetic modifications,
mutation of promoter element and polymorphisms within miRNA sequences) or trans

15
factors (polymorphisms in miRNA target sites and functional mutation in proteins that
involved in miRNA transcription, processing and targeting) (Sethupathy and Collin,
2008).
Currently, numerous evidences suggest that human diseases are correlated with
presence of miRNA. In Alzheimer’s disease, miR-107 was significantly down regulated
and miR-125b was upregulated in brain (Garofalo et al., 2008; Nelson et al., 2008; Patel
et al., 2008; Martino et al., 2009; Zeng, 2009). Similarly, in Parkinson patient, their
midbrain show very low expression level of miR-133b compare to the normal human
(Garofalo et al., 2008; Nelson et al., 2008; Martino et al., 2009; Zeng, 2009).
MicroRNAs have been shown to regulate genes that are involved in cardiac function
and heart development. miR-1 is over-expressed in individuals with coronary artery
disease (Garcia and miska, 2005; Rooij et al., 2006; Wiemer, 2007; Garofalo et al.,
2008; Meola et al., 2009). Moreover, miRNA expression levels also greatly differ in
fragile X syndrome (Kusenda et al., 2006; Garofalo et al., 2008; Dai et al., 2009),
Tourette’s syndrome (Wiemer, 2007), schizophrenia (Garcia and miska, 2005; Garofalo
et al., 2008; Feng et al., 2009), and Duchenne muscular dystrophy (Wiemer, 2007;
Garofalo et al., 2008).
Meanwhile, significant increase or decrease of miRNA expression level may
change the pathways that are involved in tumour cell proliferation, and hence promote
cancer progression and/or tumour formation (Garcia and miska, 2005; Gregory and
Shiekhattar, 2005; Garzon et al., 2006; Gaur et al., 2007; Winter et al., 2009; Kunej et
al., 2012). In cancer, miRNAs that target oncogenes are known to act as tumour
suppressors; miRNAs that target tumour suppressors have a role as oncogene (Garcia
and miska, 2005; Garzon et al., 2006; Zhang et al., 2007). For example, miR-15a and

16
miR-16-1 in chronic lymphocytic leukaemia, and let-7 in lung cancer and non-small cell
lung cancer are found to have tumour suppressing activity (Garcia and miska, 2005;
Garzon et al., 2006; Hammond, 2006; Kusenda et al., 2006; Cho, 2007; Pan et al., 2007;
Garofalo et al., 2008; Xia, 2008) while miR-372 and miR-373 in testicular germ cell
tumour, miR-21 in breast cancer and miR-155 in Hodgkin’s Burkitt lymphoma have
oncogenic potential (Garcia and miska, 2005; Garzon et al., 2006; Cho, 2007; Pan et al.,
2007; Garofalo et al., 2008; Xia, 2008).
1.2.4 Future prospects of microRNA
The discovery and understanding of miRNA roles in various biological and
pathological processes will offer many possible therapeutic applications. The concept of
one miRNA modulates hundreds to thousands of mRNAs will provide new window for
diagnostics and prognostics therapy of many human diseases, including cancer (Du and
Zamore, 2005; Cho, 2007; Garzon et al., 2006; Kim and Nam, 2006; Kusenda et al.,
2006; Lee et al., 2006; Meola et al., 2009; Zhang et al., 2006; Garofalo et al., 2008).
MicroRNA with different expression profile can be used as biomarkers to detect and
classify diseases or tumors according to the differentiation and developmental states
(Garcia and miska, 2005; Gregory and Shiekhattar, 2005; Garzon et al., 2006; Zhang et
al., 2007). In addition, miRNA itself can function as tumour suppressors to prevent or
cure diseases (Garcia and miska, 2005; Hammond, 2006; Cho, 2007). Future therapies
could be the innovation of mimicking or antagonizing miRNA action on multiple targets
with small molecules of artificial miRNA or anti-miRNA, to treat diseases or cancers
that are difficult to cure (Garcia and miska, 2005; Zhang et al., 2007; Garofalo et al.,
2008).

17
1.3 Objectives
MicroRNAs are important regulators of development, cell signaling, stress
responses, and involved in antiviral defences (Zeng and Cullen, 2003; Bartel, 2004; Du
and Zamore, 2005; Kusenda et al., 2006; Kunej et al., 2012; Slaby et al., 2012).
Sequence variation in miRNA gene has potention contribution to human disease
pathogenesis. In this study, I hypothesized that single nucleotide variant in the seed-
regions of mature miRNA might altered the biogenesis of miRNA, therefore up-
regulation or down-regulation of mature miRNA expression level, might affects the
stable processing of mature miRNA. Hence this would contribute to the pathogenesis of
human diseases (Kusenda et al., 2006; Garofalo et al., 2008; Sassen et al., 2008;
Sethupathy and Collin, 2008; Meola et al., 2009).
Therefore this study aims to achieve the following:
1. To identify single nucleotide variant within the seed region sequence of mature
miRNAs by screening single nucleotide polymorphisms databases (dbSNP) against
miRNA databases.
2. To study the effects of single nucleotide variant within seed region of mature miRNA
sequence toward miRNA bio-processing.
Discovery of single nucleotide variant within seed region of mature miRNA
sequence gives a great opportunity to explore the potential connection between variant
miRNA genes and their 3’ UTR mRNA targets (Garcia and miska, 2005; Zhang et al.,
2007; Garofalo et al., 2008). This study would provide new insights into pharmaceutical
research and therapeutic interventions.
18
CHAPTER 2 MATERIALS AND METHODS
2.1 Materials
Component of PCR:
10X Optimized DyNAzymeTM
Buffer [10 mM Tris (pH 8.8)
50 M KCl, 1.5 mM MgCl2
0.1 % Triton® X-100]
0.2 mM of deoxyribonucleotide triphosphates (dNTP)
0.33 µM of forward (F1) and reverse primers (R1)
0.03 U of DyNAzymeTM
II DNA polymerase
Component of Cloning and Transformation:
Vector: pcDNA™ 3.3-TOPO® TA (Invitrogen) for miR-125a
PCR 4-TOPO vector (Invitrogen) for miR-124-3
pGEM®-T Easy Vector Systems (Promega) for miR-662
Salt solution (200 mM NaCl, 10 mM MgCl2)
One Shot® TOP 10 E.coli competent cells
S.O.C. medium (Super Optimal broth with catabolic repression)
Ampicillin (100 µg/ml)
Component of Ligation:
pcDNA TM
3.1/Zeo (-) vector (Invitrogen)
pcDNA™ 3.3-TOPO® TA vector (miR-125a); PCR 4-TOPO (miR-124-3) and
pGEM®-T Easy vectors(miR-662)
Restriction enzyme: HindIII, XbaI and EcoRI
T4 DNA Ligase
19
T4 DNA Ligase Reaction Buffer [50 mM Tris-HCl, 10 mM MgCl2, 1 mM ATP and
10 mM Dithiothreitol (pH 7.5)]
Component of Mutagenesis:
10X PCR Buffer (300 mM Tris [pH 9.0]
200 mM salts consisting of Na+ and NH4
2+ and 20 mM Mg
2+)
0.12 mM of deoxyribonucleotide triphosphates (dNTP)
0.3 µM of each mutagenic forward and reverse primer
0.05 U of i-pfu DNA polymerase (iNtRON)
T4 DNA Ligase and Reaction Buffer [50 mM Tris-HCl, 10 mM MgCl2, 1 mM ATP
and 10 mM Dithiothreitol (pH 7.5)]
Component of Cell Culture:
Human Embryonic Kidney 293T (HEK293T) adherent cells
DMEM-5 (Dulbecco's Modified Eagle Medium)
5% (v/v) fetal bovine serum (FBS)
100 µg/ml penicillin/streptomycin
Component of HEK293T Cell Transfection:
Green Fluorescent Protein control vector, pEGFP (Clontech)
pcDNATM
3.1 plasmid : wild-type allele of pri-miRNAs and pri-miRNA variant
Opti-MEM I Reduced Serum Medium (serum-free and without antibiotics)
Fugene® HD Transfection Reagent (Roche)
20
Component of Total RNA Extraction:
Extraction buffer [4M of guanidine isothiocyanate, 0.02M of sodium citrate, 0.5%
of sarcosyl and 0.1M of mercaptoethanol]
2M sodium acetate (pH 4)
Acidic phenol
chloroform:isoamylalcohol (24:1)
isopropanol
DEPC-treated water
DNase enzyme and buffer
Component of cDNA synthesis:
(a) Reverse transcription (RT) reaction for pri-miRNA and pre-miRNA :
1 X RT Buffer
4 mM of 25 X dNTP mix
1 X RT random primers
2.5 U of MultiScribeTM
Reverse Transcriptase
(b) Reverse transcription (RT) reaction for mature miRNA :
1 X RT buffer
1 mM dNTP mix
0.25 U RNase inhibitor
3.33 U of MultiScribeTM
Reverse Transcriptase
3 µl of 5 X TaqMan® MicroRNA RT primer
Component of TaqMan miRNA Real Time PCR:
1 X TaqMan® Fast Advanced Master Mix (2X)
1 X of TaqMan or Custom TaqMan Gene Expression Assay (20X)

21
Component of SYBR Green Real Time PCR:
1 X of Power SYBR Green PCR Master Mix (2X) [SYBR Green 1 Dye, AmpliTaq
Gold DNA Polymerase LD, dNTPs with dUTP/dTTP blend, Passive Reference 1
and optimized buffer component]
50 nM of forward and reverse primers
2.2 Methods
2.2.1 MicroRNA database
During this study was designed, the published sequences of Homo sapiens
miRNAs were downloaded from miRBase Registry, Trust Sanger Institute
(http://microrna.sanger.ac.uk/sequences/; Release 16.0, September 2010) (Jones, 2004;
Jones et al, 2006; Jones et al, 2008). A total of 1048 hairpin pre-miRNA sequences of
Home sapiens were obtained. All the sequences of pre-miRNA contained sequence of
mature miRNAs. Within these 1048 hairpin precursor entries, there are 1344 of mature
miRNA sequences. This is because some hairpin precursors may contain two functional
mature miRNAs. The chromosomal coordinates for these 1046 pre-miRNAs were also
obtained from miRBase Registry version 16.0.
2.2.2 Local Alignment of miRNA and SNP databases
Local alignment between hairpin pre-miRNA sequences and a wide range of
single nucleotide polymorphisms (SNP) sequences in SNP database were carried out
using BLAT (Basic Local Alignment Search Tool - Like Alignment Tool) (Kent, 2002).
BLAT is available via web interface at UCSC Genome browser
(http://genome.ucsc.edu/). SNP databases used were dbSNP version 131 and 132.
BLAT program is able to scan relatively short matches rapidly, and extends into high-

22
scoring pairs. Parameters used were by default and assembly chosen is “Feb. 2009
(GRCh37/hg19)”.
From the BLAT search results, the highest score and identity of near-perfect
match sequences were chosen. Variant allele of SNP sequence that falls on the pre-
miRNA sequences were chosen. Type of variant allele on pre-miRNA and mature
miRNA sequences were recorded. Single nucleotide variant within seed region
sequence of mature miRNAs were chosen and recorded. The genomic coordinates of
these selected miRNAs were confirmed to match with the related SNPs. The potential
single nucleotide variant within seed region sequence of mature miRNAs was used as a
template for the secondary structures prediction by using MFOLD program (section
2.2.3). Figure 2-1 shows the flow of selecting potential single nucleotide variant within
the seed region sequence of mature miRNAs.
Figure 2-1: Flowchart for bioinformatics approaches to identify potential single
nucleotide variation within seed region sequence of mature miRNAs.
Potential single nucleotide variantion within seed
region sequence of mature miRNAs
Prediction of miRNA SNPs structure by MFOLD
3.2
Homo sapiens hairpin
pre-miRNA sequences
(miRBase Registry)
Homo sapiens Single Nucleotide
Polymorphisms database
(UCSC)
Mutant allele of SNP that fall on
pre-miRNA sequences

23
2.2.3 Prediction of potential single nucleotide variant within pre-miRNAs using
secondary RNA structures
The selected pre-miRNAs from BLAT analysis were subjected to secondary
structure prediction using a publicly available web-based computational software
MFOLD version 3.2 (http://mfold.rna.albany.edu/?q=mfold/RNA-Folding-Form). The
outputs of MFOLD include minimum free energy (MFE), the number of nucleotides,
location of the matched region, and the number of arms per structure (Zhang et al.,
2007). Both wild-type and single nucleotide variant of the same pre-miRNAs were
deposited into the software for prediction of the most stable secondary structure. The
minimal folding energy (MFE), expressed in kcal/mol, is a method of calculating the
thermodynamic stability of the secondary structure of RNA. A stable secondary
structure of pre-miRNA has a high negative the minimal folding energy (MFE).
Minimal folding free energies of pre-miRNAs were estimated using the program
MFOLD with default parameter values (Ambros et al., 2003; Zuker, 2003; Bonnet et al.,
2004; Zhang et al., 2006; Zhang et al., 2007). The suitable secondary structure outputs
were first selected based on the high negative minimal folding energy.
Theoretically, change of one nucleotide may alter the secondary structure of the
wild-type allele of pre-miRNA transcript. Single nucleotide variant within pre-miRNA
sequence that has secondary structure with base pair mismatch (guanine–uracil pairing),
decreased minimal free energy values or enlarged RNA bulges at the seed region of
mature miRNA will first be selected. These conformation changes may alter the
processing of pre-miRNA into functional mature miRNA and hence affect the binding
of mature miRNA to 3’ UTR target genes. For the single nucleotide variant within seed
region of mature miRNA sequence that did not affect hydrogen bonds or minimal free
energy of the predicted secondary structure were excluded from this study.

24
2.2.4 Construction of DNA plasmid
2.2.4.1 Genomic DNA extraction from blood
Positive control (blood sample of Homo sapiens) was provided by NPC lab
(University of Malaya). Normal human genomic DNA was isolated by using
conventional phenol-chloroform method. Plasma was separated from the whole blood
by centrifuging at 402 X g for 5 minutes at room temperature. Approximately 8 ml of
1X RCLB (Red Cell Lysis Buffer: 10 mM Tris-HCL [pH 8.0], 5 mM MgCl2, 0.32M
sucorse and 0.75% Triton X-100) was added to 2ml of blood and centrifuged at 2,191 X
g for 10 minutes at 10°C. This step is to lyse the erythrocytes. The pellet was
resuspended in 4 ml of RCLB and centrifugation with the same condition was repeated.
If the red cells persisted, pellet was washed again. Tubes containing the pellet was air-
dried. After the pellet had dried, 80µl of 10 X Proteinase K buffer, 20µl of 20mg/ml
Proteinase K, 40µl of 20% Sodium Dodecyl Sulfate (SDS) solution and 400µl of
distilled water were added to the pellet. The mixture was incubated overnight at 37°C
waterbath. On the second day, tube containing pellet mixture was removed from
waterbath and cooled to room temperature before proceeding. Then, 200µl of 6M
sodium chloride (NaCl) was added and vortexed vigorously for 2-3 minutes. All the
mixture solution was transferred into a new tube and equal amount of phenol-
chloroform was added. The solution was centrifugated at 14,400g for 30 minutes at
10°C, the clear aqeuous supernatant was transferred to a new tube and 900µl of chilled
absolute ethanol was added. Mixture was incubated at -20°C for 1 hour. Later,
centrifugation at 14,400g for 5 minutes at 4°C was performed to remove the absolute
ethanol. The pellet was washed with 1 ml of 70% ethanol and the ethanol was removed
after centrifugation at 14,400g for 5 minutes at 4 °C. After that, the pellet was
resuspended in 100µl of TE buffer [10mM Tris (pH 8.0), 1mM EDTA].

25
2.2.4.2 Agarose gel electrophoresis
The quality of the genomic DNA was inspected by agarsoe gel electrophoresis.
Approximately 5µl of genomic DNA and 1µl of loading DNA dye per well were loaded
onto 0.8% agarose gel (0.16g agarose and 20ml of Tris-Borate-EDTA [TBE buffer: Tris
base, boric acid and 0.05M EDTA with pH 8.0]). The gel was run at 150V for 40 min,
in 1 X TBE buffer.
2.2.4.3 Quantification and quality of genomic DNA
Quantification of DNA was done in a UV Spectrophotometer with the
absorbance at 260 and 280nm. Protein shows optimal absorbance at 280nm wavelength,
thereby quantitate the amount of contaminating protein present in the sample. Therefore,
the ratio of the absorbance at 260nm/280nm indicates the purity of DNA sample. The
acceptable range is from 1.7 to 1.9.
2.2.4.4 Primer design for Polymerase Chain Reaction (PCR) and mutagenesis
Primers that annealled pri-miRNA were used to amplify pri-miRNA from
human genomic DNA by using PCR. Although the length of pri-miRNA varies
significantly, approximately 100bp flanking sequences on either side of pre-miRNA is
sufficient for miRNA biogenesis (Duan et al., 2007). Thus, focus was given on
approximately 450bp that covers the mature miRNA and 200bp of flanking sequences
on each side.
In this study, two pairs of forward and reverse PCR primers (Table 2.1) were
designed: miR-124-3 and miR-662 and miR-125a. The primers were designed with the
aid of “FastPCR” and “BioEdit” software that were downloaded from
www.biocenter.helsinki.fi/bi/Programs/download.htm and www.mbio.ncsu.edu

26
respectively. Besides, two pairs of primers for single nucleotide variation were designed
for each mature single nucleotide variation within seed region of mature miRNA
sequence (Table 2.2). The desired mutant nucleotide was placed in the centre of both
forward and reverse mutagenic primers. Stratagene’s web-based—QuikChange ®
Primer Design Program, a publicly available web-based was used
(http://www.stratagene.com/qcprimerdesign).
Table 2.1: Primers sequences for PCR: ranging from 20-22nt; 50-60% of GC content
and melting temperature within 55-58°C.
Applications Primer Sequences
Polymerase chain
reaction (PCR) :
recognized
pri-miRNA
miR125a-wF 5’-CAC AGT GGA TCC TCT GAC TCC-3'
miR125a-wR 5’-CCA TCG TGT GGG TCT CAA GG-3'
miR124-wF 5’-AAA GGG GAG AAG TGT GGG CTC-3'
miR124-wR 5’-GCA TTG TTC GCC GGA TTT GTC C-3'
miR662-wF 5’-ATA CCT GAG GTG GAG GCC TG -3'
miR662-wR 5’-CAC AGG TCA CAG CCA GCA TAC C-3'
Table 2.2: Primers sequences for mutagenesis: ranging from 30-45nt, at least 40% of
GC content and melting temperature greater or equal to 78°C .
Applications Primer Sequences
Site-directed
mutagenesis
miR125a-mF 5’-GCC AGT CTC TAG GTC CCT GAT ACC CTT
TAA CC-3’
miR125a-mR 5’-GGT TAA AGG GTA TCA GGG ACC TAG AGA
CTG GC -3’
miR124-mF 5’-GGA CCT TGA TTT AAT GTC TAT ACA ATT
AAT GCA CGC GGT GAA TGC-3’
miR124-mR 5’-GCA TTC ACC GCG TGC ATT AAT TGT ATA
GAC ATT AAA TCA AGG TCC-3’
miR662-mF 5’-CTG AAG GTC TCC CAC ATT GTG GCC CAG
CAG-3’
miR662-mR 5’-CTG CTG GGC CAC AAT GTG GGA GAC CTT
CAG-3’

27
2.2.4.5 Polymerase chain reaction (PCR) amplification
Two pri-miRNA sequences were first amplified from genomic DNA (blood
provided from NPC lab) by using PCR. Each amplification reactions was performed in a
15µl volume that contained 10X Optimized DyNAzymeTM
Buffer [10mM Tris (pH 8.8),
50mM KCl, 1.5mM MgCl2, 0.1% Triton® X-100], 0.2mM of deoxyribonucleotide
triphosphates (dNTP), 0.33µM of forward (F1) and reverse primers (R1), and 0.03U of
DyNAzymeTM
II DNA polymerase (Finnzymes). Extracted genomic DNA (20ng/µl)
was added and PCR was performed in Veriti Thermal Cyler (Applied Biosystems). The
amplification was repeated for 35 cycles: denaturation for 30s at 94°C, primer annealing
for 30s and enzymatic chain extension for 40s at 72°C, followed by a single terminal
extension at 72°C for 5 min. Distilled water was used a template as negative control.
The fragment sizes of PCR products were visualized with ethidium bromide followed
by gel electrophoresis (as mentioned in section 2.4.2). Agarose gel of 1.5% was
prepared. VC 100 bp Plus DNA ladder (Vivantis) was used to compare the fragmented
size.
2.2.4.6 Purification of PCR products
Polymerase chain reaction products were purified using PureLinkTM
Gel
Extraction Kit (Invitrogen). PCR product purification was carried out following
manufacturer’s instructions. Briefly, the DNA fragment of interest were excised from
the agarose gel, transferred into microcentrifuge tubes resuspended in Gel Solubilization
buffer. The mixture was incubated at 50 ºC for 15 minutes until the gel was completely
dissolved. The dissolved gel slice was transferred to a spin column and centrifuged at
10,500 g for 1 min. The flow-through in the collection tube was discarded and washed
with Washing Buffer added to the column and centrifuged at 10500 g for 1 min.
Flow-through was again discarded, the spin column dried and placed in a 1.5ml
28
microcentrifuge tube. Purified DNA was eluted with 30µl of nuclease free water,
incubated at room temperature for 2 min and centrifuged for 1 min to collect the DNA
The microcentrifuge tubes containing eluted DNA was stored at -20ºC. Gel
electrophoresis (as section 2.4.2) was run to confirm the size of DNA obtained.
2.2.4.7 Cloning and transformation of pri-microRNA
Purified DNA fragment of pri-miRNAs were cloned into different vectors:
pcDNA™ 3.3-TOPO® TA (Invitrogen) for miR-125a, PCR 4-TOPO vector (Invitrogen)
for miR-124-3 and pGEM®-T Easy Vector Systems (Promega) for miR-662. A mixture
of 4µl of fresh PCR product, 1µl of TOPO® or pGEM®-T Easy vector and 1µl of salt
solution (200 mM NaCl, 10 mM MgCl2) was added. The TOPO cloning reaction was
incubated at room temperature for 15 minutes, while pGEM®-T Easy cloning reaction
was incubated at 4ºC overnight. One Shot® TOP 10 E.coli competent cell is used as a
host for transformation. Incubation on ice for 5 minutes was performed after 5µl of
cloning reaction was added into 50µl of chemically competent cell. Plasmid was
introduced by heat shock for 30 seconds at 42ºC and the competent cells were
immediately transferred to ice. Then S.O.C. medium (Super Optimal broth with
catabolic repression) was added and the transformants were incubated in shaker
incubator at 37ºC for 1 hour with the speed of 200rpm. Finally transformants were
plated on LB agar plates supplemented with ampicillin (100µg/ml) for selection.
Presence of plasmid was confirmed by performing colony PCR. The primers used are
specific forward primer and reverse primer of vector.

29
2.2.4.8 DNA Plasmid extraction
Colonies with positive transformant were cultured for 16 hours at 37ºC in 10ml
of Luria-Bertani broth containing 100µg/ml of ampicillin. Glycerol stock of 800µl
bacterial culture was kept before proceeding to plasmid extraction. Bacterial cells were
harvested by centrifugation at 6,000g for 15 min at 15ºC. Bacterial cell pellets were
re-suspended in 250µl of re-suspension buffer (QIAprep Miniprep, Qiagen). Next,
250µl of lysis buffer was added into the tube and immediately another 300µl of
neutralization buffer was added. This mixture was bought for centrifugation at 18,000g
for 10 minutes. All clear supernatant was transferred to a QiAprep spin column with the
maximum volume of 750µl. Supernatant passes through with the aid of centrifugation at
18,000g for 1 minute. Then, 500µl of binding buffer was added, followed by
centrifugation and subsequently 750µl of washing buffer. Washing step was repeated
twice and finally eluted with 30µl of nuclease free water. Yields were determined by
observing DNA on 0.8% of agarose gel and UV absorbance from a spectrophotometer.
2.2.4.9 DNA sequencing
The cloned DNA fragment from all two plasmid (pcDNA™ 3.3-TOPO® TA for
miR-125a, PCR 4-TOPO vector for miR-124-3 and pGEM®-T Easy Vector Systems for
miR-662) were sequenced to validate its identity. DNA sequencing was performed
using a commercial sequencing service (Next Gene Scientific).
2.2.4.10 Sub-cloning into pcDNA vector
The correct sequence of pri-miRNA was then sub-cloned into a mammalian
expression vector, pcDNA TM
3.1/Zeo (-) vector (Invitrogen). Both PCR 4-TOPO and
pGEM®-T Easy vectors were cut with same restriction enzyme, EcoRI. Three µg/µl of
cut DNA fragment was cloned into 5µg/µl of pcDNA vector with the aid of T4 DNA
30
Ligase and T4 DNA Ligase Reaction Buffer [50mM Tris-HCl, 10mM MgCl2,
1mM ATP and 10mM Dithiothreitol (pH 7.5)]. This ligation was then transformed into
One Shot® TOP 10 E. coli competent cell. Transformants with the insert were selected
by PCR. Sequencing was used to confirm the orientation of the inserted DNA. Glycerol
stock was prepared for clones that contained correct sequence of each wild-type allele
of pri-miRNA.
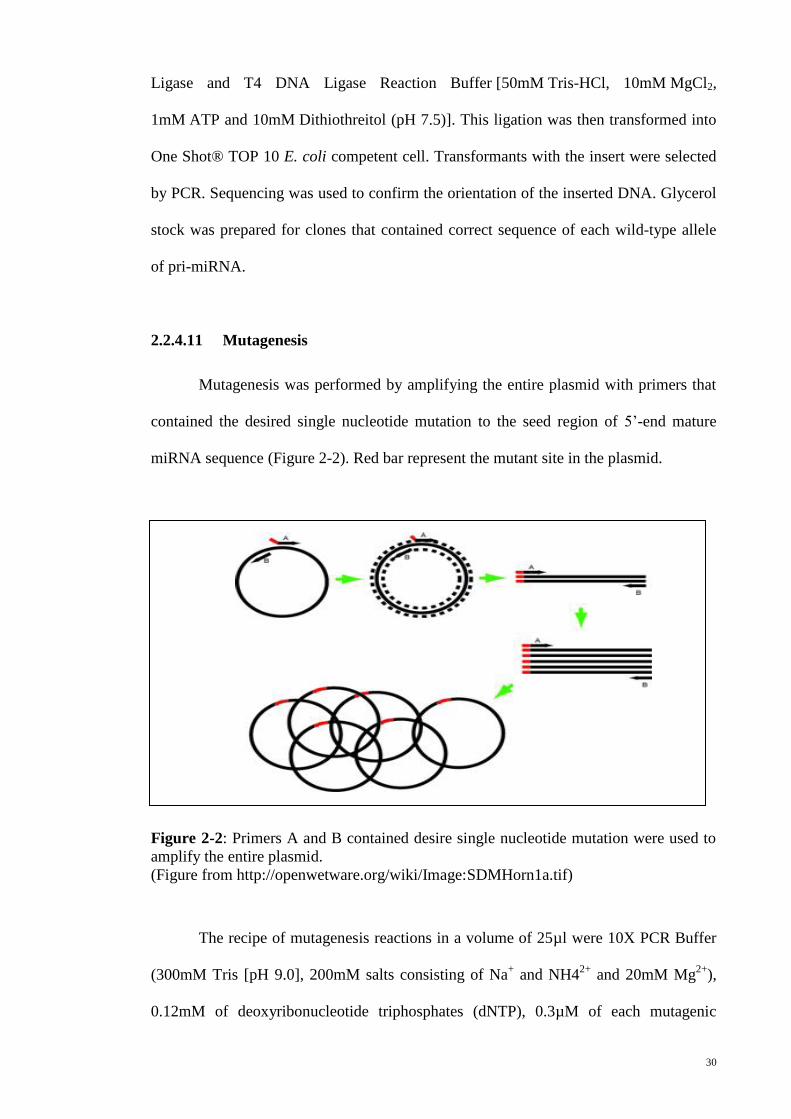
2.2.4.11 Mutagenesis
Mutagenesis was performed by amplifying the entire plasmid with primers that
contained the desired single nucleotide mutation to the seed region of 5’-end mature
miRNA sequence (Figure 2-2). Red bar represent the mutant site in the plasmid.
Figure 2-2: Primers A and B contained desire single nucleotide mutation were used to
amplify the entire plasmid.
(Figure from http://openwetware.org/wiki/Image:SDMHorn1a.tif)
The recipe of mutagenesis reactions in a volume of 25µl were 10X PCR Buffer
(300mM Tris [pH 9.0], 200mM salts consisting of Na+ and NH4
2+ and 20mM Mg
2+),
0.12mM of deoxyribonucleotide triphosphates (dNTP), 0.3µM of each mutagenic

31
forward and reverse primers and 0.05U of i-pfu DNA polymerase (iNtRON).
Approximately 50ng/µl clone of pcDNATM
3.1/Zeo (-) vector that contained correct
inserted DNA was added into the mixture for mutagenesis. Amplification was
performed at 95ºC for 1 minute as initial denaturation, followed by 25 cycles of
denaturation at 93ºC for 30 seconds, annealing at 55ºC for 30 seconds and extension at
72ºC for 9 minutes. Ligation reaction was performed by adding 4.4µl of PCR product to
0.2µl of T4 DNA Ligase and 0.4µl of T4 DNA Ligase Reaction Buffer [50mM Tris-
HCl, 10mM MgCl2, 1mM ATP and 10mM Dithiothreitol (pH 7.5)]. The ligation
reaction was incubated overnight at 16ºC. Heat shock transformation was performed
and positive transformants were selected through colony PCR and confirmed by
sequencing.
2.2.4.12 Sequence alignment
DNA sequences of plasmids for both subcloned pcDNA and mutagenized
pcDNA were analysed by alignment with pri-miRNA sequences obtained from
miRBase database. The publicly available software MEGA 4 (Molecular Evolutionary
Genetics Analysis) was used (http://www.megasoftware.net/mega4/mega.html).
2.2.5 Cell culture and transfection
2.2.5.1 Revival of frozen HEK293T cells
Human Embryonic Kidney 293T (HEK293T) adherent cells were kindly
provided by Institute of Medical Research (IMR). HEK293T cells were chosen because
of undetectable or very low levels expression of the studied miRNAs. Cryovial
containing HEK293T was thawed in a 37ºC water-bath for 2 minutes. Cells were added
drop-wise into 8ml of pre-warmed growth medium DMEM-5 (Dulbecco's Modified
Eagle Medium, Invitrogen; contains 4,500mg/L D-glucose and L-glutamine) to dilute
32
the DMSO. This DMEM-5 medium contained 5% (v/v) fetal bovine serum (FBS) and
100µg/ml penicillin/streptomycin. Centrifugation at 110 X g for 5 minutes was
performed. The cell pellets was resuspended with 5ml of DMED-20 (20% (v/v) FBS
and 100µg/ml penicillin/streptomycin) and was added into 25cm2 tissue culture flask for
overnight incubation. Incubation was performed in a humidified 37°C, 5% CO2
incubator.
2.2.5.2 Trypsinizing and subculturing cells
Cells were examined microscopically for healthiness and confluency (80-90%).
Cells were detached by trypsin treatment and sub-cultured. All DMEM-20 medium was
removed from culture flask with sterile serological pipettes. Pre-warmed trypsin (3 ml)
(TrypLE™ Express Stable Trypsin Replacement Enzyme, Invitrogen) was added to
cover adherent cell layer in the culture flask. Next, the flask was incubated at
humidified 37°C CO2 incubator for 5 minutes. Cell detachment was checked under
microscope. Trypsin activity was inhibited by adding 4 ml of DMED-10 medium (10%
(v/v) FBS and 100µg/ml penicillin/streptomycin) to the detached cells. The cells were
centrifugated at 110 X g for 5 minutes to pellet the cells. HEK293T cells were then re-
suspended with 1ml of DMEM-10 medium. Re-suspended cells were transferred to new
75cm2 culture flasks that have been labelled appropriately (cell type, date and passage
number). The cells were cultured at 37°C 5% CO2 incubator overnight. After 2 days,
several passages were repeated for all confluent secondary cultures by replacing fresh
medium.

33
2.2.5.3 Cell number count
Determining cell seeding density and cell viability is important to ensure
consistency and reproducibility of experiment. Dilution was prepared by mixing 50µl of
cells and 450µl of trypan blue solution. Cells were allowed to settle for a few seconds
before cell count is performed. The cells should be evenly distributed on the counting
chamber (Figure 2-3). A hand-held counter was used to count the cells on all five
squares.
The number of cells was determined by following calculations:
Figure 2-3: Counting chamber with nine squares.
The four corner squares (1, 2, 3, and 4) and the central square (5). (Figure from http://3-
b-s.org/cell-count-using-hemocytometer-p-159259.html)
I : cells/ml = average count per square × dilution factor × 104*
II: total cells = cells/ml × total original volume of cell suspension from which sample
was taken.
* The number 104 is the volume correction factor for the hemacytometer. Each square
is 1 × 1 mm with the depth of 0.1 mm.
34
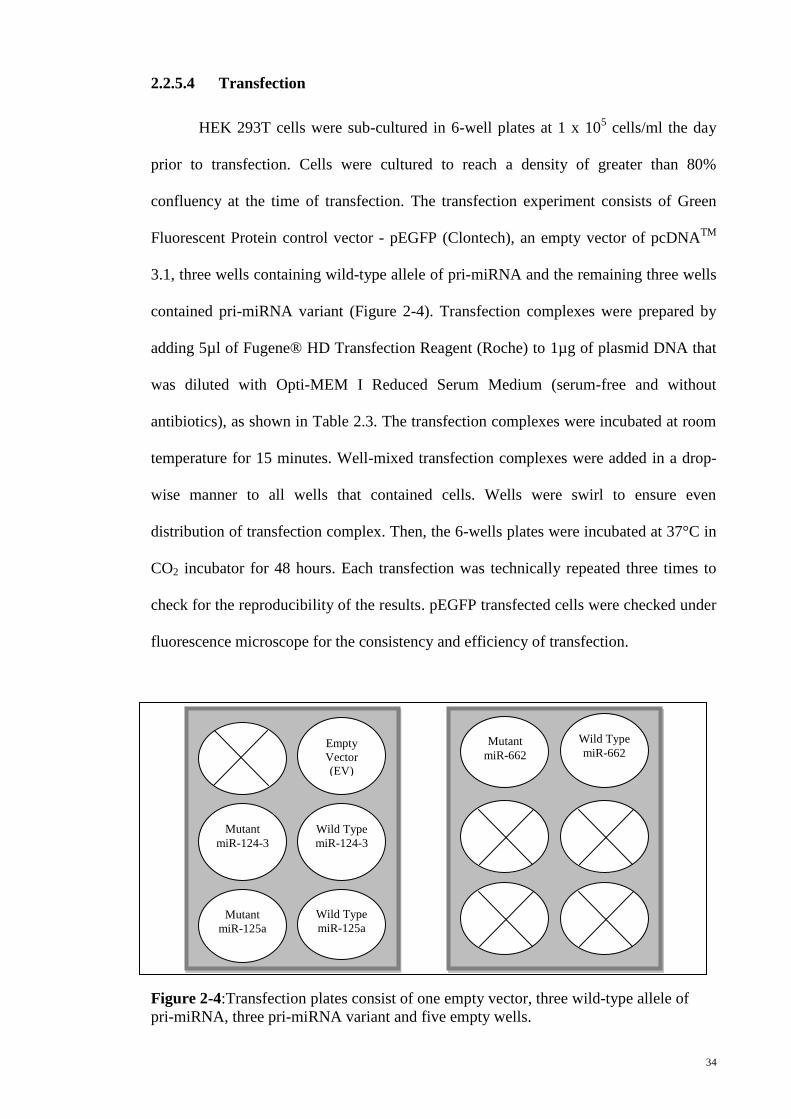
2.2.5.4 Transfection
HEK 293T cells were sub-cultured in 6-well plates at 1 x 10⁵ cells/ml the day
prior to transfection. Cells were cultured to reach a density of greater than 80%
confluency at the time of transfection. The transfection experiment consists of Green
Fluorescent Protein control vector - pEGFP (Clontech), an empty vector of pcDNATM
3.1, three wells containing wild-type allele of pri-miRNA and the remaining three wells
contained pri-miRNA variant (Figure 2-4). Transfection complexes were prepared by
adding 5µl of Fugene® HD Transfection Reagent (Roche) to 1µg of plasmid DNA that
was diluted with Opti-MEM I Reduced Serum Medium (serum-free and without
antibiotics), as shown in Table 2.3. The transfection complexes were incubated at room
temperature for 15 minutes. Well-mixed transfection complexes were added in a drop-
wise manner to all wells that contained cells. Wells were swirl to ensure even
distribution of transfection complex. Then, the 6-wells plates were incubated at 37°C in
CO2 incubator for 48 hours. Each transfection was technically repeated three times to
check for the reproducibility of the results. pEGFP transfected cells were checked under
fluorescence microscope for the consistency and efficiency of transfection.
v
Figure 2-4:Transfection plates consist of one empty vector, three wild-type allele of
pri-miRNA, three pri-miRNA variant and five empty wells.
Empty
Vector
(EV)
Wild Type
miR-124-3
Wild Type
miR-125a
Mutant
miR-124-3
Mutant
miR-125a
Mutant
miR-662 Wild Type
miR-662
35
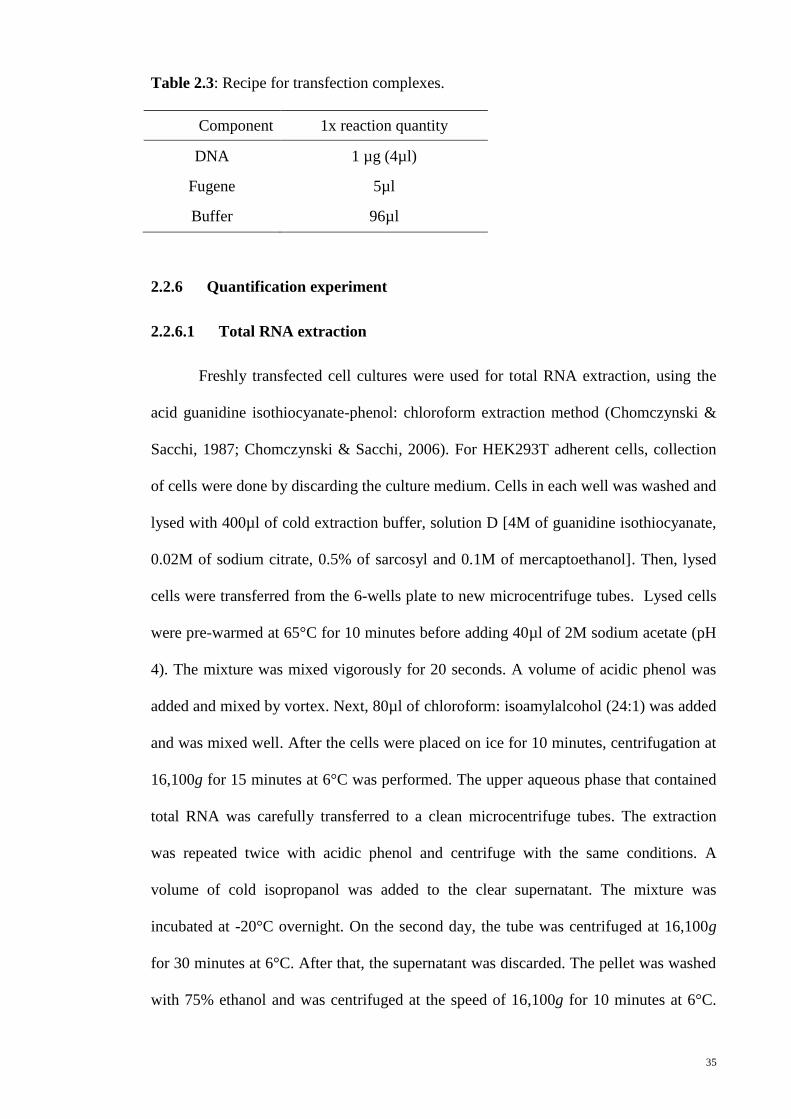
Table 2.3: Recipe for transfection complexes.
Component 1x reaction quantity
DNA 1 µg (4µl)
Fugene 5µl
Buffer 96µl
2.2.6 Quantification experiment
2.2.6.1 Total RNA extraction
Freshly transfected cell cultures were used for total RNA extraction, using the
acid guanidine isothiocyanate-phenol: chloroform extraction method (Chomczynski &
Sacchi, 1987; Chomczynski & Sacchi, 2006). For HEK293T adherent cells, collection
of cells were done by discarding the culture medium. Cells in each well was washed and
lysed with 400µl of cold extraction buffer, solution D [4M of guanidine isothiocyanate,
0.02M of sodium citrate, 0.5% of sarcosyl and 0.1M of mercaptoethanol]. Then, lysed
cells were transferred from the 6-wells plate to new microcentrifuge tubes. Lysed cells
were pre-warmed at 65°C for 10 minutes before adding 40µl of 2M sodium acetate (pH
4). The mixture was mixed vigorously for 20 seconds. A volume of acidic phenol was
added and mixed by vortex. Next, 80µl of chloroform: isoamylalcohol (24:1) was added
and was mixed well. After the cells were placed on ice for 10 minutes, centrifugation at
16,100g for 15 minutes at 6°C was performed. The upper aqueous phase that contained
total RNA was carefully transferred to a clean microcentrifuge tubes. The extraction
was repeated twice with acidic phenol and centrifuge with the same conditions. A
volume of cold isopropanol was added to the clear supernatant. The mixture was
incubated at -20°C overnight. On the second day, the tube was centrifuged at 16,100g
for 30 minutes at 6°C. After that, the supernatant was discarded. The pellet was washed
with 75% ethanol and was centrifuged at the speed of 16,100g for 10 minutes at 6°C.

36
This washing step was repeated twice. The cell pellet was allowed to air-dry for 10-15
minutes. Finally the pellet was re-suspended in 40µl of DEPC-treated water and was
kept at – 2°C.
Later, the total RNA quality was checked on 1% agarose gel and by NanoDrop
spectrophotometer. Values from UV absorbance at 260nm were used to access RNA
quantity. The determined absorbance values at 260nm (A260) values were multiplied
with the dilution factor and then RNA concentration (µg/ml) can be calculated by
equations.
Total RNA = 40 X A260 value
The ratio of the absorbance at 260nm / absorbance at 280nm indicates the purity of
RNA sample. The acceptable range is from 1.9 to 2.1.
2.2.6.2 DNase treatment
All extracted total RNA was treated with 1µl of DNase buffer and 1µl of DNase
enzyme to remove contaminating genomic DNA. Treated RNA was placed in room
temperature for 15 minutes and at 65°C for 20 minutes after adding 1µl of EDTA to
stop DNase activity.
2.2.6.3 cDNA synthesis
(a) cDNA for SYBR Green Real Time PCR
Single stranded cDNA was synthesized from DNase treated total RNA by using High
Capacity cDNA Reverse Transcription Kits (Applied Biosystems). This single stranded
cDNA was used as the template to study the expression level of pri-miRNA and pre-
miRNA. A volume of 2 µl of reverse transcription (RT) reaction that contained 1 X RT
Buffer, 4mM of 25 X dNTP mix, 1 X RT random primers and 2.5U of MultiScribeTM

37
Reverse Transcriptase was prepared. The reverse transcription mixture was mixed well
with 2µg of RNA. A thermal cycler was used to perform reverse transcription with the
conditions of 1 cycle of incubation at 25°C for 10 minutes, reverse transcription at 37°C
for 120 minutes and denaturation of double stranded RNA at 85°C for 5 minutes.
(b) cDNA for Taqman Real Time PCR
To study mature miRNAs that have only about 18-28nt, TaqMan® MicroRNA Reverse
Transcription Kit (Applied Biosystems) that uses specific miRNA primers (looped RT
primer) was used to synthesis cDNA. This single stranded cDNA is reverse transcribed
from the DNAse treated total RNA. Reverse transcription reaction was prepared in a
total volume of 15µl that consists of 1 X RT buffer, 1mM dNTP mix, 0.25U RNase
inhibitor, 3.33U of MultiScribeTM
Reverse Transcriptase and 3µl of 5 X TaqMan®
MicroRNA RT primer (Figure 2-5). The input amount of small RNA was 10ng per 15µl
RT reaction. Reverse transcription was run with thermal cycler by holding incubation at
16°C for 30 minutes, reverse transcription at 42°C for 30 minutes and denaturation of
double stranded RNA at 85°C for 5 minutes. All the newly synthesized cDNAs were
kept at 4°C for short term storage or at -20°C for long term storage.
Figure 2-5: Reverse transcription of short single stranded mature miRNA using specific
looped RT primer manufactured by Applied Biosystems.
(Figure from http://www3.appliedbiosystems.com/cms/groups/mcb_support/document
/generaldocument/cms_042167.pdf)
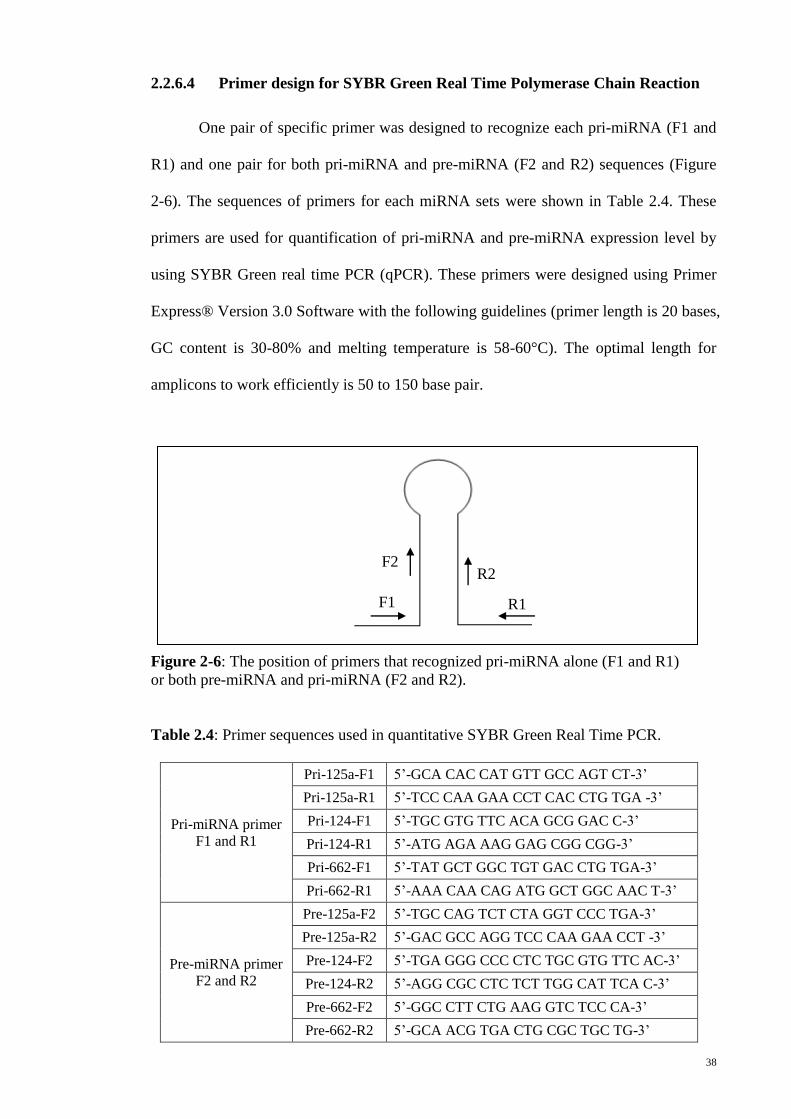
38
2.2.6.4 Primer design for SYBR Green Real Time Polymerase Chain Reaction
One pair of specific primer was designed to recognize each pri-miRNA (F1 and
R1) and one pair for both pri-miRNA and pre-miRNA (F2 and R2) sequences (Figure
2-6). The sequences of primers for each miRNA sets were shown in Table 2.4. These
primers are used for quantification of pri-miRNA and pre-miRNA expression level by
using SYBR Green real time PCR (qPCR). These primers were designed using Primer
Express® Version 3.0 Software with the following guidelines (primer length is 20 bases,
GC content is 30-80% and melting temperature is 58-60°C). The optimal length for
amplicons to work efficiently is 50 to 150 base pair.
Figure 2-6: The position of primers that recognized pri-miRNA alone (F1 and R1)
or both pre-miRNA and pri-miRNA (F2 and R2).
Table 2.4: Primer sequences used in quantitative SYBR Green Real Time PCR.
Pri-miRNA primer
F1 and R1
Pri-125a-F1 5’-GCA CAC CAT GTT GCC AGT CT-3’
Pri-125a-R1 5’-TCC CAA GAA CCT CAC CTG TGA -3’
Pri-124-F1 5’-TGC GTG TTC ACA GCG GAC C-3’
Pri-124-R1 5’-ATG AGA AAG GAG CGG CGG-3’
Pri-662-F1 5’-TAT GCT GGC TGT GAC CTG TGA-3’
Pri-662-R1 5’-AAA CAA CAG ATG GCT GGC AAC T-3’
Pre-miRNA primer
F2 and R2
Pre-125a-F2 5’-TGC CAG TCT CTA GGT CCC TGA-3’
Pre-125a-R2 5’-GAC GCC AGG TCC CAA GAA CCT -3’
Pre-124-F2 5’-TGA GGG CCC CTC TGC GTG TTC AC-3’
Pre-124-R2 5’-AGG CGC CTC TCT TGG CAT TCA C-3’
Pre-662-F2 5’-GGC CTT CTG AAG GTC TCC CA-3’
Pre-662-R2 5’-GCA ACG TGA CTG CGC TGC TG-3’
F2 R2
F1 R1
39
2.2.6.5 SYBR Green Real Time PCR of pri-miRNA and pre-miRNA
Wild-type allele and variant allele of pri-miRNA or/and pre-miRNA expression
level were quantified using Power SYBR® Green PCR master mix (Applied
Biosystems). Before quantifying the expression level of pri-miRNA and pre-miRNA,
primer specificity and efficiency were checked by performing a serial dilution followed
by a standard curve generated by real time PCR machine, ABI 7500 PCR system,
(Applied Biosystems). Efficiency of gene-specific primers was calculated using the
formula: E = 10 -1/slope - 126, where slope refers to the slope of the standard curve.
Gene-specific primers that showed a single peak of dissociation curve were used to
perform quantitative of real time PCR.
The amplification reactions were performed in a 12.5µl reaction that contained
1X of Power SYBR Green PCR Master Mix (2X) and 50nM of forward and reverse
primers (F1 and R1 for pri-miRNA; F2 and R2 for pre-miRNA). The template used was
cDNA (60ng/µl) transcribed from HEK 293T cells. ABI 7500 PCR system, 9600
emulation mode, was used to preform SYBR Green Real Time PCR with the conditions
of 1 cycle of UNG incubation at 50°C for 2 minutes, polymerase activation at 95°C for
10 minutes and 40 cycles of denaturation at 95°C for 15 seconds and annealing or
extension at 60°C for 1 minutes. The thermal denaturation step was run to determine the
number of products that were present in the reaction. All reactions were run in
triplicates, including no template control and internal control. GAPDH and beta-actin
genes were the two internal controls used in SYBR Green real time PCR. Three
technical repeats were performed to confirm the result consistency. The cycle number at
which the reaction crossed an arbitrarily placed threshold (CT) was determined for each
gene. The relative amount of each pri-miRNA or pre-miRNA to internal controls was
40
obtained by using the equation 2-∆∆CT
method. The relative gene expression was
transformed to Log10 in order to simplify the presentation of data.
2.2.6.6 TaqMan miRNA Real Time PCR of mature miRNA
Real Time quantitative PCR was performed according to the standard protocols
of ABI 7500 system, standard mode (Applied Biosystems). TaqMan® microRNA
assays (Applied Biosystems) was used to quantify mature miRNA expression level.
Each individual RT reaction has a unique set of PCR primers and TaqMan probe
designed for it. Custom made TaqMan Gene Expression Assay was designed for the
mature miRNA variant, since the probe is specific. A volume of 12.5µl final reaction
was prepared by adding 1 X TaqMan® Fast Advanced Master Mix (2X) and 1 X of
TaqMan or Custom TaqMan Gene Expression Assay (20X). Approximately 200 ng/µl
of single stranded cDNA of mature miRNA was used. The thermal-cycling profile was
performed at 1 cycle of UNG incubation at 50°C for 2 minutes, polymerase activation at
95°C for 20 seconds and 40 cycles of denaturation at 95°C for 3 seconds and annealing
or extension at 60°C for 32 seconds. The real time PCR reactions were performed in
triplicates. RNU44 and miRNA-16 were used as the internal control in this TaqMan
miRNA real time PCR. Three technical repeats were performed. The relative amount of
each mature miRNA to internal controls was obtained by using the equation 2-∆∆ CT
method. The relative gene expression was transformed to Log10 in order to simplify the
presentation of data. Student’s paired two-tailed T-test was used to calculate the
significant differences of miRNA expression.
delta CT (∆ CT) = CT miRNA - CT internal control or endogenous control
delta delta CT (∆∆ CT) = ∆ CT miRNA - ∆ CT empty vector
Relative Quantification = 2-∆∆ CT
41
CHAPTER 3 RESULTS
3.1 BLAT search for single nucleotide variation within seed region sequence of
mature miRNAs
From the BLAT search of 1048 pre-miRNAs and their 1344 mature miRNAs
sequences, a total of 453 single nucleotide variants were found in 299 pre-miRNAs and
151 single nucleotide variant were found in 127 mature miRNAs of Homo sapiens.
From these 151 single nucleotide variant on mature miRNAs, 42 were found on the seed
region of 36 mature miRNAs (miRBase 12.0 - miRBase14.0), as shown in Table 3.1.
This is because few sets of single nucleotide variant matched to the same mature
miRNA sequence. Among these 42 single nucleotide variant, 12 single nucleotide
variant on seed region of mature miRNAs (miRBase 16.0) were not available during the
selection of candidation miRNAs for functional study. They are miR-3117, miR-3118-2,
miR-3118-3, miR-3124, miR-3128, miR-3161, miR-3618, miR-3689b, miR-3910-2, miR-3939,
miR-4257 and miR-4293.

42
Table 3.1: Potential single nucleotide variant within seed region sequence of mature miRNAs by homology search (BLAT result)
miRNA Mature miRNA Sequence SNP ID Position Strand Allele
hsa-mir-122 MI0000442 5’-TGGAGTGTGACAATGGTGTTTG-3’
5’-AACGCCATTATCACACTAAATA-3’ (*) rs41292412 chr18:56118358-56118358 + C/T
hsa-mir-124-3 MI0000445 5’-CGTGTTCACAGCGGACCTTGAT-3’
5’-TAAGGCACGCGGTGAATGCC-3’ (*) rs34059726 chr20:61809907-61809907 + G/T
hsa-mir-125a MI0000469 5’-TCCCTGAGACCCTTTAACCTGTGA-3’
5’-ACAGGTGAGGTTCTTGGGAGCC-3’ (*) rs12975333 chr19:56888340-56888340 + G/T
hsa-mir-146a MI0000477 5’-TGAGAACTGAATTCCATGGGTT-3’
5’-CCTCTGAAATTCAGTTCTTCAG-3’ (*) rs2910164 chr5:159844996-159844996 + C/G
hsa-mir-221 MI0000298 5’-ACCTGGCATACAATGTAGATTT-3’
5’-AGCTACATTGTCTGCTGGGTTT-3’ (*) rs113054794 chrX:45605666-45605666 + A/C
hsa-mir-379 MI0000787 5’-TGGTAGACTATGGAACGTAGG-3’
5’-TATGTAACATGGTCCACTAACT-3’ (*) rs61991156 chr14:101488414-101488414 + A/G
hsa-mir-431 MI0001721 5’-TGTCTTGCAGGCCGTCATGCA-3’
5’-CAGGTCGTCTTGCAGGGCTTCT-3’ (*) rs12884005 chr14:101347408-101347408 + A/G
hsa-mir-449c MI0003823 5’-TAGGCAGTGTATTGCTAGCGGCTGT-3’
5’-TTGCTAGTTGCACTCCTCTCTGT-3’ (*) rs35770269 chr5:54468124-54468124 + A/T
hsa-mir-499 MI0003183 5’-TTAAGACTTGCAGTGATGTTT-3’
5’-AACATCACAGCAAGTCTGTGCT-3’ (*) rs3746444 chr20:33578251-33578251 - C/T
hsa-mir-513a-1 MI0003191 5’-TTCACAGGGAGGTGTCAT-3’
5’-TAAATTTCACCTTTCTGAGAAGG-3’ (*) rs35027589 chrX:146295068-146295067 - -/C
hsa-mir-518d MI0003171 5’-CTCTAGAGGGAAGCACTTTCTG-3’
5’-CAAAGCGCTTCCCTTTGGAGC-3’ (*) rs73602910 chr19:54238189-54238189 + A/G
hsa-mir-518e MI0003169
5’-CTCTAGAGGGAAGCGCTTTCTG-3’
5’-AAAGCGCTTCCCTTCAGAG-3’ (*) rs74177813 chr19:54233109-54233109 + -/C
5’-CTCTAGAGGGAAGCGCTTTCTG-3’
5’-AAAGCGCTTCCCTTCAGAG-3’ (*) rs34416818 chr19:54233113-54233112 + -/A
5’-CTCTAGAGGGAAGCGCTTTCTG-3’
5’-AAAGCGCTTCCCTTCAGAG-3’ (*) rs74177814 chr19:54233114-54233113 + -/G
hsa-mir-557 MI0003563 5’-GTTTGCACGGGTGGGCCTTGTCT-3’ rs78825966 chr1:168344829-168344829 + C/T
hsa-mir-585 MI0003592 5’-TGGGCGTATCTGTATGCTA-3’ rs62376935 chr5:168690635-168690635 + C/T
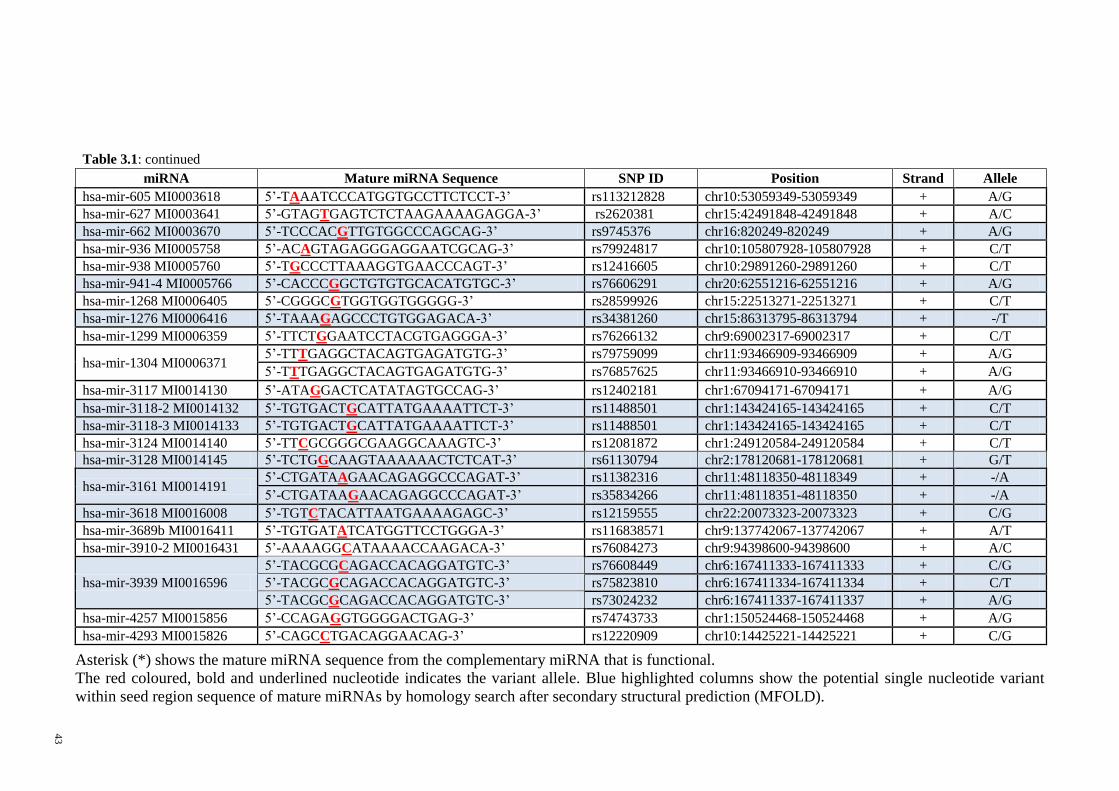
43
Table 3.1: continued
miRNA Mature miRNA Sequence SNP ID Position Strand Allele
hsa-mir-605 MI0003618 5’-TAAATCCCATGGTGCCTTCTCCT-3’ rs113212828 chr10:53059349-53059349 + A/G
hsa-mir-627 MI0003641 5’-GTAGTGAGTCTCTAAGAAAAGAGGA-3’ rs2620381 chr15:42491848-42491848 + A/C
hsa-mir-662 MI0003670 5’-TCCCACGTTGTGGCCCAGCAG-3’ rs9745376 chr16:820249-820249 + A/G
hsa-mir-936 MI0005758 5’-ACAGTAGAGGGAGGAATCGCAG-3’ rs79924817 chr10:105807928-105807928 + C/T
hsa-mir-938 MI0005760 5’-TGCCCTTAAAGGTGAACCCAGT-3’ rs12416605 chr10:29891260-29891260 + C/T
hsa-mir-941-4 MI0005766 5’-CACCCGGCTGTGTGCACATGTGC-3’ rs76606291 chr20:62551216-62551216 + A/G
hsa-mir-1268 MI0006405 5’-CGGGCGTGGTGGTGGGGG-3’ rs28599926 chr15:22513271-22513271 + C/T
hsa-mir-1276 MI0006416 5’-TAAAGAGCCCTGTGGAGACA-3’ rs34381260 chr15:86313795-86313794 + -/T
hsa-mir-1299 MI0006359 5’-TTCTGGAATCCTACGTGAGGGA-3’ rs76266132 chr9:69002317-69002317 + C/T
hsa-mir-1304 MI0006371 5’-TTTGAGGCTACAGTGAGATGTG-3’ rs79759099 chr11:93466909-93466909 + A/G
5’-TTTGAGGCTACAGTGAGATGTG-3’ rs76857625 chr11:93466910-93466910 + A/G
hsa-mir-3117 MI0014130 5’-ATAGGACTCATATAGTGCCAG-3’ rs12402181 chr1:67094171-67094171 + A/G
hsa-mir-3118-2 MI0014132 5’-TGTGACTGCATTATGAAAATTCT-3’ rs11488501 chr1:143424165-143424165 + C/T
hsa-mir-3118-3 MI0014133 5’-TGTGACTGCATTATGAAAATTCT-3’ rs11488501 chr1:143424165-143424165 + C/T
hsa-mir-3124 MI0014140 5’-TTCGCGGGCGAAGGCAAAGTC-3’ rs12081872 chr1:249120584-249120584 + C/T
hsa-mir-3128 MI0014145 5’-TCTGGCAAGTAAAAAACTCTCAT-3’ rs61130794 chr2:178120681-178120681 + G/T
hsa-mir-3161 MI0014191 5’-CTGATAAGAACAGAGGCCCAGAT-3’ rs11382316 chr11:48118350-48118349 + -/A
5’-CTGATAAGAACAGAGGCCCAGAT-3’ rs35834266 chr11:48118351-48118350 + -/A
hsa-mir-3618 MI0016008 5’-TGTCTACATTAATGAAAAGAGC-3’ rs12159555 chr22:20073323-20073323 + C/G
hsa-mir-3689b MI0016411 5’-TGTGATATCATGGTTCCTGGGA-3’ rs116838571 chr9:137742067-137742067 + A/T
hsa-mir-3910-2 MI0016431 5’-AAAAGGCATAAAACCAAGACA-3’ rs76084273 chr9:94398600-94398600 + A/C
hsa-mir-3939 MI0016596
5’-TACGCGCAGACCACAGGATGTC-3’ rs76608449 chr6:167411333-167411333 + C/G
5’-TACGCGCAGACCACAGGATGTC-3’ rs75823810 chr6:167411334-167411334 + C/T
5’-TACGCGCAGACCACAGGATGTC-3’ rs73024232 chr6:167411337-167411337 + A/G
hsa-mir-4257 MI0015856 5’-CCAGAGGTGGGGACTGAG-3’ rs74743733 chr1:150524468-150524468 + A/G
hsa-mir-4293 MI0015826 5’-CAGCCTGACAGGAACAG-3’ rs12220909 chr10:14425221-14425221 + C/G
Asterisk (*) shows the mature miRNA sequence from the complementary miRNA that is functional.
The red coloured, bold and underlined nucleotide indicates the variant allele. Blue highlighted columns show the potential single nucleotide variant
within seed region sequence of mature miRNAs by homology search after secondary structural prediction (MFOLD).
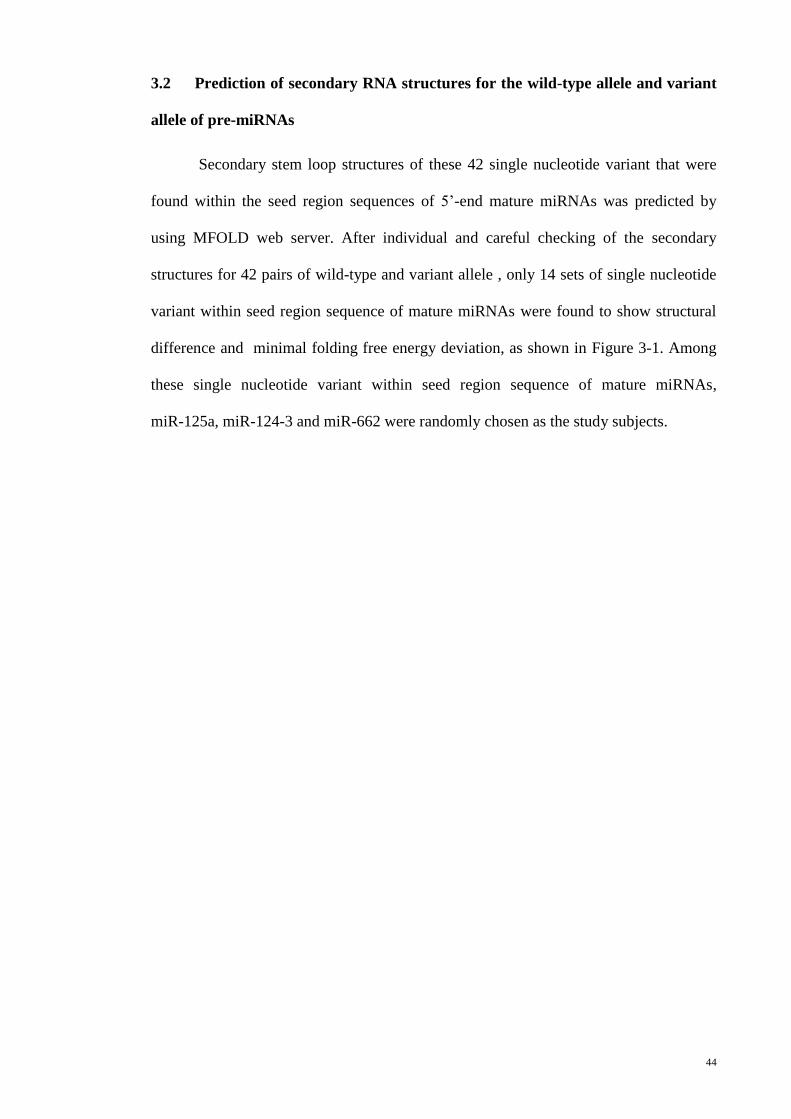
44
3.2 Prediction of secondary RNA structures for the wild-type allele and variant
allele of pre-miRNAs
Secondary stem loop structures of these 42 single nucleotide variant that were
found within the seed region sequences of 5’-end mature miRNAs was predicted by
using MFOLD web server. After individual and careful checking of the secondary
structures for 42 pairs of wild-type and variant allele , only 14 sets of single nucleotide
variant within seed region sequence of mature miRNAs were found to show structural
difference and minimal folding free energy deviation, as shown in Figure 3-1. Among
these single nucleotide variant within seed region sequence of mature miRNAs,
miR-125a, miR-124-3 and miR-662 were randomly chosen as the study subjects.

45
miR-124-3 miR-124-3 mutant miR-125a miR-125a mutant
SNP ID: rs34059726 SNP ID: rs12975333
Figure 3-1: Secondary structures of the wild type allele and variant allele pre-miRNAs
as predicted by MFOLD.
The mature miRNA sequences were shadowed and the black circle indicates the variant
allele. Minimal folding free energies (dG) calculated by MFOLD were indicated.

46
miR-662 miR-662 mutant
SNP ID: rs9745376
Figure 3.1 (continued)
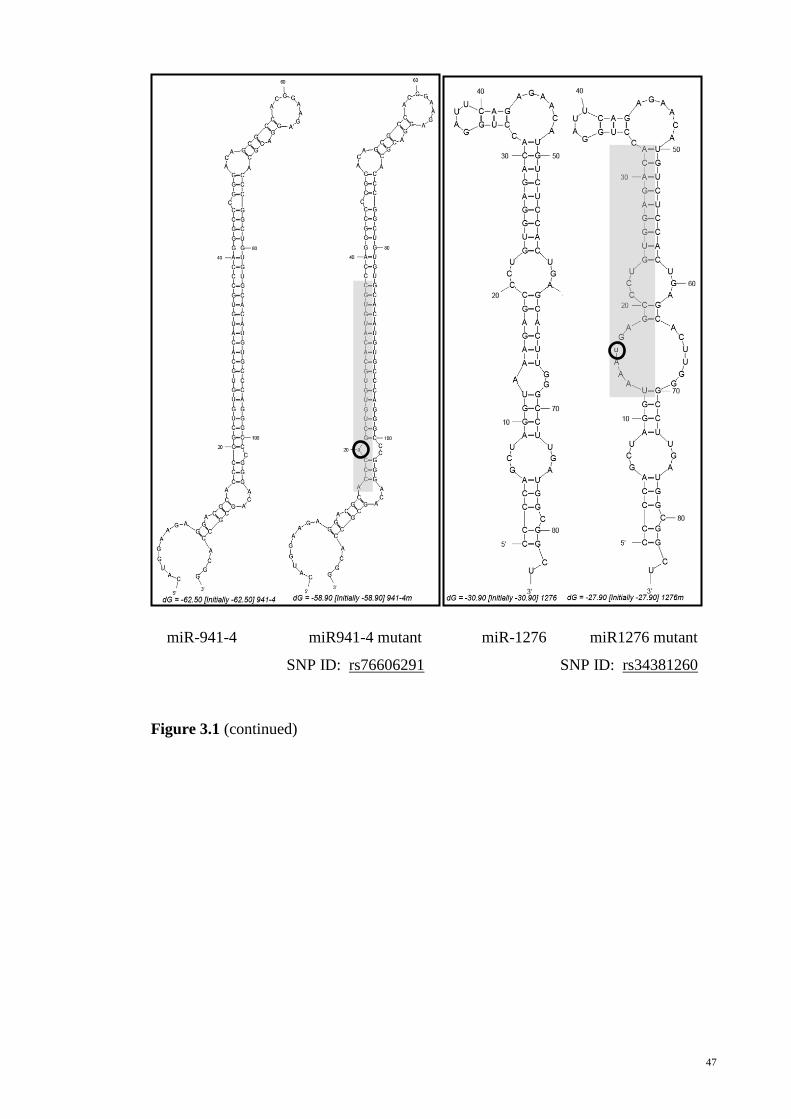
47
miR-941-4 miR941-4 mutant miR-1276 miR1276 mutant
SNP ID: rs76606291 SNP ID: rs34381260
Figure 3.1 (continued)
48
miR-3118-2 miR-3118-2 mutant miR-3118-3 miR-3118-3 mutant
SNP ID: rs11488501 SNP ID: rs11488501
Figure 3.1 (continued)
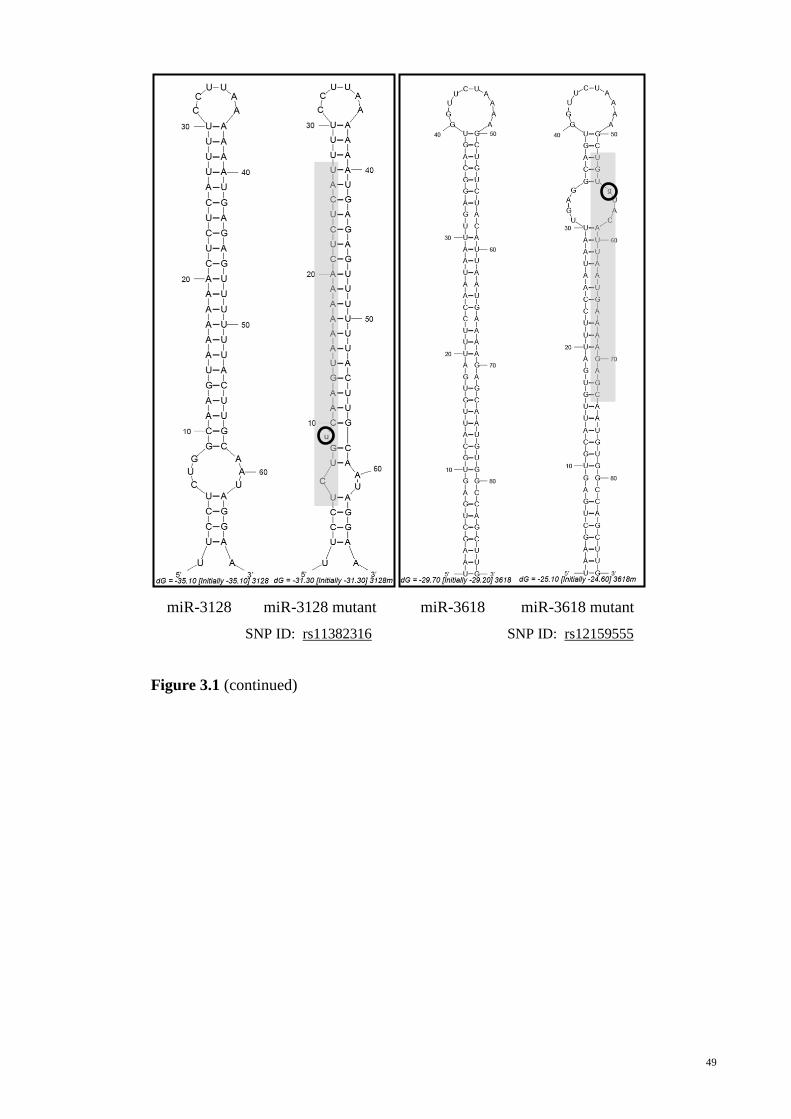
49
miR-3128 miR-3128 mutant miR-3618 miR-3618 mutant
SNP ID: rs11382316 SNP ID: rs12159555
Figure 3.1 (continued)

50
miR-3161 miR-3161 mutant 1 miR-3161 mutant 2
SNP ID: rs61130794 SNP ID: rs35834266
Figure 3.1 (continued)
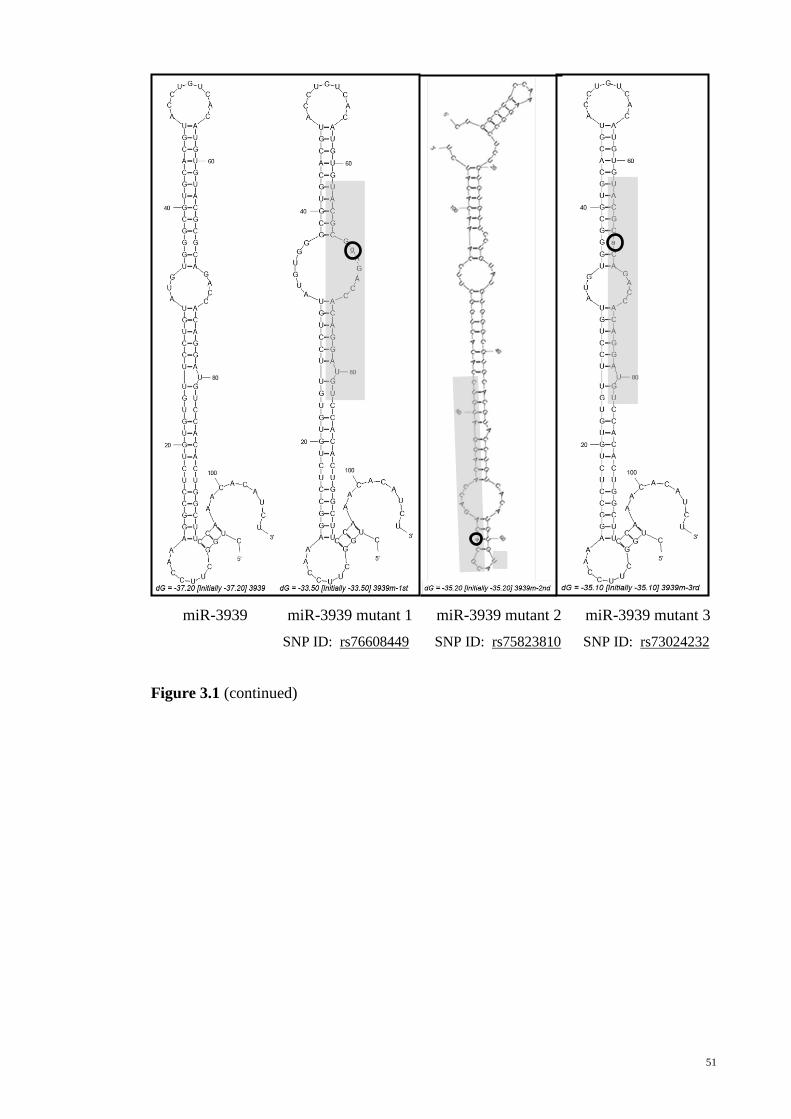
51
miR-3939 miR-3939 mutant 1 miR-3939 mutant 2 miR-3939 mutant 3
SNP ID: rs76608449 SNP ID: rs75823810 SNP ID: rs73024232
Figure 3.1 (continued)
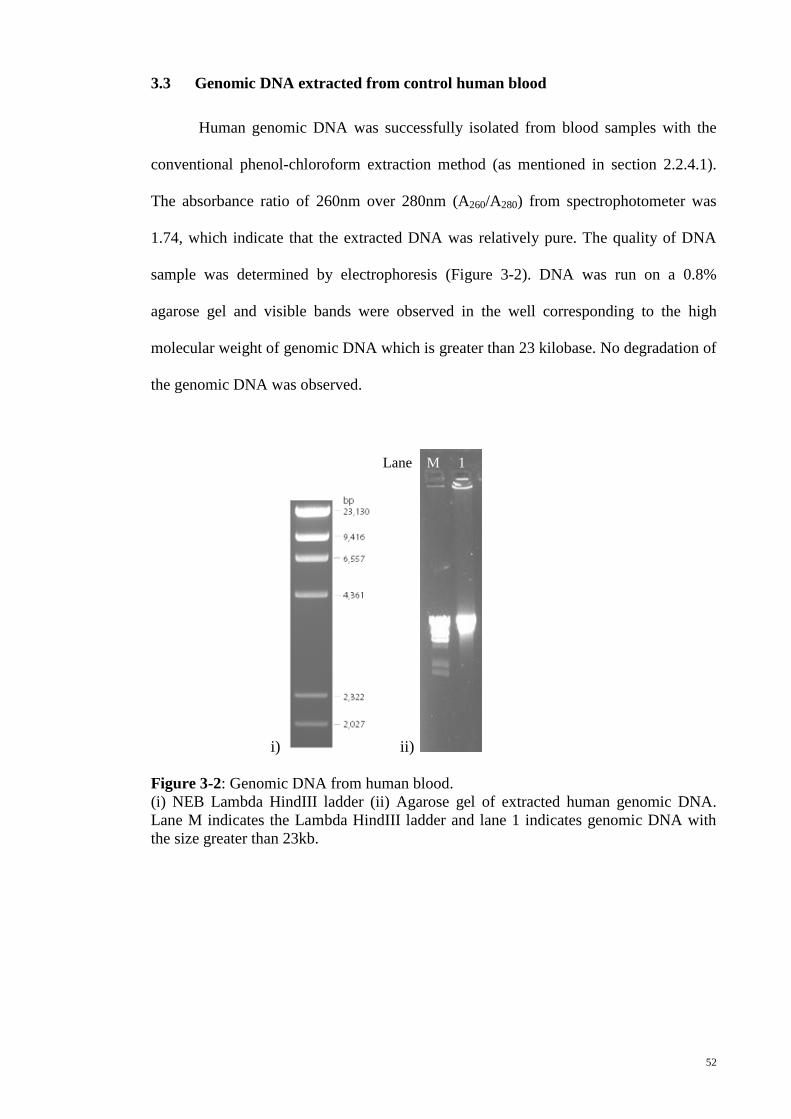
52
3.3 Genomic DNA extracted from control human blood
Human genomic DNA was successfully isolated from blood samples with the
conventional phenol-chloroform extraction method (as mentioned in section 2.2.4.1).
The absorbance ratio of 260nm over 280nm (A260/A280) from spectrophotometer was
1.74, which indicate that the extracted DNA was relatively pure. The quality of DNA
sample was determined by electrophoresis (Figure 3-2). DNA was run on a 0.8%
agarose gel and visible bands were observed in the well corresponding to the high
molecular weight of genomic DNA which is greater than 23 kilobase. No degradation of
the genomic DNA was observed.
i) ii)
Figure 3-2: Genomic DNA from human blood.
(i) NEB Lambda HindIII ladder (ii) Agarose gel of extracted human genomic DNA.
Lane M indicates the Lambda HindIII ladder and lane 1 indicates genomic DNA with
the size greater than 23kb.
Lane M 1

53
3.4 Polymerase Chain Reaction of wild type allele of pri- microRNAs
In order to generate the wild-type allele of the pri-miRNAs studied, the wild-
type alleles (miR-125a, miR-124-3 and miR-662) were amplified from normal human
genomic DNA by PCR. The PCR product was further purified using Gel extraction kit.
Purified wild type allele of pri-miRNA bands were run on 1.5% agarose gel and visible
bands were observed (Figure 3-3). Only one significant band with expected fragment
size (between 400bp and 500bp) was seen from each PCR reaction, showing that the
primers were specific enough to amplify wild-type pri-miRNA.
i) ii)
Figure 3-3: PCR of wild type pri-miRNA fragment.
(i) Vivantis 100 bp plus DNA ladder (ii) Purified PCR products of pri-miRNA with
specific primers. Lane M is the 100 bp plus ladder lane 1 is pri-miR-125a (459 bp), lane
2 is pri-miR-124-3 (399 bp) and lane 3 is pri-miR-662 (424 bp).
500 bp
400 bp
Lane M 1 2 3 M
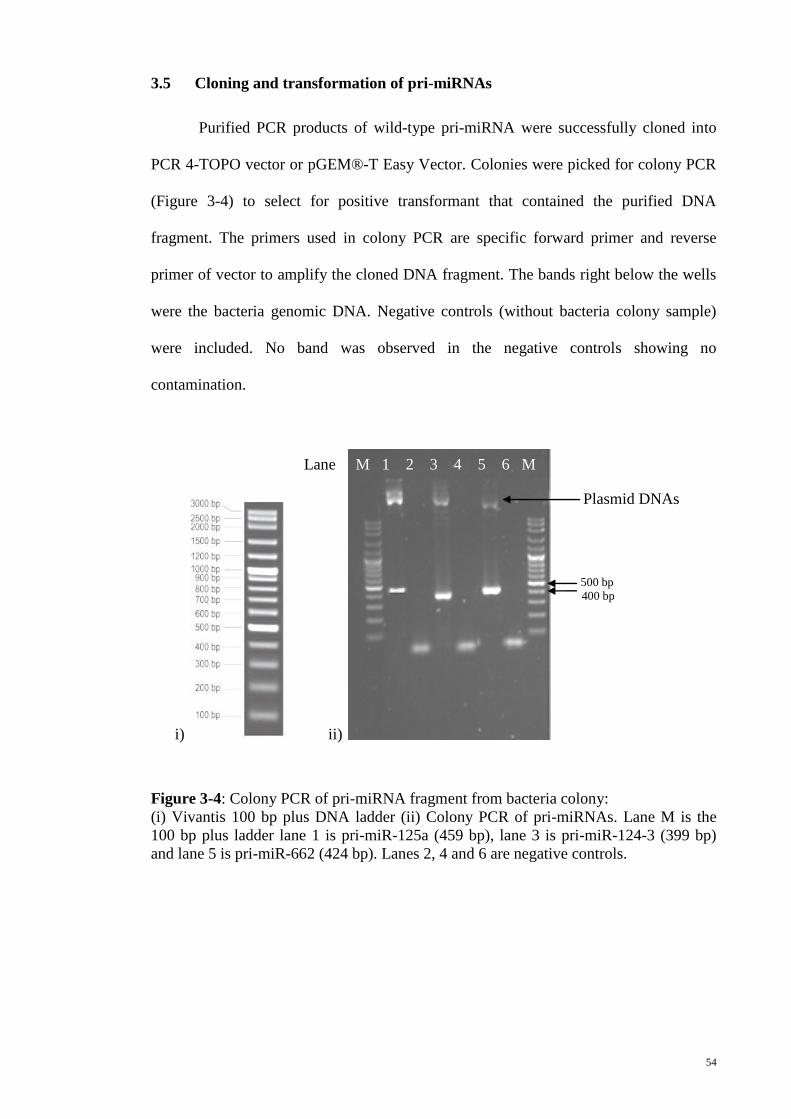
54
3.5 Cloning and transformation of pri-miRNAs
Purified PCR products of wild-type pri-miRNA were successfully cloned into
PCR 4-TOPO vector or pGEM®-T Easy Vector. Colonies were picked for colony PCR
(Figure 3-4) to select for positive transformant that contained the purified DNA
fragment. The primers used in colony PCR are specific forward primer and reverse
primer of vector to amplify the cloned DNA fragment. The bands right below the wells
were the bacteria genomic DNA. Negative controls (without bacteria colony sample)
were included. No band was observed in the negative controls showing no
contamination.
i) ii)
Figure 3-4: Colony PCR of pri-miRNA fragment from bacteria colony:
(i) Vivantis 100 bp plus DNA ladder (ii) Colony PCR of pri-miRNAs. Lane M is the
100 bp plus ladder lane 1 is pri-miR-125a (459 bp), lane 3 is pri-miR-124-3 (399 bp)
and lane 5 is pri-miR-662 (424 bp). Lanes 2, 4 and 6 are negative controls.
500 bp
400 bp
Plasmid DNAs
Lane M 1 2 3 4 5 6 M
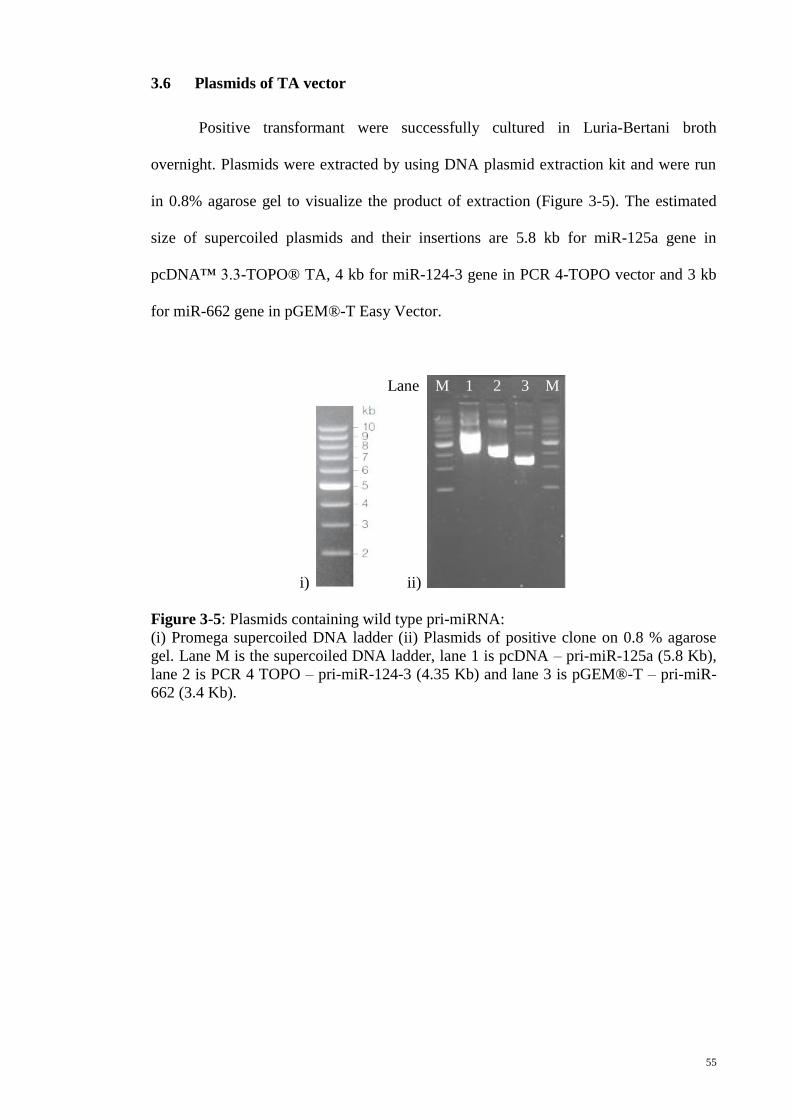
55
3.6 Plasmids of TA vector
Positive transformant were successfully cultured in Luria-Bertani broth
overnight. Plasmids were extracted by using DNA plasmid extraction kit and were run
in 0.8% agarose gel to visualize the product of extraction (Figure 3-5). The estimated
size of supercoiled plasmids and their insertions are 5.8 kb for miR-125a gene in
pcDNA™ 3.3-TOPO® TA, 4 kb for miR-124-3 gene in PCR 4-TOPO vector and 3 kb
for miR-662 gene in pGEM®-T Easy Vector.
i) ii)
Figure 3-5: Plasmids containing wild type pri-miRNA:
(i) Promega supercoiled DNA ladder (ii) Plasmids of positive clone on 0.8 % agarose
gel. Lane M is the supercoiled DNA ladder, lane 1 is pcDNA – pri-miR-125a (5.8 Kb),
lane 2 is PCR 4 TOPO – pri-miR-124-3 (4.35 Kb) and lane 3 is pGEM®-T – pri-miR-
662 (3.4 Kb).
Lane M 1 2 3 M

56
PCR was performed on the extracted recombinant plasmids (plasmid pri-miR-
125a, plasmid pri-miR124-3 and plasmid pri-miR-662) and the PCR products were
observed through 1.5% agarose gel electrophoresis (Figure 3-6). This was to confirm
successful cloning of wild-type gene of pri-miRNA fragment into the extracted
plasmids. The PCR product showing molecular weight greater than 3kb was the plasmid
DNAs. Only primer dimers were observed in the negative control proving no DNA
contamination in the PCR. Positive transformant were later subjected to sequencing
(Figure 3-15 to Figure 3-17 ).
i) ii)
Figure 3-6: PCR of plasmid pri-miRNA:
(i) Vivantis 100bp plus DNA ladder (ii) PCR of positive transformant on 1.5% agarose
gel. Lane M is the 100bp plus ladder, lane 1 is pri-miR-125a (459 bp), lane 3 is pri-miR-
124-3 (399 bp) and lane 5 is pri-miR-662 (424 bp). Lanes 2, 4 and 6 are negative
controls.
500 bp
400 bp
Plasmid
DNAs
Lane M 1 2 3 4 5 6 M
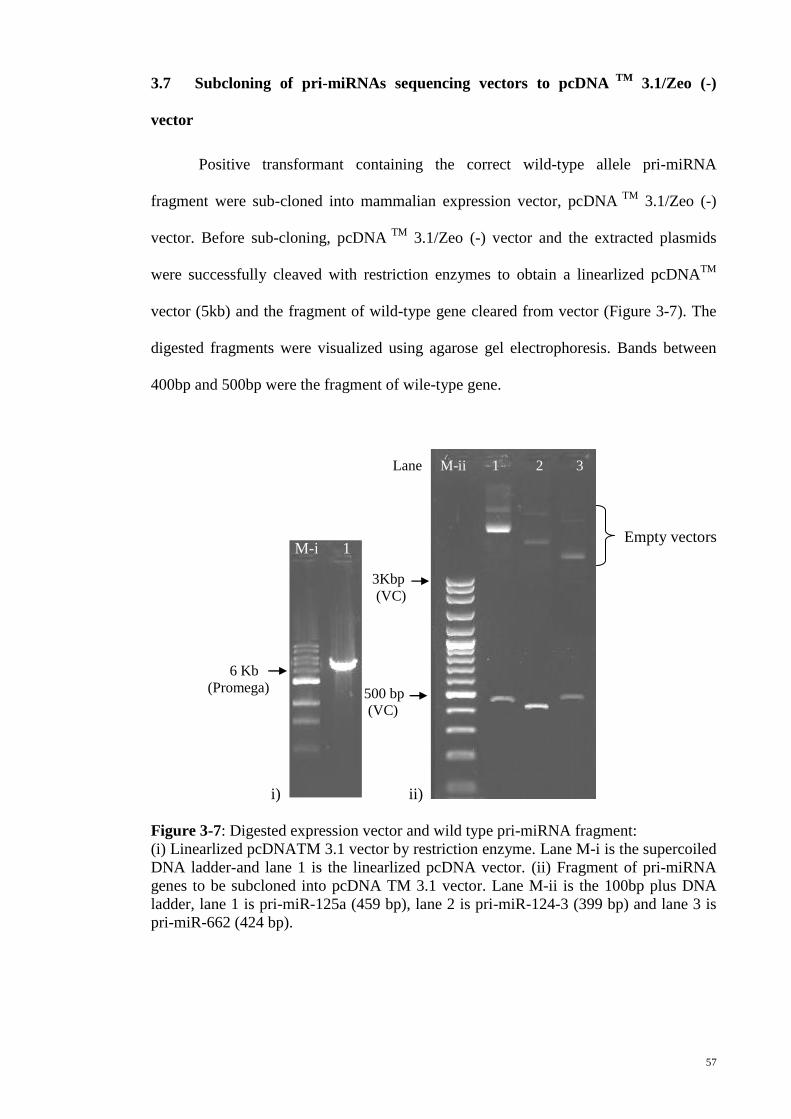
57
3.7 Subcloning of pri-miRNAs sequencing vectors to pcDNA TM
3.1/Zeo (-)
vector
Positive transformant containing the correct wild-type allele pri-miRNA
fragment were sub-cloned into mammalian expression vector, pcDNA TM
3.1/Zeo (-)
vector. Before sub-cloning, pcDNA TM
3.1/Zeo (-) vector and the extracted plasmids
were successfully cleaved with restriction enzymes to obtain a linearlized pcDNATM
vector (5kb) and the fragment of wild-type gene cleared from vector (Figure 3-7). The
digested fragments were visualized using agarose gel electrophoresis. Bands between
400bp and 500bp were the fragment of wile-type gene.
i) ii)
Figure 3-7: Digested expression vector and wild type pri-miRNA fragment:
(i) Linearlized pcDNATM 3.1 vector by restriction enzyme. Lane M-i is the supercoiled
DNA ladder-and lane 1 is the linearlized pcDNA vector. (ii) Fragment of pri-miRNA
genes to be subcloned into pcDNA TM 3.1 vector. Lane M-ii is the 100bp plus DNA
ladder, lane 1 is pri-miR-125a (459 bp), lane 2 is pri-miR-124-3 (399 bp) and lane 3 is
pri-miR-662 (424 bp).
6 Kb
(Promega) 500 bp
(VC)
M-i 1
3Kbp
(VC)
Empty vectors
Lane M-ii 1 2 3
4
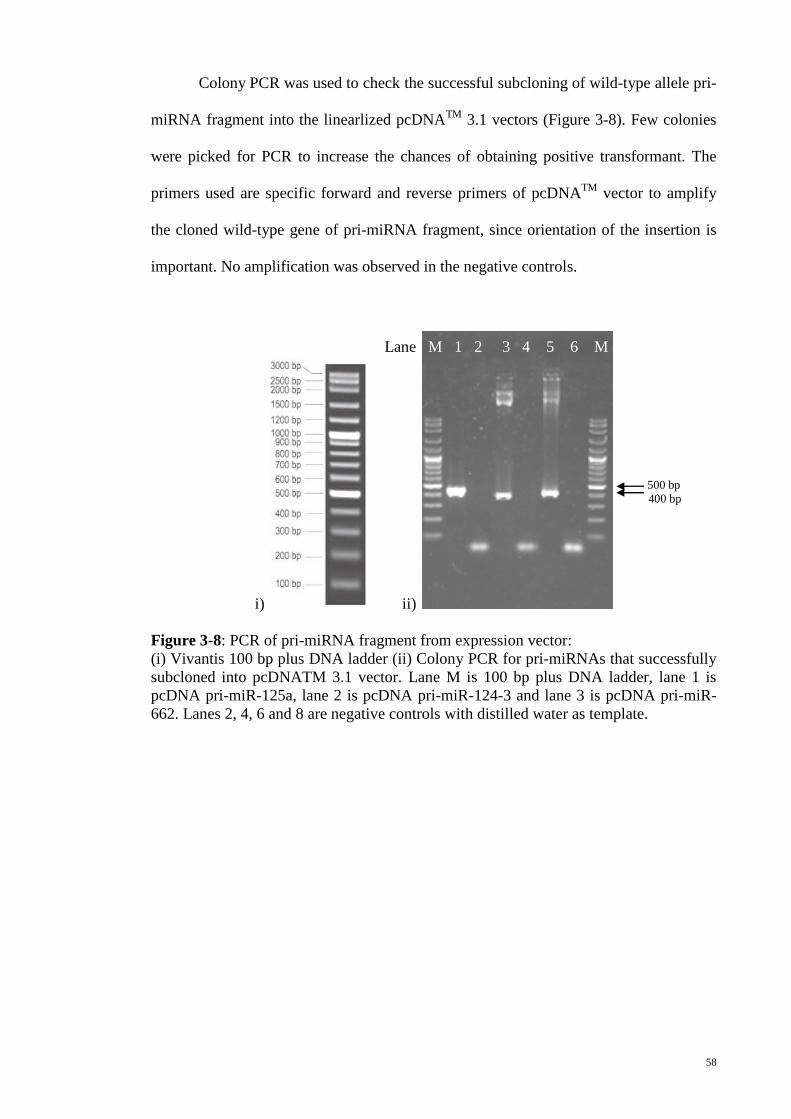
58
Colony PCR was used to check the successful subcloning of wild-type allele pri-
miRNA fragment into the linearlized pcDNATM
3.1 vectors (Figure 3-8). Few colonies
were picked for PCR to increase the chances of obtaining positive transformant. The
primers used are specific forward and reverse primers of pcDNATM
vector to amplify
the cloned wild-type gene of pri-miRNA fragment, since orientation of the insertion is
important. No amplification was observed in the negative controls.
i) ii)
Figure 3-8: PCR of pri-miRNA fragment from expression vector:
(i) Vivantis 100 bp plus DNA ladder (ii) Colony PCR for pri-miRNAs that successfully
subcloned into pcDNATM 3.1 vector. Lane M is 100 bp plus DNA ladder, lane 1 is
pcDNA pri-miR-125a, lane 2 is pcDNA pri-miR-124-3 and lane 3 is pcDNA pri-miR-
662. Lanes 2, 4, 6 and 8 are negative controls with distilled water as template.
500 bp
400 bp
Lane M 1 2 3 4 5 6 M

59
Positive clones identified through colony PCR were cultured in LB broth to
obtain the pcDNATM
3.1 vectors. Plasmids were successfully extracted and were run in
0.8% agarose gel (Figure 3-9). The visible bands showed the expected molecular weight,
corresponding to approximately 5 kb for all two supercoiled plasmids.
i) ii)
Figure 3-9: Plasmid containing wild type pri-miRNA:
(i) Promega supercoiled DNA ladder (ii) Plasmids of positive clone of pri-miRNAs in
pcDNATM 3.1 vector. Lane M is supercoiled DNA ladder, lane 1 is pcDNA pri-miR-
125a, lane 2 is pcDNA pri-miR-124-3 and lane 3 is pcDNA pri-miR-662.
5 kb
Lane M 1 2 3 M

60
PCR was performed by using the extracted pcDNA plasmids as template. This is
to confirm the succession of wild-type allele of pri-miRNA fragment inserted in the
extracted plasmids before subjected for sequencing. Electrophoresis (1.5% of agarose
gel) was run to check the products (Figure 3-10). Only primer dimers were observed in
the negative control proving no DNA contamination in the PCR. Positive transformant
were later subjected to sequencing (Figure 3.14, 3.15 and 3.16).
i) ii)
Figure 3-10: PCR of positive clone of expression vector containing wild type pri-
miRNA:
(i) Vivantis 100 bp plus DNA ladder (ii) PCR for positive clone of wild-type allele pri-
miRNAs in pcDNATM 3.1 vector. Lane M is supercoiled DNA ladder, lane 1 is
pcDNA pri-miR-125a, lane 3 is pcDNA pri-miR-124-3 and lane 5 is pcDNA pri-miR-
662. Lanes 2, 4, 6 and 8 are negative controls with water as template.
500 bp
400 bp
Lane M 1 2 3 4 5 6 M

61
3.8 Mutagenesis of pcDNA pri-miRNAs
Site-directed mutagenesis of the wild-type allele of pri-miRNA fragment in
pcDNATM
3.1 vectors was successfully performed through conventional PCR methods
(as mentioned in 2.2.4.11). The colonies obtained from mutagenesis were checked
through colony PCR for selection of positive transformant. The amplified products
were visualized through 1.5% agarose gel electrophoresis (Figure 3-11). The primers
used were specific forward and reverse primer of pcDNA TM 3.1/Zeo (-) vector to
amplify and check orientation of the cloned mutagenized pri-miRNA fragment.
i) ii)
Figure 3-11: PCR of mutagenized pri-miRNA fragment.
(i) Vivantis 100 bp plus DNA ladder (ii) Colony PCR for pri-miRNAs that treated with
site-directed mutagenesis. Lane M is the 100 bp plus DNA ladder, lane 1 is pcDNA pri-
miR-125aM, lane 3 is pcDNA pri-miR-124-3M, lane 5 is pcDNA pri-miR-662M. Lane
2, 4, 6 and 8 are negative controls.
500 bp
400 bp
Lane M 1 2 3 4 5 6 M

62
Colonies harbouring mutagenized pri-miRNA fragment were cultured in LB
broth. All two supercoiled recombinant plasmids showed a molecular weight of 5kb,
which corresponds to the total size of the mutagenized gene of pri-miRNA and the
pcDNA vector (Figure 3-12).
i) ii)
Figure 3-12: Positive transformant containing mutagenized pri-miRNA:
(i) Promega supercoiled DNA ladder (ii) Plasmids of positive transformant for
mutagenized pri-miRNAs. Lane M is the supercoiled DNA ladder, lane 1 is pcDNA pri-
miR-125aM, lane 2 is pcDNA pri-miR-124-3M and lane 3 is pcDNA pri-miR-662M.
5 kb
Lane M 1 2 3 M

63
Introduction of the mutagenized allele to pcDNA plasmids were amplified and
the PCR products were visualized using 1.5% agarose gel electrophoresis (Figure 3-13).
Primers used are specific forward primer and reverse primer of vector. Plasmids
harbouring the insertions of wild type and mutagenized gene of pri-miRNAs were sent
for sequencing.
i) ii)
Figure 3-13: PCR of mutagenized pri-miRNA fragment:
(i) Vivantis 100 bp plus DNA ladder (ii) PCR of positive plasmids for mutagenized pri-
miRNAs. Lane M is the 100 bp DNA ladder, 1 is pcDNA pri-miR-125aM, lane 2 is
pcDNA pri-miR-124-3M and lane 3 is pcDNA pri-miR-662M. Lane 2, 4, 6 and 8 are
negative controls.
Lane M 1 2 3 4 5 6 M
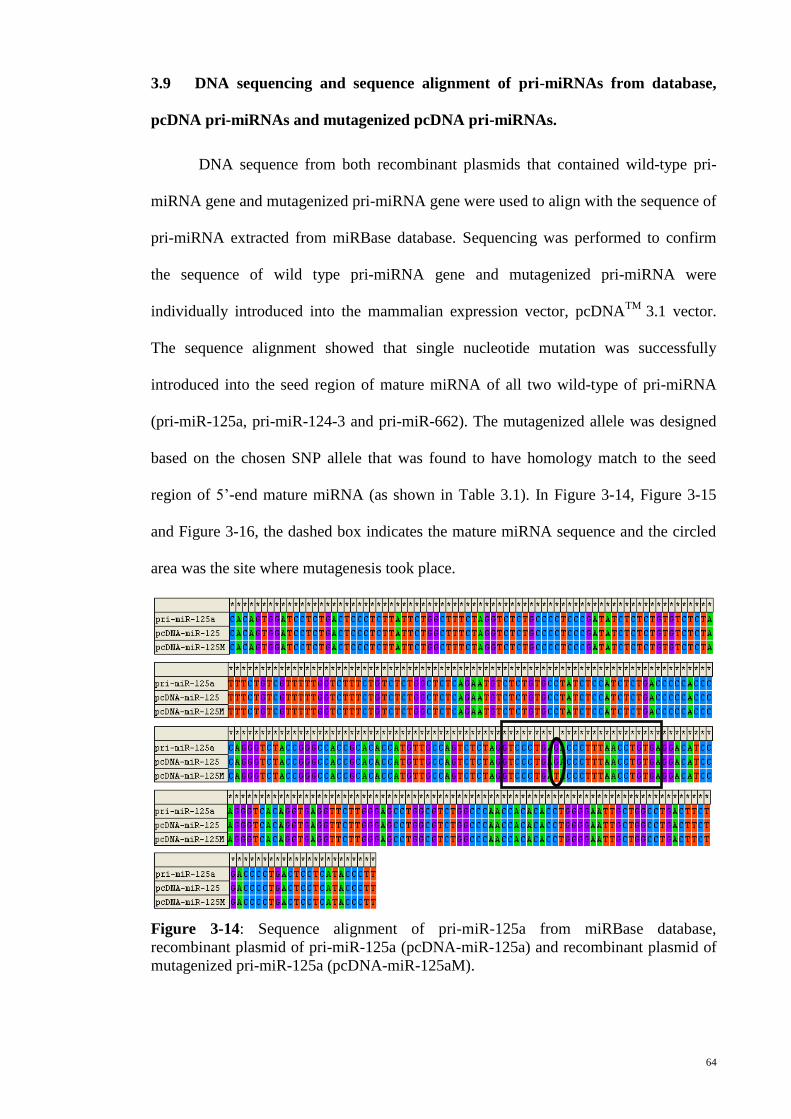
64
3.9 DNA sequencing and sequence alignment of pri-miRNAs from database,
pcDNA pri-miRNAs and mutagenized pcDNA pri-miRNAs.
DNA sequence from both recombinant plasmids that contained wild-type pri-
miRNA gene and mutagenized pri-miRNA gene were used to align with the sequence of
pri-miRNA extracted from miRBase database. Sequencing was performed to confirm
the sequence of wild type pri-miRNA gene and mutagenized pri-miRNA were
individually introduced into the mammalian expression vector, pcDNATM
3.1 vector.
The sequence alignment showed that single nucleotide mutation was successfully
introduced into the seed region of mature miRNA of all two wild-type of pri-miRNA
(pri-miR-125a, pri-miR-124-3 and pri-miR-662). The mutagenized allele was designed
based on the chosen SNP allele that was found to have homology match to the seed
region of 5’-end mature miRNA (as shown in Table 3.1). In Figure 3-14, Figure 3-15
and Figure 3-16, the dashed box indicates the mature miRNA sequence and the circled
area was the site where mutagenesis took place.
Figure 3-14: Sequence alignment of pri-miR-125a from miRBase database,
recombinant plasmid of pri-miR-125a (pcDNA-miR-125a) and recombinant plasmid of
mutagenized pri-miR-125a (pcDNA-miR-125aM).

65
Figure 3-15: Sequence alignment of pri-miR-124-3 from miRBase database,
recombinant plasmid of pri-miR-124-3 (pcDNA-miR-124) and recombinant plasmid of
mutagenized pri-miR-124-3 (pcDNA-miR-124M).
Figure 3-16: Sequence alignment of pri-miR-662 from miRBase database, recombinant
plasmid of pri-miR-662 (pcDNA-miR-662) and recombinant plasmid of mutagenized
pri-miR-662 (pcDNA-miR-662M).

66
3.10 Cell culture
pEGFP vector acted as a control to check the efficiency of transfection. The
pEGFP vector (Clontech, United States) was transfected along with wild-type and
variant of pri-miRNA gene in a six-well plate. The green fluorescence signals emitted
from transfected HEK 293T cells were captured through fluorescent microscope. From
cell count, the rate of transfection was more than 75% after comparing green fluorescent
cells to the total HEK293T cells captured from light microscope. This showed good
transfection efficiency (Figure 3-17).
i)
ii)
Figure 3-17: Transfection rate was checked by comparing on the same spot of cells
under microscope.
(i) HEK 293T cells captured under light microscope and (ii) Green fluorescence cells
that were captured thought fluorescent microscope.

67
3.11 RNA extraction from cell culture
Total RNA was isolated from five transfected HEK 293T cells with the acid
guanidine isothiocyanate-phenol: chloroform (as mentioned in section 2.2.6.1). RNA
samples were visualized on a 1% agarose gel (Figure 3-18) and visible bands were
observed in each well corresponding to expected sizes for ribosomal RNA (rRNA): 18S
and 28S rRNA. The RNA extracted appeared to have good quality and without any sign
of degradation. The A260/A280 ratio from spectrophotometer was approximately 2.0,
which proved that the extracted RNA was clean.
Figure 3-18: Agarose gel of total RNA samples extracted from HEK 293T cells.
Lane 1 is empty vector of pcDNATM
3.1, lane 2 is from wild-type pri-miR-125a pcDNA
plasmid, lane 3 is mutagenized pri-miR-125a pcDNA plasmid, lane 4 is wild-type pri-
miR-124-3 pcDNA plasmid, lane 5 is mutagenized pri-miR-124-3 pcDNA plasmid, lane
6 is wild type pri-miR-662 pcDNA plasmid and lane 7 is mutagenized pri-miR-662
pcDNA plasmid.
28S
18S
1 2 3 4 5 6 7
Small RNAs
68
3.12 Statistical analysis of quantitative real time polymerase chain reaction
(qRTPCR)
3.12.1 TaqMan miRNA assay for mature miRNAs
All two mature miRNA expression levels (miR-125a, miR-124-3 and miR-662)
in transfected HEK 293T cells were quantified by using TaqMan miRNA Assay. This is
because TaqMan miRNA probe has high specificity (Chen et al, 2005). Results
generated from ABI SDS system was analyzed using Microsoft Excel. MicroRNA
expression data is presented as fold difference relative to the mean between RNU44 and
miR-16 based on the following equation: relative quantification, RQ = 2- ∆∆CT
. A two-
dimension column was plotted to illustrate the results.
Mature miRNA expression level was normalized to endogenous controls to
obtain ∆CT values, and the fold difference is relative to the calibrator (empty vector) to
obtain ∆∆CT values. The relative quantification (RQ) of mature miRNA was calculated
by applying to the 2 - ∆∆CT
analyses. RQ value was converted to Log unit to better
represent the data.
Single nucleotide variations within seed region of mature miRNA sequence
showed different expression level compared to the wild-type gene of miRNAs (Figure
3-19). For the positive control (miR-125a) in this study, expression level of
mutagenized allele miR-125a was upregulated 1.7 fold, pt-test = 1.12 x 10⁻¹²
, compared to
the wild-type allele miR-125a. The expression level of mutagenized allele of miR-124-3
and mutagenized allele of miR-662 were both upregulated compared to the wild-type
allele of miR-124-3 and wild type allele of miR-662 respectively. Mutagenized allele of
miR-124-3 was upregulated 2.2 fold, pt-test = 5.16 x 10⁻⁷
, while mutagenized allele of
miR-662 was upregualted 1.9 fold, pt-test = 4.55 x 10⁻⁴
(refer to Apendix).

69
Figure 3-19: Comparision of relative quantification between miR-125a, miR-124-3 and
miR-662.
Relative expression level of mature miR-125a, miR-124-3 and miR-662 normalized to
both RNU44 and miR-16 (endogenous controls). The relative expression levels were
determined by ∆∆CT analyses. Transfection was repeated three times. P t-test < 0.05.
3.12.2 Expression level of mutagenized miRNA gene relative to wild-type
miRNA gene in percentage (%)
The expression level of both wild-type and mutagenized pri-miRNAs and pre-
miRNAs were determined through SYBR Green Real Time PCR by using specific
primers. Pri-miRNA and pre-miRNA expression level were normalized to internal
controls (GAPDH and beta-actin) to obtain ∆CT values and relative to the calibrator
(empty vector) to obtain ∆∆CT values. Relative expression levels of pri-miRNA (PRI),
pri- and pre-miRNA (PRI + PRE) and mature miRNAs (miRNA) were plotted in two-
dimension column. The expression level of miRNA (pri, pri + pre and mature miRNA)
2.278
1.828
0.886
3.988 4.026
1.704
0.00
0.50
1.00
1.50
2.00
2.50
3.00
3.50
4.00
4.50
5.00
miR-125a miR-124 miR-662
Rel
ati
ve
Qu
an
tifi
cati
on
(L
og
10)
Empty Vector (EV)
Wild Type miRNA
Mutant miRNA *
P = 1.12 X 10⁻¹²
*
P = 5.16 X 10⁻⁷
*
P = 4.55 X 10⁻⁴
70
was quantitated by obtaining the ratio between mutagenized miRNA to wild-type
miRNA.
The results showed that the primary transcript of mutagenized miR-125a was
increased by 16% when compared with wild-type miR-125a gene, while mutagenized
pri- and pre-miR125a expression level was increased by 19%. However, mutagenized
mature miR-125a expression level was 75% upregulated when compared to the wild-
type miR-125a gene (Figure 3-20 A).
Chart in Figure 3-20 (B) showed that the expression level of mutagenized pri-
miR-124-3 was increased slightly by 12% compared to the wild-type pri-miR-124-3.
For the expression level of mutagenized pri- and pre-miR-124-3, the chart showed that
approximately 8% of increment after comparison with the wild-type gene. Meanwhile,
the expression of mutagenized miR-124-3 in HEK 293T cells was increased to about
120 % of wild-type miR-124-3.
In Figure 3-20 (C), the expression of mutagenized pri-miR-662 was showed to
be the same as the wild type of pri-miR662, while the expression of mutagenized pri-
and pre-miR-662 was slightly inhibited by 13%. On the other hand, the expression of
mature form of mutagenized miR-662 was improved, 92% that of the wild-type allele of
miR-662.
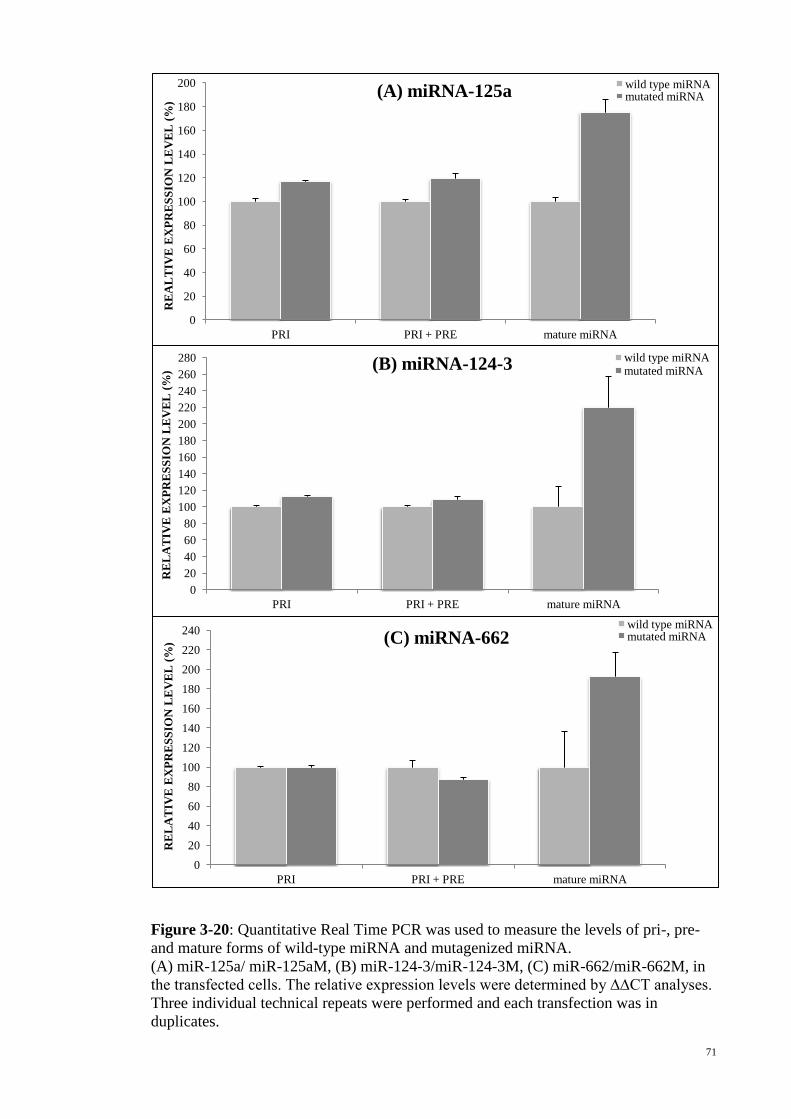
71
Figure 3-20: Quantitative Real Time PCR was used to measure the levels of pri-, pre-
and mature forms of wild-type miRNA and mutagenized miRNA.
(A) miR-125a/ miR-125aM, (B) miR-124-3/miR-124-3M, (C) miR-662/miR-662M, in
the transfected cells. The relative expression levels were determined by ∆∆CT analyses.
Three individual technical repeats were performed and each transfection was in
duplicates.
0
20
40
60
80
100
120
140
160
180
200
PRI PRI + PRE mature miRNA
RE
AL
TIV
E E
XP
RE
SS
ION
LE
VE
L (
%)
(A) miRNA-125a wild type miRNA mutated miRNA
0
20
40
60
80
100
120
140
160
180
200
220
240
260
280
PRI PRI + PRE mature miRNA
RE
LA
TIV
E E
XP
RE
SS
ION
LE
VE
L (
%) (B) miRNA-124-3 wild type miRNA
mutated miRNA
0
20
40
60
80
100
120
140
160
180
200
220
240
PRI PRI + PRE mature miRNA
RE
LA
TIV
E E
XP
RE
SS
ION
LE
VE
L (
%) (C) miRNA-662
wild type miRNA mutated miRNA

72
CHAPTER 4 DISCUSSION
4.1 Features of miRNA function
MicroRNA, a group of small non-coding RNAs is known to play important roles
in biological functions by regulating gene expression through translation inhibition.
MicroRNAs was known to be involved in cell developmental (Ambros, 2004; Kim and
Nam, 2006; Kusenda et al., 2006; Meola et al., 2009), cell proliferation, apoptosis,
progression of human diseases (Lai, 2003; Ambros, 2004; Bartel, 2004; Hammond,
2006; Cho, 2007), determination of timing and maintenance of tissue or cell identity
(Zeng and Cullen, 2003; Ambros, 2004; Bartel, 2004; Zhang et al., 2006) and also in
responding to environmental stresses, immune system, and neurological processes
(Bartel, 2004; Du and Zamore, 2005; Wiemer, 2007; Garofalo et al., 2008; Meola et al.,
2009). Hypothetically, sequence variation within miRNA genes (pri-miRNA, pre-
miRNA or mature miRNA) would potentially affect the miRNA processing and/or 3’
UTR mRNA target selection (Iwai and Naraba, 2005; Shen and Yu, 2008; Wu et al.,
2008; Mencía et al., 2009; Sun et al., 2010). The expression profiles of miRNAs in
human cancers and disorders had been extensively studied over the past decades. Many
miRNAs were up- or down-regulated in various human cancers and disorder. This
indicates that miRNAs play a role in tumorigenesis. However, compared with the
comprehensive studies of miRNA expression profiling, associations between miRNA
mutations with cancers or disorders are still larger unknown (Iwai and Naraba, 2005;
Shen and Yu, 2008; Wu et al., 2008).

73
4.2 Genetic variation of miRNA sequences
Data mining was performed to further investigate the functional role of miRNAs,
by searching for homology between 1344 known miRNAs in human genome (from
miRBase Release 16.0, Sept 2010) and SNPs database (from dbSNP131/132, UCSC
Genome browser). A total amount of 42 SNPs in seed-region of mature miRNA were
identified. These findings can conclude that miRNA genes have very low polymorphism
density since most identified variations are not within the seed region, indicating pre-
miRNAs have a strong selective constraint (Borel and Antonarakis, 2008). These single
nucleotide variant within seed region sequence of mature miRNAs could have complex
influence by affecting miRNA biogenesis, functional strand selection and target
selection. This study focused on the genetic variation within the seed region of 5’-end
mature miRNA, rather than pri-miRNA or pre-miRNA because seed region base pairing
is known to be a critical region for 3’UTR mRNA target recognition (Bartel, 2004;
Ambros, 2004; Lee et al., 2006; Zambon et al., 2006). This would result in targets gain
or loss. Theoretically, functional mutation found on the seed region would hugely
impact mRNA-protein translation, further contributing to disease or cancer development.
The RNA secondary structure of these 42 single nucleotide variant within seed
region sequence of mature miRNAs was predicted by MFOLD program to examine how
the variant allele could alter the secondary structure of related wild-type allele of
miRNAs. Only 14 single nucleotide variant within seed region sequence of mature
miRNAs showed base-pairing mismatches, increased minimal free energy values and
the addition of an enlarged RNA bulge in the predicted secondary structure (as shown in
Figure 3.1). Among these potential single nucleotide variants, 12 single nucleotide
variant on the seed region of mature miRNAs were not available when this project was
first conducted, as the miRBase database used was Release 13.0, March 2009. New
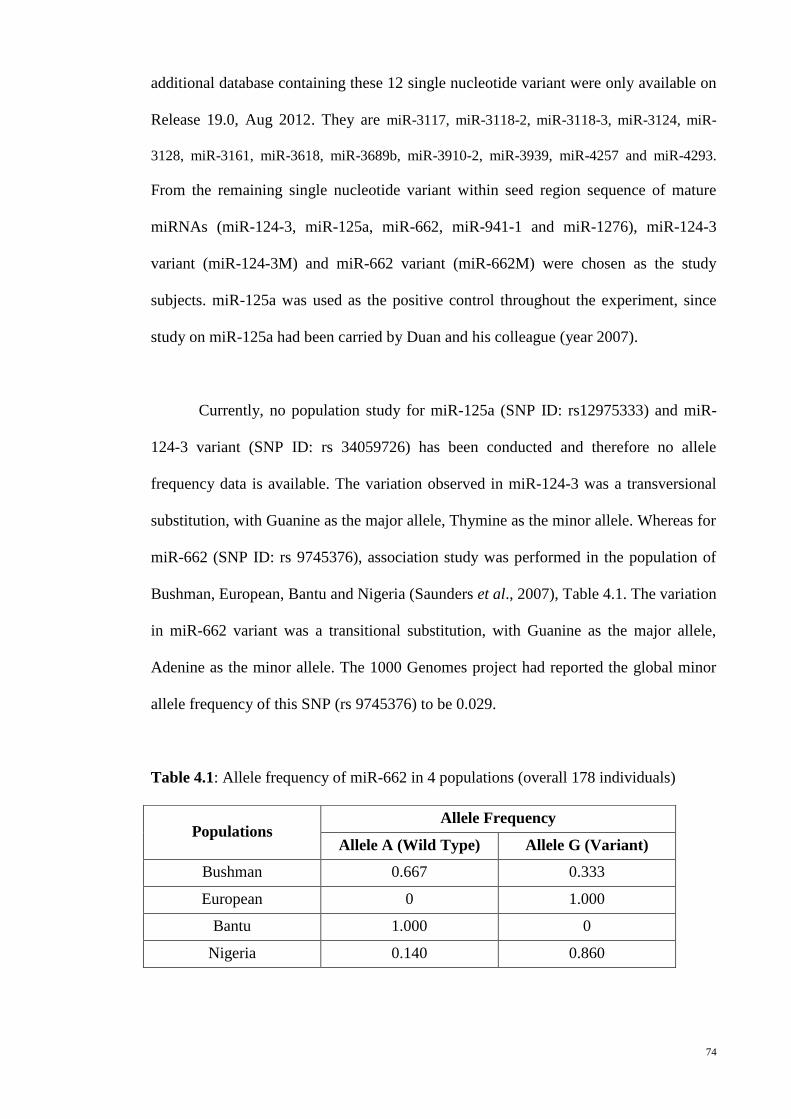
74
additional database containing these 12 single nucleotide variant were only available on
Release 19.0, Aug 2012. They are miR-3117, miR-3118-2, miR-3118-3, miR-3124, miR-
3128, miR-3161, miR-3618, miR-3689b, miR-3910-2, miR-3939, miR-4257 and miR-4293.
From the remaining single nucleotide variant within seed region sequence of mature
miRNAs (miR-124-3, miR-125a, miR-662, miR-941-1 and miR-1276), miR-124-3
variant (miR-124-3M) and miR-662 variant (miR-662M) were chosen as the study
subjects. miR-125a was used as the positive control throughout the experiment, since
study on miR-125a had been carried by Duan and his colleague (year 2007).
Currently, no population study for miR-125a (SNP ID: rs12975333) and miR-
124-3 variant (SNP ID: rs 34059726) has been conducted and therefore no allele
frequency data is available. The variation observed in miR-124-3 was a transversional
substitution, with Guanine as the major allele, Thymine as the minor allele. Whereas for
miR-662 (SNP ID: rs 9745376), association study was performed in the population of
Bushman, European, Bantu and Nigeria (Saunders et al., 2007), Table 4.1. The variation
in miR-662 variant was a transitional substitution, with Guanine as the major allele,
Adenine as the minor allele. The 1000 Genomes project had reported the global minor
allele frequency of this SNP (rs 9745376) to be 0.029.
Table 4.1: Allele frequency of miR-662 in 4 populations (overall 178 individuals)
Populations Allele Frequency
Allele A (Wild Type) Allele G (Variant)
Bushman 0.667 0.333
European 0 1.000
Bantu 1.000 0
Nigeria 0.140 0.860

75
4.3 Pre-miRNA secondary structure prediction
The selected secondary structure of two wild-type and variant allele of pre-
miRNAs showed increament in the negative minimal folding energy value, showed in
Table 4.2.
Table 4.2: Minimal folding energy (MFE) value of miRNA secondary structure.
microRNA Minimal Folding Energy (MFE) Value Energy Change
(ΔΔG) Wild Type Allele Variant Allele
miR-125a -46.1kcal/mol -40.0kcal/mol 6.1 kcal/mol
miR-124-3 -40.30kcal/mol -32.20kcal/mol 8.1 kcal/mol
miR-662 -47.40kcal/mol -46.30kcal/mol 1.1 kcal/mol
All pre-miRNAs containing variant allele showed less negative minimal folding
energy compared to their wild-type pre-miRNA. Since stem looped secondary structures
of miRNAs are well conserved in humans (Ambros et al., 2003; Kim and Nam, 2006;
Zhang et al., 2006), every wild-type miRNA should has a unique secondary structure
and the minimum free energy value represent the stable folding of secondary structure
of one specific miRNA type. Deviation of the minimal folding energy value might
affect the initiate stable structure of miRNA and hence alter the production of mature
miRNA. These pre-miRNAs with variant allele seemed to strengthen the stability of the
secondary structure. Hence, single nucleotide variantion within seed region sequence of
mature miR124-3 and miR-662 also have the potential to influence the miRNA gene
transcription, miRNA processing or the mRNA targeting.

76
4.4 Validation of wild-type and variant allele in two miRNA forms
4.4.1 Single nucleotide variant in seed-region miR-124-3 and miR-662 enhanced
the processing of mature miRNA
Study from Duan and colleagues (2007) demonstrated that mutation at seed
region of miR-125a, can reduced the expression level of pre- and mature miR-125a that
containing the variant allele. Nucleotide variation at the eighth nucleotide upstream
from the 5’ end of the mature miR-125a has proven to have a huge impact on Drosha-
DGCR8 processing of its RNA substrate (Duan et al., 2007). In my findings, the mature
miR-125a showed an enhanced expression level which is different from Duan’s finding.
This could possibly due to the different vector and cell line used. In my study, pcDNA
TM 3.1/Zeo (-) vector with a Cytomegalovirus (CMV) enhancer-promoter from
Invitrogen was used instead of pSM2 retroviral vector with u6 promoter from Open
Biosystems. Additionally, HEK293T transient cell line was used in this study rather
than the stable HEK293. HEK293T contained T-antigen SV40 that enhanced the
amplification of transfected plasmid, increasing the transfection efficiency (Oka et al.,
2010).
I found that G/T transversion at the fourth nucleotide upstream from the 5’ end
of the mature miR-124-3 and G/A transition at the seventh nucleotide upstream from the
5’ end of the mature miR-662 had enhanced expression of the mature miRNA variant.
The variations that occurred at seed region within mature miR-124-3 and miR-662 had
increased the expression level of mature miRNA variant, they may provide a more
stable stem preceding the mature miRNA sequence through some unknown molecular
event (Sun et al., 2010). The structural features of these two pre-miRNAs may have
stabilized the enzyme-substrate complex by mediating protein-nucleic acid interactions
between Dicer and its RNA substrate. Dicer itself has the intrinsic ability to differentiate

77
RNA substrates with different structure (Chakravarthy et al., 2010), since their cutting
sites are secondary structure dependent and not sequence based (Sun et al., 2010).
Therefore a stable enzyme-RNA substrate complex is believed to promote the Dicer-
mediated processing of mature miRNA (Chakravarthy et al., 2010). This could explain
the 2.2 fold increase in production of mature miR-124-3 variant and 1.9 fold increase
for mature miRNA of miR-662 variant. Further investigations such as Northern blot and
reporter assay should be conducted to reconfirm these miRNAs that enhance processing
of mature miRNA. It would be interesting to determine how the single nucleotide
variation in the seed region of the miRNAs studied lead to increased expression of the
miRNA variant.
4.4.2 Single nucleotide variation in seed-region miR-124-3 and miR-662 do not
affect pri- and pre-miRNA processing
The expression level of variant allele of pre-miRNA for miR-124-3 and miR-662
remains almost similar to the wild-type allele of pre-miRNA expression. This showed
that the variant allele on seed region on the 5’-end of mature miR-124-3 and miR-662
did not affect the processing of pre-miRNA from pri-miRNA. This result was different
from the finding by Duan and his colleague, which stated that SNP on seed region could
reduce the expression of pre- and mature miRNA. This outcome could be due to the
different position of the variation site in the miRNA that affect the recognition site of
complex protein. Many studies have reported that pri-miRNA is processed by Drosha-
DGCR8 complex to produce pre-miRNA (Han et al., 2006; Yeom et al., 2006; Duan et
al., 2007; Kunej et al., 2012; Slaby et al., 2012). Pre-miRNA was produced through the
cleavage of approximately 22nt from the terminal stem-ssRNA junction by Drosha
(Iwai and Naraba, 2005). If mutation causes a structural change or disrupt the stem
integrity within this critical region of miRNA, processing and expression of miRNA

78
would be affected (Iwai and Naraba, 2005; Wu et al., 2008). Drosha-DGCR8 complex
protein may bind to the pri-miRNA in one of two different orientations: productive
processing (processing center is located ~11bp from the basal segment) and abortive
processing (processing center is located ~11bp from the terminal loop), showed in
Figure 4-1 (Han et al., 2006). Productive processing will produces functional pre-
miRNA, while abortive processing product does not contain full miRNA sequences.
Functional pre-miRNAs are favourably produced in the productive orientation. Han and
colleagues suggested that internal stem structure may influenced the choice of
processing. If a bulge was found to be near to the productive site, productive processing
will be suppressed and abortive processing will be facilitated (Han et al., 2006).
Figure 4-1: Productive Processing versus Abortive Processing. The fragment from
abortive processing are designated as F1′, F2′, and F3′ (Figure from Han et al., 2006).
In this study, the variant allele that introduced the RNA bulge was located on the
32th
nt from the basal segment (3’-end) of miR-124-3 and on the 29th
nt from the basal
segment (3’-end) of miR-662; both variant alleles are slightly far away from the
‘ssRNA–dsRNA junction-anchoring’ structure. The additional bulges are located close
to the abortive processing site, which highly reduced the chance for abortive processing
and facilated the productive processing which will produced the pre-miRNAs normally.
Besides that, variant allele that were introduced in miR-124-3 and miR-662 did not
affect the structure of ssRNA-dsRNA junction and hence do not affect the Drosha-
79
DGCR8 cutting site. Drosha excision sites are structure based and not sequence based
(Sun et al., 2010). Therefore, pre-miR-124-3 and miR-662 was normally expressed.
4.5 Relationship between microRNA expression and disease predisposition
MicroRNAs play an essential role in many biological functions. The synergistic
effects of individual miRNAs that can bind to the same mRNA target enable a miRNA
family the precise modulation of target gene expression (Lee et al., 2006; Zhang et al.,
2006; Sun et al., 2010).
Function of miR-124-3:
The mature miR124 family consists of miR-124-1, miR-124-2 and miR-124-3.
In this study, only miR-124-3 show sequence variation on its seed region. miR-124-3
(MI0000445) is located in chromosome 20q13.33, region 61809907-61809907; all of
which contain CpG islands in their promoter regions. The 3’-UTR target messenger
RNA (mRNA) for miR-124-3 was predicted through mining the public database –
PicTar (http://pictar.mdc-berlin.de), TargetScan (www.targetscan.org/) and Diana-
Mirco lab (http://diana.cslab.ece.ntua.gr/microT/) programs. From the list of potential
mRNA targets that were convergent among the three databases, only seven mRNA
genes were ramdomly selected (Table 4.4): VAMP3 (Vesicle-associated membrane
protein 3), CD164 (Sialomucin core protein 24), PTPN12 (Tyrosine-protein
phosphatase non-receptor type 12), NEGR1 (Neuronal growth regulator 1), CDK6
(Cyclin-dependent kinase 6), ITGB1 (Integrin Beta 1) and IGFBP7 (Insulin-like growth
factor-binding protein 7). Some of these target mRNAs had been experimentally
verified.
80
For example, miR-124 expression led to the down-regulation of endogenous
PTPN12 (protein tyrosine phosphatase non-receptor type 12) protein levels. PTPN12
regulate the equilibrium of tyrosine phosphorylation that plays a central role in cellular
physiology and in cancer. PTPN12 also suppresses mammary epithelial cell
proliferation and transformation. This suggests that miR-124 may mediate tumor
suppressor RE1 silencing transcription factor’s (REST) ability to inhibit PTPN12
protein expression. The inhibition of PTPTN12 tumor suppressor by miR-124 showed
that miR-124 may function as an oncogene in human breast cancers and lung cancers
(Sun et al., 2011). However in this study, miR-124-3 with a variant allele was predicted
to target CREB5 (Cyclic AMP-responsive element-binding protein 5) and DCC (a novel
gene, Deleted in Colorectal Cancer), instead of PTPN12 (predicted by public databases).
This showed that the variant miR-124-3 may not be able to inhibit PTPTN12 tumor
suppressor. Variant miR-124-3 may inversely act as tumor suppressor instead of
oncogene in human breast cancers or lung cancers. On the other hand, variant miR-124-
3 may target CREB5 gene and the up-regulation of CREB5 gene would cause HIV
Encephalitis.
Besides that, Hunt and his colleagues had proven that miR-124 was able to
suppress oral squamous cell carcinoma (OSCC) invasion by decreasing the ITGB1
expression level. ITGB1 is known to maintain tissue homeostasis and direct regulatory
intracellular signaling cascades. From their study, mir-124 showed great potential as a
prognostic indicator in OSCC (Hunt et al., 2011).

81
Function of miR-662: Mature miR-662 (MI0003670) is located at chromosome
16p13.3, position 820183-820277. The 3’-UTR target mRNA for miR-662 was
identified using public database – TargetScan (www.targetscan.org/) and Diana-Mirco
lab (http://diana.cslab.ece.ntua.gr/microT/). Among the potential targets, only those that
were convergent among the two databases were selected (Table 4.3): NEGR1 (Neuronal
growth regulator 1), CSF3 (colony stimulating factor 3) and MKX (Homeobox protein
Mohawk). There is currently no studies done on miR-662, therefore the target mRNAs
were not validated. Enfield and his colleagues (2011) had proven that miR-662
transiently increased in response to high doses of X-ray radiation in human fibroblasts
of lung cancer and may have a role in conferring chemoresistance to a number of lung
cancer drugs (Enfield et al., 2011). The expression of miR-662 was shown to increase in
human kidney tissue of lupus nephritis patient (Dai et al., 2009, Dalal and Kwon, 2010).
Overall, miR-662 has a role in malignancies or in the control of growth and apoptosis
(Dahiya et al., 2008).

82
Table 4.3: Predicted potential 3’ UTR mRNA targets for miR-124-3 and miR-662
miRNAs
Predicted
mRNA
target
Functions Possible diseases or
cancers
Wild Type
miR-124-3
VAMP3
Vesicular transport from the late
endosomes to the trans-Golgi
network
Immunological
disease
CD164 Promotes myogenesis by enhancing
CXCR4-dependent cell motility.
↑ Prostate cancer
PTPN12 Dephosphorylates cellular tyrosine
kinases
↓ Breast and lung
cancer
NEGR1 Cell-adhesion ↓ Ovarian cancer
CDK6
Control of the cell cycle and
differentiation; promotes G1/S
transition
↓ Breast cancer
ITGB1 Receptors for collagen ↓ Oral squamous cell
carcinoma
IGFBP7 Stimulates cell adhesion ↑ Cervical cancer
Variant
miR-124-3
CREB5 Binds to the cAMP response
element and activates transcription
↑ HIV Encephalitis
(HIVE)
DCC Receptor for netrin required for
axon guidance.
↑ Colorectal cancer
Wild Type
miR-662
NEGR1 cell-adhesion ↓ Ovarian cancer
CSF3
Induces granulocytes ↓ Smoking-induced
chronic obstructive
pulmonary disease.
MKX Morphogenetic regulator of cell
adhesion
↑ Ovarian cancer
Variant
miR-662
Zinc
finger
proteins
Transcriptional regulation ↑ pancreatic
carcinomas
↓ Colorectal cancer
Annotations: VAMP3(Vesicle-associated membrane protein 3), CD164 (Sialomucin
core protein 24), PTPN12 (Tyrosine-protein phosphatase non-receptor type 12), NEGR1
(Neuronal growth regulator 1), CDK6 (Cyclin-dependent kinase 6), ITGB1 (Integrin
Beta 1), IGFBP7 (Insulin-like growth factor-binding protein 7), CREB5(Cyclic AMP-
responsive element-binding protein 5), DCC(Deleted in Colorectal Cancer),
NEGR1(Neuronal growth regulator 1), CSF3(colony stimulating factor 3) and
MKX(Homeobox protein Mohawk).
83
4.6 Future aspects
Single nucleotide changes in the mature miRNA sequence may drive the
evolution of new miRNA by altering their biological function. As nucleotide variation
on seed region of miRNA genes are rare and their mutant allele frequencies are low,
large studies will be needed to draw out the importance. Up-to-date, not many SNP
information were available on the non-coding gene, where miRNAs genes are deposited.
In additional, the complexity of the miRNA network, especially their pathways, can
further intensified by the discovery of miRNA functions that mediated by changes in
miRNA sequence and maturation. In order to gain accurate quantitative result and a
convicing statistic data, usage of pri- and pre-miRNA Taqman probes would gives high
specificity to the target gene and reliable result as compare to SYBR Green probe.
The findings of these two single nucleotide variations of miRNAs can be used to
further study the effect of genetic variation on one population risk of cancer or disorders.
In future, Western blot, reporter assay and luciferase assay could be used to study the
linkage between alterations in miRNA structure and the predicted target mRNAs and
cancer risk. The study of genetic variation in miRNA networks has expanded our
knowledge of the possible ways in which miRNAs can affect cancer.

84
CHAPTER 5 CONCLUSION
The evolutionary conservation of mature miRNA genes within humans allows
bioinformatic approaches to be used to predict the potential miRNA variations against
the Single Nucleotide Polymorphism database. Among the 1344 mature miRNA
sequences, 42 single nucleotide variants were found on the seed region of mature
miRNA by using BLAT homology search. Two selected potential single nucleotide
variation in seed-region of mature miRNAs had been experimentally validated for the
pri-, pre- and mature miRNA expression by real-time PCR approach. These two single
nucleotide variations in seed-region of mature miRNAs that had an additional RNA
bulge, located slight further from the 5’-end of mature miRNA surprisingly provided a
more stable structure of pri-miRNA and pre-miRNA. This outcome in return increases
the expression of mature miRNAs. MicroRNAs are known to be important for gene
regulation network by regulating gene expression at the post transcriptional stage.
Therefore, the study of sequence variation on seed-region of miRNAs could enhance the
understanding of miRNA biogenesis and the potential contribution of these nucleotide
variations to normal human variation and disease pathogenesis. However, single
nucleotide variations in seed-region mature miRNA that was associated to cancer
development is very much in its infancy and hence further investigation on mRNA
targeting is necessary. Future studies could include analyzing potential direct targets
predicted by bioinformatics programs and assessing gene-silencing capabilities of both
mutants through luciferase assay. In addition, association studies on cancer prone
populations can be done to elucidate the frequency of miRNA allele polymorphisms and
its effect on cancers development.
85
REFERENCES
1 Abelson, J. F., Kwan, K. Y., O’roak, B. J., Baek, D. Y., Stillman, A. A., Morgan,
T. M., Mathews, C. A., Pauls, D. L., Rasin, M. R., Gunel, M., Davis, N. R., Ercan-
Sencicek, A. G., Guez, D. H., Spertus, J. A., Leckman, J. F., Dure IV, L. S.,
Kurlan, R., Singer, H. S., Gilbert, D. L., Farhi, A., Louvi, A., Lifton, R. P., and
Matthew, N. S. (2005). Sequence variant in SLITRK1 are associated with
Tourette's syndrome. Science. 310. 317-320.
2 Ambros, V. (2004). The functions of animal MicroRNAs. Nature. 431. 350-355.
3 Ambros, V. Bartel, B., Bartel, D. P., Burge, C.B., Carrington, J. C., Chen, X. M.,
Dreyfuss, G., Eddy, S. R., Jones, S .G., Marshall, M., Matzke, M., Ruvkun, G. and
Tuschl, T. (2003). A uniform system for microRNA annotation. RNA. 9. 277-279.
4 Asikainen, S., Heikkinen, L., Wong, G., and Storvik, M. (2008). Functional
characterization of endogenous siRNA target genes in Caenorhabditis elegans.
BMC Genomics. 9 (270). 10 pages.
5 Bartel, D. P. (2004). MicroRNAs: Genomics, biogenesis, mechanism, and
function. Cell. 116. 281–297.
6 Bonham, V. L., Baker, E. W. and Collins, F. S. (2005). Race and ethnicity in the
genome era – The complexity of the constructs. American Psychologist. 60 (1). 9-
15.
7 Bonnet, E., Wuyts, J., Rouzé, P. and Peer, Y. V. (2004). Evidence that microRNA
precursors, unlike other non-coding RNAs, have lower folding free energies than
random sequences. Bioinformatics. 20 (17). 2911–2917.
8 Boominathan, L. (2010). The tumor suppressors P53, P63, and P73 are regulators
of microrna processing complex. PLos ONE. 5 (5). e10615.
9 Borel C. and Antonarakis, S. E. (2008). Functional genetic variation of human
miRNAs and phenotypic consequences. Mammalian Genome. 19. 503–509.
86
10 Brooker, R. J. (2005). Genetics: Analysis & principals, 2nd Edition. New York:
Mcgraw Hill.
11 Carrington, J. C. and Ambros, V. (2003). Role of microRNAs in plant and animal
development. Sciences. 301. 336-338.
12 Chakravarthy, S., Sternberg, S. H. Kellenberger, C. A. and Doudna, J. A. (2010).
Substrate-specific kinetics of dicer-catalyzed RNA processing. Journal of
Molecular Biology. 404. 392–402.
13 Chen, C.F., Ridzon, D.A., Broomer, A. J., Zhou, Z. H., Lee, D. H., Nguyen, J. T.,
Barbisin, M., Xu, N. L., Mahuvakar, V. R., Andersen, M. R., Lao, K. Q., Livak, K.
J. and Guegler, K. J. (2005). Real-time quantification of microRNAs by stem–loop
RT–PCR. Nucleic Acids Research. 33 (20).
14 Chen, K. X., Song, F. J., Calin, G. A., Wei, Q. Y., Hao, X. S. and Zhang, W.
(2008). Polymorphisms in microRNA targets: a gold mine for molecular
epidemiology. Carcinogenesis. 29 (7). 1306–1311.
15 Cho, W. CS. (2007). OncomiRs: The discovery and progress of microRNAs in
cancers. Molecular Cancer. 6(60). 7 pages.
16 Chomczynski, P. and Sacchi, N. (1987). Single step method of RNA isolation by
acid guanidinium thiocyanate-phenol-chloroform extraction. Analytical
Biochemistry. 162,156-159.
17 Chomczynski, P. and Sacchi, N. (2006). The single-step method of RNA isolation
by acid guanidinium thiocyanate–phenol–chloroform extraction: twenty-
something years on. Nature Protocol. 1(2). 581-585.
18 Collins, F. S. (2003). Faith and the human genome. Perspectives on Science and
Christian Faith. 55 (3). 142-153.
19 Cullen, B. R. (2004). Transcription and processing of human microRNA
precursors. Molecular Cell. 16. 861–865.
87
20 Dahiya, N., Sherman-Baust, C. A., Wang, T. L., Davidson, B., Shih, I. M., Zhang,
Y. Q., Wood III, W., Becker, K. G. and Morin P. J. (2008)MicroRNA expression
and identification of putative miRNA targets in ovarian cancer. PLoS ONE. 3(6).
21 Dalal, S. R. and Kwon, J. H. (2010) The role of microRNA in inflammatory bowel
disease. Gastroenterology & Hepatology. 6 (11). 714-722.
22 Dai, Y., Sui, W. G., Lan, H. J., Yan, Q., Huang, H. and Huang, Y. S. (2009).
Comprehensive Analysis of microRNA expression patterns in Renal Biopsies of
Lupus Nephritis patient. Rheumatology International. 29. 749–754.
23 Denli, A. M., Tops, B. B. J., Plasterk, R. A., Ketting, R. F. And Hannon, G. (2004).
Processing of primary microRNAs by the microprocessor complex. Nature. 432.
231-235.
24 Diederichs, S. and Haber, D. A. (2006). Sequence variations of microRNAs in
human cancer: alterations in predicted secondary structure do not affect processing.
Cancer Research. 66 (12). 6079-6104.
25 Diederichs, S. and Haber, D. A. (2007). Dual role for argonautes in microrna
processing and posttranscriptional regulation of microrna expression. Cell. 131.
1097–1108.
26 Du, T. T. and Zamore, P. D. (2005). Microprimer: The biogenesis and function of
microRNA. Development. 132. 4645-4652.
27 Duan, R. H., Pak C. H. and Jin P. (2007). Single nucleotide polymorphism
associated with mature miR-125a alters the processing of pri-miRNA. Human
Molecular Genetics. 16. 1124-1131.
28 Enfield, K. S. S., Stewart, G. L., Pikor, L. A., Alvarez, C. E., Lam, S., Lam, W. L.
and Chari, R. (2011). MicroRNA gene dosage alterations and drug response in
lung cancer. Journal of Biomedicine and Biotechnology 2011. 15 pages.

88
29 Feng, J. N., Sun, G. H., Yan, J., Noltner, K., Li, W. Y., Buzin, C. H., Longmate,
J., Heston, L. L., Rossi, J., and Sommer, S. S. (2009). Evidence for X-
chromosomal Schizophrenia associated with microRNA alterations. The EMBO
Journal. 4 (7).
30 Frazer, K. A., Murray, S. S., Schork, N. J. and Topol, E. J. (2009). Human genetic
variation and its contribution to complex traits. Nature Reviews, Genetics. 10. 241-
251.
31 Garcia I. A. and Miska, E. A. (2005). microRNA functions in animal development
and human disease. Development. 132. 4653-4662.
32 Garofalo, M., Condorelli G. and Croce, C. M. (2008). microRNAs in diseases and
drug response. Current Opinion in Pharmacology. 8. 661–667.
33 Garzon, R., Fabbri, M., Cimmino, A., Calin G. A. and Croce, C. M. (2006).
microRNA expression and function in cancer. Trends in Molecular Medicine. 12
(12). 580-587.
34 Gaur, A., Jewell, D. A., Liang, Y., Ridzon, D., Moore, J. H., Chen, C., Ambos, V.
R. And Israel, M. A. (2007). Characterization of microRNA expression levels and
their biological correlates in human cancer cell lines. Cancer research. 67 (6).
2456-2468.
35 Georges, M., Coppieters, W. and Charlier, C. (2007). Polymorphic miRNA-
mediated gene regulation: contribution to phenotypic variation and
disease.Current Opinion in Genetics & Development. 17. 166–176.
36 Gregory R. I. and Shiekhattar, R. (2005). microRNA biogenesis and cancer.
Cancer Research. 65 (9). 3509-3512.
37 Gregory, R. I., Chendrimada, T. P., Cooch, N. and Shiekhattar, R. (2005). Human
RISC couples microRNA biogenesis and posttranscriptional gene silencing. Cell.
123. 631–640.

89
38 Grimson, A., Farh, K. K. H., Johnston, W. K., Engele, P. G., Lim, L. P. and Bartel,
D. P. (2007). MicroRNA targeting specificity in mammals: determinant beyond
seed pairing. Molecular Cell. 27. 91-105.
39 Hammond, S. M. (2006). microRNAs as oncogenes. Current Opinion in Genetics
& Development. 16. 4–9.
40 Han, J. J., Lee, Y. T., Yeom, K. H., Nam, J. W., Heo, I., Rhee, J. K., Sohn, S. Y. ,
Cho, Y. J., Zhang, B. T., and Kim, V. N. (2006). Molecular basis for the
recognition of Primary microRNAs by the Drosha-DGCR8 complex. Cell. 125.
887–901.
41 Harborth, J., Elbashir, S. M., Bechert, K., Tuschland, T. and Webe,r K. (2001).
Identification of essential genes in cultured mammalian cells using small
Interfering RNAs. Journal of Cell Science. 114 (24).4557-4546.
42 Hedrick, P. W. (2007). Sex: Differences in mutation, recombination, selection,
gene flow, and genetic drift. Evolution. 61 (12). 2750–2771.
43 Horikawa, Y. H., Wood, C. G., Yang, H. S., Zhao, H., Ye, Y., Gu, J., Lin, J.,
Habuchi, T. and Wu, X. (2008). Single Nucleotide Polymorphisms of microRNA
machinery genes modify the risk of renal cell carcinoma. Clinical Cancer
Research. 14(23). 7956-7962.
44 Hunt, S., Jones, A. V., Hinsley, E. E., Whawell, S. A. and Lambert D. W. (2011).
MicroRNA-124 suppresses oral squamous cell carcinoma motility by targeting
ITGB1. FEBS Letters. 585. 187–192.
45 Iwai, N. H. and Naraba, H. (2005). Polymorphisms in human pre-
miRNAs.Biochemical and Biophysical Research Communications. 331. 1439–
1444.
46 Jack, D., Bidwell, J., Turner, M., and Wood, N. (1997). Simultaneous genotyping
for all three known structural mutations in the human mannose-binding lectin gene.
Human Mutation. 9. 41–46.

90
47 Jiang, L.L., Huang, Q., Zhang, S.Y., Zhang, Q.F., Chang, J.H., Qiu, X.S., and
Wang S.H. (2010). Hsa-mir-125a-3p and hsa-miR-125a-5p are downregulated in
non-small cell lung cancer and have inverse effects on invasion and migration of
lung cancer cells. BMC Cancer. 10:318.
48 Jones, S. G. (2004). The miRNA Registry. Nucleic Acids Research. 32. D109-
D111.
49 Jones, S. G., Grocock, R. J., Dongen, S. V., Bateman, A., Enright A. J. (2006).
miRBase: microRNA sequences, targets and gene nomenclature. Nucleic Acids
Research. 34. D140-D144.
50 Jones, S. G., Saini, H.K., Dongen, S. V., Enright A. J. (2008). miRBase: Tools for
microRNA genomics. Nucleic Acids Research. 36. D154-D158.
51 Kadri, S., Hinman, V., and Benos. P. V. (2009). HHMMiR: efficient de novo
prediction of microRNAs using hierarchical hidden Markov models. BMC
Bioinformatics. 10 (1). S35.
52 Kent, W.J. (2002). BLAT—The BLAST-Like Alignment Tool. Genome Research.
12. 656-664.
53 Kidd, K. K., Pakstis, A.J., Speed, W.C., and Kidd, J. R. (2004). Understanding
human DNA sequence variation.. Journal of Heredity. 95 (5). 406–420.
54 Kim, V. N. and Nam, J. W. (2006). Genomics of microRNA. Trends in Genetics.
22 (3).165-173.
55 Kim, Y. K. and Kim, V. N. (2007). Processing Of intronic microRNAs. The
EMBO Journal. 26. 775–783.
56 Korbel, J. O., Urban, A. E., Affourtit, J. P., Godwin, B., Grubert, F., Simons, J. F.,
Kim, P. M., Palejev, D., Carriero, N. J., Du, L., Taillon, B. E., Chen, Z. T., Tanzer,
A., Saunders, A. C. E., Chi, J. X., Yang, F. T., Carter, N. P., Hurles, M. E.,
Weissman, S. M., Harkins, T. T., Gerstein, M. B., Egholm, M., and Snyder, M.

91
(2007). Paired-end mapping reveals extensive structural variation in the human
genome. Science. 318 (5849). 420 – 426.
57 Kunej, T., Godnic, I., Horvat, S., Zorc, M., and Calin, G. A. (2012). Cross talk
between microRNA and coding cancer genes. The Cancer Journal. 18 (3). 223-
231.
58 Krol, J., Sobczak, K., Wilczynska, U., Drath, M., Asinska, A., Kaczynska, D. and
Krzyzosiak, W. J. (2004). Structural features of microRNA (miRNA) precursors
and their relevance to miRNA biogenesis and small interfering RNA/short hairpin
RNA design. The Journal of Biological Chemistry. 279 (40). 42230–42239.
59 Kusenda, B., Mraz, M., Mayer, J. and Pospisilova S. (2006). MicroRNA
biogenesis, functionality and cancer relevance. Biomed Pap Med Fac Univ
Palacky Olomouc Czech Repub. 150(2). 205-215.
60 Kwok, P. Y. and Chen, X. N. (2003). Detection of single nucleotide
polymorphisms. Current Issues Molecular Biology. 5. 43-60.
61 Lagerstedt, K., Karsten, S. L., Carlberg, B. M., Kleijer, W. J., Tönnesen, T.,
Pettersson, U. and Bondeson, M. L. (1997). Double-strand breaks may initiate the
inversion mutation causing the hunter syndrome. Human Molecular Genetics. 6
(4). 627–633.
62 Lai, E. C. (2003). MicroRNAs: Runt of the genome assert themselves. Current
Biology. 13. R925–R936.
63 Layton, D.M. and Bundschuh, R. (2005). A statistical analysis of RNA folding
algorithms through thermodynamic parameter perturbation. Nucleic acids
research. 33 (2). 519–524.
64 Lee, R. C., Hammell, C. M., and Ambros, V. (2006). Interacting endogenous and
exogenous RNAi pathways in Caenorhabditis elegans. RNA. 12. 589–597.

92
65 Lee, Y. T., Kim, M. J., Han, J. J., Yeom, K. H., Lee, S. Y., Baek, S. H. and Kim,
V. N. (2004). MicroRNA genes are transcribed by RNA polymerase II. The
EMBO Journal. 23. 4051–4060.
66 Lewis, B. P., Burge, C. B. and Bartel, D. P. (2005). Conserved seed pairing, often
flanked by adenosines, indicates that thousands of human genes are microRNA
targets. Cell. 120. 15-20.
67 Li, H. Q., Lee, Y. H., Chen, J. L., Rebman, E., Li, J. R., and Lussier, Y. A. (2012).
Complex-disease networks of trait-associated single-nucleotide polymorphisms
(SNPs) unveiled by informatiln theory. Journal of the American Medical
Informatics Association. 19. 295-305.
68 Lippman, Z. and Martienssen, R. (2004). The role of RNA Interference in
heterochromatic silencing. Nature. 431. 364-370.
69 Maragkakis, M., Alexiou, P., Papadopoulos, G. L., Reczko, M., Dalamagas, T.,
Giannopoulos, G., Goumas, G., Koukis, E., Kourtis, K., Simossis, V. A.,
Sethupathy, P., Vergoulis, T., Koziris, N., Sellis, T., Tsanakas; P. and
Hatzigeorgiou, A. G. (2009). Accurate microRNA target prediction correlates with
protein repression levels. BMC Bioinformatics. 10 (295)
70 Martino, S., Girolamo, I., Orlacchio, A., Datti, A. and Orlacchio, A. (2009).
microRNA implications across neuro development and neuropathology. Journal of
Biomedicine and Biotechnology. 2009. 13 Pages.
71 Mencía, A., Høybjør, S. M., Redshaw, N., Morın, M., Merino, F. M., Olavarrieta,
L., Aguirre, L. A., Castillo, I. D., Steel, K. P., Dalmay, T., Moreno, F., and Pelayo,
M. A. M. (2009). Mutations in the seed region of human miR-96 are responsible
for nonsyndromic progressive hearing loss. Nature Genetics. 41 (5). 609-613.
72 Meola, N., Gennarino, V. A. and Banfi, S. (2009). MicroRNAs and genetic
diseases. Pathogenetics. 2 (7). 4 pages.
93
73 Millar, A. A. and Waterhouse, P. M. (2005). Plant and animal microRNAs:
Similarities and differences. Functional and Integrative Genomics. 5. 129–135.
74 Mishra, P. J. and Bertino, J.R. (2009). MicroRNA polymorphisms: The future of
pharmacogenomics, molecular epidemiology and individualized medicine.
Pharmacogenomics. 10 (3). 399–416.
75 Mourelatos, Z., Dostie, J., Paushkin, S., Sharma, A., Charroux, B., Abel, L.,
Rappsilber, J., Mann, M., and Dreyfuss, G. (2002). miRNPs: A novel class of
ribonucleoproteins containing numerous microRNAs. Genes & Development. 16.
720–728.
76 Nelson, P. T., Wang, W. X. and Rajeev, B. W. (2008). microRNA (miRNAs) in
neurodegenerative diseases. Brain Pathology. 18. 130–138.
77 Ng, P. C. and Henikoff, S. (2006). Predicting the effects of amino acid
substitutions on protein function. Annual Review of Genomics and Human
Genetics. 7. 61-80.
78 Oka, Y., Nakajima, K., Nagao, K., Miura, K., Ishii, N., and Kobayashi, H. (2010).
293FT cells transduced with four transcription factors (OCT4, SOX2, NANOG,
and LIN28) generate aberrant ES-like cells. Journal of Stem Cells & Regenerative
Medicine. 3. 149-156.
79 Patel, N., Hoang, D., Miller, N., Ansaloni, S., Huang, Q. H., Trogers, J., Clee, J.
and Saunders, A. (2008). microRNAs can regulate human APP levels. Molecular
Neurodegeneration. 3(10). 6 Pages.
80 Plasterk, R. H.A. (2006). Micro RNAs in animal development. Cell. 124. 877-881.
81 Reddy, L. S., Sarojamm, V. and Ramakrishna, V. (2007).Future of RNAi in
medicine: A Review. World Journal of Medical Sciences. 2 (1). 01-14.
82 Rooij, E. V., Sutherland, L. B., Liu, N., Williams, A. H., McAnally, J., Gerard, R.
D., Richardson, J. A. and Olson, A. N. (2006). A signature pattern of stress-

94
responsive microRNAs that can evoke Cardiac Hyper Trophy and heart failure.
PNAS. 103 (48). 18255–18260.
83 Ryan, B. M., Robles, A. I. and Harris, C. C. (2010). Genetic variation in
microRNA networks: the implications for cancer research. Nature Review
Cancer. 10(6). 389-402.
84 Sætrom, P., Snøve, O., Nedland, J. M., Grünfeld,T. B., Lin, Y., Bass, M. B., and
Canon, J. R. (2006). Conserved microRNA characteristics in mammals.
Oligonucleotides. 16. 115–144.
85 Sammalisto, S. (2008). Search for genetic variant influencing human height.
Helsinki, Finland: Julkaisiia – Utgivare.
86 Sassen, S., Miska, E.A. and Caldas, C. (2008). MicroRNA - Implications for
cancer. Virchows Arch. 452. 1-10.
87 Saunders, M. A., Liang, H. and Li, W. H. (2007). Human polymorphism at
microRNAs and microRNA target sites. PNAS. 104 (9). 3300–3305.
88 Sethupathy, P. and Collins, F. S. (2008). microRNA target site polymorphisms
and human disease. Trends in Genetics. 24 (10). 489-497.
89 Shen, S. H. and Yu, Z. B. (2008). Current perspectives in microRNAs (miRNA):
SNPs in microRNA and microRNA target sites associated with human cancers.
Springer Science. 283-298.
90 Slaby, O., Vasku, J. B., Svoboda, M., and Vyzula, R. (2012). Genetic
polymorphisms and microRNAs: new direction in molecular epidemiology of
solid cancer. Journal of Cellular and Molecular Medicine. 16(1). 8-21.
91 Snustad, D. P. and Simmons, M. J. (2003). Principle of Genetics, 3rd Edition.
United States of America: John Wiley & Sons, Inc.
95
92 Steinmann, B., Tuderman, L., Peltonen, L., Martin, G. R., Mckusick, V. A., and
Prockop, D. J. (1980). Evidence for a structural mutation of procollagen type in a
patient with the Ehlers-Danlos Syndrome Type VII. The Journal of Biological
Chemistry. 255 (18). 8887-8893.
93 Stenson, P. D., Mort, M., Ball, E. V., Howells, K., Phillips, A.D., Thomas, N. S.
and Cooper, D. N. (2009). The human gene mutation database: 2008 Update.
Genome Medicine. 1 (1). Article N13.
94 Stranger, B. E., Forrest, M. S., Dunning, M., Ingle, C. E., Beazley, C., Thorne, N.,
Redon, R., Bird, C. P., Grassi, A. D. , Lee, C., Smith, C. T., Carter, N., Scherer, S.
W., Tavaré, S., Deloukas, P., Hurles, M. E., and Dermitzakis, E. T. (2007).
Relative impact of nucleotide and copy number variation on gene expression
phenotypes. Science. 315 (5813). 848–853.
95 Sun, G. H., Yan, J., Noltner, K., Feng, J. N., Li, H. T., Sarkis, D. A., Sommer, S. S.
and Rossi, J. J. (2010). SNPs in human miRNA genes affect biogenesis and
function. RNA. 15 (9). 1640-1650.
96 Sun, T.T., Aceto, N., Meerbrey, K. L., Kessler, J. D., Zhou, C. S., Migliaccio, I.,
Nguyen, D. X., Pavlova, N. N., Botero, M., Huang, J., Bernardi, R. J., Schmitt, E.,
Hu, G., Li, M. Z., Dephoure, N., Gygi, S. P., Rao, M., Creighton, C. J., Hilsenbeck,
S. G., Shaw, C. A., Muzny, D., Gibbs, R. A., Wheeler, D. A., Osborne, C. K.,
Schiff, R., Alj, M. B., Elledge, S. J. and Westbrook T. F. (2011). Activation of
multiple proto-oncogenic Tyrosine Kinases in breast cancer via loss of the
PTPN12 Phosphatase. Cell. 144. 703–718.
97 Svetlanov, A. and Cohen, P. E. (2004). Mismatch repair proteins, meiosis, and
mice: Understanding the complexities of mammalian meiosis. Experimental Cell
Research. 296. 71– 79.
98 Syvänen, A. C. (2001).Accessing genetic variation: genotyping single nucleotide
polymorphisms. Nature Reviews, Genetics. 2. 930-942.
96
99 Tabone, T. (2008). Mutations, structural variations, and genome-wide
resequencing: Where to from here in our understanding of disease and evolution?
Human Mutation. 29 (6). 886-890.
100 Treiber, T., Treiber, N., and Meister, G. (2012). Regulation of microRNA
biogenesis and function. Schattauer. 107 (4). 605-610.
101 Väli, Ü., Brandström, M., Johansson, M. and Ellegren, H. (2008). Insertion –
deletion polymorphisms (Indels) as genetic markers in natural populations. BMC
Genetics. 9. 8 pages.
102 Venter, J. C., Adams, M. D., Myers, E. W., Li, P. W., Mural, R. J. (2001). The
sequence of the human genome. Science. 291. 1340-1351.
103 Vogel, F., and Motulsky, A. G. (1997). Human genetics- Problems and approaches,
3rd Edition. New York: Springer – Verlag Berlin Heidelberg.
104 Wiemer, E. C. A. (2007). The role of microRNAs in cancer: No small matter.
European Journal of Cancer. 43. 1529 – 1544.
105 Winter, J., Jung, S., Keller, S., Gregory R. I. and Diederichs, S. (2009). Many
roads to maturity: microRNA biogenesis pathways and their regulation. Nature
Cell Biology. 11 (3). 228-234.
106 Wong, K. K., Deleeuw, R. J., Dosanjh, N. S., Kimm, L. R., Cheng, Z., Horsman,
D. E., Macaulay, C., Ng, R. T., Brown, C. J., Eichler, E. E., and Lam, W. L.
(2007). A comprehensive analysis of common copy-number variations in the
human genome. The American Journal of Human Genetics. 80. 91-104.
107 Wu, M. Q., Jolicoeur, N., Li, Z., Zhang, L. H., Fortin, Y., L’abbe, D., Yu, Z. B.
and Shen, S. H. (2008). Genetic variations of microRNAs in human cancer and
their effects on the expression of miRNAs. Carcinogenesis. 29 (9). 1710–1716.
108 Xia, H. P. (2008). Great potential of microRNA in cancer stem cell. Journal of
Cancer Molecules. 4(3). 79-89.

97
109 Yeom, K. H., Lee, Y. T., Han, J. J., Suh, M. R. and Kim V. N. (2006).
Characterization of DGCR8/Pasha, the essential cofactor for Drosha in Primary
miRNA processing. Nucleic acids research. 34 (16). 4622–4629.
110 Yu, Z. B., Li, Z., Jolicoeur, N., Zhang, L. H., Fortin, Y., Wang, E., Wu, M. Q.,
and Shen, S. H. (2007). Aberrant allele frequencies of the SNPs located in
microRNA target sites are potentially associated with human cancers. Nucleic
Acids Research. 35 (13). 4535-4541.
111 Zambon, R. A., Vakharia V. N., and Wu, L. P. (2006). RNAi is an antiviral
immune response against a dsRNA virus in Drosophila melanogaster. Cellular
Microbiology. 8 (5). 880–889.
112 Zeng, Y. and Cullen, B. R. (2003). Sequence requirement for microRNA
processing and function in human cells. RNA. 9. 112-123.
113 Zeng, Y. (2006). Principles of micro-RNA production and maturation. Oncogene.
25. 6156–6162.
114 Zeng, Y. (2009). Regulation of the mammalian nervous systemby microRNAs.
Molecular Pharmacology. 75. 259–264.
115 Zhang, B. H., Pan, X. P., Cobb, G. P. and Anderson, T. A. (2007). microRNAs as
oncogenes and tumor suppressors. Developmental Biology. 302. 1–12.
116 Zhang, B. H., Pan, X. P., Cox, S. B., Cobb, G. P. and Anderson, T.A. (2006).
Evidence that miRNAs are different from other RNAs. Cell Molecular Life
Sciences. 63. 246–254.
117 Zhang, B. H., Stellwag, E. J. and Pan X. P. (2009). Large-scale genome analysis
reveals unique features of microRNAs. Gene. 443. 100–109.
118 Zhang, B., Edenberg, H. J., Crabb, D. W., and Harris, R. A. (1989). Evidence for
both a regulatory mutation and a structural mutation in a family with maple syrup
urine disease. Rapid Publication. 83. 1425-1429.

98
119 Zhang, F., Gu, W. L., Hurles, M. E., and Lupski, J. R. (2009). Copy number
variation in human health, disease, and evolution. Annual Review Genomics
Human Genetics. 10. 451-81.
120 Zhang, Z. L. and Gerstein, M. (2003). Patterns of nucleotide substitution, insertion
and deletion in the human genome inferred from pseudogenes. Nucleic Acids
Research. 31 (18). 5338-5348.
121 Zuker, M. (2003). Mfold web server for nucleic acid folding and hybridization
prediction. Nucleic Acid Research. 31 (13), 3406-3415.
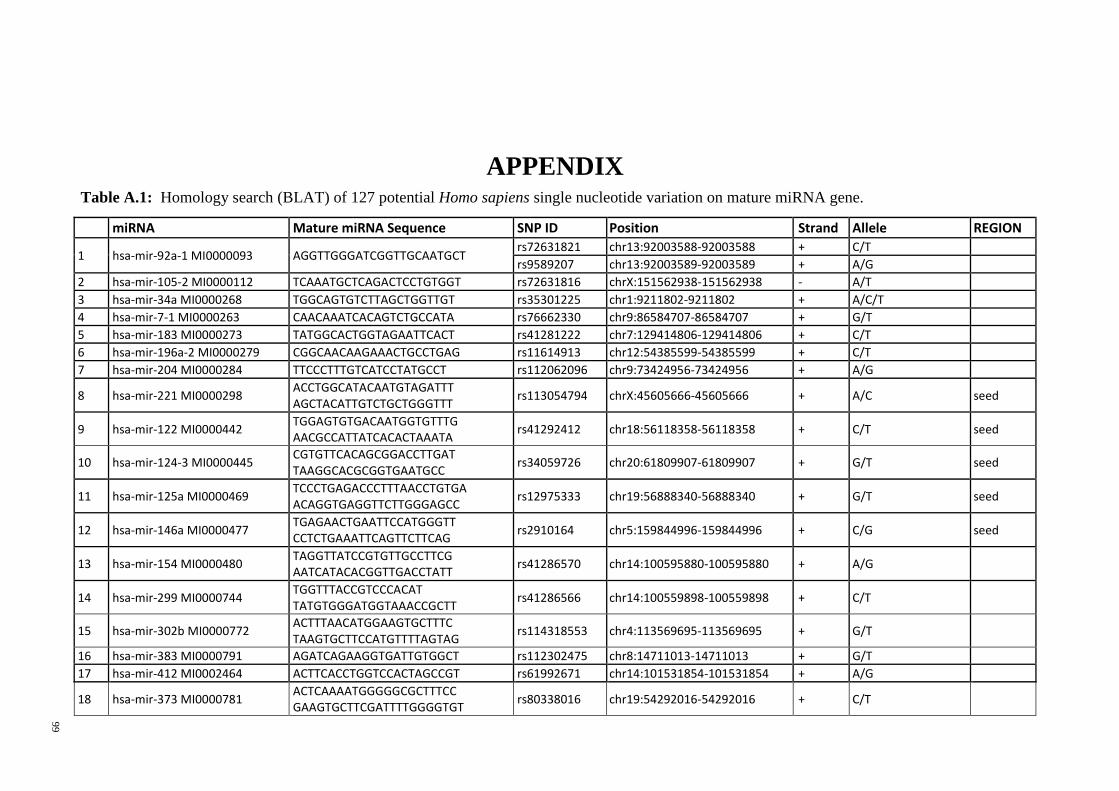
99
APPENDIX
Table A.1: Homology search (BLAT) of 127 potential Homo sapiens single nucleotide variation on mature miRNA gene. miRNA Mature miRNA Sequence SNP ID Position Strand Allele REGION
1 hsa-mir-92a-1 MI0000093 AGGTTGGGATCGGTTGCAATGCT rs72631821 chr13:92003588-92003588 + C/T
rs9589207 chr13:92003589-92003589 + A/G
2 hsa-mir-105-2 MI0000112 TCAAATGCTCAGACTCCTGTGGT rs72631816 chrX:151562938-151562938 - A/T
3 hsa-mir-34a MI0000268 TGGCAGTGTCTTAGCTGGTTGT rs35301225 chr1:9211802-9211802 + A/C/T
4 hsa-mir-7-1 MI0000263 CAACAAATCACAGTCTGCCATA rs76662330 chr9:86584707-86584707 + G/T
5 hsa-mir-183 MI0000273 TATGGCACTGGTAGAATTCACT rs41281222 chr7:129414806-129414806 + C/T
6 hsa-mir-196a-2 MI0000279 CGGCAACAAGAAACTGCCTGAG rs11614913 chr12:54385599-54385599 + C/T
7 hsa-mir-204 MI0000284 TTCCCTTTGTCATCCTATGCCT rs112062096 chr9:73424956-73424956 + A/G
8 hsa-mir-221 MI0000298 ACCTGGCATACAATGTAGATTT AGCTACATTGTCTGCTGGGTTT
rs113054794 chrX:45605666-45605666 + A/C seed
9 hsa-mir-122 MI0000442 TGGAGTGTGACAATGGTGTTTG AACGCCATTATCACACTAAATA
rs41292412 chr18:56118358-56118358 + C/T seed
10 hsa-mir-124-3 MI0000445 CGTGTTCACAGCGGACCTTGAT TAAGGCACGCGGTGAATGCC
rs34059726 chr20:61809907-61809907 + G/T seed
11 hsa-mir-125a MI0000469 TCCCTGAGACCCTTTAACCTGTGA ACAGGTGAGGTTCTTGGGAGCC
rs12975333 chr19:56888340-56888340 + G/T seed
12 hsa-mir-146a MI0000477 TGAGAACTGAATTCCATGGGTT CCTCTGAAATTCAGTTCTTCAG
rs2910164 chr5:159844996-159844996 + C/G seed
13 hsa-mir-154 MI0000480 TAGGTTATCCGTGTTGCCTTCG AATCATACACGGTTGACCTATT
rs41286570 chr14:100595880-100595880 + A/G
14 hsa-mir-299 MI0000744 TGGTTTACCGTCCCACAT TATGTGGGATGGTAAACCGCTT
rs41286566 chr14:100559898-100559898 + C/T
15 hsa-mir-302b MI0000772 ACTTTAACATGGAAGTGCTTTC TAAGTGCTTCCATGTTTTAGTAG
rs114318553 chr4:113569695-113569695 + G/T
16 hsa-mir-383 MI0000791 AGATCAGAAGGTGATTGTGGCT rs112302475 chr8:14711013-14711013 + G/T
17 hsa-mir-412 MI0002464 ACTTCACCTGGTCCACTAGCCGT rs61992671 chr14:101531854-101531854 + A/G
18 hsa-mir-373 MI0000781 ACTCAAAATGGGGGCGCTTTCC GAAGTGCTTCGATTTTGGGGTGT
rs80338016 chr19:54292016-54292016 + C/T

100
miRNA Mature miRNA Sequence SNP ID Position Strand Allele REGION
19 hsa-mir-379 MI0000787 TGGTAGACTATGGAACGTAGG TATGTAACATGGTCCACTAACT
rs61991156 chr14:101488414-101488414 + A/G seed
rs72631818 chr14:101488424-101488424 + A/G
20 hsa-mir-148b MI0000811 AAGTTCTGTTATACACTCAGGC TCAGTGCATCACAGAACTTTGT
rs74878365 chr12:54731071-54731071 + A/C
21 hsa-mir-339 MI0000815 TCCCTGTCCTCCAGGAGCTCACG TGAGCGCCTCGACGACAGAGCCG
rs72631820 chr7:1062599-1062599 - A/G
22 hsa-mir-431 MI0001721 TGTCTTGCAGGCCGTCATGCA CAGGTCGTCTTGCAGGGCTTCT
rs12884005 chr14:101347408-101347408 + A/G seed
23 hsa-mir-485 MI0002469 AGAGGCTGGCCGTGATGAATTC GTCATACACGGCTCTCCTCTCT
rs112982830 chr14:101521764-101521764 + A/G
24 hsa-mir-523 MI0003153 CTCTAGAGGGAAGCGCTTTCTG GAACGCGCTTCCCTATAGAGGGT
rs112495387 chr19:54201668-54201668 + A/G
25 hsa-mir-520c MI0003158 CTCTAGAGGGAAGCACTTTCTG AAAGTGCTTCCTTTTAGAGGGT
rs7255628 chr19:54210734-54210734 + C/G
26 hsa-mir-519d MI0003162 CAAAGTGCCTCCCTTTAGAGT rs116796400 chr19:54216670-54216670 + A/G
27 hsa-mir-518e MI0003169 CTCTAGAGGGAAGCGCTTTCTG AAAGCGCTTCCCTTCAGAG
rs74177813 chr19:54233109-54233109 + -/C seed
rs34416818 chr19:54233113-54233112 + -/A seed
rs74177814 chr19:54233114-54233113 + -/G seed
28 hsa-mir-518d MI0003171 CTCTAGAGGGAAGCACTTTCTG CAAAGCGCTTCCCTTTGGAGC
rs73602910 chr19:54238189-54238189 + A/G seed
29 hsa-mir-516b-1 MI0003172 ATCTGGAGGTAAGAAGCACTTT TGCTTCCTTTCAGAGGGT
rs78861479 chr19:54240174-54240174 + A/G
30 hsa-mir-499 MI0003183 TTAAGACTTGCAGTGATGTTT AACATCACAGCAAGTCTGTGCT
rs3746444 chr20:33578251-33578251 + C/T seed
31 hsa-mir-501 MI0003185 AATGCACCCGGGCAAGGATTCT rs112489955 chrX:49774389-49774389 + A/G
32 hsa-mir-513a-1 MI0003191 TTCACAGGGAGGTGTCAT TAAATTTCACCTTTCTGAGAAGG
rs35027589 chrX:146295068-146295067 + -/C seed
33 hsa-mir-552 MI0003557 AACAGGTGACTGGTTAGACAA rs76067517 chr1:35135270-35135270 + A/G
34 hsa-mir-92b MI0003560 AGGGACGGGACGCGGTGCAGTG TATTGCACTCGTCCCGGCCTCC
rs12759620 chr1:155165044-155165044 + C/G
35 hsa-mir-556 MI0003562 GATGAGCTCATTGTAATATGAG ATATTACCATTAGCTCATCTTT
rs77585320 chr1:162312411-162312411 + C/T

101
miRNA Mature miRNA Sequence SNP ID Position Strand Allele REGION
36 hsa-mir-557 MI0003563 GTTTGCACGGGTGGGCCTTGTCT rs78825966 chr1:168344829-168344829 + C/T seed
37 hsa-mir-568 MI0003574 ATGTATAAATGTATACACAC rs28632138 chr3:114035387-114035387 + G/T
38 hsa-mir-576 MI0003583 ATTCTAATTTCTCCACGTCTTT AAGATGTGGAAAAATTGGAATC
rs71603032 chr4:110409923-110409923 + G/T
39 hsa-mir-581 MI0003588 TCTTGTGTTCTCTAGATCAGT rs1694089 chr5:53247394-53247394 - G/T
rs810917 chr5:53247400-53247400 + A/G
40 hsa-mir-585 MI0003592 TGGGCGTATCTGTATGCTA rs62376935 chr5:168690635-168690635 + C/T seed
41 hsa-mir-590 MI0003602 GAGCTTATTCATAAAAGTGCAG TAATTTTATGTATAAGCTAGT
rs6971711 chr7:73605599-73605599 + C/T
42 hsa-mir-593 MI0003605 AGGCACCAGCCAGGCATTGCTCAGC TGTCTCTGCTGGGGTTTCT
rs73721294 chr7:127721934-127721934 + C/T
43 hsa-mir-596 MI0003608 AAGCCTGCCCGGCTCCTCGGG rs61388742 chr8:1765425-1765425 + C/T
44 hsa-mir-597 MI0003609 TGTGTGTCACTCGATGACCACTGT rs112056940 chr8:9599212-9599212 + C/T
45 hsa-mir-605 MI0003618 TAAATCCCATGGTGCCTTCTCCT
rs113212828 chr10:53059349-53059349 + A/G seed
rs76759855 chr10:53059356-53059356 + A/G
rs34610391 chr10:77312285-77312284 + -/A
46 hsa-mir-608 MI0003621 AGGGGTGGTGTTGGGACAGCTCCGT rs4919510 chr10:102734778-102734778 + C/G
47 hsa-mir-624 MI0003638 TAGTACCAGTACCTTGTGTTCA CACAAGGTATTGGTATTACCT
rs73251987 chr14:31483883-31483883 + C/G
48 hsa-mir-625 MI0003639 AGGGGGAAAGTTCTATAGTCC GACTATAGAACTTTCCCCCTCA
rs12894182 chr14:65937889-65937889 + A/C
49 hsa-mir-627 MI0003641 GTAGTGAGTCTCTAAGAAAAGAGGA rs76362052 chr15:42491832-42491832 + C/T
rs2620381 chr15:42491848-42491848 + A/C seed
50 hsa-mir-628 MI0003642 ATGCTGACATATTTACTAGAGG TCTAGTAAGAGTGGCAGTCGA
rs80185076 chr15:55665154-55665154 + C/G
51 hsa-mir-629 MI0003643 TGGGTTTACGTTGGGAGAACT rs78212770 chr15:70371777-70371777 + C/G
52 hsa-mir-642a MI0003657 GTCCCTCTCCAAATGTGTCTTG rs78902025 chr19:46178206-46178206 + G/T seed
53 hsa-mir-646 MI0003661 AAGCAGCTGCCTCTGAGGC rs6513497 chr20:58883605-58883605 + G/T
54 hsa-mir-662 MI0003670 TCCCACGTTGTGGCCCAGCAG rs9745376 chr16:820249-820249 + A/G seed
55 hsa-mir-449b MI0003673 AGGCAGTGTATTGTTAGCTGGC rs10061133 chr5:54466544-54466544 + A/G
56 hsa-mir-208b MI0005570 ATATAAGACGAACAAAAGGTTTGT rs2754157 chr14:23887219-23887219 + A/T
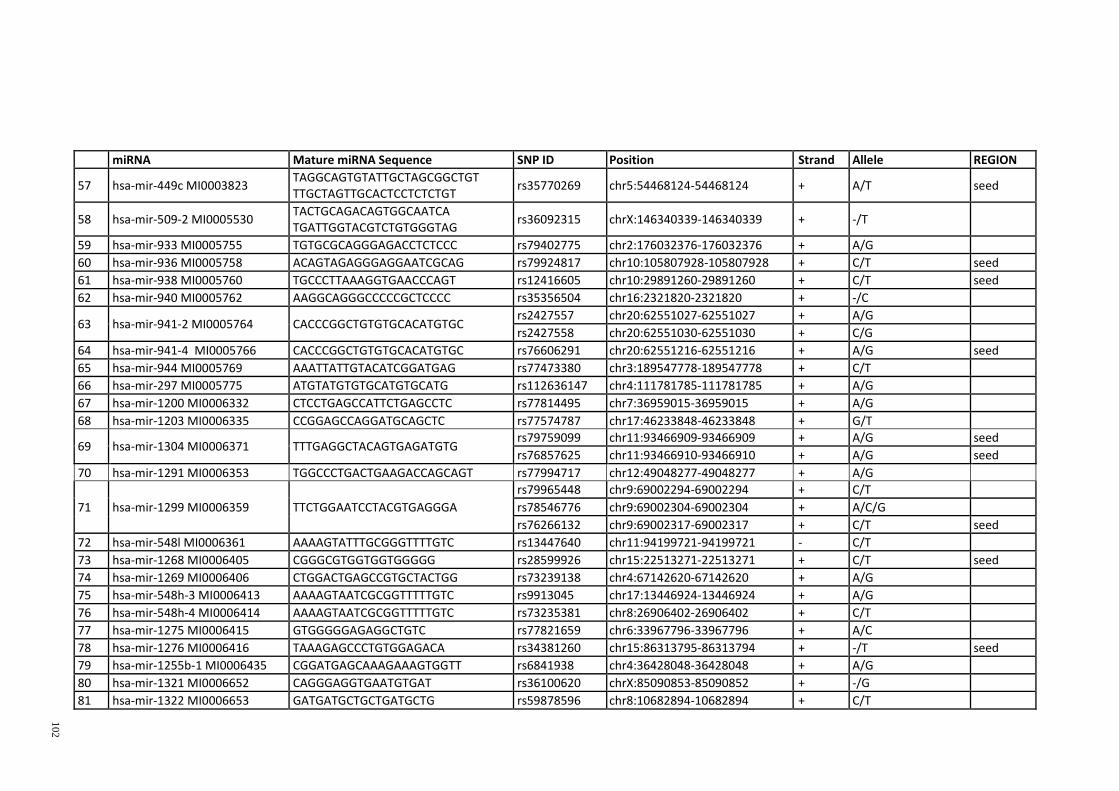
102
miRNA Mature miRNA Sequence SNP ID Position Strand Allele REGION
57 hsa-mir-449c MI0003823 TAGGCAGTGTATTGCTAGCGGCTGT TTGCTAGTTGCACTCCTCTCTGT
rs35770269 chr5:54468124-54468124 + A/T seed
58 hsa-mir-509-2 MI0005530 TACTGCAGACAGTGGCAATCA TGATTGGTACGTCTGTGGGTAG
rs36092315 chrX:146340339-146340339 + -/T
59 hsa-mir-933 MI0005755 TGTGCGCAGGGAGACCTCTCCC rs79402775 chr2:176032376-176032376 + A/G
60 hsa-mir-936 MI0005758 ACAGTAGAGGGAGGAATCGCAG rs79924817 chr10:105807928-105807928 + C/T seed
61 hsa-mir-938 MI0005760 TGCCCTTAAAGGTGAACCCAGT rs12416605 chr10:29891260-29891260 + C/T seed
62 hsa-mir-940 MI0005762 AAGGCAGGGCCCCCGCTCCCC rs35356504 chr16:2321820-2321820 + -/C
63 hsa-mir-941-2 MI0005764 CACCCGGCTGTGTGCACATGTGC rs2427557 chr20:62551027-62551027 + A/G
rs2427558 chr20:62551030-62551030 + C/G
64 hsa-mir-941-4 MI0005766 CACCCGGCTGTGTGCACATGTGC rs76606291 chr20:62551216-62551216 + A/G seed
65 hsa-mir-944 MI0005769 AAATTATTGTACATCGGATGAG rs77473380 chr3:189547778-189547778 + C/T
66 hsa-mir-297 MI0005775 ATGTATGTGTGCATGTGCATG rs112636147 chr4:111781785-111781785 + A/G
67 hsa-mir-1200 MI0006332 CTCCTGAGCCATTCTGAGCCTC rs77814495 chr7:36959015-36959015 + A/G
68 hsa-mir-1203 MI0006335 CCGGAGCCAGGATGCAGCTC rs77574787 chr17:46233848-46233848 + G/T
69 hsa-mir-1304 MI0006371 TTTGAGGCTACAGTGAGATGTG rs79759099 chr11:93466909-93466909 + A/G seed
rs76857625 chr11:93466910-93466910 + A/G seed
70 hsa-mir-1291 MI0006353 TGGCCCTGACTGAAGACCAGCAGT rs77994717 chr12:49048277-49048277 + A/G
71 hsa-mir-1299 MI0006359 TTCTGGAATCCTACGTGAGGGA
rs79965448 chr9:69002294-69002294 + C/T
rs78546776 chr9:69002304-69002304 + A/C/G
rs76266132 chr9:69002317-69002317 + C/T seed
72 hsa-mir-548l MI0006361 AAAAGTATTTGCGGGTTTTGTC rs13447640 chr11:94199721-94199721 - C/T
73 hsa-mir-1268 MI0006405 CGGGCGTGGTGGTGGGGG rs28599926 chr15:22513271-22513271 + C/T seed
74 hsa-mir-1269 MI0006406 CTGGACTGAGCCGTGCTACTGG rs73239138 chr4:67142620-67142620 + A/G
75 hsa-mir-548h-3 MI0006413 AAAAGTAATCGCGGTTTTTGTC rs9913045 chr17:13446924-13446924 + A/G
76 hsa-mir-548h-4 MI0006414 AAAAGTAATCGCGGTTTTTGTC rs73235381 chr8:26906402-26906402 + C/T
77 hsa-mir-1275 MI0006415 GTGGGGGAGAGGCTGTC rs77821659 chr6:33967796-33967796 + A/C
78 hsa-mir-1276 MI0006416 TAAAGAGCCCTGTGGAGACA rs34381260 chr15:86313795-86313794 + -/T seed
79 hsa-mir-1255b-1 MI0006435 CGGATGAGCAAAGAAAGTGGTT rs6841938 chr4:36428048-36428048 + A/G
80 hsa-mir-1321 MI0006652 CAGGGAGGTGAATGTGAT rs36100620 chrX:85090853-85090852 + -/G
81 hsa-mir-1322 MI0006653 GATGATGCTGCTGATGCTG rs59878596 chr8:10682894-10682894 + C/T

103
miRNA Mature miRNA Sequence SNP ID Position Strand Allele REGION
82 hsa-mir-1911 MI0008332 TGAGTACCGCCATGTCTGTTGGG rs79202905 chrX:113997768-113997768 + A/G
83 hsa-mir-2053 MI0010487 GTGTTAATTAAACCTCTATTTAC rs10505168 chr8:113655752-113655752 - A/G
84 hsa-mir-2277 MI0011284 AGCGCGGGCTGAGCGCTGCCAGTC TGACAGCGCCCTGCCTGGCTC
rs73772915 chr5:92956422-92956422 + C/G
85 hsa-mir-3117 MI0014130 ATAGGACTCATATAGTGCCAG rs12402181 chr1:67094171-67094171 + A/G seed
86 hsa-mir-3118-2 MI0014132 TGTGACTGCATTATGAAAATTCT rs11488501 chr1:143424165-143424165 + C/T seed
87 hsa-mir-3118-3 MI0014133 TGTGACTGCATTATGAAAATTCT rs11488501 chr1:143424165-143424165 + C/T seed
88 hsa-mir-3124 MI0014140 TTCGCGGGCGAAGGCAAAGTC rs12081872 chr1:249120584-249120584 + C/T seed
89 hsa-mir-3125 MI0014142 TAGAGGAAGCTGTGGAGAGA rs33977954 chr2:12877503-12877502 + -/A
90 hsa-mir-3128 MI0014145 TCTGGCAAGTAAAAAACTCTCAT rs61130794 chr2:178120681-178120681 + G/T seed
91 hsa-mir-3130-1 MI0014147 TACCCAGTCTCCGGTGCAGCC GCTGCACCGGAGACTGGGTAA
rs2241347 chr2:207647981-207647981 - A/G
92 hsa-mir-3152 MI0014179 TGTGTTAGAATAGGGGCAATAA rs13299349 chr9:18573360-18573360 + A/G
93 hsa-mir-3130-2 MI0014148 TACCCAGTCTCCGGTGCAGCC GCTGCACCGGAGACTGGGTAA
rs2241347 chr2:207647981-207647981 - A/G
94 hsa-mir-548u MI0014168 CAAAGACTGCAATTACTTTTGCGC rs2397267 chr6:57254986-57254986 + A/G
rs2894843 chr6:57255001-57255001 + A/C
95 hsa-mir-3144 MI0014169 AGGGGACCAAAGAGATATATAG ATATACCTGTTCGGTCTCTTTA
rs67106263 chr6:120336384-120336384 + A/G
96 hsa-mir-3159 MI0014188 TAGGATTACAAGTGTCGGCCAC rs79957895 chr11:18409354-18409354 + A/G
97 hsa-mir-3161 MI0014191 CTGATAAGAACAGAGGCCCAGAT
rs11382316 chr11:48118350-48118349 + -/A seed
rs35834266 chr11:48118351-48118350 + -/A seed
rs74581179 chr11:48118351-48118351 + A/G
99 hsa-mir-323b MI0014206 AGGTTGTCCGTGGTGAGTTCGCA CCCAATACACGGTCGACCTCTT
rs75330474 chr14:101522589-101522589 + C/T
100 hsa-mir-3175 MI0014209 CGGGGAGAGAACGCAGTGACGT rs72647784 chr15:93447646-93447646 + -/GA
101 hsa-mir-3195 MI0014240 CGCGCCGGGCCCGGGTT rs1886009 chr20:60639883-60639883 + C/T
102 hsa-mir-3196 MI0014241 CGGGGCGGCAGGGGCCTC rs2273488 chr20:61870140-61870140 + C/T
103 hsa-mir-3198 MI0014246 GTGGAGTCCTGGGGAATGGAGA rs56660112 chr22:18246960-18246960 + C/G
104 hsa-mir-4293 MI0015826 CAGCCTGACAGGAACAG rs12220909 chr10:14425221-14425221 + C/G seed
105 hsa-mir-4302 MI0015833 CCAGTGTGGCTCAGCGAG rs11048315 chr12:26026988-26026988 + A/G/T
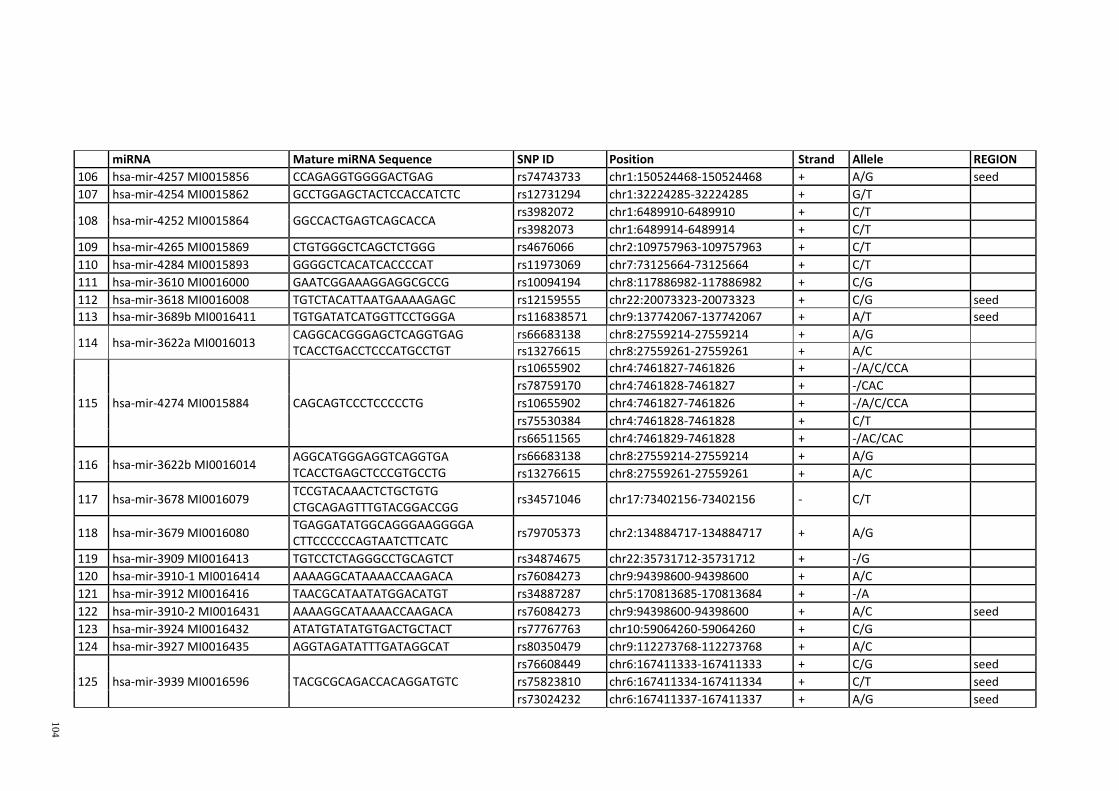
104
miRNA Mature miRNA Sequence SNP ID Position Strand Allele REGION
106 hsa-mir-4257 MI0015856 CCAGAGGTGGGGACTGAG rs74743733 chr1:150524468-150524468 + A/G seed
107 hsa-mir-4254 MI0015862 GCCTGGAGCTACTCCACCATCTC rs12731294 chr1:32224285-32224285 + G/T
108 hsa-mir-4252 MI0015864 GGCCACTGAGTCAGCACCA rs3982072 chr1:6489910-6489910 + C/T
rs3982073 chr1:6489914-6489914 + C/T
109 hsa-mir-4265 MI0015869 CTGTGGGCTCAGCTCTGGG rs4676066 chr2:109757963-109757963 + C/T
110 hsa-mir-4284 MI0015893 GGGGCTCACATCACCCCAT rs11973069 chr7:73125664-73125664 + C/T
111 hsa-mir-3610 MI0016000 GAATCGGAAAGGAGGCGCCG rs10094194 chr8:117886982-117886982 + C/G
112 hsa-mir-3618 MI0016008 TGTCTACATTAATGAAAAGAGC rs12159555 chr22:20073323-20073323 + C/G seed
113 hsa-mir-3689b MI0016411 TGTGATATCATGGTTCCTGGGA rs116838571 chr9:137742067-137742067 + A/T seed
114 hsa-mir-3622a MI0016013 CAGGCACGGGAGCTCAGGTGAG TCACCTGACCTCCCATGCCTGT
rs66683138 chr8:27559214-27559214 + A/G
rs13276615 chr8:27559261-27559261 + A/C
115 hsa-mir-4274 MI0015884 CAGCAGTCCCTCCCCCTG
rs10655902 chr4:7461827-7461826 + -/A/C/CCA
rs78759170 chr4:7461828-7461827 + -/CAC
rs10655902 chr4:7461827-7461826 + -/A/C/CCA
rs75530384 chr4:7461828-7461828 + C/T
rs66511565 chr4:7461829-7461828 + -/AC/CAC
116 hsa-mir-3622b MI0016014 AGGCATGGGAGGTCAGGTGA TCACCTGAGCTCCCGTGCCTG
rs66683138 chr8:27559214-27559214 + A/G
rs13276615 chr8:27559261-27559261 + A/C
117 hsa-mir-3678 MI0016079 TCCGTACAAACTCTGCTGTG CTGCAGAGTTTGTACGGACCGG
rs34571046 chr17:73402156-73402156 - C/T
118 hsa-mir-3679 MI0016080 TGAGGATATGGCAGGGAAGGGGA CTTCCCCCCAGTAATCTTCATC
rs79705373 chr2:134884717-134884717 + A/G
119 hsa-mir-3909 MI0016413 TGTCCTCTAGGGCCTGCAGTCT rs34874675 chr22:35731712-35731712 + -/G
120 hsa-mir-3910-1 MI0016414 AAAAGGCATAAAACCAAGACA rs76084273 chr9:94398600-94398600 + A/C
121 hsa-mir-3912 MI0016416 TAACGCATAATATGGACATGT rs34887287 chr5:170813685-170813684 + -/A
122 hsa-mir-3910-2 MI0016431 AAAAGGCATAAAACCAAGACA rs76084273 chr9:94398600-94398600 + A/C seed
123 hsa-mir-3924 MI0016432 ATATGTATATGTGACTGCTACT rs77767763 chr10:59064260-59064260 + C/G
124 hsa-mir-3927 MI0016435 AGGTAGATATTTGATAGGCAT rs80350479 chr9:112273768-112273768 + A/C
125 hsa-mir-3939 MI0016596 TACGCGCAGACCACAGGATGTC
rs76608449 chr6:167411333-167411333 + C/G seed
rs75823810 chr6:167411334-167411334 + C/T seed
rs73024232 chr6:167411337-167411337 + A/G seed

105
miRNA Mature miRNA Sequence SNP ID Position Strand Allele REGION
126 hsa-mir-3928 MI0016438 GGAGGAACCTTGGAGCTTCGGC
rs60197191 chr22:31556051-31556050 + -/AAAGCTC T TTGAAAA GCTGCC
rs72358191 chr22:31556059-31556058 + -/TTTGAAA A GCTGCCG AAGCTC
127 hsa-mir-642b MI0016685 AGACACATTTGGAGAGGGACCC rs78902025 chr19:46178206-46178206 + G/T
Table A.2: Homology search (BLAT) of 298 potential Homo sapiens SNPs in presursor miRNA (pre-miRNA) and mature miRNAs.
miRNA Mature miRNA Sequence SNP ID Position Strand Allele
1 hsa-mir-16-1 MI0000070 AGTATTAACTGTGCTGCTGA rs72631826 chr13:50623143-50623143 - C/T
2 hsa-mir-18a MI0000072 TAAGGTGCATCTAGTGCAGATAG rs41275866 chr13:92003009-92003009 + C/G
3 hsa-mir-25 MI0000082 AGGCGGAGACTTGGGCAATTG rs41274221 chr7:99691200-99691200 + C/T
4
hsa-mir-27a MI0000085 AGGGCTTAGCTGCTTGTGAGCA rs895819 chr19:13947292-13947292 + A/C/G/T
rs11671784 chr19:13947296-13947296 + A/G
5 hsa-mir-28 MI0000086 AAGGAGCTCACAGTCTATTGAG rs78547906 chr3:188406636-188406636 + C/T
6 hsa-mir-33a MI0000091 GTGCATTGTAGTTGCATTGCA rs71764233 chr22:42296506-42298976 + LARGE DELETION
rs77809319 chr22:42296995-42296995 + A/G
7 hsa-mir-93 MI0000095 AAAGTGCTGTTCGTGCAGGTAG rs72631824 chr7:99691429-99691429 - C/T
8 hsa-mir-96 MI0000098 TTTGGCACTAGCACATTTTTGCT rs73159662 chr7:129414568-129414568 + A/G
rs41274239 chr7:129414574-129414574 + A/G
9 hsa-mir-30c-2 MI0000254 CTGGGAGAAGGCTGTTTACTCT rs113749278 chr6:72086720-72086720 + A/G
10 hsa-mir-7-2 MI0000264 CAACAAATCCCAGTCTACCTAA rs41276930 chr15:89155073-89155073 + C/T
rs75737367 chr15:89155084-89155084 + A/C
11 hsa-mir-7-3 MI0000265 TGGAAGACTAGTGATTTTGTTGT rs76199191 chr19:4770697-4770697 + G/T
12 hsa-mir-10a MI0000266 TACCCTGTAGATCCGAATTTGTG rs72631828 chr17:46657289-46657289 - A/G
13 hsa-mir-34a MI0000268 TGGCAGTGTCTTAGCTGGTTGT rs72631823 chr1:9211782-9211782 - A/G
14 hsa-mir-182 MI0000272 TTTGGCAATGGTAGAACTCACACT rs76481776 chr7:129410227-129410227 + C/T
rs77586312 chr7:129410228-129410228 + A/G
rs75953509 chr7:129410235-129410235 + C/T
rs80041074 chr7:129410239-129410239 + C/T
15 hsa-mir-183 MI0000273 TATGGCACTGGTAGAATTCACT rs72631833 chr7:129414804-129414804 - G/T
16 hsa-mir-204 MI0000284 TTCCCTTTGTCATCCTATGCCT rs112971695 chr9:73424988-73424988 + A/G

106
miRNA Mature miRNA Sequence SNP ID Position Strand Allele
17 hsa-mir-187 MI0000274 TCGTGTCTTGTGTTGCAGCCGG rs114964240 chr18:33484783-33484783 + C/T
rs41274312 chr18:33484792-33484792 + A/G
18 hsa-mir-199b MI0000282 CCCAGTGTTTAGACTATCTGTTC ACAGTAGTCTGCACATTGGTTA
rs72631835 chr9:131007109-131007109 - C/T
19 hsa-mir-205 MI0000285 TCCTTCATTCCACCGGAGTCTG rs113859371 chr1:209605546-209605546 + C/T
20 hsa-mir-211 MI0000287 TTCCCTTTGTCATCCTTCGCCT rs34520022 chr15:31357246-31357245 + -/G
21 hsa-mir-215 MI0000291 ATGACCTATGAATTGACAGAC rs72631834 chr1:220291292-220291292 - C/T
22 hsa-mir-216a MI0000292 TAATCTCAGCTGGCAACTGTGA rs41291179 chr2:56216090-56216090 + A/T
23 hsa-mir-217 MI0000293 TACTGCATCAGGAACTGATTGGA rs41291173 chr2:56210140-56210140 + A/G
24 hsa-mir-222 MI0000299 CTCAGTAGCCAGTGTAGATCCT AGCTACATCTGGCTACTGGGT
rs72631825 chrX:45606471-45606471 - A/G
25 hsa-mir-223 MI0000300 CGTGTATTTGACAAGCTGAGTT TGTCAGTTTGTCAAATACCCCA
rs34952329 chrX:65238768-65238767 + -/C
26 hsa-mir-200b MI0000342 CATCTTACTGGGCAGCATTGGA TAATACTGCCTGGTAATGATGA
rs72563729 chr1:1102563-1102563 + A/G
27 hsa-mir-30b MI0000441 TGTAAACATCCTACACTCAGCT CTGGGAGGTGGATGTTTACTTC
rs111424617 chr8:135812836-135812836 - C/T
28 hsa-mir-124-2 MI0000444 CGTGTTCACAGCGGACCTTGAT TAAGGCACGCGGTGAATGCC
rs72631829 chr8:65291808-65291808 + A/G
29 hsa-mir-128-1 MI0000447 TCACAGTGAACCGGTCTCTTT rs117812383 chr2:136422988-136422988 + A/G
30 hsa-mir-140 MI0000456 CAGTGGTTTTACCCTATGGTAG TACCACAGGGTAGAACCACGG
rs7205289 chr16:68524506-68524506 + A/C
31 hsa-mir-141 MI0000457 CATCTTCCAGTACAGTGTTGGA TAACACTGTCTGGTAAAGATGG
rs34385807 chr12:6943606-6943605 + -/C
32 hsa-mir-152 MI0000462 TCAGTGCATGACAGAACTTGG rs67214557 chr17:43468372-43473043 + LARGE DELETION
33 hsa-mir-9-2 MI0000467 TCTTTGGTTATCTAGCTGTATGA ATAAAGCTAGATAACCGAAAGT
rs41265488 chr5:87998503-87998503 + A/T
34 hsa-mir-149 MI0000478 TCTGGCTCCGTGTCTTCACTCCC AGGGAGGGACGGGGGCTGTGC
rs71428439 chr2:241044173-241044173 + A/G
rs2292832 chr2:241044176-241044176 + C/T
35 hsa-mir-184 MI0000481 TGGACGGAGAACTGATAAGGGT rs41280052 chr15:77289223-77289223 + G/T
36 hsa-mir-193a MI0000487 TGGGTCTTTGCGGGCGAGATGA AACTGGCCTACAAAGTCCCAGT
rs60406007 chr17:26911146-26911146 + G/T

107
miRNA Mature miRNA Sequence SNP ID Position Strand Allele
37 hsa-mir-1-1 MI0000651 TGGAATGTAAAGAAGTATGTAT rs6122014 chr20:60561960-60561960 - C/T
38 hsa-mir-194-2 MI0000732 CCAGTGGGGCTGCTGTTATCTG rs11231898 chr11:64415412-64415412 + A/G
39 hsa-mir-106b MI0000734 TAAAGTGCTGACAGTGCAGAT CCGCACTGTGGGTACTTGCTGCTC
rs72631827 chr7:99529588-99529588 - G/T
40 hsa-mir-299 MI0000744 TGGTTTACCGTCCCACAT TATGTGGGATGGTAAACCGCTT
rs72172875 chr14:100558894-100568278 + LARGE DELETION
41 hsa-mir-130b MI0000748 ACTCTTTCCCTGTTGCACTAC CAGTGCAATGATGAAAGGGCAT
rs72631822 chr22:20337634-20337634 + A/G
42 hsa-mir-365-2 MI0000769 AGGGACTTTCAGGGGCAGCTGTGT TAATGCCCCTAAAAATCCTTAT
rs35143473 chr17:29902519-29902519 + -/T
43 hsa-mir-379 MI0000787 TGGTAGACTATGGAACGTAGG TATGTAACATGGTCCACTAACT
rs115827677 chr14:101488430-101488430 + A/G
44 hsa-mir-326 MI0000808 CCTCTGGGCCCTTCCTCCAG rs72561778 chr11:75046227-75046227 - A/G
45 hsa-mir-339 MI0000815 TCCCTGTCCTCCAGGAGCTCACG TGAGCGCCTCGACGACAGAGCCG
rs13232101 chr7:1062574-1062574 + G/T
rs72631831 chr7:1062656-1062656 - A/G
46 hsa-mir-133b MI0000822 TTGGTCCCCTTCAACCAGCTA rs112599381 chr6:52013754-52013754 + C/T
47 hsa-mir-325 MI0000824 CCTAGTAGGTGTCCAGTAAGTGT rs72631830 chrX:76225915-76225915 - G/T
48 hsa-mir-345 MI0000825 CTGACTCCTAGTCCAGGGCTC rs72631832 chr14:100774203-100774203 + C/T
rs114693307 chr14:100774289-100774289 + A/C
49 hsa-mir-423 MI0001445 TGAGGGGCAGAGAGCGAGACTTT AGCTCGGTCTGAGGCCCCTCAGT
rs6505162 chr17:28444183-28444183 + A/C
50 hsa-mir-449a MI0001648 TGGCAGTGTATTGTTAGCTGGT rs112310158 chr5:54466378-54466378 + A/G
51 hsa-mir-431 MI0001721 TGTCTTGCAGGCCGTCATGCA CAGGTCGTCTTGCAGGGCTTCT
rs76090066 chr14:101347355-101347355 + C/T
52 hsa-mir-329-1 MI0001725 AACACACCTGGTTAACCTCTTT rs34557733 chr14:101493130-101493129 + -/A
53 hsa-mir-412 MI0002464 ACTTCACCTGGTCCACTAGCCGT rs115831106 chr14:101531806-101531806 + C/T
54 hsa-mir-484 MI0002468 TCAGGCTCAGTCCCCTCCCGAT rs112103086 chr16:15737217-15737217 + G/T
rs112906136 chr16:15737218-15737218 + A/G
55 hsa-mir-486 MI0002470 TCCTGTACTGAGCTGCCCCGAG CGGGGCAGCTCAGTACAGGAT
rs59908561 chr8:41517960-41517959 + -/G
rs72177614 chr8:41517961-41517960 + -/G
56 hsa-mir-489 MI0003124 GTGACATCACATATACGGCAGC rs35930643 chr7:93113324-93113323 + -/A
57 hsa-mir-496 MI0003136 TGAGTATTACATGGCCAATCT rs79307187 chr14:101526957-101526957 + A/C
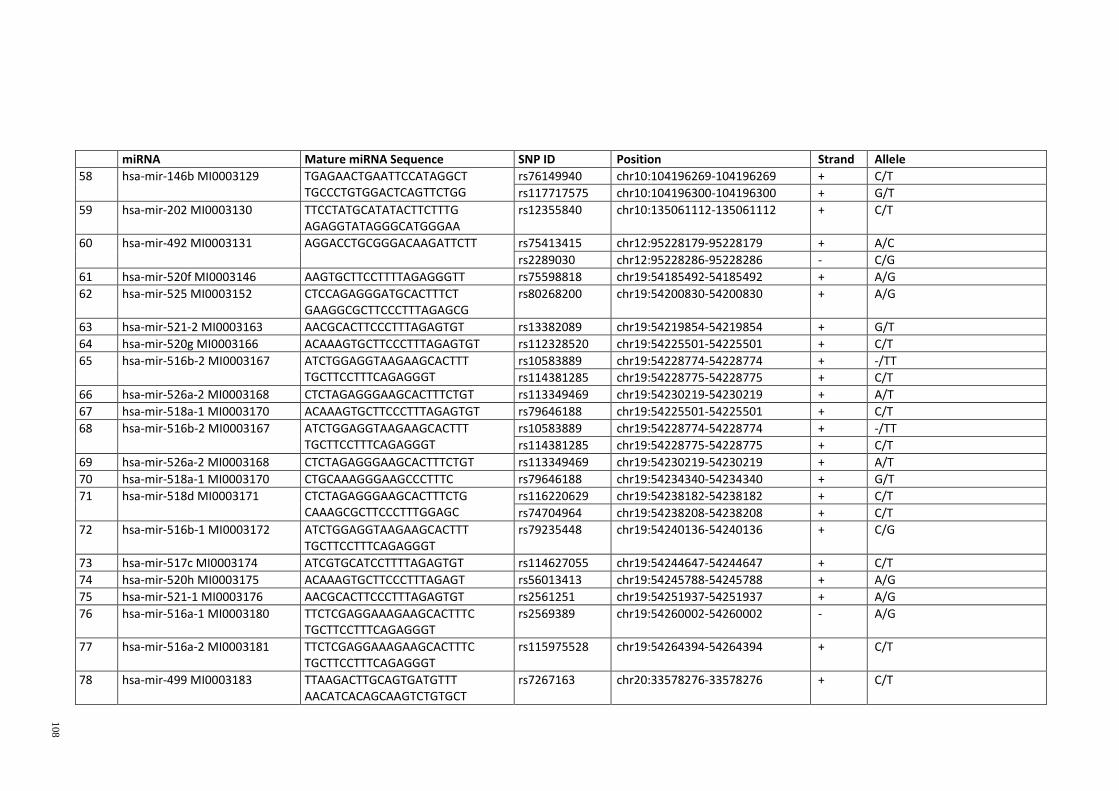
108
miRNA Mature miRNA Sequence SNP ID Position Strand Allele
58 hsa-mir-146b MI0003129 TGAGAACTGAATTCCATAGGCT TGCCCTGTGGACTCAGTTCTGG
rs76149940 chr10:104196269-104196269 + C/T
rs117717575 chr10:104196300-104196300 + G/T
59 hsa-mir-202 MI0003130 TTCCTATGCATATACTTCTTTG AGAGGTATAGGGCATGGGAA
rs12355840 chr10:135061112-135061112 + C/T
60 hsa-mir-492 MI0003131 AGGACCTGCGGGACAAGATTCTT rs75413415 chr12:95228179-95228179 + A/C
rs2289030 chr12:95228286-95228286 - C/G
61 hsa-mir-520f MI0003146 AAGTGCTTCCTTTTAGAGGGTT rs75598818 chr19:54185492-54185492 + A/G
62 hsa-mir-525 MI0003152 CTCCAGAGGGATGCACTTTCT GAAGGCGCTTCCCTTTAGAGCG
rs80268200 chr19:54200830-54200830 + A/G
63 hsa-mir-521-2 MI0003163 AACGCACTTCCCTTTAGAGTGT rs13382089 chr19:54219854-54219854 + G/T
64 hsa-mir-520g MI0003166 ACAAAGTGCTTCCCTTTAGAGTGT rs112328520 chr19:54225501-54225501 + C/T
65 hsa-mir-516b-2 MI0003167 ATCTGGAGGTAAGAAGCACTTT TGCTTCCTTTCAGAGGGT
rs10583889 chr19:54228774-54228774 + -/TT
rs114381285 chr19:54228775-54228775 + C/T
66 hsa-mir-526a-2 MI0003168 CTCTAGAGGGAAGCACTTTCTGT rs113349469 chr19:54230219-54230219 + A/T
67 hsa-mir-518a-1 MI0003170 ACAAAGTGCTTCCCTTTAGAGTGT rs79646188 chr19:54225501-54225501 + C/T
68 hsa-mir-516b-2 MI0003167 ATCTGGAGGTAAGAAGCACTTT TGCTTCCTTTCAGAGGGT
rs10583889 chr19:54228774-54228774 + -/TT
rs114381285 chr19:54228775-54228775 + C/T
69 hsa-mir-526a-2 MI0003168 CTCTAGAGGGAAGCACTTTCTGT rs113349469 chr19:54230219-54230219 + A/T
70 hsa-mir-518a-1 MI0003170 CTGCAAAGGGAAGCCCTTTC rs79646188 chr19:54234340-54234340 + G/T
71 hsa-mir-518d MI0003171 CTCTAGAGGGAAGCACTTTCTG CAAAGCGCTTCCCTTTGGAGC
rs116220629 chr19:54238182-54238182 + C/T
rs74704964 chr19:54238208-54238208 + C/T
72 hsa-mir-516b-1 MI0003172 ATCTGGAGGTAAGAAGCACTTT TGCTTCCTTTCAGAGGGT
rs79235448 chr19:54240136-54240136 + C/G
73 hsa-mir-517c MI0003174 ATCGTGCATCCTTTTAGAGTGT rs114627055 chr19:54244647-54244647 + C/T
74 hsa-mir-520h MI0003175 ACAAAGTGCTTCCCTTTAGAGT rs56013413 chr19:54245788-54245788 + A/G
75 hsa-mir-521-1 MI0003176 AACGCACTTCCCTTTAGAGTGT rs2561251 chr19:54251937-54251937 + A/G
76 hsa-mir-516a-1 MI0003180 TTCTCGAGGAAAGAAGCACTTTC TGCTTCCTTTCAGAGGGT
rs2569389 chr19:54260002-54260002 - A/G
77 hsa-mir-516a-2 MI0003181 TTCTCGAGGAAAGAAGCACTTTC TGCTTCCTTTCAGAGGGT
rs115975528 chr19:54264394-54264394 + C/T
78 hsa-mir-499 MI0003183 TTAAGACTTGCAGTGATGTTT AACATCACAGCAAGTCTGTGCT
rs7267163 chr20:33578276-33578276 + C/T

109
miRNA Mature miRNA Sequence SNP ID Position Strand Allele
79 hsa-mir-513a-2 MI0003192 TTCACAGGGAGGTGTCAT TAAATTTCACCTTTCTGAGAAGG
rs111970838 chrX:146307449-146307449 + G/T
80 hsa-mir-514-1 MI0003198 ATTGACACTTCTGTGAGTAGA rs113816728 chrX:146360845-146360845 + C/T
81 hsa-mir-532 MI0003205 CATGCCTTGAGTGTAGGACCGT CCTCCCACACCCAAGGCTTGCA
rs456615 chrX:49767832-49767832 + A/G
rs456617 chrX:49767835-49767835 + A/G
82 hsa-mir-553 MI0003558 AAAACGGTGAGATTTTGTTTT rs112891767 chr1:100746855-100746855 + C/T
83 hsa-mir-554 MI0003559 GCTAGTCCTGACTCAGCCAGT rs79661940 chr1:151518284-151518284 + G/T
84 hsa-mir-555 MI0003561 AGGGTAAGCTGAACCTCTGAT rs113306711 chr1:155316214-155316214 + C/T
85 hsa-mir-558 MI0003564 TGAGCTGCTGTACCAAAAT rs72089144 chr2:32757231-32757230 + -/GTGT
rs71953654 chr2:32757232-32757231 + -/TGTGTGTGTG
rs35999329 chr2:32757239-32757238 + -/TGTG
rs72215615 chr2:32757240-32757239 + -/TGTG
86 hsa-mir-559 MI0003565 TAAAGTAAATATGCACCAAAA rs114803590 chr2:47604856-47604856 + C/T
rs58450758 chr2:47604866-47604866 + C/T
87 hsa-mir-561 MI0003567 CAAAGTTTAAGATCCTTGAAGT rs112456539 chr2:189162257-189162257 + A/G
88 hsa-mir-564 MI0003570 AGGCAACATGGCCGAGAGGC rs114636202 chr3:44903385-44903385 + A/G
rs2292181 chr3:44903434-44903434 + C/G
89 hsa-mir-567 MI0003573 AGTATGTTCTTCCAGGACAGAAC rs115707679 chr3:111831722-111831722 + A/C
rs76778672 chr3:111831736-111831736 + -/AA
rs67780840 chr3:111831725-111831724 + -/A
rs71704738 chr3:111831738-111831737 + -/AAAA
90 hsa-mir-569 MI0003576 AGTTAATGAATCCTGGAAAGT rs73037390 chr3:170824453-170824453 + A/C
rs116867000 chr3:170824459-170824459 + A/G
91 hsa-mir-570 MI0003577 CGAAAACAGCAATTACCTTTGC rs9860655 chr3:195426305-195426305 + C/T
92 hsa-mir-581 MI0003588 TCTTGTGTTCTCTAGATCAGT rs788517 chr5:53247386-53247386 - A/G
93 hsa-mir-573 MI0003580 CTGAAGTGATGTGTAACTGATCAG rs76014664 chr4:24521902-24521902 + A/G
rs113070835 chr4:24521822-24521822 + C/T
rs77543406 chr4:24521910-24521910 + A/T
rs78830737 chr4:24521904-24521904 + A/G
94 hsa-mir-576 MI0003583 ATTCTAATTTCTCCACGTCTTT AAGATGTGGAAAAATTGGAATC
rs77639117 chr4:110409933-110409933 + A/T
95 hsa-mir-583 MI0003590 CAAAGAGGAAGGTCCCATTAC rs10697860 chr5:95414852-95414851 + -/ATAAA

110
miRNA Mature miRNA Sequence SNP ID Position Strand Allele
96 hsa-mir-577 MI0003584 TAGATAAAATATTGGTACCTG rs79560193 chr4:115577921-115577921 + A/G
rs34115976 chr4:115577997-115577997 + C/G
97 hsa-mir-580 MI0003587 TTGAGAATGATGAATCATTAGG rs115089112 chr5:36148057-36148057 + C/T
rs73080005 chr5:36148054-36148054 + G/T
98 hsa-mir-585 MI0003592 TGGGCGTATCTGTATGCTA rs115473017 chr5:168690611-168690611 + C/T
rs62376934 chr5:168690612-168690612 + A/G
99 hsa-mir-548a-1 MI0003593 CAAAACTGGCAATTACTTTTGC rs12197631 chr6:18572056-18572056 + G/T
100 hsa-mir-586 MI0003594 TATGCATTGTATTTTTAGGTCC rs73735310 chr6:45165473-45165473 + A/G
101 hsa-mir-550a-1 MI0003600 AGTGCCTGAGGGAGTAAGAGCCC TGTCTTACTCCCTCAGGCACAT
rs71528599 chr7:30329467-30329467 + C/T
102 hsa-mir-550a-2 MI0003601 AGTGCCTGAGGGAGTAAGAGCCC TGTCTTACTCCCTCAGGCACAT
rs113464681 chr7:32772637-32772639 + -/TGT
103 hsa-mir-595 MI0003607 GAAGTGTGCCGTGGTGTGTCT rs117344178 chr7:158325411-158325411 + C/T
rs114151270 chr7:158325415-158325415 + C/T
rs4909237 chr7:158325503-158325503 + C/T
104 hsa-mir-596 MI0003608 AAGCCTGCCCGGCTCCTCGGG rs116450906 chr8:1765409-1765409 + C/T
rs111606748 chr8:1765435-1765435 + C/T
105 hsa-mir-597 MI0003609 TGTGTGTCACTCGATGACCACTGT rs79397096 chr8:9599276-9599276 + A/G
106 hsa-mir-548a-3 MI0003612 AAAAGTAATTGCGAGTTTTACC rs71297276 chr8:105496638-105496638 + -/TGAAAGTAAT
107 hsa-mir-602 MI0003615 GACACGGGCGACAGCTGCGGCCC rs116636751 chr9:140732963-140732963 + C/T
108 hsa-mir-603 MI0003616 CACACACTGCAATTACTTTTGCT rs79500031 chr10:24564632-24564632 + G/T
rs11014002 chr10:24564653-24564653 + C/T
109 hsa-mir-604 MI0003617 AGGCTGCGGAATTCAGGAC rs2368393 chr10:29833998-29833998 - C/T
rs2368392 chr10:29834003-29834003 - C/T
110 hsa-mir-605 MI0003618 TAAATCCCATGGTGCCTTCTCCT rs2043556 chr10:53059406-53059406 - A/G
111 hsa-mir-607 MI0003620 GTTCAAATCCAGATCTATAAC rs115264283 chr10:98588440-98588440 + A/G
rs12778876 chr10:98588495-98588495 + A/T
rs12780546 chr10:98588496-98588496 + A/T
112 hsa-mir-609 MI0003622 AGGGTGTTTCTCTCATCTCT rs74154754 chr10:105978581-105978581 + C/G
113 hsa-mir-611 MI0003624 GCGAGGACCCCTCGGGGTCTGAC rs111585800 chr11:61560026-61560026 + A/T
114 hsa-mir-612 MI0003625 GCTGGGCAGGGCTTCTGAGCTCCTT rs550894 chr11:65211940-65211940 - G/T
rs12803915 chr11:65211979-65211979 + A/G
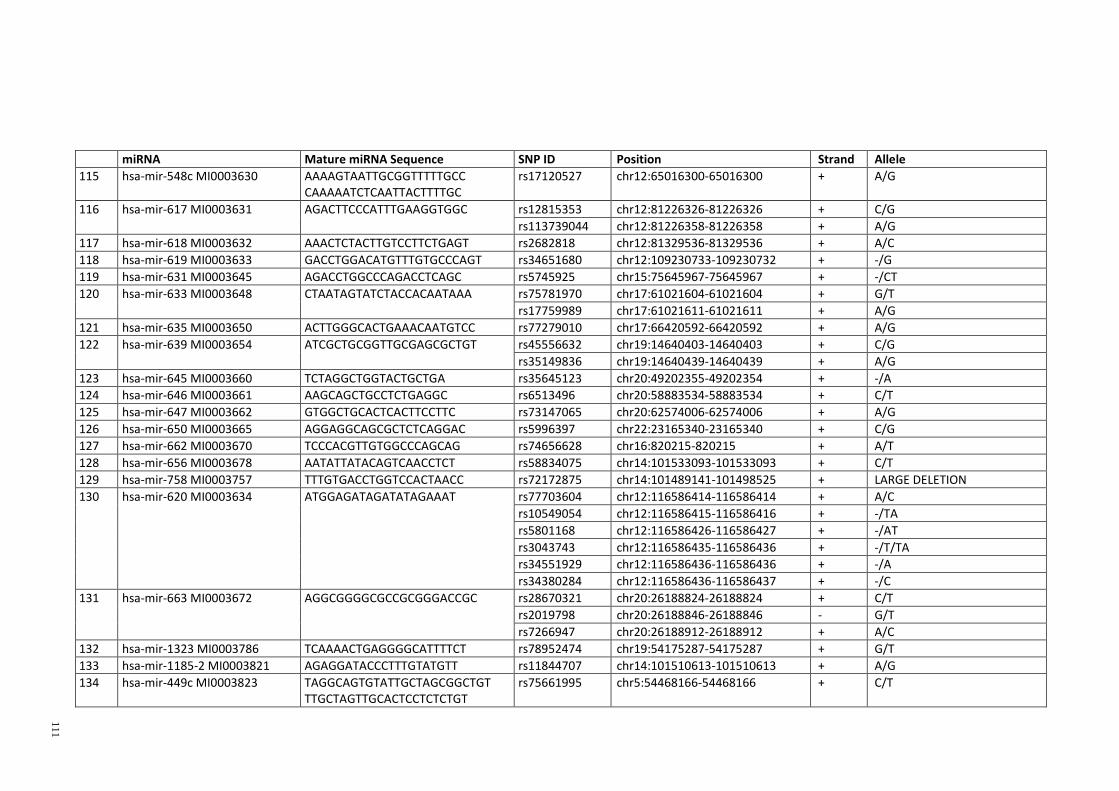
111
miRNA Mature miRNA Sequence SNP ID Position Strand Allele
115 hsa-mir-548c MI0003630 AAAAGTAATTGCGGTTTTTGCC CAAAAATCTCAATTACTTTTGC
rs17120527 chr12:65016300-65016300 + A/G
116 hsa-mir-617 MI0003631 AGACTTCCCATTTGAAGGTGGC rs12815353 chr12:81226326-81226326 + C/G
rs113739044 chr12:81226358-81226358 + A/G
117 hsa-mir-618 MI0003632 AAACTCTACTTGTCCTTCTGAGT rs2682818 chr12:81329536-81329536 + A/C
118 hsa-mir-619 MI0003633 GACCTGGACATGTTTGTGCCCAGT rs34651680 chr12:109230733-109230732 + -/G
119 hsa-mir-631 MI0003645 AGACCTGGCCCAGACCTCAGC rs5745925 chr15:75645967-75645967 + -/CT
120 hsa-mir-633 MI0003648 CTAATAGTATCTACCACAATAAA rs75781970 chr17:61021604-61021604 + G/T
rs17759989 chr17:61021611-61021611 + A/G
121 hsa-mir-635 MI0003650 ACTTGGGCACTGAAACAATGTCC rs77279010 chr17:66420592-66420592 + A/G
122 hsa-mir-639 MI0003654 ATCGCTGCGGTTGCGAGCGCTGT rs45556632 chr19:14640403-14640403 + C/G
rs35149836 chr19:14640439-14640439 + A/G
123 hsa-mir-645 MI0003660 TCTAGGCTGGTACTGCTGA rs35645123 chr20:49202355-49202354 + -/A
124 hsa-mir-646 MI0003661 AAGCAGCTGCCTCTGAGGC rs6513496 chr20:58883534-58883534 + C/T
125 hsa-mir-647 MI0003662 GTGGCTGCACTCACTTCCTTC rs73147065 chr20:62574006-62574006 + A/G
126 hsa-mir-650 MI0003665 AGGAGGCAGCGCTCTCAGGAC rs5996397 chr22:23165340-23165340 + C/G
127 hsa-mir-662 MI0003670 TCCCACGTTGTGGCCCAGCAG rs74656628 chr16:820215-820215 + A/T
128 hsa-mir-656 MI0003678 AATATTATACAGTCAACCTCT rs58834075 chr14:101533093-101533093 + C/T
129 hsa-mir-758 MI0003757 TTTGTGACCTGGTCCACTAACC rs72172875 chr14:101489141-101498525 + LARGE DELETION
130 hsa-mir-620 MI0003634 ATGGAGATAGATATAGAAAT rs77703604 chr12:116586414-116586414 + A/C
rs10549054 chr12:116586415-116586416 + -/TA
rs5801168 chr12:116586426-116586427 + -/AT
rs3043743 chr12:116586435-116586436 + -/T/TA
rs34551929 chr12:116586436-116586436 + -/A
rs34380284 chr12:116586436-116586437 + -/C
131 hsa-mir-663 MI0003672 AGGCGGGGCGCCGCGGGACCGC rs28670321 chr20:26188824-26188824 + C/T
rs2019798 chr20:26188846-26188846 - G/T
rs7266947 chr20:26188912-26188912 + A/C
132 hsa-mir-1323 MI0003786 TCAAAACTGAGGGGCATTTTCT rs78952474 chr19:54175287-54175287 + G/T
133 hsa-mir-1185-2 MI0003821 AGAGGATACCCTTTGTATGTT rs11844707 chr14:101510613-101510613 + A/G
134 hsa-mir-449c MI0003823 TAGGCAGTGTATTGCTAGCGGCTGT TTGCTAGTTGCACTCCTCTCTGT
rs75661995 chr5:54468166-54468166 + C/T

112
miRNA Mature miRNA Sequence SNP ID Position Strand Allele
135 hsa-mir-1283-1 MI0003832 TCTACAAAGGAAAGCGCTTTCT rs57111412 chr19:54191743-54191743 + A/G
136 hsa-mir-759 MI0004065 GCAGAGTGCAAACAATTTTGAC rs77079459 chr13:53384256-53384256 + G/T
137 hsa-mir-891a MI0005524 TGCAACGAACCTGAGCCACTGA rs5965990 chrX:145109356-145109356 + A/G
138 hsa-mir-300 MI0005525 TATACAAGGGCAGACTCTCTCT rs12894467 chr14:101507727-101507727 + C/T
139 hsa-mir-888 MI0005537 TACTCAAAAAGCTGTCAGTCA GACTGACACCTCTTTGGGTGAA
rs5965660 chrX:145076302-145076302 + G/T
140 hsa-mir-147b MI0005544 GTGTGCGGAAATGCTTCTGCTA rs56073218 chr15:45725255-45725255 + C/G
141 hsa-mir-543 MI0005565 AAACATTCGCGGTGCACTTCTT rs72172875 chr14:101489141-101498525 + LARGE DELETION
142 hsa-mir-920 MI0005712 GGGGAGCTGTGGAAGCAGTA rs66686007 chr12:24365358-24365358 + -/GTTGT
143 hsa-mir-934 MI0005756 TGTCTACTACTGGAGACACTGG rs73558572 chrX:135633045-135633045 + A/G
144 hsa-mir-941-1 CACCCGGCTGTGTGCACATGTGC rs4809383 chr20:62550780-62550780 + C/T
rs7262125 chr20:62550791-62550791 + A/G
rs56202554 chr20:62550794-62550794 + C/T
rs7268785 chr20:62550806-62550806 + C/G
rs55795631 chr20:62550877-62550877 + C/T
145 hsa-mir-944 MI0005769 AAATTATTGTACATCGGATGAG rs75715827 chr3:189547735-189547735 + C/T
146 hsa-mir-941-1 CACCCGGCTGTGTGCACATGTGC rs6089780 chr20:62550880-62550880 + A/G
rs6090019 chr20:62550890-62550890 + C/T
147 hsa-mir-941-2 CACCCGGCTGTGTGCACATGTGC rs55795631 chr20:62550877-62550877 + C/T
rs6089780 chr20:62550880-62550880 + A/G
rs6090019 chr20:62550890-62550890 + C/T
rs72366056 chr20:62551075-62551101 + -/AGGACAGC GC CACGGAAGAGGACGCAC
rs34604519 chr20:62551169-62551169 + C/G
rs7360929 chr20:62551199-62551199 + C/T
148 hsa-mir-943 CTGACTGTTGCCGTCCTCCAG rs3034718 chr4:1988189-1988188 + -/CT
rs35401110 chr4:1988190-1988189 + -/CT
rs1077020 chr4:1988193-1988193 + C/T
149 hsa-mir-941-4 CACCCGGCTGTGTGCACATGTGC rs7360929 chr20:62551199-62551199 + C/T
rs12625445 chr20:62551225-62551225 + C/G
rs35544770 chr20:62551272-62551272 + A/G
rs12625454 chr20:62551281-62551281 + C/G

113
miRNA Mature miRNA Sequence SNP ID Position Strand Allele
150 hsa-mir-297 MI0005775 ATGTATGTGTGCATGTGCATG rs113258805 chr4:111781746-111781746 + A/G
151 hsa-mir-1181 MI0006274 CCGTCGCCGCCACCCGAGCCG rs2569788 chr19:10514159-10514159 + C/G
152 hsa-mir-1178 MI0006271 TTGCTCACTGTTCTTCCCTAG rs7311975 chr12:120151493-120151493 + C/T
rs74614893 chr12:120151501-120151501 + A/G
153 hsa-mir-1227 MI0006316 CGTGCCACCCTTTTCCCCAG rs74807305 chr19:2234086-2234086 + A/T
154 hsa-mir-1229 MI0006319 CTCTCACCACTGCCCTCCCACAG rs2291418 chr5:179225324-179225324 + C/T
155a hsa-mir-1234 MI0006324 TCGGCCTGACCACCCACCCCAC rs75169642 chr8:145625535-145625535 + C/G
rs2291134 chr8:145625536-145625536 + C/G
155b hsa-mir-1234 MI0006324 TCGGCCTGACCACCCACCCCAC rs66769762 chr8:145625537-145625537 + -/GG
rs76908615 chr8:145625542-145625542 + -/CC
156 hsa-mir-1206 MI0006339 TGTTCATGTAGATGTTTAAGC rs2114358 chr8:129021179-129021179 - C/T
157 hsa-mir-1286 MI0006348 TGCAGGACCAAGATGAGCCCT rs71312743 chr22:20236701-20236701 + A/C
158 hsa-mir-1287 MI0006349 TGCTGGATCAGTGGTTCGAGTC rs78666598 chr10:100155019-100155019 + A/T
159 hsa-mir-663b MI0006336 GGTGGCCCGGCCGTGCCTGAGG rs62165009 chr2:133014579-133014579 + A/G
rs75245503 chr2:133014602-133014602 + C/G
rs74853538 chr2:133014612-133014612 + A/C
rs78327226 chr2:133014619-133014619 + C/T
rs78867621 chr2:133014640-133014640 + C/T
160 hsa-mir-1208 MI0006341 TCACTGTTCAGACAGGCGGA rs56863230 chr8:129162366-129162366 + C/G
rs2648841 chr8:129162433-129162433 - A/C
rs4822739 chr22:26951185-26951185 + C/G
rs12161068 chr22:26951215-26951215 + C/T
161 hsa-mir-1289-2 TGGAGTCCAGGAATCTGCATTTTT rs35296450 chr5:132763295-132763295 + C/G
rs35731356 chr5:132763305-132763304 + -/G
rs74634410 chr5:132763305-132763305 + G/T
rs75310044 chr5:132763335-132763335 + A/C
162 hsa-mir-1290 MI0006352 TGGATTTTTGGATCAGGGA rs75705742 chr1:19223639-19223639 + A/G
163 hsa-mir-1294 MI0006356 TGTGAGGTTGGCATTGTTGTCT rs13186787 chr5:153726769-153726769 + A/G
164 hsa-mir-1299 MI0006359 TTCTGGAATCCTACGTGAGGGA rs62555121 chr9:69002271-69002271 + A/T
165 hsa-mir-548l MI0006361 AAAAGTATTTGCGGGTTTTGTC rs11020790 chr11:94199710-94199710 + C/T
166 hsa-mir-1302-1 MI0006362 TTAAATTTGAATTTCAAGTAAA rs74647838 chr12:113132901-113132901 + A/G
167 hsa-mir-548f-5 MI0006378 AAAAACTGTAATTACTTTT rs60180387 chrX:32659592-32659592 + C/T

114
miRNA Mature miRNA Sequence SNP ID Position Strand Allele
168a hsa-mir-1303 MI0006370 TTTAGAGACGGGGTCTTGCTCT rs77055126 chr5:154065348-154065348 + C/T
rs75378399 chr5:154065368-154065368 + A/T
rs75538180 chr5:154065383-154065383 + A/T
168b hsa-mir-1303 MI0006370 TTTAGAGACGGGGTCTTGCTCT rs34889453 chr5:154065383-154065383 + -/A
rs33982250 chr5:154065385-154065385 + -/A
169 hsa-mir-1304 MI0006371 TTTGAGGCTACAGTGAGATGTG rs2155248 chr11:93466866-93466866 - A/C
rs79462725 chr11:93466919-93466919 + C/G
170 hsa-mir-1248 MI0006383 ACCTTCTTGTATAAGCACTGTGCTAAA rs73063489 chr3:186504532-186504532 + C/T
171 hsa-mir-1255a MI0006389 AGGATGAGCAAAGAAAGTAGATT rs28664200 chr4:102251501-102251501 + C/T
172 hsa-mir-1253 MI0006387 AGAGAAGAAGATCAGCCTGCA rs7217038 chr17:2651377-2651377 + A/T
rs77498226 chr17:2651405-2651405 + G/T
173 hsa-mir-1260 MI0006394 ATCCCACCTCTGCCACCA rs28909969 chr14:77732628-77732628 - -/T
174 hsa-mir-1265 MI0006401 CAGGATGTGGTCAAGTGTTGTT rs11259096 chr10:14478618-14478618 + C/T
175 hsa-mir-548o MI0006402 CCAAAACTGCAGTTACTTTTGC rs79628069 chr7:102046296-102046296 + G/T
176 hsa-mir-1267 MI0006404 CCTGTTGAAGTGTAATCCCCA rs76080861 chr13:108183538-108183538 + C/T
177 hsa-mir-1274a MI0006410 GTCCCTGTTCAGGCGCCA rs318039 chr5:41475766-41475766 + C/T
178 hsa-mir-548h-4 MI0006414 AAAAGTAATCGCGGTTTTTGTC rs73235382 chr8:26906437-26906437 + A/G/T
rs74273836 chr8:26906437-26906441 + -/AGTAA
179 hsa-mir-1275 MI0006415 GTGGGGGAGAGGCTGTC rs76156362 chr6:33967787-33967787 + A/T
180 hsa-mir-548i-1 MI0006421 AAAAGTAATTGCGGATTTTGCC rs34864809 chr3:125509375-125509374 + -/G
181 hsa-mir-548i-4 MI0006424 AAAAGTAATTGCGGATTTTGCC rs72632467 chrX:83480764-83480764 + A/G
182 hsa-mir-1282 MI0006429 TCGTTTGCCTTTTTCTGCTT rs11269 chr15:44085909-44085909 + G/T
183 hsa-mir-1283-2 MI0006430 TCTACAAAGGAAAGCGCTTTCT rs71363366 chr19:54261549-54261549 + C/G
184 hsa-mir-1292 MI0006433 TGGGAACGGGTTCCGGCAGACGCT rs73576045 chr20:2633466-2633466 + C/T
185 hsa-mir-1255b-2 MI0006436 CGGATGAGCAAAGAAAGTGGTT rs79639536 chr1:167967958-167967958 + A/G
186 hsa-mir-1307 MI0006444 ACTCGGCGTGGCGTCGGTCGTG rs7911488 chr10:105154089-105154089 + A/G
187 hsa-mir-1322 MI0006653 GATGATGCTGCTGATGCTG rs76657610 chr8:10682923-10682923 + C/T
188 hsa-mir-1324 MI0006657 CCAGACAGAATTCTATGCACTTTC rs75174508 chr3:75680010-75680010 + C/T
189 hsa-mir-320d-1 MI0008190 AAAAGCTGGGTTGAGAGGA rs74826059 chr13:41301987-41301987 + A/G
190 hsa-mir-1908 MI0008329 CGGCGGGGACGGCGATTGGTC rs174561 chr11:61582708-61582708 + C/T
191 hsa-mir-1911 MI0008332 TGAGTACCGCCATGTCTGTTGGG rs79553157 chrX:113997746-113997746 + A/G
192 hsa-mir-2276 MI0011282 TCTGCAAGTGTCAGAGGCGAGG rs74399078 chr13:24736638-24736638 + C/G
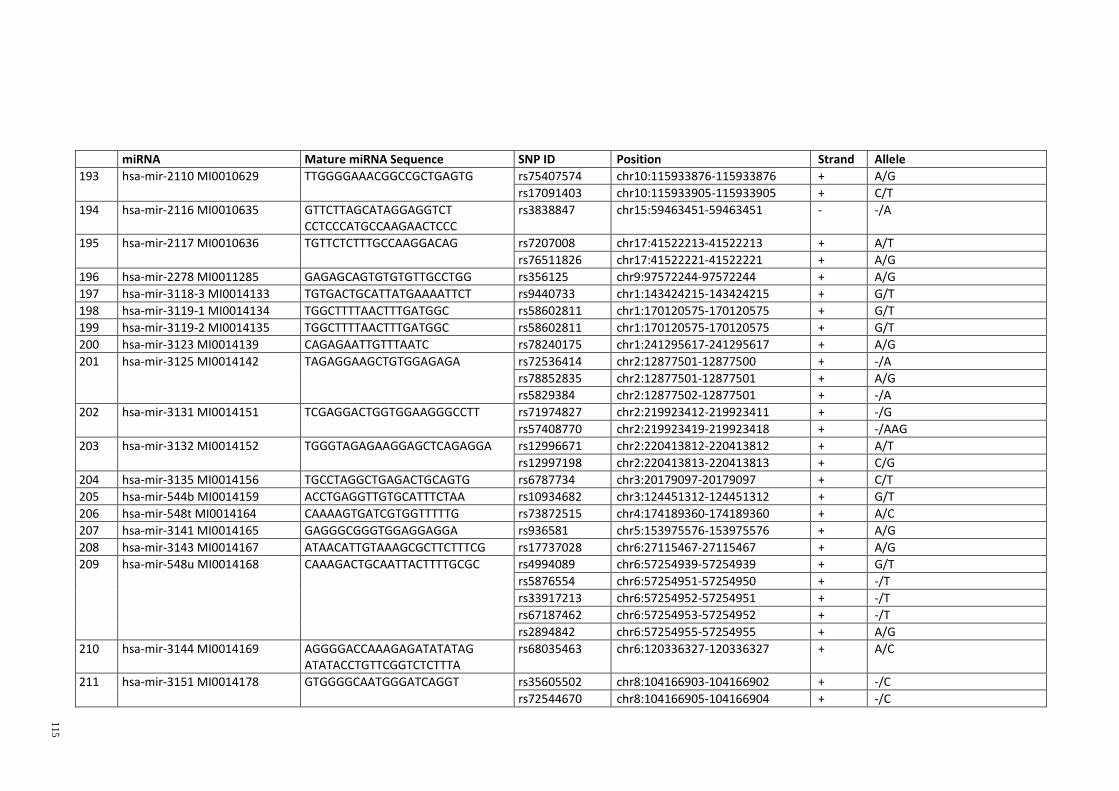
115
miRNA Mature miRNA Sequence SNP ID Position Strand Allele
193 hsa-mir-2110 MI0010629 TTGGGGAAACGGCCGCTGAGTG rs75407574 chr10:115933876-115933876 + A/G
rs17091403 chr10:115933905-115933905 + C/T
194 hsa-mir-2116 MI0010635 GTTCTTAGCATAGGAGGTCT CCTCCCATGCCAAGAACTCCC
rs3838847 chr15:59463451-59463451 - -/A
195 hsa-mir-2117 MI0010636 TGTTCTCTTTGCCAAGGACAG rs7207008 chr17:41522213-41522213 + A/T
rs76511826 chr17:41522221-41522221 + A/G
196 hsa-mir-2278 MI0011285 GAGAGCAGTGTGTGTTGCCTGG rs356125 chr9:97572244-97572244 + A/G
197 hsa-mir-3118-3 MI0014133 TGTGACTGCATTATGAAAATTCT rs9440733 chr1:143424215-143424215 + G/T
198 hsa-mir-3119-1 MI0014134 TGGCTTTTAACTTTGATGGC rs58602811 chr1:170120575-170120575 + G/T
199 hsa-mir-3119-2 MI0014135 TGGCTTTTAACTTTGATGGC rs58602811 chr1:170120575-170120575 + G/T
200 hsa-mir-3123 MI0014139 CAGAGAATTGTTTAATC rs78240175 chr1:241295617-241295617 + A/G
201 hsa-mir-3125 MI0014142 TAGAGGAAGCTGTGGAGAGA rs72536414 chr2:12877501-12877500 + -/A
rs78852835 chr2:12877501-12877501 + A/G
rs5829384 chr2:12877502-12877501 + -/A
202 hsa-mir-3131 MI0014151 TCGAGGACTGGTGGAAGGGCCTT rs71974827 chr2:219923412-219923411 + -/G
rs57408770 chr2:219923419-219923418 + -/AAG
203 hsa-mir-3132 MI0014152 TGGGTAGAGAAGGAGCTCAGAGGA rs12996671 chr2:220413812-220413812 + A/T
rs12997198 chr2:220413813-220413813 + C/G
204 hsa-mir-3135 MI0014156 TGCCTAGGCTGAGACTGCAGTG rs6787734 chr3:20179097-20179097 + C/T
205 hsa-mir-544b MI0014159 ACCTGAGGTTGTGCATTTCTAA rs10934682 chr3:124451312-124451312 + G/T
206 hsa-mir-548t MI0014164 CAAAAGTGATCGTGGTTTTTG rs73872515 chr4:174189360-174189360 + A/C
207 hsa-mir-3141 MI0014165 GAGGGCGGGTGGAGGAGGA rs936581 chr5:153975576-153975576 + A/G
208 hsa-mir-3143 MI0014167 ATAACATTGTAAAGCGCTTCTTTCG rs17737028 chr6:27115467-27115467 + A/G
209 hsa-mir-548u MI0014168 CAAAGACTGCAATTACTTTTGCGC rs4994089 chr6:57254939-57254939 + G/T
rs5876554 chr6:57254951-57254950 + -/T
rs33917213 chr6:57254952-57254951 + -/T
rs67187462 chr6:57254953-57254952 + -/T
rs2894842 chr6:57254955-57254955 + A/G
210 hsa-mir-3144 MI0014169 AGGGGACCAAAGAGATATATAG ATATACCTGTTCGGTCTCTTTA
rs68035463 chr6:120336327-120336327 + A/C
211 hsa-mir-3151 MI0014178 GTGGGGCAATGGGATCAGGT rs35605502 chr8:104166903-104166902 + -/C
rs72544670 chr8:104166905-104166904 + -/C
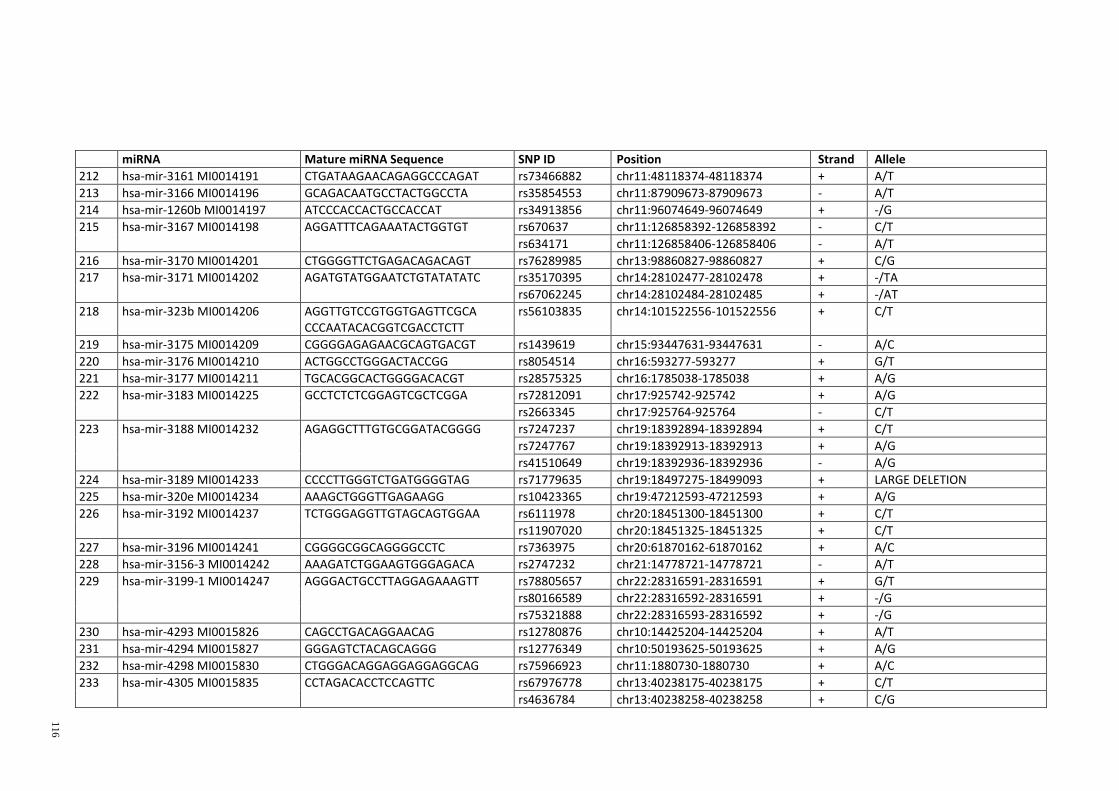
116
miRNA Mature miRNA Sequence SNP ID Position Strand Allele
212 hsa-mir-3161 MI0014191 CTGATAAGAACAGAGGCCCAGAT rs73466882 chr11:48118374-48118374 + A/T
213 hsa-mir-3166 MI0014196 GCAGACAATGCCTACTGGCCTA rs35854553 chr11:87909673-87909673 - A/T
214 hsa-mir-1260b MI0014197 ATCCCACCACTGCCACCAT rs34913856 chr11:96074649-96074649 + -/G
215 hsa-mir-3167 MI0014198 AGGATTTCAGAAATACTGGTGT rs670637 chr11:126858392-126858392 - C/T
rs634171 chr11:126858406-126858406 - A/T
216 hsa-mir-3170 MI0014201 CTGGGGTTCTGAGACAGACAGT rs76289985 chr13:98860827-98860827 + C/G
217 hsa-mir-3171 MI0014202 AGATGTATGGAATCTGTATATATC rs35170395 chr14:28102477-28102478 + -/TA
rs67062245 chr14:28102484-28102485 + -/AT
218 hsa-mir-323b MI0014206 AGGTTGTCCGTGGTGAGTTCGCA CCCAATACACGGTCGACCTCTT
rs56103835 chr14:101522556-101522556 + C/T
219 hsa-mir-3175 MI0014209 CGGGGAGAGAACGCAGTGACGT rs1439619 chr15:93447631-93447631 - A/C
220 hsa-mir-3176 MI0014210 ACTGGCCTGGGACTACCGG rs8054514 chr16:593277-593277 + G/T
221 hsa-mir-3177 MI0014211 TGCACGGCACTGGGGACACGT rs28575325 chr16:1785038-1785038 + A/G
222 hsa-mir-3183 MI0014225 GCCTCTCTCGGAGTCGCTCGGA rs72812091 chr17:925742-925742 + A/G
rs2663345 chr17:925764-925764 - C/T
223 hsa-mir-3188 MI0014232 AGAGGCTTTGTGCGGATACGGGG rs7247237 chr19:18392894-18392894 + C/T
rs7247767 chr19:18392913-18392913 + A/G
rs41510649 chr19:18392936-18392936 - A/G
224 hsa-mir-3189 MI0014233 CCCCTTGGGTCTGATGGGGTAG rs71779635 chr19:18497275-18499093 + LARGE DELETION
225 hsa-mir-320e MI0014234 AAAGCTGGGTTGAGAAGG rs10423365 chr19:47212593-47212593 + A/G
226 hsa-mir-3192 MI0014237 TCTGGGAGGTTGTAGCAGTGGAA rs6111978 chr20:18451300-18451300 + C/T
rs11907020 chr20:18451325-18451325 + C/T
227 hsa-mir-3196 MI0014241 CGGGGCGGCAGGGGCCTC rs7363975 chr20:61870162-61870162 + A/C
228 hsa-mir-3156-3 MI0014242 AAAGATCTGGAAGTGGGAGACA rs2747232 chr21:14778721-14778721 - A/T
229 hsa-mir-3199-1 MI0014247 AGGGACTGCCTTAGGAGAAAGTT rs78805657 chr22:28316591-28316591 + G/T
rs80166589 chr22:28316592-28316591 + -/G
rs75321888 chr22:28316593-28316592 + -/G
230 hsa-mir-4293 MI0015826 CAGCCTGACAGGAACAG rs12780876 chr10:14425204-14425204 + A/T
231 hsa-mir-4294 MI0015827 GGGAGTCTACAGCAGGG rs12776349 chr10:50193625-50193625 + A/G
232 hsa-mir-4298 MI0015830 CTGGGACAGGAGGAGGAGGCAG rs75966923 chr11:1880730-1880730 + A/C
233 hsa-mir-4305 MI0015835 CCTAGACACCTCCAGTTC rs67976778 chr13:40238175-40238175 + C/T
rs4636784 chr13:40238258-40238258 + C/G

117
miRNA Mature miRNA Sequence SNP ID Position Strand Allele
234 hsa-mir-4309 MI0015837 CTGGAGTCTAGGATTCCA rs78860350 chr14:103006026-103006026 + A/T
rs12879262 chr14:103006047-103006047 + C/G
235 hsa-mir-4308 MI0015839 TCCCTGGAGTTTCTTCTT rs28477407 chr14:55344901-55344901 + C/T
236 hsa-mir-4312 MI0015842 GGCCTTGTTCCTGTCCCCA rs79711957 chr15:69094259-69094259 + A/C
237 hsa-mir-4318 MI0015847 CACTGTGGGTACATGCT rs11873400 chr18:35237129-35237129 + A/G
238 hsa-mir-4320 MI0015849 GGGATTCTGTAGCTTCCT rs4430847 chr18:47652913-47652913 - A/G
239 hsa-mir-4317 MI0015850 ACATTGCCAGGGAGTTT rs74513330 chr18:6374394-6374394 + A/G
240 hsa-mir-4324 MI0015854 CCCTGAGACCCTAACCTTAA rs79465964 chr19:49812123-49812123 + C/T
241 hsa-mir-4259 MI0015858 CAGTTGGGTCTAGGGGTCAGGA rs35180578 chr1:159869829-159869828 + -/C
242 hsa-mir-4260 MI0015859 CTTGGGGCATGGAGTCCCA rs7544976 chr1:209796810-209796810 + G/T
243 hsa-mir-4253 MI0015860 AGGGCATGTCCAGGGGGT rs66652227 chr1:23189707-23189707 + -/G
244 hsa-mir-4326 MI0015866 TGTTCCTCTGTCTCCCAGAC rs6062431 chr20:61918164-61918164 + C/G
245 hsa-mir-4267 MI0015871 TCCAGCTCGGTGGCAC rs55940978 chr2:110827551-110827551 + C/T
rs59793833 chr2:110827558-110827558 + A/G
246 hsa-mir-4268 MI0015874 GGCTCCTCCTCTCAGGATGTG rs4674470 chr2:220771223-220771223 + C/T
247 hsa-mir-4270 MI0015878 TCAGGGAGTCAGGGGAGGGC rs79922312 chr3:15537776-15537776 + A/G
248 hsa-mir-4274 MI0015884 CAGCAGTCCCTCCCCCTG rs12512664 chr4:7461769-7461769 + A/G
249 hsa-mir-4281 MI0015885 GGGTCCCGGGGAGGGGGG rs34983866 chr5:176056492-176056492 - -/C
250 hsa-mir-4277 MI0015886 GCAGTTCTGAGCACAGTACAC rs12523324 chr5:1708983-1708983 + A/G
251 hsa-mir-4279 MI0015887 CTCTCCTCCCGGCTTC rs34157017 chr5:31936264-31936263 + -/A
252 hsa-mir-4285 MI0015891 GCGGCGAGTCCGACTCAT rs34606939 chr7:101936373-101936372 + -/G
rs2960269 chr7:101936374-101936374 - C/G
rs2906714 chr7:101936375-101936375 + -/C/T
rs1293864 chr7:101936397-101936397 - G/T
rs35647990 chr7:101936420-101936419 + -/C
rs1293863 chr7:101936422-101936422 - -/A/G
rs1293862 chr7:101936435-101936435 - A/T
253 hsa-mir-4286 MI0015894 ACCCCACTCCTGGTACC rs80245767 chr8:10524531-10524531 + A/C
254 hsa-mir-4328 MI0015904 CCAGTTTTCCCAGGATT rs35376760 chrX:78156694-78156693 + -/G
255 hsa-mir-3605 MI0015995 TGAGGATGGATAGCAAGGAAGCC CCTCCGTGTTACCTGTCCTCTAG
rs80176156 chr1:33798031-33798031 + C/G
256 hsa-mir-3609 MI0015999 CAAAGTGATGAGTAATACTGGCTG rs34109026 chr7:98479274-98479274 + -/T
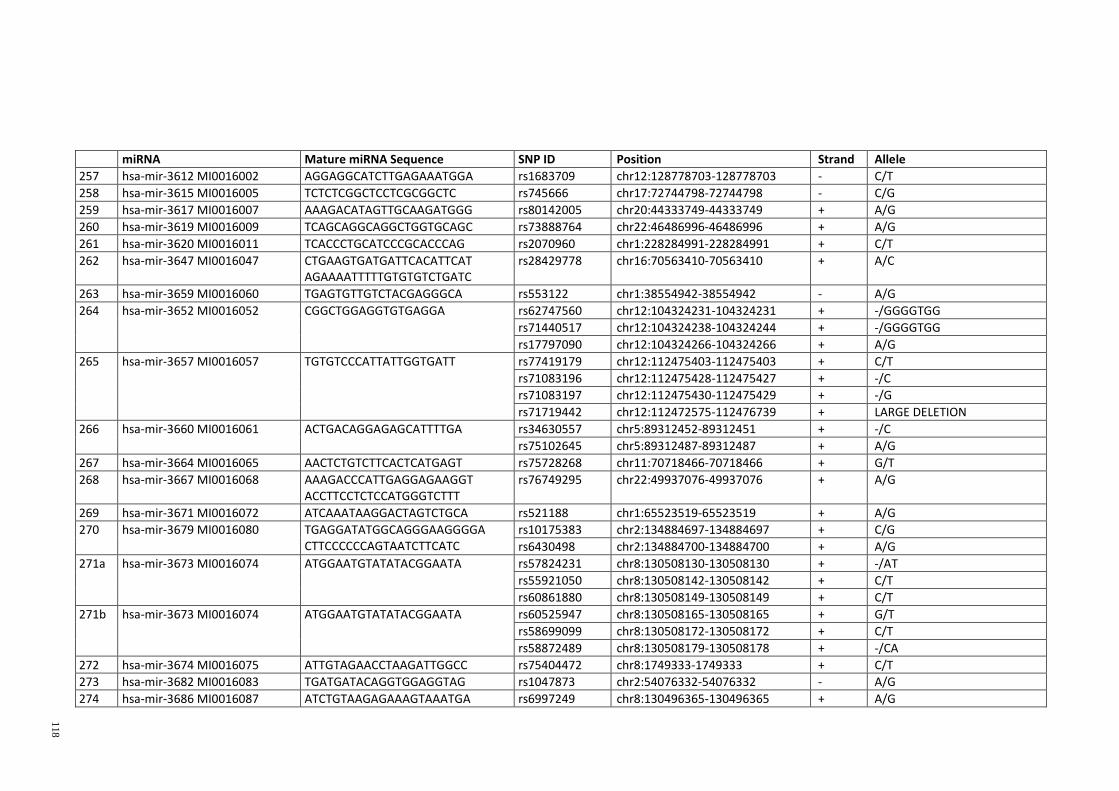
118
miRNA Mature miRNA Sequence SNP ID Position Strand Allele
257 hsa-mir-3612 MI0016002 AGGAGGCATCTTGAGAAATGGA rs1683709 chr12:128778703-128778703 - C/T
258 hsa-mir-3615 MI0016005 TCTCTCGGCTCCTCGCGGCTC rs745666 chr17:72744798-72744798 - C/G
259 hsa-mir-3617 MI0016007 AAAGACATAGTTGCAAGATGGG rs80142005 chr20:44333749-44333749 + A/G
260 hsa-mir-3619 MI0016009 TCAGCAGGCAGGCTGGTGCAGC rs73888764 chr22:46486996-46486996 + A/G
261 hsa-mir-3620 MI0016011 TCACCCTGCATCCCGCACCCAG rs2070960 chr1:228284991-228284991 + C/T
262 hsa-mir-3647 MI0016047 CTGAAGTGATGATTCACATTCAT AGAAAATTTTTGTGTGTCTGATC
rs28429778 chr16:70563410-70563410 + A/C
263 hsa-mir-3659 MI0016060 TGAGTGTTGTCTACGAGGGCA rs553122 chr1:38554942-38554942 - A/G
264 hsa-mir-3652 MI0016052 CGGCTGGAGGTGTGAGGA rs62747560 chr12:104324231-104324231 + -/GGGGTGG
rs71440517 chr12:104324238-104324244 + -/GGGGTGG
rs17797090 chr12:104324266-104324266 + A/G
265 hsa-mir-3657 MI0016057 TGTGTCCCATTATTGGTGATT rs77419179 chr12:112475403-112475403 + C/T
rs71083196 chr12:112475428-112475427 + -/C
rs71083197 chr12:112475430-112475429 + -/G
rs71719442 chr12:112472575-112476739 + LARGE DELETION
266 hsa-mir-3660 MI0016061 ACTGACAGGAGAGCATTTTGA rs34630557 chr5:89312452-89312451 + -/C
rs75102645 chr5:89312487-89312487 + A/G
267 hsa-mir-3664 MI0016065 AACTCTGTCTTCACTCATGAGT rs75728268 chr11:70718466-70718466 + G/T
268 hsa-mir-3667 MI0016068 AAAGACCCATTGAGGAGAAGGT ACCTTCCTCTCCATGGGTCTTT
rs76749295 chr22:49937076-49937076 + A/G
269 hsa-mir-3671 MI0016072 ATCAAATAAGGACTAGTCTGCA rs521188 chr1:65523519-65523519 + A/G
270 hsa-mir-3679 MI0016080 TGAGGATATGGCAGGGAAGGGGA CTTCCCCCCAGTAATCTTCATC
rs10175383 chr2:134884697-134884697 + C/G
rs6430498 chr2:134884700-134884700 + A/G
271a hsa-mir-3673 MI0016074 ATGGAATGTATATACGGAATA rs57824231 chr8:130508130-130508130 + -/AT
rs55921050 chr8:130508142-130508142 + C/T
rs60861880 chr8:130508149-130508149 + C/T
271b hsa-mir-3673 MI0016074 ATGGAATGTATATACGGAATA rs60525947 chr8:130508165-130508165 + G/T
rs58699099 chr8:130508172-130508172 + C/T
rs58872489 chr8:130508179-130508178 + -/CA
272 hsa-mir-3674 MI0016075 ATTGTAGAACCTAAGATTGGCC rs75404472 chr8:1749333-1749333 + C/T
273 hsa-mir-3682 MI0016083 TGATGATACAGGTGGAGGTAG rs1047873 chr2:54076332-54076332 - A/G
274 hsa-mir-3686 MI0016087 ATCTGTAAGAGAAAGTAAATGA rs6997249 chr8:130496365-130496365 + A/G
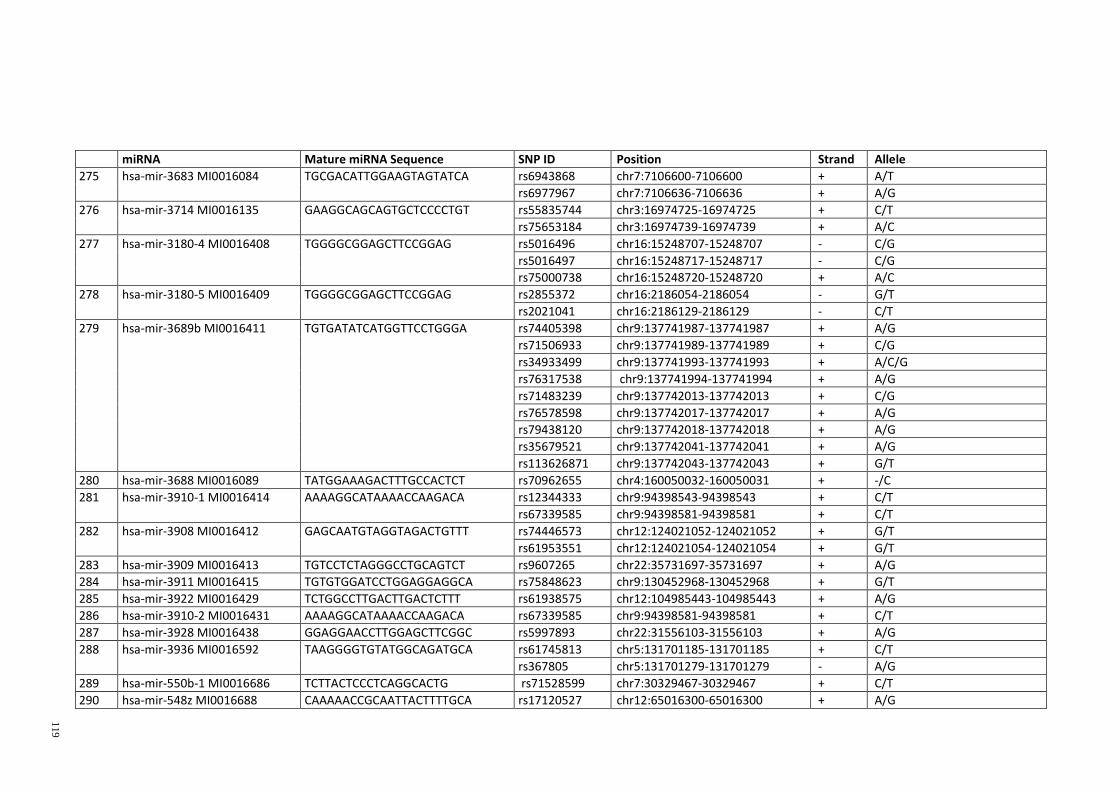
119
miRNA Mature miRNA Sequence SNP ID Position Strand Allele
275 hsa-mir-3683 MI0016084 TGCGACATTGGAAGTAGTATCA rs6943868 chr7:7106600-7106600 + A/T
rs6977967 chr7:7106636-7106636 + A/G
276 hsa-mir-3714 MI0016135 GAAGGCAGCAGTGCTCCCCTGT rs55835744 chr3:16974725-16974725 + C/T
rs75653184 chr3:16974739-16974739 + A/C
277 hsa-mir-3180-4 MI0016408 TGGGGCGGAGCTTCCGGAG rs5016496 chr16:15248707-15248707 - C/G
rs5016497 chr16:15248717-15248717 - C/G
rs75000738 chr16:15248720-15248720 + A/C
278 hsa-mir-3180-5 MI0016409 TGGGGCGGAGCTTCCGGAG rs2855372 chr16:2186054-2186054 - G/T
rs2021041 chr16:2186129-2186129 - C/T
279 hsa-mir-3689b MI0016411 TGTGATATCATGGTTCCTGGGA rs74405398 chr9:137741987-137741987 + A/G
rs71506933 chr9:137741989-137741989 + C/G
rs34933499 chr9:137741993-137741993 + A/C/G
rs76317538 chr9:137741994-137741994 + A/G
rs71483239 chr9:137742013-137742013 + C/G
rs76578598 chr9:137742017-137742017 + A/G
rs79438120 chr9:137742018-137742018 + A/G
rs35679521 chr9:137742041-137742041 + A/G
rs113626871 chr9:137742043-137742043 + G/T
280 hsa-mir-3688 MI0016089 TATGGAAAGACTTTGCCACTCT rs70962655 chr4:160050032-160050031 + -/C
281 hsa-mir-3910-1 MI0016414 AAAAGGCATAAAACCAAGACA rs12344333 chr9:94398543-94398543 + C/T
rs67339585 chr9:94398581-94398581 + C/T
282 hsa-mir-3908 MI0016412 GAGCAATGTAGGTAGACTGTTT rs74446573 chr12:124021052-124021052 + G/T
rs61953551 chr12:124021054-124021054 + G/T
283 hsa-mir-3909 MI0016413 TGTCCTCTAGGGCCTGCAGTCT rs9607265 chr22:35731697-35731697 + A/G
284 hsa-mir-3911 MI0016415 TGTGTGGATCCTGGAGGAGGCA rs75848623 chr9:130452968-130452968 + G/T
285 hsa-mir-3922 MI0016429 TCTGGCCTTGACTTGACTCTTT rs61938575 chr12:104985443-104985443 + A/G
286 hsa-mir-3910-2 MI0016431 AAAAGGCATAAAACCAAGACA rs67339585 chr9:94398581-94398581 + C/T
287 hsa-mir-3928 MI0016438 GGAGGAACCTTGGAGCTTCGGC rs5997893 chr22:31556103-31556103 + A/G
288 hsa-mir-3936 MI0016592 TAAGGGGTGTATGGCAGATGCA rs61745813 chr5:131701185-131701185 + C/T
rs367805 chr5:131701279-131701279 - A/G
289 hsa-mir-550b-1 MI0016686 TCTTACTCCCTCAGGCACTG rs71528599 chr7:30329467-30329467 + C/T
290 hsa-mir-548z MI0016688 CAAAAACCGCAATTACTTTTGCA rs17120527 chr12:65016300-65016300 + A/G

120
miRNA Mature miRNA Sequence SNP ID Position Strand Allele
291 hsa-mir-3938 MI0016594 AATTCCCTTGTAGATAACCCGG rs35071197 chr3:55886523-55886522 + -/G
rs59684995 chr3:55886574-55886574 + A/T
rs10575780 chr3:55886581-55886582 + -/AA
rs28647346 chr3:55886608-55886608 + A/G
292 hsa-mir-3939 MI0016596 TACGCGCAGACCACAGGATGTC rs80032204 chr6:167411298-167411298 + C/T
rs77840042 chr6:167411300-167411300 + C/T
rs75692943 chr6:167411301-167411301 + A/G
rs70979794 chr6:167411314-167411313 - 1552 BP INSERTION
rs13216014 chr6:167411314-167411314 + C/T
rs12200860 chr6:167411344-167411344 + C/T
rs77072520 chr6:167411362-167411362 + A/G
rs73024234 chr6:167411388-167411388 + C/G
293 hsa-mir-941-3 MI0005765 CACCCGGCTGTGTGCACATGTGC rs6089780 chr20:62550880-62550880 + A/G
rs6090019 chr20:62550890-62550890 + C/T
rs55795631 chr20:62550877-62550877 + C/T
294 hsa-mir-3689a MI0016090 TGTGATATCATGGTTCCTGGGA CTGGGAGGTGTGATATCGTGGT
rs71501303 chr9:137741197-137741803 + CCACGAT/GCACGGG
295 hsa-mir-3171 MI0014202 AGATGTATGGAATCTGTATATATC rs61972532 chr14:28102427-28102427 + A/G

121
Table A.3: Relative Quantification (RQ) of mature miRNA-125a was calculated by applying to the 2 - ∆∆CT
analyses.
Sample Wild Type
Probe Mutant Probe
Endo miR-16
Endo RNU44
Average endogenous
Wild type ∆CT
Mutant ∆CT
Sample Wild type
∆CT Mutant ∆CT
∆∆CT Relative
Quatification (RQ) Average
RQ Log RQ
Average Log
SD CV (%)
Empty Vector
(EV)
30.99 37.32 27.31 26.30 26.80 4.18 10.52
Empty Vector
(EV)
4.18 10.52 0.00 1.00 1.00 0.00 0.00 0.00 0.00
30.58 36.36 27.28 25.40 26.34 4.24 10.03
4.24 10.03 0.00 1.00
30.67 36.00 27.56 25.52 26.54 4.13 9.46
4.13 9.46 0.00 1.00
30.84 36.11 27.34 26.55 26.95 3.89 9.17
3.89 9.17 0.00 1.00
31.22 37.35 27.82 26.50 27.16 4.06 10.19
4.06 10.19 0.00 1.00
31.41 37.23 27.59 27.00 27.29 4.11 9.93
4.11 9.93 0.00 1.00
29.28 34.90 26.14 23.06 24.60 4.68 10.30
4.68 10.30 0.00 1.00
29.34 34.20 26.27 23.29 24.78 4.56 9.42
4.56 9.42 0.00 1.00
29.33 35.14 25.40 23.34 24.37 4.96 10.76
4.96 10.76 0.00 1.00
Sample Wild Type
Probe Mutant Probe
Endo miR-16
Endo RNU44
Average endogenous
Wild type ∆CT
Mutant ∆CT
Wild Type
miR-125a
-3.90
-8.08 270.50 192.39 2.43 2.28 0.07 3.24
Wild Type miR-125a
23.33
28.03 26.43 27.23 -3.90
-3.43
-7.67 203.59
2.31
23.32
27.34 26.17 26.75 -3.43
-3.42
-7.55 187.53
2.27
23.31
27.15 26.31 26.73 -3.42
-3.51
-7.40 168.90
2.23
23.18
27.14 26.23 26.68 -3.51
-3.35
-7.41 169.84
2.23
23.12
27.83 25.12 26.47 -3.35
-3.44
-7.55 187.01
2.27
23.15
27.59 25.59 26.59 -3.44
-2.51
-7.19 145.61
2.16
21.65
25.17 23.14 24.16 -2.51
-3.08
-7.64 198.78
2.30
21.74
26.10 23.53 24.82 -3.08
-2.68
-7.64 199.74
2.30
21.71
25.57 23.22 24.39 -2.68
Mutant miR-
125aM
-3.93 -14.45 22334.71 11197.50 4.35 3.99 0.25 6.23
Sample Wild Type
Probe Mutant Probe
Endo miR-16
Endo RNU44
Average endogenous
Wild type ∆CT
Mutant ∆CT
-3.42 -13.45 11186.72
4.05
Mutant miR-125aM
21.77 26.48 24.92 25.70
-3.93
-3.73 -13.18 9309.58
3.97
22.46 26.76 25.01 25.89
-3.42
-3.15 -12.32 5102.54
3.71
21.71 26.66 24.21 25.44
-3.73
-3.63 -13.82 14462.21
4.16
22.93 27.08 25.09 26.08
-3.15
-2.22 -12.15 4546.37
3.66
22.31 27.58 24.31 25.94
-3.63
-3.03 -13.32 10254.72
4.01
23.11 26.44 24.22 25.33
-2.22
-2.97 -12.39 5363.65
3.73
22.01 25.59 24.48 25.03
-3.03
-3.39 -14.15 18217.03
4.26
22.16 25.58 24.67 25.13
-2.97
21.79 25.69 24.66 25.18
-3.39
Key for Table A.3: [miR-16 and RNU44 = endogenous controls; ∆CT = delta CT (CT sample – CT endogenous control); ∆∆CT = delta delta CT (∆CT
wild-type miRNA-125a - ∆CT mutagenized miRNA-125a); RQ = relative quantification; CV = correlation variation; SD = standard deviation]
Pt- test = 1.119 x 10⁻¹²

122
Table A.4: Relative Quantification (RQ) of mature miRNA-124-3 was calculated by applying to the 2 - ∆∆CT
analyses.
Sample Wild Type
Probe Mutant Probe
Endo miR-16
Endo RNU44
Average endogenous
Wild type ∆CT
Mutant ∆CT
Sample Wild type
∆CT Mutant ∆CT
∆∆CT Relative
Quatification (RQ) Average
RQ Log RQ
Average Log
SD CV (%)
Empty Vector
(EV)
28.48 32.14 20.15 21.80 20.97 7.50 11.17
Empty Vector
(EV)
7.50 11.17 0.00 1.00 1.00 0.00 0.00 0.00 0.00
28.46 32.37 20.29 22.08 21.19 7.27 11.18
7.27 11.18 0.00 1.00
28.92 32.26 20.36 22.06 21.21 7.71 11.05
7.71 11.05 0.00 1.00
28.87 35.79 24.41 27.08 25.74 3.13 10.05
3.13 10.05 0.00 1.00
29.01 36.67 24.56 27.15 25.86 3.15 10.82
3.15 10.82 0.00 1.00
29.07 37.92 24.33 26.80 25.57 3.50 12.36
3.50 12.36 0.00 1.00
28.84 38.46 23.41 24.09 23.75 5.09 14.71
5.09 14.71 0.00 1.00
29.02 37.57 23.34 24.13 23.73 5.29 13.84
5.29 13.84 0.00 1.00
29.23 38.84 23.92 24.24 24.08 5.15 14.76
5.15 14.76 0.00 1.00
Sample Wild Type
Probe Mutant Probe
Endo miR-16
Endo RNU44
Average endogenous
Wild type ∆CT
Mutant ∆CT
Wild Type
miR-124
3.08 -4.42 21.45 112.83 1.33 1.83 0.45 24.75
Wild Type
miR-124
27.54 23.75 25.18 24.46 3.08
2.26 -5.01 32.31 1.51
27.30 24.30 25.77 25.04 2.26
1.94 -5.78 54.83 1.74
27.15 24.12 26.32 25.22 1.94
-5.43 -8.56 376.11 2.58
25.08 27.21 33.79 30.50 -5.43
-4.91 -8.06 266.78 2.43
25.14 26.71 33.37 30.04 -4.91
-3.72 -7.22 149.03 2.17
25.26 26.60 31.36 28.98 -3.72
0.17 -4.92 30.26 1.48
26.63 25.48 27.42 26.45 0.17
-0.47 -5.76 54.06 1.73
26.45 25.65 28.18 26.92 -0.47
0.21 -4.94 30.65 1.49
26.76 25.26 27.84 26.55 0.21
Mutant miR-124M
-1.74 -12.91 7691.24 30330.34 3.89 4.03 0.68 16.97
Sample Wild Type
Probe Mutant Probe
Endo miR-16
Endo RNU44
Average endogenous
Wild type ∆CT
Mutant ∆CT
-0.21 -11.40 2693.94 3.43
Mutant miR-124M
24.01 26.06 25.44 25.75 -1.74
0.29 -10.77 1743.78 3.24
23.92 24.83 23.44 24.13 -0.21
-1.78 -11.83 3628.10 3.56
24.52 25.25 23.22 24.23 0.29
-1.12 -11.93 3914.20 3.59
24.28 23.12 29.00 26.06 -1.78
-0.43 -12.79 7067.58 3.85
24.48 22.97 28.23 25.60 -1.12
-1.68 -16.40 86295.64 4.94
24.68 23.61 26.62 25.12 -0.43
-1.76 -15.60 49529.49 4.69
24.69 25.21 27.53 26.37 -1.68
-2.00 -16.75 110409.13 5.04
24.86 25.28 27.95 26.61 -1.76
24.64 25.51 27.76 26.63 -2.00
Key for Table A.4: [miR-16 and RNU44 = endogenous controls; ∆CT = delta CT (CT sample – CT endogenous control); ∆∆CT = delta delta CT (∆CT
wild-type miRNA-124-3 - ∆CT variant miRNA-124-3); RQ = relative quantification; CV = correlation variation; SD = standard deviation]
Pt- test = 5.163 x 10⁻⁷
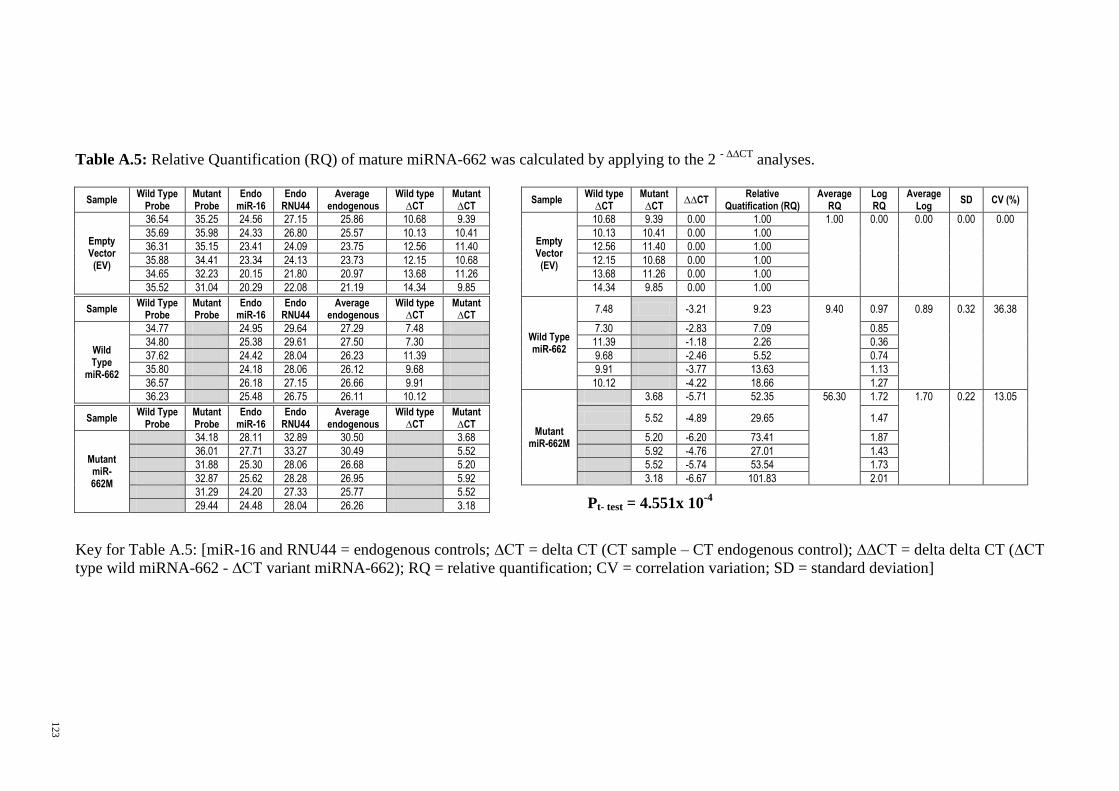
123
Table A.5: Relative Quantification (RQ) of mature miRNA-662 was calculated by applying to the 2 - ∆∆CT
analyses.
Sample Wild Type
Probe Mutant Probe
Endo miR-16
Endo RNU44
Average endogenous
Wild type ∆CT
Mutant ∆CT
Sample Wild type
∆CT Mutant ∆CT
∆∆CT Relative
Quatification (RQ) Average
RQ Log RQ
Average Log
SD CV (%)
Empty Vector
(EV)
36.54 35.25 24.56 27.15 25.86 10.68 9.39
Empty Vector
(EV)
10.68 9.39 0.00 1.00 1.00 0.00 0.00 0.00 0.00
35.69 35.98 24.33 26.80 25.57 10.13 10.41
10.13 10.41 0.00 1.00
36.31 35.15 23.41 24.09 23.75 12.56 11.40
12.56 11.40 0.00 1.00
35.88 34.41 23.34 24.13 23.73 12.15 10.68
12.15 10.68 0.00 1.00
34.65 32.23 20.15 21.80 20.97 13.68 11.26
13.68 11.26 0.00 1.00
35.52 31.04 20.29 22.08 21.19 14.34 9.85
14.34 9.85 0.00 1.00
Sample Wild Type
Probe Mutant Probe
Endo miR-16
Endo RNU44
Average endogenous
Wild type ∆CT
Mutant ∆CT
Wild Type miR-662
7.48 -3.21 9.23 9.40 0.97 0.89 0.32 36.38
Wild Type
miR-662
34.77 24.95 29.64 27.29 7.48
7.30 -2.83 7.09 0.85
34.80 25.38 29.61 27.50 7.30
11.39 -1.18 2.26 0.36
37.62 24.42 28.04 26.23 11.39
9.68 -2.46 5.52 0.74
35.80 24.18 28.06 26.12 9.68
9.91 -3.77 13.63 1.13
36.57 26.18 27.15 26.66 9.91
10.12 -4.22 18.66 1.27
36.23 25.48 26.75 26.11 10.12
Mutant miR-662M
3.68 -5.71 52.35 56.30 1.72 1.70 0.22 13.05
Sample Wild Type
Probe Mutant Probe
Endo miR-16
Endo RNU44
Average endogenous
Wild type ∆CT
Mutant ∆CT
5.52 -4.89 29.65 1.47
Mutant miR-662M
34.18 28.11 32.89 30.50 3.68
5.20 -6.20 73.41 1.87
36.01 27.71 33.27 30.49 5.52
5.92 -4.76 27.01 1.43
31.88 25.30 28.06 26.68 5.20
5.52 -5.74 53.54 1.73
32.87 25.62 28.28 26.95 5.92
3.18 -6.67 101.83 2.01
31.29 24.20 27.33 25.77 5.52
29.44 24.48 28.04 26.26 3.18
Key for Table A.5: [miR-16 and RNU44 = endogenous controls; ∆CT = delta CT (CT sample – CT endogenous control); ∆∆CT = delta delta CT (∆CT
type wild miRNA-662 - ∆CT variant miRNA-662); RQ = relative quantification; CV = correlation variation; SD = standard deviation]
Pt- test = 4.551x 10⁻⁴

124
Figure A.1: Dissociation curve for Beta-actin primers showing one peak (above);
standard curve for Beta-actin primers (below).
Figure A.2: Dissociation curve for GAPDH primers showing one peak (above);
standard curve for GAPDH primers (below).

125
Figure A.3: Dissociation curve for primary miR-125a primers showing one peak
(above); standard curve for primary miR-125a primers (below).
Figure A.4: Dissociation curve for pri-miR-124-3 primers showing one peak (above);
standard curve for for pri-miR-124-3 primers (below).
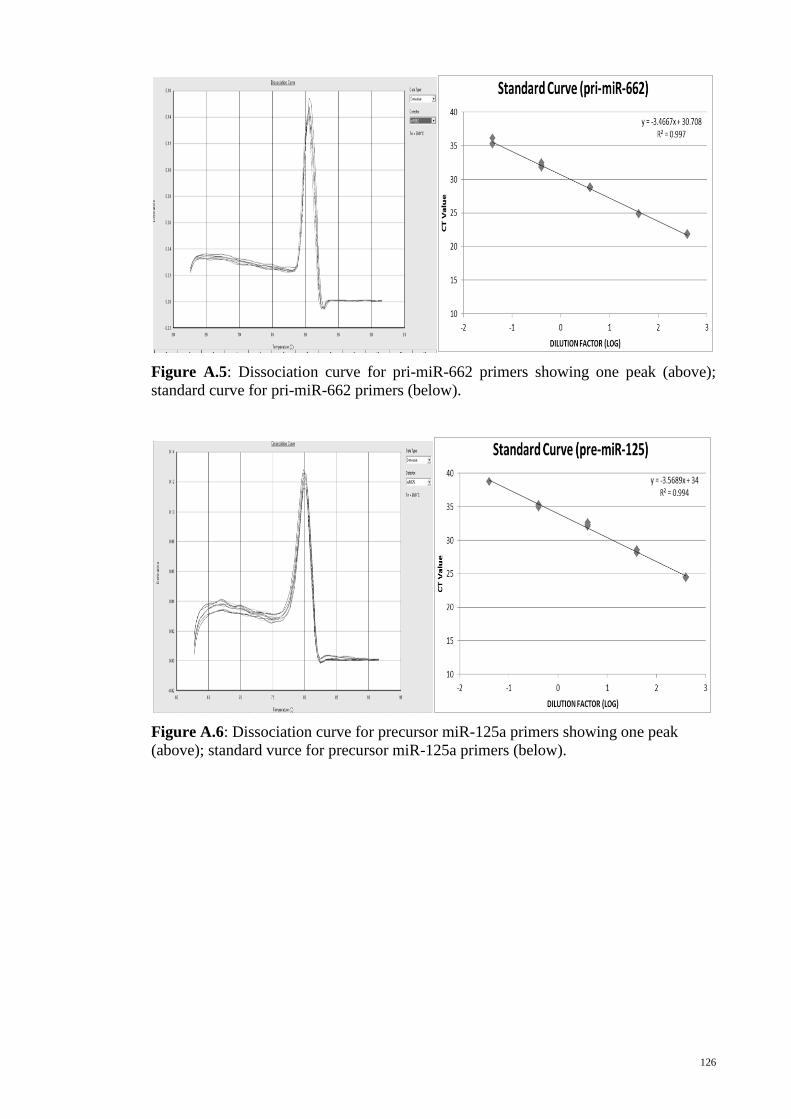
126
Figure A.5: Dissociation curve for pri-miR-662 primers showing one peak (above);
standard curve for pri-miR-662 primers (below).
Figure A.6: Dissociation curve for precursor miR-125a primers showing one peak
(above); standard vurce for precursor miR-125a primers (below).

127
Figure A.7: Dissociation curve for pre-miR-124-3 primers showing one peak (above);
standard curve for pre-miR-124-3 primers (below).
Figure A.8: Dissociation curve for pre-miR-662 primers showing one peak (above);
standard curve for pre-miR-662 primers (below).