situational analysis of national drug observatories in...
TRANSCRIPT

LEADERFIIAPP Spain
COUNTRIESSEDRONAR ArgentinaSENAD BrazilSENDA ChileMINJUSTICIA ColombiaICD Costa RicaCND CubaVLADA Czech RepublicCND Dominican RepublicSETED EcuadorCNA El SalvadorGIZ GermanyDNII HondurasCONADIC MexicoCONAPRED PanamaDEVIDA PeruNBDP PolandSICAD PortugalNAA RomaniaDGPNSD SpainNDC Trinidad and TobagoJND UruguayONA Venezuela
EUROPEAN AGENCYEMCDDA
MULTILATERAL AGENCIESCICAD – OAS • PAHO – WHO
BI-REGIONAL NETWORKSAIAMP • IDPC • RIOD
[email protected]@programacopolad
SITUATIONAL ANALYSIS OF NATIONAL DRUG OBSERVATORIES IN LATIN AMERICA AND THE CARIBBEAN
SITU
ATIO
NAL
ANAL
YSIS
OF
NATI
ONAL
DRU
G OB
SERV
ATOR
IES
IN L
ATIN
AM
ERIC
A AN
D TH
E CA
RIBB
EAN
Versión ingés
This project is funded bythe European Union
This project is funded bythe European Union
Versión ingés
libro_copolad(ingles).indd 1 3/11/17 14:15

situational analysis of
national Drug observatories
in latin america anD the caribbean
Edition:
Executive and Coordination Body (ECB)
Programme address at Madrid: Programme address at Brussels:
FIIAPP. Beatriz de Bobadila, 18 FIIAPP. 49-51 Rue de Trèves
28040 Madrid. España 1040 Brussels. Belgium
T +34 91 144 27 66 T +32 2 231 57 89
www.copolad.eu
Layout:
Ediciones Digitales 64
Printing:
CYAN Proyectos Editoriales, S.A.
C/ Fuencarral, 70 – 28004 Madrid
ISBN:
978-84-697-7270-6
© COPOLAD, 2017
Madrid, november 2017
This project is funded byt he Eu ropean Un i on
Cooperation Programme between Latin America, the Caribbean and the European Union
on Drugs Policies (COPOLAD)
Leader:

Research Team:
Florencia Failache (Research Coordinator, COPOLAD)
Mario Pecheny (Research Coordinator, COPOLAD)
Supervision:
María Verónica Brasesco (Argentinian Drug Observatory - SEDRONAR)
Héctor Suárez (Uruguayan Drug Observatory - JND)
Collaborators:
Clara Kimsa (Argentinian Drug Observatory - SEDRONAR)
Jessica Ramírez (Uruguayan Drug Observatory - JND)
Leticia Keuroglian (Uruguayan Drug Observatory - JND)
Luisina Posse (Argentinian Drug Observatory - SEDRONAR)
English Editor:
Tessa Chaderton-Shaw
Editorial Revision:
Executive and Coordination Body (ECB), COPOLAD
We thank all those who collaborated in the research:
• Everyone who completed the questionnaire in each country.
• The Inter-American Observatory on Drugs (OID) of the Inter-American Drug Abuse Control Com -
mission/Organization of American States (CICAD/OAS), particularly, Francisco Cumsille (Director of OID
when this study was produced), for his invaluable contribution and ongoing support, and the OID team,
Pernell Clarke, Marya Haynes, and Tiffany Barry.
• The European Monitoring Centre for Drugs and Drug Addiction (EMCDDA), particularly its Director, Alexis
Goosdeel and Cécile Martel.
• Martha Paredes, Deputy Director of Strategy and Analysis, Coordinator of the Colombian Observatory
on Drugs; Teresa Salvador-Llivina, Director of COPOLAD; Graciela Ahumada, Task Force Coordinator
for the Observatories Component of COPOLAD; Juan Carlos Araneda, Task Force Coordinator for
Precursors of COPOLAD; for their collaboration and input at different phases of the research design
and drafting of the final report.
• The Executive and Coordination Body (ECB) of COPOLAD, especially Eulalia Alemany for timely support
and follow-up provided to the research team; to Ruth Losada and Carlos López for final editorial review
of the report; and to Teresa Fuentes for her efficient management of the project.
Coordinated by:
Argentinian Drug Observatory (SEDRONAR) Uruguayan Drug Observatory (JND)


5
Clauses ad cautelam, clarifications and exonerations
COPOLAD is a programme financed by the European Union through the
Directorate-General for International Cooperation and Development (DG
DEVCO / EuropeAid). Opinions expressed in this document are exclusive
responsibility of their authors and editors and in any case don’t necessarily
represent viewpoints or positions of the European Commission.
Reproduction of this handbook
Editor of this publication will well consider all demands destined to
reproduce or translate —totally or partially— contents in it contained in
order to enhance its diffusion. Petitions may be made to Execution and
Coordination Body (ECB) of COPOLAD through the mail: [email protected]


dN
7
Executive Summary . . . . . . . . . . . . . . . . . . . . . . . . . . . . . . . . . . . . . . . . . . . . 9
1. RESEaRCh PROjECT: GENERal aSPECTS Of ThE STudy . . . . . . . . . . . . . . 15
1.1. Introduction . . . . . . . . . . . . . . . . . . . . . . . . . . . . . . . . . . . . . 15
1.2. Objectives . . . . . . . . . . . . . . . . . . . . . . . . . . . . . . . . . . . . . . . 16
1.3. Methodology . . . . . . . . . . . . . . . . . . . . . . . . . . . . . . . . . . . . 18
2. RESulTS . . . . . . . . . . . . . . . . . . . . . . . . . . . . . . . . . . . . . . . . . . . . . . . . . . . 23
2.1. General Description and Analysis of Countries
with NDOs . . . . . . . . . . . . . . . . . . . . . . . . . . . . . . . . . . . . . . . 24
2.2. Description and Analysis of Results of Countries
without NDOs . . . . . . . . . . . . . . . . . . . . . . . . . . . . . . . . . . . . 86
3. dEvElOPmENT lEvEl Of NdOs:
PROPOSal by ThE WORkiNG GROuPS . . . . . . . . . . . . . . . . . . . . . . . . . . . . 89
4. COmPaRaTivE aNalySiS: 2011 & 2016 STudiES . . . . . . . . . . . . . . . . . . . . 95
5. CONCluSiONS aNd fiNal RECOmmENdaTiONS . . . . . . . . . . . . . . . . . . . 101
5.1. Strengths and Limitations of the Study . . . . . . . . . . . . . . . . . . 101
5.2. Conclusions . . . . . . . . . . . . . . . . . . . . . . . . . . . . . . . . . . . . . . 102
References . . . . . . . . . . . . . . . . . . . . . . . . . . . . . . . . . . . . . . . . . . . . . . . . . . . . 111
CONTENTS

aNNExES
Annex I: Questionnaire . . . . . . . . . . . . . . . . . . . . . . . . . . . . . . . . 113
Annex II: Directory of Focal Points Responsible for Completion
of the Questionnaire . . . . . . . . . . . . . . . . . . . . . . . . . . . 151
Annex III: Indicators per Substance by Country . . . . . . . . . . . . . . . 159
Annex IV: NDO Development Level: Indicators used to Build
the Observatory Classification Index . . . . . . . . . . . . . . . 165
Annex V: NDO Ranking (scores) . . . . . . . . . . . . . . . . . . . . . . . . . . 175
list of Tables . . . . . . . . . . . . . . . . . . . . . . . . . . . . . . . . . . . . . . . . . . . . . . . . . . 177
list of Graphs . . . . . . . . . . . . . . . . . . . . . . . . . . . . . . . . . . . . . . . . . . . . . . . . . . 178
acronyms . . . . . . . . . . . . . . . . . . . . . . . . . . . . . . . . . . . . . . . . . . . . . . . . . . . . . 182
NdO aNalySiS iN laTiN amERiCa & ThE CaRibbEaN
8

dN
9
This report presents the study entitled Situational Analysis of National
Drugs Observatories in Latin American and the Caribbean conducted in
the context of Component I: Consolidation of National Drugs Observato-
ries of the Cooperation Programme between Latin America, the Caribbean
and the European Union on Drugs Policies (COPOLAD II).
The first objective of the study was to provide information on the current
situation of NDOs in 33 member countries of the Community of Latin
American and Caribbean States (CELAC), considering the characteristics
and needs of NDOs in each Latin American and Caribbean country. Ano-
ther objective was to suggest working groups to strengthen activities ac-
cording to each NDO, and to identify specific needs in relation to the
following areas: capacity to conduct qualitative studies; functioning and
availability in the country of an Early Warning System (EWS); capacity to
conduct studies on gender and on specific populations, i.e. inmates; epi-
demiological surveys; and the use of selected indicators agreed upon du-
ring the first phase of COPOLAD. Finally, the last objective was to monitor
the progress of the NDOs that had participated in Phase 1 of COPOLAD.
The study therefore includes the monitoring of those NDOs that had al -
ready participated in the previous study in 2011, and an analysis of the
current situation of those CELAC countries that are new to the process,
ExECuTivE SummaRy

i.e. those Latin American countries who did not respond in 2011 and all
the Caribbean countries.
Between September to October 2016, a standardized questionnaire in di-
gital format was sent to focal points in each country. 31 out of 33 countries
completed the questionnaire (93.9%).
The main results are as follows:
• The region shows much promise given that 28 of 33 countries have a
NDO. Half of them (17 NDOs) have been active for more than 10 years.
• Of 28 countries with NDOs, 24 indicate that the work of the Observatory
is included within a strategic or action plan on drugs in the country.
• Of the total number of NDOs, 13 have a specific budget for research,
13 for publications, 9 for training, 12 for infrastructure and equipment,
and 17 have a specific budget for human resources. Regarding the
source of funding, the Government was mentioned or the corresponding
Ministry or Secretary within the Executive Power. Other sources, such
as the Organization of American States (OAS), the United States Agency
for International Development (USAID) or the European Union (EU) were
mentioned by 4 countries out of a total of 28.
• 15 NDOs have difficulties accessing the information generated by other
institutions. Difficulties exist such as political, operational and financing
challenges, work overload at the NDO, work overload at other agencies,
lack of financial incentives for inter-institutional collaboration, and/or lack
of published data.
• 28 NDOs incorporate information on demand reduction; 24 NDOs in-
clude the supply control area, and 15 NDOs are involved in the monito-
ring and evaluation of drug programmes, plans and projects.
• In relation to studies carried out by the NDOs, 19 indicate that they have
conducted studies on the general population, 22 indicate that they did
so on High School students, while 16 indicate they conducted studies
on patients in drug treatment. 22 NDOs conduct some type of study on
specific populations or use some methodology other than the survey.
NdO aNalySiS iN laTiN amERiCa & ThE CaRibbEaN
10
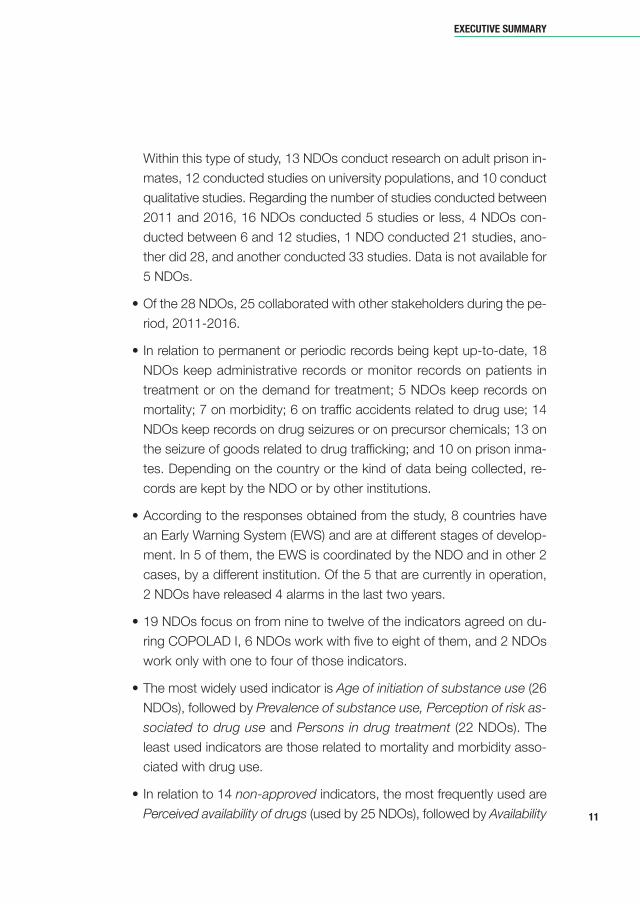
Within this type of study, 13 NDOs conduct research on adult prison in-
mates, 12 conducted studies on university populations, and 10 conduct
qualitative studies. Regarding the number of studies conducted between
2011 and 2016, 16 NDOs conducted 5 studies or less, 4 NDOs con-
ducted between 6 and 12 studies, 1 NDO conducted 21 studies, ano-
ther did 28, and another conducted 33 studies. Data is not available for
5 NDOs.
• Of the 28 NDOs, 25 collaborated with other stakeholders during the pe-
riod, 2011-2016.
• In relation to permanent or periodic records being kept up-to-date, 18
NDOs keep administrative records or monitor records on patients in
treat ment or on the demand for treatment; 5 NDOs keep records on
mortality; 7 on morbidity; 6 on traffic accidents related to drug use; 14
NDOs keep records on drug seizures or on precursor chemicals; 13 on
the seizure of goods related to drug trafficking; and 10 on prison inma-
tes. Depending on the country or the kind of data being collected, re-
cords are kept by the NDO or by other institutions.
• According to the responses obtained from the study, 8 countries have
an Early Warning System (EWS) and are at different stages of develop-
ment. In 5 of them, the EWS is coordinated by the NDO and in other 2
cases, by a different institution. Of the 5 that are currently in operation,
2 NDOs have released 4 alarms in the last two years.
• 19 NDOs focus on from nine to twelve of the indicators agreed on du-
ring COPOLAD I, 6 NDOs work with five to eight of them, and 2 NDOs
work only with one to four of those indicators.
• The most widely used indicator is Age of initiation of substance use (26
NDOs), followed by Prevalence of substance use, Perception of risk as-
sociated to drug use and Persons in drug treatment (22 NDOs). The
least used indicators are those related to mortality and morbidity asso-
ciated with drug use.
• In relation to 14 non-approved indicators, the most frequently used are
Perceived availability of drugs (used by 25 NDOs), followed by Availability
ExECuTivE SummaRy
11
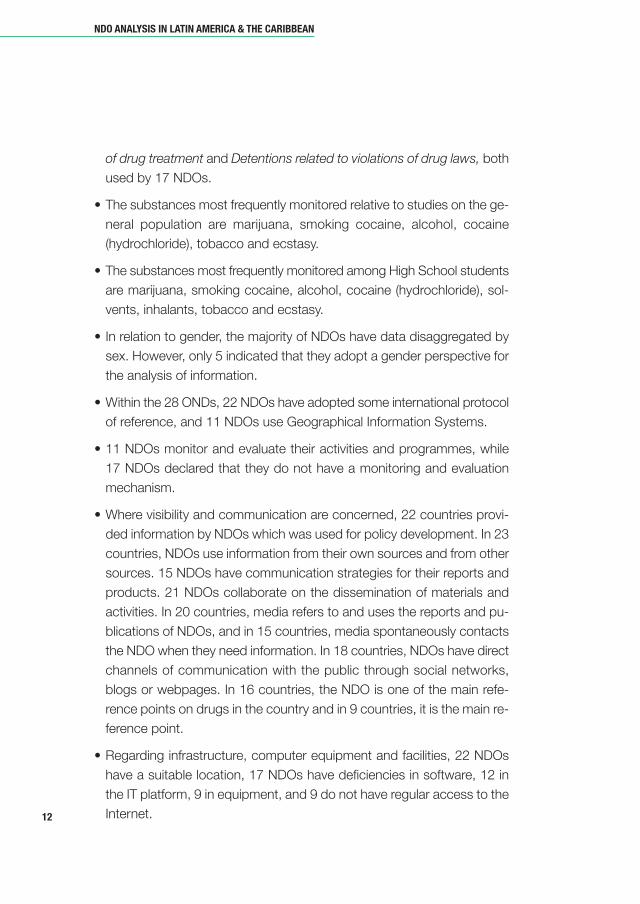
of drug treatment and Detentions related to violations of drug laws, both
used by 17 NDOs.
• The substances most frequently monitored relative to studies on the ge-
neral population are marijuana, smoking cocaine, alcohol, cocaine
(hydrochloride), tobacco and ecstasy.
• The substances most frequently monitored among High School students
are marijuana, smoking cocaine, alcohol, cocaine (hydrochloride), sol-
vents, inhalants, tobacco and ecstasy.
• In relation to gender, the majority of NDOs have data disaggregated by
sex. However, only 5 indicated that they adopt a gender perspective for
the analysis of information.
• Within the 28 ONDs, 22 NDOs have adopted some international protocol
of reference, and 11 NDOs use Geographical Information Systems.
• 11 NDOs monitor and evaluate their activities and programmes, while
17 NDOs declared that they do not have a monitoring and evaluation
mechanism.
• Where visibility and communication are concerned, 22 countries provi-
ded information by NDOs which was used for policy development. In 23
countries, NDOs use information from their own sources and from other
sources. 15 NDOs have communication strategies for their reports and
products. 21 NDOs collaborate on the dissemination of materials and
activities. In 20 countries, media refers to and uses the reports and pu-
blications of NDOs, and in 15 countries, media spontaneously contacts
the NDO when they need information. In 18 countries, NDOs have direct
channels of communication with the public through social networks,
blogs or webpages. In 16 countries, the NDO is one of the main refe-
rence points on drugs in the country and in 9 countries, it is the main re-
ference point.
• Regarding infrastructure, computer equipment and facilities, 22 NDOs
have a suitable location, 17 NDOs have deficiencies in software, 12 in
the IT platform, 9 in equipment, and 9 do not have regular access to the
Internet.
NdO aNalySiS iN laTiN amERiCa & ThE CaRibbEaN
12

• Regarding the position of the observatory’s Director or Coordinator, 13
NDOs indicated that it is a tenured position within the organizational
structure, while 8 indicated that it is a direct and/or political designation.
In 12 NDOs, the current Director or Coordinator has 2 years or less of
seniority in the position.
• The number of full-time, dedicated staff is low in most of the cases. One
NDO has one full-time employee; 12 NDOs have 6 or less, and only 6
NDOs have 7 or more, full-time dedicated staff. Most of NDOs state they
need more staff in order to develop their activities fully.
• 25 NDOs coordinate activities with both drug-specific and non-drug spe-
cific international organizations and programmes, such as CICAD-OAS,
UNODC, COPOLAD, EMCCDA, CARICOM, among others. 2 NDOs
do not coordinate with international organizations. There is no data for
1 NDO.
• 16 NDOs currently have or have offered training programmes in the past
for their staff. The areas with the greatest need for training among NDOs
are multi-method research design, analysis of secondary data and qua-
litative research design (20 NDOs indicated this). Other topics, in order
of importance, are: 19 NDOs awarded a score of 7 or higher to qualita-
tive data analysis and meta-analysis; 18 NDOs indicated the same need
for training in sampling, public health (in general), epidemiology and epi-
demiological research; 17 NDOs indicated training is necessary in des-
criptive and inferential statistical analysis.
• Strategic areas:
– 24 countries consider drug use among young people (prevalence and
incidence) as critical to the mandate of NDOs. The greatest consen-
sus was found here. The majority of countries considered the follo-
wing to be of high importance: prevalence of drug use in the general
population (prevalence and incidence), drug-related offenses, provi-
sion of drug treatment, and the Early Warning System (EWS). In rela-
tion to these strategic areas, the levels of development and the need
for training are quite different.
ExECuTivE SummaRy
13

– Other strategic areas have been considered of high importance by 18
countries: economic cost studies on the impact of social projects. Of
note, only 2 and 3 NDOs, respectively, have developed these areas
while 22 and 23 countries, respectively, identified this area as a high
priority for training.
– Other strategic areas of concern are High risk consumption and Con-
trol of precursors and chemical substances as indicated by 16 and
11 countries, respectively.
• Regarding the training needs, some areas show very low development
and a great demand for training in Drug-related morbidity, economic
costs, Early Warning Systems (EWS), Studies on the impact of social
projects, Research on different modalities of illicit drug trafficking and re-
lated offenses, Drug use among special or vulnerable populations, and
Control of precursors and controlled chemical substances.
• Based on the information provided, the number of studies produced,
the potential to assess the drug situation, the ability to generate relevant
evidence and incorporate different sources, NDOs have been categori-
zed in four areas: minimum, low, medium and high.
• Regarding follow-up of the 11 countries studied in 2011, moderate pro-
gress has been made in institutional consolidation and in budgetary
allocation.
• Regarding the collection and analysis of certain indicators, there has
been a setback among NDOs in countries evaluated in 20111 that have
not demonstrated continuity into 2016.
Based on these results, and considering the challenges associated with a
self-completed questionnaire, this report summarizes the most relevant
conclusions drawn from the data provided and includes recommendations
for the establishment of working groups and training activities planned for
2019 during COPOLAD II.
NdO aNalySiS iN laTiN amERiCa & ThE CaRibbEaN
14
1. For the purpose of present study, it is understood that “preliminary study” is the one made
during COPOLAD I along the year 2011 and published on 2012 during the first part of the
programme. Through these pages both periods are used depending on the year of data was
collected or the study was published.

dN
15
1.1. IntRoductIon
This study was commissioned by the Cooperation Programme bet-
ween Latin America, the Caribbean and the European Union on
Drugs Policies (COPOLAD II). The general objective is to consolidate
National Drug Observatories (NDOs) located in 33 countries of the Com-
munity of Latin American and Caribbean States (CELAC).
The Programme in the frame of its second phase (COPOLAD II) started in
2016 with a duration of 48 months. The Programme aims to strengthen
the cooperation between CELAC and the member states of the European
Union (EU), through activities to optimize and expand the lines of action
opened during its first phase (COPOLAD I). The goal is to improve drug
policies in the CELAC countries, in order to achieve more balanced, com-
prehensive, evidence-based and efficient policies, according to the prin-
ciples of respect and non-intervention in the internal affairs of each
sovereign State.
The Programme COPOLAD II has four Components:
• Component 1: Consolidation of the National Drug Observatories.
• Component 2: Capacity-building in Drug Demand Reduction.
• Component 3: Capacity-building in Drug Supply Reduction.
• Component 4: Support to political dialogue and consolidation of the
EU-CELAC Coordination and Cooperation Mechanism on Drugs.
1. ReseaRch PRoject:GeneRal asPects of the study

The first baseline study conducted in 2011 in the context of COPOLAD I,
showed weaknesses and potentialities in most Latin American countries
in relation to their capacity to generate, collect and disseminate relevant
and high quality information for policy-making1.
In this second phase, COPOLAD II, the study includes the follow-up of 11
Latin American countries that participated in the first study, and a baseline
assessment of the Latin American and Caribbean countries entering the
study for the first time.
A questionnaire was sent to Directors of the National Drug Observatories
(NDOs). In cases where there was no NDO, the questionnaire was sent to
the most appropriate person in the country, according to its National Drug
Council.
The questionnaire collects basic information in areas which identify oppor-
tunities for improvement. Results will allow the Programme to design ac-
tivities to support each country according to its particular situation.
1.2. oBjectIves
This second study aims to identify the current situation and needs of the
National Drug Observatories (NDOs) of the 33 CELAC countries in order
to better define the operational aspects of Component 1 of the Programme
and adjust the activities to different groups of countries.
The 2011 study included 11 countries, Argentina, Bolivia, Brazil, Chile,
Colombia, Costa Rica, El Salvador, Panama, Paraguay, Peru and
Uruguay. For these countries, the 2016 study is a follow-up of the si-
tuation of the NDOs, to identify problems, advances and opportunities
for improvement.
ndo analysIs In latIn aMeRIca & the caRIBBean
16
1. See: Characteristics, Needs and Gaps in Existing Information in Latin American Countries
(Características, necesidades y carencias de información existente de los países de América
Latina. COPOLAD, 2012).

For the remaining CELAC countries —7 in Latin America and 15 in the
Caribbean— not included in the previous study, the objective here is to
describe the current situation of the NDOs and establish a baseline.
These 22 countries are Antigua & Barbuda, The Bahamas, Barbados, Be-
lize, Cuba, Dominican Republic, Dominica, Ecuador, Guatemala, Gre-
nada, Guyana, Haiti, Honduras, Jamaica, Mexico, Nicaragua, St. Kitts &
Nevis, St. Lucia, St. Vincent & the Grenadines, Suriname, Trinidad & To-
bago, and Venezuela.
The follow-up and the baseline will determine the capacity to gather and
disseminate information in CELAC countries. The study will therefore faci-
litate the strengthening of NDOs in the region according to each country’s
particular needs.
The specific objectives of the Study are:
• To describe the characteristics and needs of NDOs in each Latin Ame-
rican and Caribbean country.
• To suggest working groups in countries that will allow COPOLAD to
adapt its activities to the priorities of the NDOS in the region.
• To determine the current situation of the following activities:
– Realization of qualitative studies.
– Availability and functioning of an Early Warning System (EWS).
– Inclusion of a gender perspective based on the indicators collected.
– Availability of specific studies on gender.
– Availability of studies on key populations (prison inmates, epidemio-
logical studies).
– Use of approved indicators in collaboration with the Inter-American
Drug Abuse Control Commission-Organization of American States
(CICAD-OAS) and the European Monitoring Centre for Drugs and
Drug Addiction (EMCDDA) in the framework of COPOLAD I.
• To follow-up on the indicators collected by making a comparison with
the previous 2011 study.
1. ReseaRch PRoject: GeneRal asPects of the study
17

1.3. MethodoloGy
A descriptive, cross-sectional study was defined, designed and executed
under the supervision of the National Drug Observatories of Uruguay and
Argentina. A standardized questionnaire with a majority of closed ques-
tions was produced in Spanish (designated for Spanish-speaking countries
and Brazil) and in English (designated for English-speaking countries, Haiti
and Suriname).
The purpose of this exercise was not only to provide an exhaustive as-
sessment of each National Drug Observatory, but to identify the critical
needs in order to facilitate the design and implementation of activities ad-
dressed to strengthen each Observatory using a participatory process.
The study aims to identify gaps and deficits in terms of what each NDO
requires, its capacity and resources.
An Excel-formatted questionnaire was emailed to focal points in each
CELAC country, focal points provided to COPOLAD, in some cases with
the help of our colleagues from the OID-CICAD/OAS.
Contacts were established via email and phone from the National Drug
Observatories of Uruguay and Argentina and to the study coordinators.
Both the contact persons and the information provided were institutional-
based (NDO or equivalent).
Like the previous 2011 study, published in 2012, processing, analysis and
presentation of the information are based exclusively on the answers pro-
vided in each questionnaire. COPOLAD or the authors are not responsible
for the content of those responses which were provided by the designated
focal points in each country that completed the questionnaire.
DESCRIPTION OF THE QUESTIONNAIRE
According to the guidelines established by COPLAD II, the new question-
naire is based on the previous one (COPOLAD I) but includes the new re-
ndo analysIs In latIn aMeRIca & the caRIBBean
18

quirements coming from the objectives of the present study in order to
be able to stablish a new base line or follow up depending on the country
situation.
Experts from COPOLAD, CICAD/OAS and some NDOs in the region dis-
cussed the first drafts of the questionnaire. The final version is attached in
Annex I.
Given the purpose and objectives of the study, the questionnaire was
structured to be completed by two different groups of countries: those
countries with NDOs, and those without.
For those countries without NDOs, the number of questions posed were
fewer. The objective was to determine which entities managed drug-rela-
ted information, the nature of this information, and their perspective to-
wards the creation of a NDO.
For those countries with a NDO, the questionnaire was structured accor-
ding to areas of information and followed the format of the 2011 question-
naire to allow comparisons. The sections of the questionnaire are as
follows:
• Institutional Dimension.
• Budget. Sources of Funding.
• Information Systems. Inter-institutional Dimension. Networks.
• Areas of Work.
• Indicators.
• Analysis and Production. Reports. Publications.
• Quality. Technical Independence.
• Visibility. Communication.
• Infrastructure. Human and Material Resources.
• Training.
• Strengths and Needs.
1. ReseaRch PRoject: GeneRal asPects of the study
19

These areas of information were defined in the previous 2011 study. Con-
ceptually, the definition of these dimensions draw on two sources. Firstly,
the document Creación de un observatorio nacional de drogas: un manual
conjunto / Building a National Drug Observatory: a Joint Handbook which
“describes in a clear and informative way the core operational processes
and the key strategic factors that are common to all national drug obser-
vatories” (EMCDDA & CICAD/OAS, 2010: 7). This handbook explains the
main aspects of an optimal institutional and organizational design of a drug
Observatory. Secondly, some basic methodological elements of institutional
analysis, in particular, Institutional Capacity Analysis System (Oszlak and
Orellana, 1993). These elements have been applied to examine different
types of institutions and organizations to determine capacity deficits in rou-
tine management, and to evaluate results of a programme or project.
FIELDWORK
The fieldwork was conducted between September and October 2016. An
explanatory letter and the questionnaire were sent to 33 CELAC countries.
29 countries completed the questionnaire on time. Two countries comple-
ted the questionnaire after the deadline and after the First Annual Meeting
of National Drug Observatories of COPOLAD II (Jamaica, December 5th-
9th, 2016), during which a preliminary analysis was presented to the coun-
tries. However, those data are included in this report. Only two countries
did not complete the questionnaire and are not included in this document
(See Table 1).
RESPONSE RATE
The countries’ response rate in 2016 was significantly higher than in the
previous study. In 2011, 11 of 18 countries completed the questionnaire,
i.e. a response rate of 61%. In 2011, of 33 CELAC countries, 29 comple-
ted the questionnaire on time, i.e. a response rate of 88%; 2 more coun-
tries were later added to attain a total of 31 countries, i.e. a response rate
of 94%.
ndo analysIs In latIn aMeRIca & the caRIBBean
20

All countries showed good responsiveness and responsibility in completing
the questionnaire. An intense, proactive follow-up of focal points allowed
us to achieve a very high response rate in short order.
The countries were contacted based on information provided by
COPOLAD. In some cases, the authorities had changed or they were un-
dergoing a transition period. Given the objectives of the study, communi-
cation was established through official institutional channels.
The final sample includes a total of 31 countries that answer the question-
naire: 10 South American countries, 7 Central American countries (inclu-
ding Mexico) and 14 Caribbean countries from a total of 16 in that
sub-region.
The following Table shows the distribution of the final sample of 31 coun-
tries. Two countries did not respond to the questionnaire (St. Lucia, St.
Vincent & the Grenadines), but the coverage generally allowed us to des-
cribe and analyse the development of NDOs in the region.
1. ReseaRch PRoject: GeneRal asPects of the study
21
table 1. countries that have answered/not answered
the questionnaire, per region
rEgION ANswErED NOt ANswErED
South America Argentina, Bolivia, Brazil, Chile,
Colombia, Paraguay, Peru,
Ecuador, Uruguay, Venezuela
Central America Costa Rica, El Salvador,
and Mexico Guatemala, Honduras,
Mexico, Nicaragua, Panama
Caribbean (including Antigua & Barbuda,
Belize, Guyana The Bahamas, Barbados, St. Lucia,
and Suriname) Belize, Cuba, Dominica, St. Vincent &
Grenada, Guyana, Haiti, the Grenadines
Jamaica, Dominican Republic,
St. Kitts & Nevis, Suriname,
Trinidad & Tobago
Source: NDO COPOLAD II 2016.

ndo analysIs In latIn aMeRIca & the caRIBBean
22
table 2. number of countries that answered/not answered
the questionnaire, per region
rEgION ANswErED NOt ANswErED tOtAL
South America 10 0 10
Central America and Mexico 7 0 7
Caribbean (including Belize,
Guyana and Suriname) 14 2 16
Source: NDO COPOLAD II 2016.
The following Table shows that all sub-regions are represented in signifi-
cant number and proportion:
The questionnaires were answered fully, with some exceptions. Responses
were not provided in some areas. Depending on the type of question, cells
left blank were analyzed as missing (e.g., “year of creation of the NDO”) or
“Does not exist” or “Does not apply” (in those cases where the question
asked to fill in the cells only where applicable). In particular cases, where
inconsistencies were detected, the country was contacted to provide fur-
ther precision or additional details.
dN
23
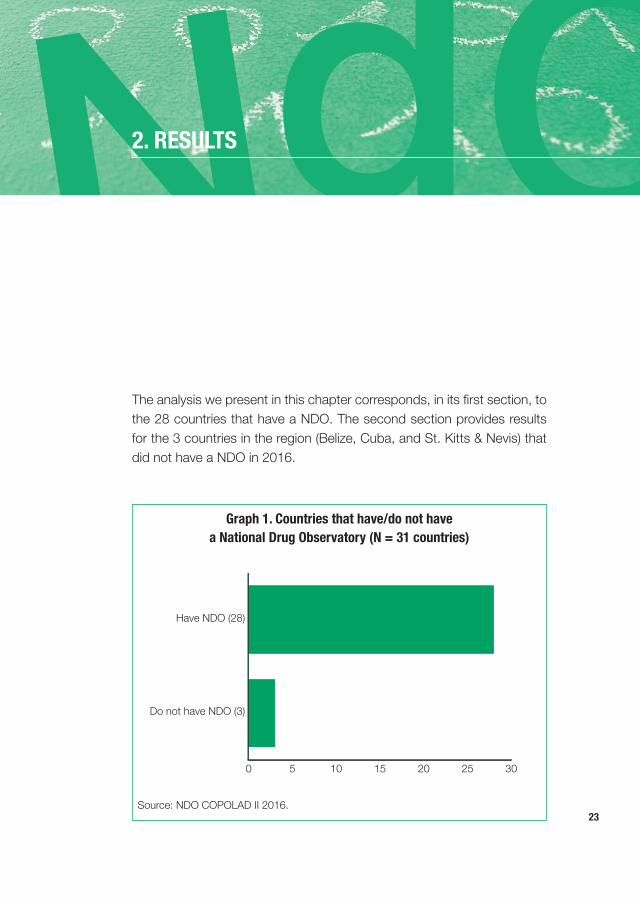
The analysis we present in this chapter corresponds, in its first section, to
the 28 countries that have a NDO. The second section provides results
for the 3 countries in the region (Belize, Cuba, and St. Kitts & Nevis) that
did not have a NDO in 2016.
2. Results
0 5 10 15 20 25 30
Graph 1. Countries that have/do not have
a National Drug Observatory (N = 31 countries)
Have NDO (28)
Do not have NDO (3)
Source: NDO COPOLAD II 2016.

2.1. GeNeRAl DesCRIptIONAND ANAlYsIs Of COuNtRIes wItH NDOs
In the following paragraphs, the results correspond to those 28 countries
with NDOs that answered the questionnaire.
INSTITuTIONAL DIMENSION
This section presents the results on the institutional aspects of the drug
Observatory: the date of its establishment, the type of organization (public,
private) under which the NDO is hierarchically placed, and its position
within a national drug policy.
Year the NDO was established
The 4 oldest NDOs in the region are those of Chile and Guatemala, created
in 1994, followed by Barbados in 1995 and Venezuela in 1999. Between
2000 and 2005, 13 countries established their NDOs, and between 2006
and 2016, 9 other countries established NDOs. Dominica and Haiti did
not indicate the year of establishment of their NDO. The most recent NDOs
are those of Bolivia (2014), Honduras (2015), Bahamas (2015) and Antigua
& Barbuda (2016). Nicaragua indicated that its NDO is “a project that is
being designed”, but the questionnaire was completed as if the NDO is
already functioning. Therefore, this report counts Nicaragua among the
countries with existing NDOs.
In October 2016, when the questionnaires were distributed, 3 countries
did not have a NDO: Belize, Cuba, and St. Kitts & Nevis. Besides, 2
countries did not answer and are not included in the analysis, St Lucia and
St Vincent & the Grenadines from the Caribbean region.
The NDO in Suriname was created in 2005, but has been undergoing a
reorganization since 2010. The CICAD/OAS assists with data manage-
ment in Suriname in relation to supply control with the collaboration of the
police. A proposal has been drafted to relaunch the Observatory and to
involve other relevant institutions. Implementation of a NDO is a priority of
the National Anti-Drug Council of Suriname.
NDO ANAlYsIs IN lAtIN AMeRICA & tHe CARIBBeAN
24

In summary, 17 countries have had a NDO for 10 years or more (i.e., es-
tablished in 2005 or before). Nine countries established their NDO during
the past 10 years (i.e., established in 2006 or later); of them, 4 NDOs were
established very recently (2014 or later) and are in the process of institu-
tionalization. One NDO is presently being set up (in Graph 2 we have in-
cluded this NDO among those recently established). 2 countries did not
provide the year of establishment.
2. Results
25
0 5 10 15 20
Graph 2. Year the NDO was established (N = 28 NDOs)
More than ten years ago(created in 2005 or before) (17)
Source: NDO COPOLAD II 2016.
type of Organization and status within the Government structure
In the region, 27 NDOs are public organizations1 and one country, Guyana,
checked the “Public-Private” option. Guyana selected the “Public-Private”,
but the budget of its Observatory depends on the Ministry of Public Se-
curity. It therefore seems that the NDO is basically a public entity. No
country selected the NGO status.
1. Panama selected the option “Other”, but the NDO is placed under the Executive Secre-
tariat of the National Commission for the Study and Prevention of Drug-related Crimes
(CONAPRED).
Ten years ago or more recently(created in 2006 or later) (9)
N/D (2)

NDOs are positioned differently within the structure of Government. 11
NDOs are part of the Ministry of Justice, Security or Interior; 3 NDOs are
part of the Ministry of Health; 9 NDOs depend directly on the Presidency,
and the rest have mixed arrangements.
This diversity of institutional arrangements for each NDO shows different
ways of conceptualizing drug policy relative to institutional history, the si-
tuation in each country, and reflects different priorities and expertise, for
example, in matters related to demand and supply reduction, drug con-
sumption or trafficking, health, security or Human Rights issues.
For an analysis of the advantages and disadvantages of different locations
of NDOs within the government structure, see Building a National Drug
Observatory: a Joint Handbook (Creación de un observatorio nacional de
drogas: un manual conjunto. EMCDDA & CICAD/OAS, 2010: 110).
NDO ANAlYsIs IN lAtIN AMeRICA & tHe CARIBBeAN
26
0 5 10 15 20 25 30
Graph 3. type of Organization
(N = 28 NDOs)
Public (27)
Public-Private (1)
Source: NDO COPOLAD II 2016.

Inclusion within a strategic or Action plan on Drugs in the Country
and Involvement in the National policy on Drugs
From 28 countries with NDOs, 24 indicate that the work of the Observatory
is included within a strategic or action plan on drugs in the country. 2 NDOs
confirm that there is a strategic or action plan in the country, but the work
of the NDO is not included in that plan; and, finally, 2 other NDOs indicate
that there is no strategic or action plan on drugs in the country.
2. Results
27
In relation to how the Observatory is involved in the national drug policy
(multiple options), 24 NDOs indicate that information from their country is
used to set strategies and policies; 18 indicate that the NDO participates
in activities related to policy monitoring and evaluation; and in 20 countries,
NDOs responded to ad hoc or specific demands. 3 NDOs also mentioned
other mechanisms or forms of involvement.
0 5 10 15 20 25
Graph 4. Inclusion of the NDO in a National strategic or Action plan
(N = 28 NDOs)
NDO is included in a strategic planon drugs for the country (24)
Source: NDO COPOLAD II 2016.
There is a strategic plan on drugs for thecountry, but the NDO is not included (2)
There is no strategic plan on drugsfor the country (2)

BuDGET. SOuRCES OF FuNDING
The operational capacity of NDOs is granted by the existence of a budget
defined according to the areas accomplishing it main fuctions. A NDO
should be able to define its budgetary lines and be accountable for the
use of those funds (EMCDDA & CICAD/OAS, 2010).
The questionnaire asked about the availability of a specific budget for the
NDO, disaggregated by lines of work (research, publications, training, in-
frastructure & equipment and human resources), considered critical to the
functioning and development of the NDO. The questionnaire also asked
about the sources of funding for those critical lines and for ad hoc or par-
ticular activities.
From the total number of NDOs, 13 have a specific budget for research,
13 for publications, 9 for training, 12 for infrastructure & equipment, and
17 have a specific budget to support staff who work at the Observatory.
NDO ANAlYsIs IN lAtIN AMeRICA & tHe CARIBBeAN
28
0 5 10 15 20 25
Graph 5. Involvement of the NDO in National Drug policy
(Multiple Options) (N = 28 NDOs)
Its information is used to setstrategy and policy (24)
In monitoring and evaluation (18)
In relation to ad hoc,specific demands (20)
Other (3)
Source: NDO COPOLAD II 2016
2. Results
29
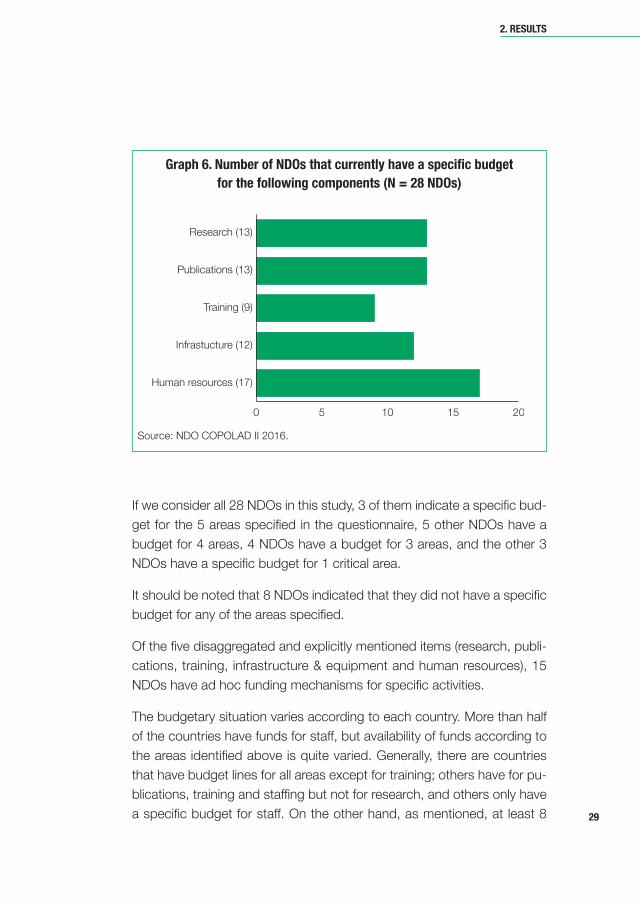
0 5 10 15 20
Graph 6. Number of NDOs that currently have a specific budget
for the following components (N = 28 NDOs)
Research (13)
Publications (13)
Training (9)
Infrastucture (12)
Human resources (17)
Source: NDO COPOLAD II 2016.
If we consider all 28 NDOs in this study, 3 of them indicate a specific bud-
get for the 5 areas specified in the questionnaire, 5 other NDOs have a
budget for 4 areas, 4 NDOs have a budget for 3 areas, and the other 3
NDOs have a specific budget for 1 critical area.
It should be noted that 8 NDOs indicated that they did not have a specific
budget for any of the areas specified.
Of the five disaggregated and explicitly mentioned items (research, publi-
cations, training, infrastructure & equipment and human resources), 15
NDOs have ad hoc funding mechanisms for specific activities.
The budgetary situation varies according to each country. More than half
of the countries have funds for staff, but availability of funds according to
the areas identified above is quite varied. Generally, there are countries
that have budget lines for all areas except for training; others have for pu-
blications, training and staffing but not for research, and others only have
a specific budget for staff. On the other hand, as mentioned, at least 8

NDO ANAlYsIs IN lAtIN AMeRICA & tHe CARIBBeAN
30
0 1 2 3 4 5 6 7 8
Graph 7. Number of NDOs according to the number of areas
with a specific budget line (N = 28 NDOs)
N/D (5)
None (8)
1 area (3)
2 areas (0)
3 areas (4)
4 areas (5)
5 areas (3)
Source: NDO COPOLAD II 2016.
countries do not have a specific budget for any of the areas. In some
cases, the budget for a particular area is managed by another department
or is assigned in a more general way.
In several countries, the NDO has funding that is not specific to the Ob-
servatory or to its activities, but funds are allocated to the Secretariat or to
the Ministry to which it is attached. A country that has the capacity to ma-
nage its own budget, fosters the independence of the Observatory, as well
as its future stability.
Regarding the source of financing for the specific budget of the NDO and
its various areas, almost all mention the National Government, or the co-
rresponding Ministry or Secretary of the Executive Power. Additionally 4
countries of a total of 28 mention other sources, such as the OAS, the
uSAID or the European union (Eu).

For ad hoc activities, external funds are mentioned in 15 countries. The
CICAD/OAS is the most frequent source, followed by the Eu, uSAID and
Pan American Health Organization (PAHO/WHO), as well as domestic
sources. 1 country mentions the existence of a Confiscated Asset Fund.
INFORMATION SySTEMS. INTER-INSTITuTIONAL NETWORKS
production and use of Information
One of the key functions of NDOs is to obtain and track data at the national
level, as well as to analyze and interpret the information collected. For
drug-related information and data, we understand all quantitative or qua-
litative information collected from a routine, systematic or ad hoc manner
that has to do with one or more aspects of the drug phenomenon
(EMCDDA & CICAD/OAS, 2012: 44).
In relation to the information managed by the NDO, countries were asked
whether such information is exclusively produced by them, produced by
other institutions, or whether it is a combination of the two.
2. Results
31
0 5 10 15 20 25
Graph 8. Information managed by the NDO
(N = 28 NDOs)
Produced both by the NDOand other institutions (25)
Has been producedby the NDO (2)
Has been produced by other institutions (1)
Source: NDO COPOLAD II 2016.

NDO ANAlYsIs IN lAtIN AMeRICA & tHe CARIBBeAN
32
Of 28 NDOs, 25 manage information on drugs produced by them and by
other institutions. 2 NDOs manage the information and one indicated that
it manages information produced by other institutions only.
Approximately half of the NDOs have no problem in relation to inter-agency
collaboration. However, 15 NDOs indicated that they do have difficulties
in accessing information generated by other institutions.
The reasons given for these challenges were many and such as political,
operational, and financial issues, work overload at the NDO and/or at other
agencies, lack of financial incentives for inter-institutional collaboration, and
the fact that data exists but is not available.
NDOs are often incorporated into more
complex information systems. NDOs
were therefore asked about a National
Drug Information System (NDIS) ope-
rational in the country. In 9 cases, a
NDIS operates in the country and in 15
cases, the response was “partially”.
This situation requires special analysis
in order to establish what the weak-
nesses and the obstacles are to be
overcome in order to accelerate the
creation of a NDIS. The recent creation
of NDOs, the lack of institutional coor-
dination, even the type of affiliation wi-
thin the institutional structure of the
country might clarify the weakness of
the NDIS.
A National Drug Information
System (NDIS) refers to a struc-
tured organization of heteroge-
neous sources of information
necessary to obtain a compre-
hensive perspective of the drug
situation. The system describes
the sources and patterns of in-
formation requested by the na-
tional reference system. The
elements of this system are not
necessarily connected through
hierarchical relationships and
their financial resources do not
originate from a single budge-
tary source (see EMCDDA &
CICAD/OAS, 2010: 46-7).
SCOPE OF WORK
In terms of major areas of work, all 28 NDOs included the production or
management of information on drug demand reduction; 24 NDOs also in-

cluded the supply reduction area; and 15 NDOs are involved in the moni-
toring and evaluation of drug-related programmes, plans and projects.
2. Results
33
In relation to studies conducted by NDOs, 19 indicated that they have con-
ducted studies on the general population, 22 indicated they did so on High
School students, while 16 indicated that they conducted studies on pa-
tients receiving drug treatment.
In addition, 22 NDOs conducted some type of study on a specific popu-
lation and/or used some methodology other than the survey. Within these
type of studies, 13 NDOs conducted studies on incarcerated adults, 12
on university students, and 10 conducted qualitative studies.
Some countries conduct studies on detained juvenile offenders, on specific
drug consumption patterns (marijuana, freebase/coca paste, synthetic
drugs), on adolescents (in addition to High School students), employees
0 5 10 15 20 25 30
Graph 9. scope of the NDO Mandate
(N = 28 NDOs)
Demand reduction (28)
Supply control (24)
Evaluation of plans,programmes and projects (15)
Source: NDO COPOLAD II 2016.

NDO ANAlYsIs IN lAtIN AMeRICA & tHe CARIBBeAN
34
(according to their profession or trade union affiliation), etc. In some cases,
mention was made of studies on emerging consumption patterns, such
as “biddies” or electronic cigarettes.
Regarding general population studies, households, students or patients
in drug treatment, samples often maintained national representation. In
more specific studies, samples did not usually claim such representation,
but were circumscribed to specific territorial units and/or to specific con-
texts (institutional, situational, etc.).
0 5 10 15 20 25
Graph 10. Number of NDOs that conduct specific studies
(N = 28 NDOs)
High School students (22)
General population (19)
Patients in drug treatment centres (16)
Incarcerated adults (13)
university students (12)
Qualitative studies (10)
Specific studies on gender (5)
Source: NDO COPOLAD II 2016.
Regarding the number of studies conducted between 2011 and 2016, 16
NDOs carried out 5 studies or less, 4 NDOs carried out between 6 and
12 studies, 1 NDO carried out 21 studies, another did 28 and another con-
ducted 33 studies. 5 NDOs did not provide this information.

2. Results
35
0 5 10 15 20
Graph 11. Number of NDOs per number of studies conducted
between 2011 and 2016 (N = 28 NDOs)
21 studies or more (3)
6-12 studies (4)
5 studies or less (16)
N/D (5)
Source: NDO COPOLAD II 2016.
0 5 10 15 20 25
Graph 12. Number of NDOs that have developed/not developed
collaborations with other stakeholders (2011-2016) (N = 28 NDOs)
yes (25)
No (3)
Source: NDO COPOLAD II 2016.
Of 28 NDOs, 25 indicated that they developed collaborative efforts with
other stakeholders during the period, 2011-2016.
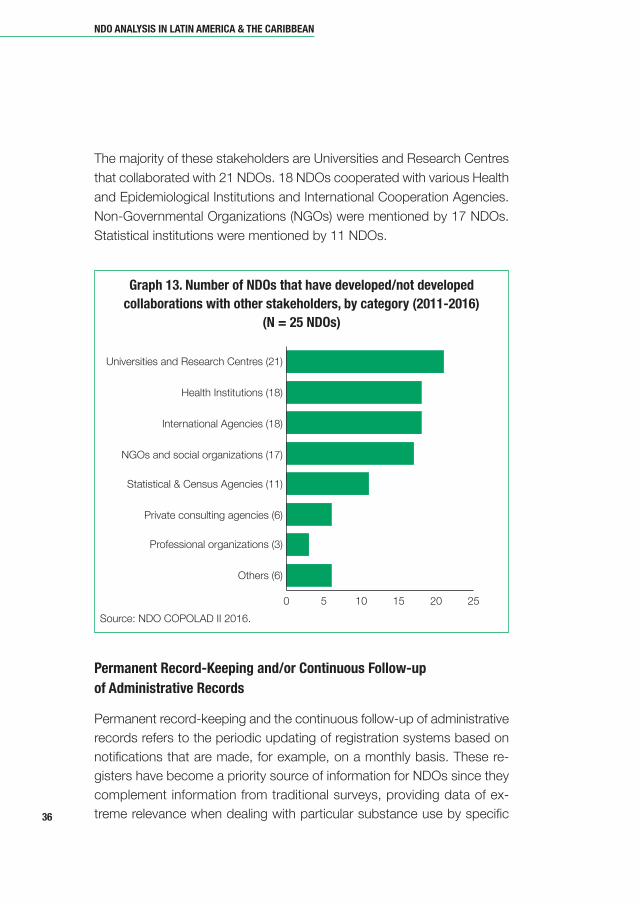
The majority of these stakeholders are universities and Research Centres
that collaborated with 21 NDOs. 18 NDOs cooperated with various Health
and Epidemiological Institutions and International Cooperation Agencies.
Non-Governmental Organizations (NGOs) were mentioned by 17 NDOs.
Statistical institutions were mentioned by 11 NDOs.
NDO ANAlYsIs IN lAtIN AMeRICA & tHe CARIBBeAN
36
0 5 10 15 20 25
Graph 13. Number of NDOs that have developed/not developed
collaborations with other stakeholders, by category (2011-2016)
(N = 25 NDOs)
Source: NDO COPOLAD II 2016.
universities and Research Centres (21)
Health Institutions (18)
International Agencies (18)
NGOs and social organizations (17)
Statistical & Census Agencies (11)
Private consulting agencies (6)
Professional organizations (3)
Others (6)
permanent Record-Keeping and/or Continuous follow-up
of Administrative Records
Permanent record-keeping and the continuous follow-up of administrative
records refers to the periodic updating of registration systems based on
notifications that are made, for example, on a monthly basis. These re-
gisters have become a priority source of information for NDOs since they
complement information from traditional surveys, providing data of ex-
treme relevance when dealing with particular substance use by specific

2. Results
37
populations (eg. patients in drug treatment, hospitalizations, traffic acci-
dents, among others).
Of 28 NDOs, 20 have permanent updating systems and/or continuous
follow-up of administrative records from other institutions or secondary
sources (Graph 14).
The characteristics of the permanent record-keeping and/or continuous
follow-up of administrative records are diverse:
• 8 NDOs maintain administrative records on patients in drug treatment
or on the demand for treatment (in 3 cases, they have their own records;
in 9 cases, the records are kept by third-parties; in 3 cases, both sce-
narios apply).
• 5 NDOs maintain records on mortality (in 4 cases, they have their own
records; in 1 case, they maintain their own records and some data is
kept by third parties).
• 7 NDOs maintain records on morbidity (in all cases, records are kept by
third parties).
• 7 NDOs maintain records on drug-related traffic accidents (in 6 cases,
by third parties; in 1 case, they maintain their own records and some
data is kept by third parties).
• 14 NDOs maintain records on drug seizures and/or precursors (in 11
cases, these records are maintained by third parties; in 3 cases, they
maintain their own records and some data is kept by third parties).
• 13 NDOs maintain records on the seizure of goods related to drug traf-
ficking (in 1 case, they maintain their own records; in 9 cases, the data
is kept by third parties; in 2 cases, there is a combination; in 1 case,
there is no data).
• 10 NDOs maintain records on prison inmates (in 1 case, they maintain
their own records; in 9 cases, the records are kept by third parties).
• 3 NDOs maintain records on drug-related violence (in 1 case, they main-
tain their own records; in 2 cases, the data is kept by third parties).
From a total of 20 countries that maintain administrative records, only 13
NDOs periodically reported these data. 8 NDOs disseminated between 1

NDO ANAlYsIs IN lAtIN AMeRICA & tHe CARIBBeAN
38
and 4 reports, and 1 had more than 5. No information is available for the
other NDOs (Graph 15).
0 3 6 9 12 15
Graph 15. Number of NDOs that produce periodic reports
using administrative data (N = 20 OND)
yes (13)
No (2)
N/D (5)
Source: NDO COPOLAD II 2016.
0 5 10 15 20
Graph 14. Number of Countries with permanent Records
and/or Continuous follow-up of Administrative Records (N = 28 NDOs)
Keep records (20)
Do not keep records (8)
Source: NDO COPOLAD II 2016.

early warning systems (ews)
The 2011 and 2013 uNODC Reports on drug use highlights the stability
of natural drug use and an “alarming” increase in the so-called New
Psychoactive Substances (NPS) which are of synthetic origin (Suarez and
Rossal, 2015).
NPS are clandestinely synthesized substances that seek to mimick or in-
crease the effects of classical psychoactive substances. Many of them
arise from the simple modification of the molecular structure of a subs-
tance already known and controlled by International Conventions. When
creating a new substance with a different structure, it is not covered by
existing regulations and it therefore evades the existing controls and bans.
under this new category of NPS, we may also include the new usage of
traditional drugs that reappear, or that were already known but had not
been previously abused (Suarez and Rossal, 2015).
Among the most notable features of NPS is the “de-territorialization” of
their production, which makes any location on the planet a potential point
of production. This occurs since NPS do not depend on cultivated plants,
and due to geopolitical reasons. The scope of trafficking and the distribu-
tion routes are bigger (the Internet being one of the key channels of com-
mercialization with the consequent accessibility and comfort that the tool
offers to its users) and the diversity of materials which might even be legal
or controlled. According to reports, this factor explains the increase by
more than 100% of NSPs over a 5 year period from 2009 to 2014 (Suarez
and Rossal, 2015).
From a consumption point of view, the greatest problem associated with
these substances is the lack of knowledge of their composition and their
interaction with other drugs. At a basic level, different substances are la-
beled similarly according to their chemical composition on the assumption
that they produce similar effects and consequences. users are then ex-
posed to risks of which they are unaware.
Countries, and in particular their NDO, need tools that facilitate access to
correct and up-to-date information about a vertiginous reality. In this con-
2. Results
39

text, the Early Warning System (EWS) is extremely useful to keep perma-
nent surveillance on the situation.
An EWS is a network of stakeholders, collaborators and partners who
focus on drug use and whose purpose is to identify the emergence of new
drugs and/or new patterns of consumption (EMCDDA & CICAD/OAS,
2010: 34). The EWS also evaluates the risks of these drugs and/or the
patterns of consumption, and coordinates decision-making in terms of the
level of risk to the public.
From all the countries, 7 indicated that they have the EWS. In 5 of them,
the EWS is coordinated by the NDO, while in Chile and the Bahamas, their
EWS is not coordinated by the NDO. The countries that currently have an
EWS are Argentina, Colombia, Mexico, Venezuela and uruguay. However,
it is important to note when considering this activity, that Colombia and
uruguay are the only ones that have actually issued alerts in 2013 and
2014. The others are at an early stage or have had very modest activity. In
the case of Brazil, it is said that the EWS is “in progress”. The other 21
countries in Latin America and the Caribbean region report that they do
not have Early Warning Systems.
NDO ANAlYsIs IN lAtIN AMeRICA & tHe CARIBBeAN
40
table 3. NDOs that have/do not have an early warning system
Have but Not Have aNd
do Not Have coordiNated by Ndo coordiNated by Ndo
Antigua & Barbuda, The Bahamas Argentina
Barbados, Bolivia, Brazil, Chile Colombia
Costa Rica, Dominica, Mexico
Ecuador, El Salvador, uruguay
Grenada, Guatemala, Venezuela
Guyana, Haiti, Honduras,
Jamaica, Nicaragua,
Panama, Paraguay, Peru,
Dominican Republic,
Surinam, Trinidad & Tobago
21 2 5
Source: NDO COPOLAD II 2016

It is important to make these distinctions since one of the objectives of
COPOLAD II is to contribute to the promotion and consolidation of EWS
in CELAC countries. This therefore requires consolidation of systems ca-
pable of launching alerts in a sustainable way.
As regards the EWS coordinated by the NDO, one of these systems has
been operating for 3 years. Another 3 EWSs have been in place for 1-2
years, while the other has been operating for less than a year. One country,
Brazil, says that its EWS is “in progress”.
Most of those EWSs comprise stakeholders from the clinical or health care
fields, from the supply control area, those who conduct biological and/or
chemical scientific research, and institutions that conduct social research.
In two cases, forensic personnel, international and other organizations were
mentioned. In one case, teams/institutions from other countries were men-
tioned. EWSs are diverse in terms of their numbers ranging from 7 to 340.
2. Results
41
0 1 2 3 4
Graph 16. Number of early warning systems according
to stakeholders and institutions that integrate them (N = 5)
Source: NDO COPOLAD II 2016.
Clinical Field/Health care (4)
Supply control (4)
Teams and institutions conducting scientific,
chemical and/or biological research (4)
Social research (4)
Forensics (2)
International organizations (1)
Teams and institutions
from other countries (1)
Other (2)

NDO ANAlYsIs IN lAtIN AMeRICA & tHe CARIBBeAN
42
Of the 5 NDOs with EWSs in operation, only 2 made 4 reports in the last
two years, while 1 indicated having produced 1 report. The other 2 did not
provide any information.
INDICATORS
Approved Indicators
In the context of COPOLAD I, NDOs agreed to use basic indicators on de-
mand reduction and supply control. To achieve this, the first activity con-
sisted of a review of the indicators collected by the EMCDDA, CICAD, and
the uN (ARQ), as well as those designed by the Observatories themselves.
This was communicated through a structured questionnaire in 2011. That
questionnaire included 17 indicators on demand reduction and supply
control.
In the 2016 edition, this trend is captured with a set of agreed indicators
and others that are frequently used, but these have not yet achieved con-
sensus by all countries. The validation of some indicators is still pending.
0 5 10 15 20
Graph 17. Number of NDOs that work with approved indicators
(COpOlAD, 2012) (N = 28 NDOs)
13 indicators (1)
9 - 12 indicators (18)
5 - 8 indicators (6)
1 - 4 indicators (2)
Source: NDO COPOLAD II 2016.

The 13 agreed indicators included in the 2016 survey are as follows:
• Prevalence of substance use.
• Drug abuse.
• Drug dependence.
• Age of initiation of substance use.
• Incidence of substance use (lifetime, past year, past month).
• Perception of risk associated with drug use.
• Supply of drugs.
• Potential demand for drug treatment and rehabilitation.
• Mortality associated with drug use2.
• Morbidity associated with drug use.
• Persons in drug treatment.
• Drug seizures.
• Purity and chemical composition of drugs.
As seen in Graph 17 in relation to the 13 agreed indicators, 1 NDO works
with all indicators, 18 NDOs work with 9-12, 6 NDOs work with 5-8, and
2 NDOs only work with 1-4 indicators.
The following Graph shows the number of NDOs that work with indicators
that were approved in 2012.
The most widely used indicator is Age of Initiation of Substance Use (26),
followed by Prevalence of Substance Use, Perception of Risk associated
with Drug Use and Persons in Treatment (24); Supply of Drugs (23), and
Drug Seizures (22). The least used indicators are those related to mortality
and morbidity associated with drug use.
2. Results
432. Although this indicator was agreed, it was later sent to PAHO for review.

Indicators not Approved
As much as countries were asked about the work of NDOs, there were
14 indicators that did not reach the consensus of all countries, and for this
reason, we refer to them as “not approved”. The 14 indicators that fall
under the category of “not approved” are:
• Perceived availability of drugs.
• Mortality indirectly associated with drug use.
• Prevalence/incidence of HIV and/or other diseases (hepatitis B, hepatitis C)
among people who use injectable or non-injectable drugs.
NDO ANAlYsIs IN lAtIN AMeRICA & tHe CARIBBeAN
44
0 5 10 15 20 25 30
Graph 18. Number of NDOs that work with approved indicators
(COpOlAD, 2012), per indicator (N = 28 OND)
Source: NDO COPOLAD II 2016.
Age of initiation (26)
Prevalence of substance use (24)
Perception of risk associated (24)
Persons in treatment (24)
Supply of drugs (23)
Drug seizures (22)
Drug abuse (22)
Drug dependence (22)
Incidence of substance use (22)
Potential demand of treatment (17)
Purity and chemical compounds (11)
Morbidity associated with drug use (8)
Mortality directly associated (7)

• Supply of drug treatment.
• Arrests related to violations of drug laws.
• Substance-related traffic accidents.
• Drug-related gender violence.
• Potency of cocaine production.
• Areas of coca cultivation.
• Quantity and number of seizures of chemical precursors used in the ma-
nufacture of illicit drugs.
• Seizures of goods related to drug trafficking.
• Number of dismantled illicit laboratories and other sites of production or
infrastructure.
• Price of drugs at retail level.
• Projects on sustainable development.
Graph 19 shows that 3 NDOs work with 9 to 11 of the “not approved” in-
dicators, 15 NDOs work with 5 to 8 indicators, and 8 NDOs work with 1
to 4. 2 NDOs do not use these indicators at all.
2. Results
45
0 3 6 9 12 15
Graph 19. Number of NDOs that work with selected “not approved”
indicators (N = 14 indicators)
9 - 11 indicators (3)
5 - 8 indicators (15)
1 - 4 indicators (8)
Source: NDO COPOLAD II 2016.

Graph 20 shows the number of NDOs that work with indicators that were
not approved in 2012.
From this set of indicators, the most frequently used is Perceived avai-
lability of drugs (used by 25 NDOs), followed by the Supply of drug
treat ment and Detentions related to violations of drug laws, both used
by 17 NDOs.
NDO ANAlYsIs IN lAtIN AMeRICA & tHe CARIBBeAN
46
0 5 10 15 20 25
Graph 20. Number of NDOs that work with “not approved” indicators
(COpOlAD, 2012) (N = 28 NDOs)
Source: NDO COPOLAD II 2016.
Supply of treatment (17)
Detentions (17)
Seizures of goods (15)
Seizures of chemical precursors (13)
Incidence HIV and/or other infections (11)
Price of drugs at retail level (9)
Substance-related traffic accidents (8)
Number of dismantled laboratories (8)
Potency of cocaine production (5)
Projects of sustainable development (5)
Cultivated areas of coca (4)
Drug-related gender violence (3)
Mortality (3)
Perceived availability of drugs (25)

2. Results
47
Indicators used for selected studies
The questionnaire also requested information on indicators used for stu-
dies on the general population and studies on High School students.
We identified 10 essential indicators based on the epidemiological situa-
tion of drug use in each country. Information was requested on the follo-
wing 10 indicators: Lifetime prevalence, Year prevalence, Year incidence,
Month incidence, Age of ini tiation, Abuse, Dependence, Perceived risk,
Perceived availability, and Supply of drugs.
Although we identified a number of substances that are critical to both
studies (tobacco, alcohol, tranquilizers without medical prescription, sti-
mulants without medical prescription, solvents and inhalants, marijuana,
cocaine hydrochloride, smoking cocaine, ecstasy, hallucinogens, hashish,
heroin, opium, morphine without medical prescription, ketamine, amphe-
tamines, methamphetamines and other drugs), we also observed great
variance between countries both in relation to the number of indicators
they use, and on the populations they analyze. For example, studies on
High School students only focused on alcohol abuse (“binge drinking”)
and signals of problematic use of marijuana (eg. CAST: CAGE Substance
Abuse Screening Tool).
Where High School populations are concerned, indicators on Perceived
risk, Perceived availability and Supply of drugs are only available for some
substances. In relation to perceived risk, studies focused on alcohol, to-
bacco, tranquilizers, stimulants, solvents and inhalants, marijuana, cocaine
(hydrochloride), smoking cocaine and ecstasy.
Regarding Perceived availability, studies focused on marijuana, cocaine
(hydrochloride), smoking cocaine, ecstasy and methamphetamines.
Finally, where the Supply of drugs is concerned, information is collected
only for marijuana, cocaine (hydrochloride), smoking cocaine, ecstasy and
methamphetamines.

NDO ANAlYsIs IN lAtIN AMeRICA & tHe CARIBBeAN
48
table 4. Number of NDOs that work with specific indicators
on psychoactive substances in studies for general population
(N = 28 NDOs)
substaNces life year year moNtH
Tobacco 18 16 14 13 16 8 11 13 6 5
Alcohol 18 17 14 13 16 15 14 15 6 6
Tranquillizers 18 16 12 11 15 6 7 12 7 5
Stimulants 17 16 12 12 13 3 5 12 6 4
Solvents 18 16 13 11 14 5 7 10 8 5
Marijuana 18 16 14 13 16 12 14 15 15 10
Cocaine 17 17 13 12 15 9 11 15 14 9
Smoking cocaine 18 17 13 12 16 10 11 14 15 9
Ecstasy 17 16 13 11 14 6 5 14 12 8
Hallucinogens 15 12 8 8 11 3 3 5 6 4
Hashish 10 7 5 4 7 2 1 3 2 2
Heroine 13 11 7 6 10 4 3 7 7 5
Opium 8 5 5 4 7 2 1 3 2 2
Morphine 10 7 5 4 7 2 1 3 2 2
Ketamine 10 7 5 4 7 3 2 5 3 3
Amphetamine 12 10 7 5 9 4 3 6 5 4
Methamphetamine 9 9 6 5 7 3 2 5 3 3
Other drugs 12 8 8 5 8 3 4 3 4 1
Source: NDO COPOLAD II 2016.
su
PP
ly
of
dr
ug
s
Pe
rc
eiv
ed
ava
ila
bil
ity
Pe
rc
eiv
ed
ris
k
de
Pe
Nd
eN
ce
ab
us
e
ag
e o
f
iNit
iat
ioN
Pr
eva
le
Nc
e
iNc
ide
Nc
e

2. Results
49
table 5. Number of NDOs that work with specific indicators
on psychoactive substances in studies for High school students
(N = 28 NDOs)
substaNces life year year moNtH
Tobacco 23 21 18 16 23 9 12 19 13 12
Alcohol 23 21 18 15 23 15 13 20 14 14
Tranquillizers 21 21 16 15 20 6 8 18 12 8
Stimulants 20 20 15 14 17 5 8 18 11 8
Solvents 22 21 17 16 21 7 9 18 13 10
Marijuana 23 21 19 17 22 15 12 20 19 15
Cocaine 21 21 16 15 20 6 8 19 17 14
Smoking cocaine 22 21 17 15 21 8 9 19 18 15
Ecstasy 21 18 14 13 17 5 6 17 15 12
Hallucinogens 19 14 10 10 16 4 5 12 9 8
Hashish 11 10 8 8 10 2 3 6 5 5
Heroine 19 13 10 10 14 3 5 12 10 9
Opium 9 7 7 7 8 2 2 5 4 3
Morphine 11 7 7 7 9 3 3 5 4 4
Ketamine 9 7 6 6 10 2 3 6 4 4
Amphetamine 15 13 9 9 15 4 4 9 8 5
Methamphetamine 14 10 8 8 12 1 3 8 8 6
Other drugs 11 8 6 6 9 1 2 5 3 2
Source: NDO COPOLAD II 2016.
su
PP
ly
of
dr
ug
s
Pe
rc
eiv
ed
ava
ila
bil
ity
Pe
rc
eiv
ed
ris
k
de
Pe
Nd
eN
ce
ab
us
e
ag
e o
f
iNit
iat
ioN
Pr
eva
le
Nc
e
iNc
ide
Nc
e

Regarding studies on the general population, while it is possible to evaluate
signs of Problematic drug use (through the CIE-10 scale) for all substances
(except for alcohol for which the AuDIT scale is used), this study focuses
only on marijuana, cocaine hydrochloride and smoking cocaine. At the
same time, the analysis of indicators of Perceived risk will only be on alco-
hol, tobacco, tranquillizers, stimulants, marijuana, cocaine (hydrochloride),
smoking cocaine and ecstasy. In relation to Perceived availability and
Supply of drugs, we will focus on marijuana, cocaine hydrochloride, smo-
king cocaine, ecstasy, methamphetamines and solvents (the latter only for
perceived availability).
Tables 4 and 5 show the indicators used, and substances according to
each NDO. They allow us to observe strengths and weaknesses of the as-
sessment.
Gender
In the 2016 study, we incorporated the dimension of “Gender” as one of
the main areas of analysis.
This perspective places “Gender” as one of the fundamental, underesti-
mated areas in our understanding of the complexity of the drug pheno-
menon. It also highlights the importance of generating systematic evidence
that facilitates good practice and the creation of interventions with a gen-
der focus.
While it is increasingly common to find disaggregated information by gen-
der, the information available does not necessarily lead to a gender analysis
and specific data are not necessarily translated into policy, plans and public
services. Such knowledge would greatly contribute to refining public poli-
cies and to achieving greater effectiveness (COPOLAD, 2014).
Three gender-related questions were included in the 2016 survey: availa-
bility of data disaggregated by sex, the incorporation (or not) of a gender
perspective for the analysis of information, and the conduct of specific stu-
dies on gender.
NDO ANAlYsIs IN lAtIN AMeRICA & tHe CARIBBeAN
50

2. Results
51
table 6. Number of NDOs that conduct specific studies on gender
(N = 28)
Nº couNtries
conduct 5 Argentina, Brazil, Colombia, Costa Rica, Nicaragua
do not 23 Antigua & Barbuda, The Bahamas, Barbados, Bolivia,
conduct Chile, Dominica, Ecuador, El Salvador, Grenada,
Guatemala, Guyana, Haiti, Honduras, Jamaica,
Mexico, Panama, Paraguay, Peru, Dominican Republic,
Surinam, Trinidad & Tobago, uruguay, Venezuela
Source: NDO COPOLAD II 2016.

An analysis of the data collected through these three questions indicate
that the answers to the second question (incorporation of a gender pers-
pective) refer more to having data disaggregated by sex, than to incorpo-
rating a gender approach in the analysis of disaggregated data. Confusion
may have occurred due to ambiguity in the design of the question.
For the purpose of analyzing the results of the current study, we only con-
sidered responses to the questions referring to:
• Availability of data disaggregated by sex.
• The conduct of specific gender studies.
From all the indicators mentioned above, 26 of 28 NDOs have data disag-
gregated by sex; 1 NDO said it does not keep this data; and 1 did not
answer the question.
In addition to requesting information on the disaggregation of data by sex
and the adoption of a gender perspective, we asked whether the NDO
conducts specific studies on gender.
Of the total number of NDOs, 5 conduct this type of study, 3 from South
America and 2 from Central America.
epidemiological studies
In relation to other studies, only 8 of 28 NDOs conduct epidemiological
studies (Table 7). It is worth emphasizing the importance of monitoring po-
pulations that are not accessible by traditional methods or for which there
is inadequate information. The consolidation of different research methods
within the mandate of NDOs must be a priority activity to strengthen them.
Incarcerated Adults
13 NDOs conduct studies on incarcerated adults, while 15 NDOs do not
conduct that type of study. Given the importance of studies that delve into
the relationship between drugs and crime, there is a need to address the
study of specific aspects regarding this population.
NDO ANAlYsIs IN lAtIN AMeRICA & tHe CARIBBeAN
52

2. Results
53
table 7. Number of NDOs that conduct epidemiological studies
(N = 28)
Nº couNtries
conduct 8 Argentina, Colombia, Ecuador, Nicaragua, Panama,
Dominican Republic, uruguay, Venezuela
do not 20 Antigua & Barbuda, The Bahamas, Barbados, Brazil,
conduct Bolivia, Chile, Costa Rica, Dominica, El Salvador,
Grenada, Guatemala, Guyana, Haiti, Honduras,
Jamaica, Mexico, Paraguay, Peru, Surinam,
Trinidad & Tobago
Source: NDO COPOLAD II 2016.

NDO ANAlYsIs IN lAtIN AMeRICA & tHe CARIBBeAN
54
table 8. Number of NDOs that conduct studies on incarcerated adults
(N = 28 NDOs)
Nº couNtries
conduct 13 Argentina, Barbados, Bolivia, Brazil, Colombia,
Costa Rica, Dominica, Jamaica, Nicaragua, Peru,
Dominican Republic, Surinam, uruguay
do not 15 Antigua & Barbuda, The Bahamas, Chile, Ecuador,
conduct El Salvador, Grenada, Guatemala, Guyana, Haitíi
Honduras, Mexico, Panama, Paraguay,
Trinidad & Tobago, Venezuela
Source: NDO COPOLAD II 2016.

2. Results
55
Qualitative studies
Additionally, 10 NDOs out of 28 indicated that they conduct qualitative stu-
dies and 18 indicated that did not conduct studies using that methodology.
table 9. Number of NDOs that conduct qualitative studies
(N = 28 NDOs)
Nº couNtries
conduct 10 Argentina, Barbados, Bolivia, Brazil, Chile, Colombia,
Jamaica, Dominican Republic, uruguay, Venezuela
do not 18 Antigua & Barbuda, The Bahamas, Dominica, Ecuador,
conduct El Salvador, Grenada, Guatemala, Guyana, Haiti,
Honduras, Mexico, Nicaragua, Panama, Paraguay,
Peru, Surinam, Trinidad & Tobago
Source: NDO COPOLAD II 2016.

ANALySIS AND GENERATION OF REPORTS AND PuBLICATIONS
Adoption of protocols
The responses indicated that 22 NDOs use some international protocol
as a reference for the collection and monitoring of data.
NDO ANAlYsIs IN lAtIN AMeRICA & tHe CARIBBeAN
56
0 5 10 15 20 25
Graph 21. Number of NDOs that adopted
International protocols (N = 28 NDOs)
At least once (22)
No protocol adopted (6)
Source: NDO COPOLAD II 2016.
Among the 22 NDOs that adopted at least one international protocol, 21
of them have adopted one or several protocols of the Interamerican Data
uniform System on Drug Consumption (SIDuC acronym in Spanish Sis-
tema Interamericano de Datos Uniformes sobre Consumo de Drogas),
which belongs to the CICAD/OAS, 11 included the uNODC’s protocol
(united Nations Office on Drugs and Crime), and 7 incorporated the Euro-
pean System/EMCDDA.
Geo-Referencing
Although the use of Geographical Information Systems is an excellent tool
for data analysis, information is not always disaggregated at levels that
allow for geo-referencing.

2. Results
57
0 5 10 15 20
Graph 22. Number of NDOs
according to each international protocol adopted (N = 22)
Source: NDO COPOLAD II 2016.
CICAD/OAS SIDuC(20)
uNODC(10)
European SystemEMCDDA (7)
0 5 10 15 20
Graph 23. Number of NDOs that use
Geographical Information systems (Geo-Referencing) (N = 28 NDOs)
yes (11)
No (17)
Source: NDO COPOLAD II 2016.
In relation to the use of Geographical Information Systems, 11 NDOs indi-
cate that they already use this tool, and 17 have not incorporated it as yet.

Other Responsibilities of the NDO
Among other NDOs responsibilities, 27 of them are responsible for provi-
ding inputs for the elaboration of national and international reports such
as the uNODC, CICAD/OAS, OPS/OMS, and CARICOM Reports.
NDO ANAlYsIs IN lAtIN AMeRICA & tHe CARIBBeAN
58
0 5 10 15 20 25 30
Graph 24. Number of NDOs
that provide data for national reports (N = 28 NDOs)
Provide data (27)
Do not provide data (0)
N/D (1)
Source: NDO COPOLAD II 2016.
QuALITy
The processes used to ensure the quality of the product or service offered
by an institution or organization is an indicator of established standards. In
the case of NDOs, it is understood that it should be an integral part of any
action plan for a drug information network (EMCDDA & CICAD/OAS, 2010).
Monitoring and evaluation of NDOs
According to the questionnaires, 11 NDOs have mechanisms to monitor
and evaluate their activities and products. 17 NDOs state that they do not
have these mechanisms.

2. Results
59
0 5 10 15 20
Graph 25. Number of NDOs that have/have no mechanisms
to monitor and evaluate their activities and products
(N = 28 NDOs)
yes (11)
No (17)
Source: NDO COPOLAD II 2016.
Regarding the institutions responsible for monitoring and evaluation, 9
NDOs indicated that a national internal Commission is in charge of this
task. 5 NDOs said that an international institution is responsible for this
task, and 2 NDOs indicated that the task is responsibility of a national ins-
titution separate from the National Drug Council (Graph 26).
Regarding quality control, 21 NDOs indicate that they have procedures in
relation to the generation of information and publications (Graph 27).
Connected to the monitoring and evaluation of the mandate of NDOs, is
the level of dependence or technical independence of the NDOs when de-
termining studies to be conducted. 23 NDOs received directives from a
body external to the National Drug Council; in 21 cases, the decision was
made by the NDO; in 16, the investigations conducted were requests from
other sections within the same National Drug Council. Other situations
were identified by 6 NDOs (Graph 28).
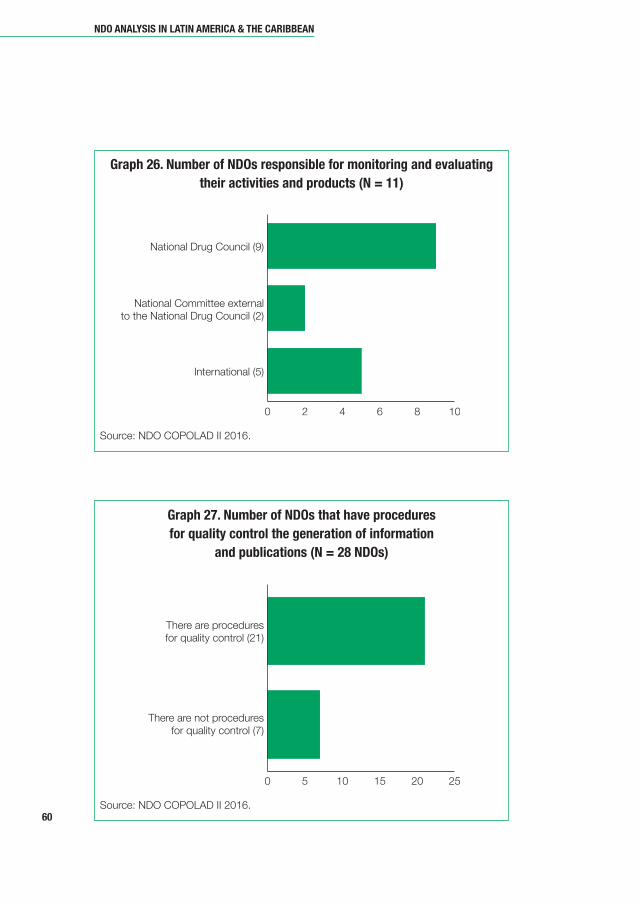
NDO ANAlYsIs IN lAtIN AMeRICA & tHe CARIBBeAN
60
0 2 4 6 8 10
Graph 26. Number of NDOs responsible for monitoring and evaluating
their activities and products (N = 11)
National Drug Council (9)
National Committee externalto the National Drug Council (2)
International (5)
Source: NDO COPOLAD II 2016.
0 5 10 15 20 25
Graph 27. Number of NDOs that have procedures
for quality control the generation of information
and publications (N = 28 NDOs)
There are proceduresfor quality control (21)
There are not proceduresfor quality control (7)
Source: NDO COPOLAD II 2016.

2. Results
61
VISIBILITy/COMMuNICATION
Communication strategies
Of the 28 NDOs that were part of the 2016 study, 17 have defined com-
munication strategies for their products. Besides having or not having a
strategy for this purpose, several disseminate drug-related information. In
fact, 23 countries report that the NDO is collaborating with the implemen-
tation of these activities.
In 22 cases, countries indicate that their reports and publications are used
by the media and by journalists. In 17 cases, it was reported that journalists
from media agencies spontaneously contact the NDO when they need in-
formation.
In addition, 20 NDOs stated that they have direct channels of communi-
cation with the public through various social media networks, blogs and/or
web pages.
0 5 10 15 20 25
Graph 28. Number of NDOs guided/not guided by an entity
that determines areas of research (multiple options) (N = 11)
NDO (21)
External and hierarchical superior (23)
Other departmentswithin the National Drug Council (16)
Others (6)
Source: NDO COPOLAD II 2016.

In 2015, 20 NDOs organized events such as seminars, symposia, and
scientific exchanges; 19 NDOs organized informal talks and courses; 18
NDOs were involved in the dissemination and awareness-building through
material such as brochures and multimedia tools; 12 NDOs were involved
in the training of health personnel; 8 NDOs were involved in staff training
for supply reduction personnel; and 4 NDOs were involved in other activi-
ties (Graph 30).
In terms of auto-perception, 15 NDOs consider that the majority of key
stakeholders in their country are aware of their existence, while 13 indicate
that this is the case with some (Graph 31).
Regarding the role of NDOs in the development of drug information in
the country, 9 NDOs noted that they are the main reference point; 18
NDOs indicated that they are one of the main reference points among
others; whereas one NDO indicated that it is not the main reference point
(Graph 32).
NDO ANAlYsIs IN lAtIN AMeRICA & tHe CARIBBeAN
62
0 5 10 15 20 25
Graph 29. Number of NDOs using various
Communication strategies (N = 28 NDOs)
The NDO develops a communicationstrategy of its services (17)
The NDO promotes its services viadissemination materials (23)
Media and journalist utilize reportsand publicactions of the NDO (22)
Media and journalists spontaneouslycontact the NDO (17)
The NDO has direct channels ofcommunication with the public (20)
Source: NDO COPOLAD II 2016.
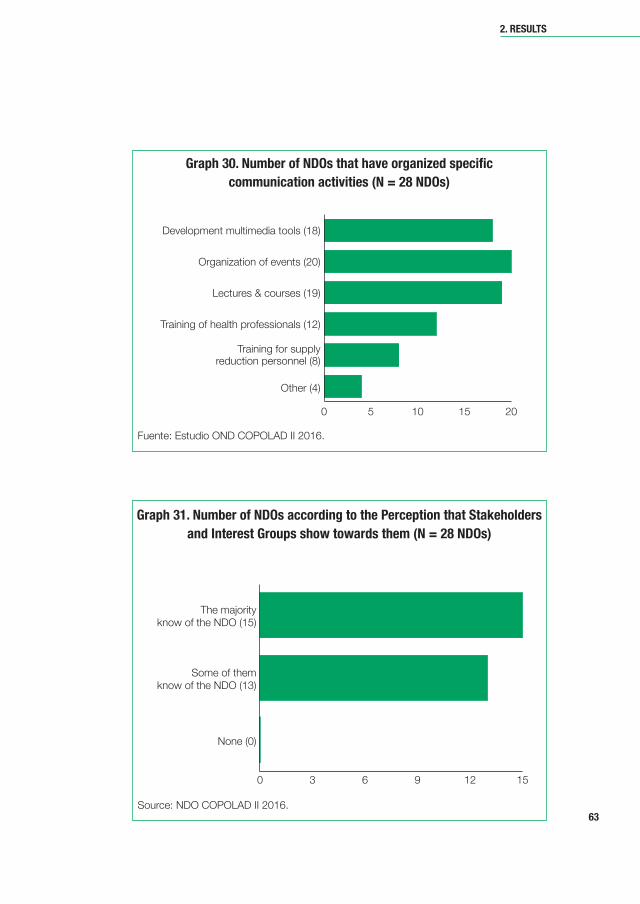
2. Results
63
0 5 10 15 20
Graph 30. Number of NDOs that have organized specific
communication activities (N = 28 NDOs)
Development multimedia tools (18)
Organization of events (20)
Lectures & courses (19)
Training of health professionals (12)
Fuente: Estudio OND COPOLAD II 2016.
Training for supplyreduction personnel (8)
Other (4)
0 3 6 9 12 15
Graph 31. Number of NDOs according to the perception that stakeholders
and Interest Groups show towards them (N = 28 NDOs)
The majorityknow of the NDO (15)
Some of themknow of the NDO (13)
None (0)
Source: NDO COPOLAD II 2016.

INFRASTRuCTuRE AND HuMAN RESOuRCES
Infrastructure
NDOs have infrastructure, but it is clearly inadequate across the board.
Several NDOs mentioned shortcomings in terms of infrastructure and ma-
terial resources. Of the 28 NDOs, 22 considered that they have a suitable
location, while 3 indicated that they do not. 3 NDOs did not answer the
question. 20 NDOs have enough space for documents and files.
Regarding informatics and computer issues, which are central to the pro-
per functioning of any NDO, only 16 indicated that they have resources
for their website. Graph 33 shows the shortcomings in Information Tech-
nology (IT).
In terms of reported shortcomings in IT and computer issues, as shown in
Graph 33, 17 NDOs highlighted deficiencies in software, 12 at the platform
NDO ANAlYsIs IN lAtIN AMeRICA & tHe CARIBBeAN
64
0 5 10 15 20
Graph 32. Number of NDOs that consider themselves as
the main reference point in relation
to drug information in the country (N = 28 NDOs)
It is the main reference (9)
It is one of the main references,among others (18)
No, it is not oneof the main references (1)
Source: NDO COPOLAD II 2016.

2. Results
65
0 5 10 15 20
Graph 33. Number of NDOs indicating shortcomings
and Challenges in It (N = 28 NDOs)
Software (17)
Platform for theinformation system (12)
Computers & otherinformatics equipment (9)
Regular accessInternet networks (9)
Source: NDO COPOLAD II 2016.
Human Resources
Regarding the position of Director or Coordinator of the NDO, 13 NDOs
indicated that it is a tenured position within the organizational structure
and 8 NDOs indicated that it is a direct or political designation.
Additionally, 5 responded with the option “Other Type”, which refers to a
combination of both characteristics (for example, direct designation but
taking into account the profession, experience and/or technical prepara-
tion for the position) (Graph 34).
In 12 NDOs, the current Coordinator has 2 years or less of in the position;
in 5 cases, s/he has between 3 and 9 years in the position, and in 2 of
them, the Director has 10 or more years in performing this task.
In the remaining 9 countries, neither the seniority of the Coordinator nor
the start date were provided (Graph 35).
level for computer systems, 9 in terms of computer equipment, and 9 in
regular and efficient access to the Internet.

NDO ANAlYsIs IN lAtIN AMeRICA & tHe CARIBBeAN
66
0 3 6 9 12 15
Graph 34. Number of NDOs based on the Designation
of the Coordinator or Director
(N = 28 NDOs)
Career in the organizationalstructure (14)
Political designationor political appoitment (8)
Other (5)
Source: NDO COPOLAD II 2016.
0 2 4 6 8 10 12
Graph 35. Number of NDOs based on the seniority
of the Coordinator or Director
(N = 28 NDOs)
10 years or more (2)
3 - 9 years (5)
2 years or less (12)
N/D (9)
Source: NDO COPOLAD II 2016.

As it may be seen in Graph 36, 20 NDOs have full-time staff assigned ex-
clusively to the entity.
2. Results
67
The number of full-time dedicated staff is quite small in most cases. One
NDO has one employee; 3 NDOs have 2 employees; 3 NDOs currently
have 5; one NDO has 4, another has 5, 3 NDOs have 6, and only 6 NDOs
have 7 or more full-time positions. Graph 37 presents the data grouped
by rank.
Of 19 NDOs that reported on the seniority of personnel, 10 have staff with
3 years or more of service; 4 NDOs have staff with 3 years or more of ser-
vice; in 3 NDOs staff have 3 years or more of service, and in 2 NDOs the
total number of officials have 3 years or more of service.
As shown in Graph 38, most NDO staff have been recently hired (3 years
or less), and in several cases the NDO itself was recently created.
0 5 10 15 20
Graph 36. Number of NDOs with full-time staff
(N = 28 NDOs)
yes (20)
No (7)
N/D (1)
Source: NDO COPOLAD II 2016.

NDO ANAlYsIs IN lAtIN AMeRICA & tHe CARIBBeAN
68
0 2 4 6 8 10
Graph 37. Number of NDOs employing full-time staff
(N = 28 NDOs)
7 or more staff (6)
4 to 6 staff (5)
1 to 3 staff (9)
None or N/D (8)
Source: NDO COPOLAD II 2016.
0 2 4 6 8 10
Graph 38. Number of NDOs according to the percentage
of staff members with 3 or more years of service
(N = 28 NDOs)
76% or more (2)
51 to 75% (3)
26 to 50% (4)
25% or less (10)
N/D (9)
Source: NDO COPOLAD II 2016

2. Results
69
The majority of the NDOs expressed concern about incorporating more
staff to develop their activities properly.
Only 4 NDOs indicated that they do not need more staff in addition to the
contracted staff they currently have, 17 NDOs indicated that they do need
more staff and 7 NDOs did not respond to the question.
0 5 10 15 20
Graph 39. Number of NDOs that require staff expansion
(N = 28 NDOs)
No (4)
yes (17)
S/D (7)
Source: NDO COPOLAD II 2016.
Another fact related to the strength of the NDO in terms of personnel, re-
fers to external recruitment and 12 NDOs indicated that they hire consul-
tants to carry out specific studies.
Of the 12 NDOs that hire consultants, 4 NDOs do this for all studies con-
ducted, while 8 NDOs engage consultants for some ad hoc studies. In ad-
dition, they were asked whether there were formal mechanisms for the
inclusion of national experts in the activities of NDOs, and 14 institutions
responded positively to this question.

Coordination with other NDOs
As for links between different Observatories, 8 NDOs responded that there
is some kind of collaboration with other NDOs (Graph 41).
The different types of collaboration include the launch of Joint Commis-
sions, regular meetings organized by the CICAD/OAS, joint studies, and
technical cooperation.
In addition, 25 NDOs coordinate activities with both drug-specific and
non drug-specific international organizations and programmes, such as
COPOLAD, CICAD/OAS, uNODC, EMCCDA, CARICOM, among others.
Additionally 2 NDOs answered negatively to question. There is no data for
1 NDO (Graph 42).
NDO ANAlYsIs IN lAtIN AMeRICA & tHe CARIBBeAN
70
0 5 10 15 20
Graph 40. Number of NDOs that hire Consultants or experts
to form technical teams
(N = 28 NDOs)
No or N/D (16)
yes (12)
Source: NDO COPOLAD II 2016.

2. Results
71
0 5 10 15 20
Graph 41. Number of NDOs that collaborate with other NDOs
(N = 28 NDOs)
Collaborate (9)
Do not collaborate (19)
Source: NDO COPOLAD II 2016.
0 5 10 15 20 25
Graph 42. Number of NDOs that coordinate activities
with international organizations or programmes
(N = 28 NDOs)
Coordinate (25)
Do not coordinate (2)
N/D (1)
Source: NDO COPOLAD II 2016.

To do this, NDOs were asked to award a score between 1 and 10 for each
subject area, with 1 being “not necessary” and 10 “very necessary”. For
the purposes of the analysis, a score of 7 points or higher accounted for
a high need for training.
The topics with the greatest training needs are multi-method research de-
sign, analysis of secondary data, and qualitative research design (20
NDOs). The following areas are listed in order of importance: 19 NDOs
awarded a score of 7 or higher to the analysis of qualitative data and meta-
analysis; 18 NDOs indicated a need for training in sampling, public health
NDO ANAlYsIs IN lAtIN AMeRICA & tHe CARIBBeAN
72
TRAINING
In terms of training, 16 NDOs indicated that they have an active training
programme, or had it in the past, for their staff members.
NDOs were also consulted on their perceived need for training in specific
areas or topics, particularly in relation to research methodologies and tech-
niques of analysis, in order to improve performance in these areas.
0 5 10 15 20
Graph 43. Number of NDOs that have programmes
for staff training (N = 28 NDOs)
Some experience or activeprogramme of training (16)
Do not have experience or activeprogramme of training or N/D (12)
Source: NDO COPOLAD II 2016.

2. Results
73
(in general), epidemiology and epidemiological research; 17 NDOs indica-
ted that training is necessary in descriptive statistical analysis and in infe-
rential statistical analysis.
0 5 10 15 20
Graph 44. Number of NDOs with 7 or more points
according to specific area for training (N = 28 NDOs)
Design of multi-method research (20)
Analysis of secondary sources (20)
Design of qualitative research (20)
Analysis of qualitative data (19)
Meta-Analysis (19)
Sampling (18)
Public Health (18)
Epidemiology* (18)
Descriptive statistical analysis (17)
Inferential statistic analysis (17)
Preparation and presentation of reports (16)
Evaluation of programmes and projects (16)
Logical framework of research (15)
Parametric statistical techniques (15)
Non parametric statistical techniques (15)
Publication of articles in journals (15)
Development of networks** (15)
Focus Groups (13)
Ethnographic studies (12)
Development of surveys (11)
Interviews (11)
* Epidemiology and epidemiologic research.
** Development of networks of information on drugs.
Source: NDO COPOLAD II 2016.

NDO ANAlYsIs IN lAtIN AMeRICA & tHe CARIBBeAN
74
Drafting and reporting, as well as evaluating programmes and projects,
were identified as having a high need for training by 16 NDOs. 15 NDOs
awarded 7 or more points to the subject of the logical framework of social
research, parametric statistical techniques, non-parametric statistical tech-
niques, writing and presentation of articles in scientific publications, and
the development of drug information networks. 13 and 12 NDOs consi-
dered training in focus groups and ethnographic studies, respectively, to
be very necessary.
Finally, the design of surveys and interviews collected the lowest points
from 11 NDOs. Though rated low, this number of NDOs indicating this as
a need for training is significant.
In conclusion, a large number of NDOs identified training, generally, as a
priority area for effective functioning.
STRENGTHS AND NEEDS
Analysis of strategic Areas:
Importance, Development and training Needs
The survey also included consultation on strategic areas according to the
tasks and objectives of all NDOs.
We considered the following strategic areas:
• Drug use in the general population (prevalence and incidence).
• Drug use among young people (prevalence and incidence).
• Drug use among special populations or in situations of vulnerability.
• High risk consumption.
• Availability of drug treatment.
• Drug-related morbidity.
• Psychiatric morbidity directly related to drug use.
• Drug-related mortality.

2. Results
75
• Social exclusion and disadvantages.
• Drug-related offenses.
• Economic costs.
• Availability and drug market information.
• Early Warning Systems.
• Studies on the impact of social projects.
• Control of chemical precursors and controlled chemical substances.
• Investigations on different forms of illicit drug trafficking and related
offenses.
In relation to these areas mentioned above, the following questions were
asked:
• Level of importance attributed by the NDO to each of the areas?
• Level of development of the NDO in each of the areas?
• Need for NDO training in each of the areas?
In order to respond to these queries, NDOs had to use a scale from 1 to
10, where score 1 was “not at all important”, “not at all developed” or “not
at all necessary”, while score 10 was “extremely important”, “extremely
developed” or “extremely necessary”.
Firstly, to analyze this information we present a table showing the number
of countries that assigned a score of 7 or more to the level of importance,
level of development and need for training in each of the strategic areas.
Secondly, we introduced a graph with the classification of strategic areas
considering two dimensions. In this case, only the dimensions of deve-
lopment and the need for training will be plotted due to their theoretical
relevance.
Thirdly, the distribution of the countries in those priority areas is analyzed,
considering the level of development that they reached in the area and the
need for training expressed by them.

first strategy for Analysis
This first strategy considers the number of countries that assigned 7 or
more points to each of the strategic areas according to the level of deve-
lopment, level of importance, or need for training.
The assumption for this analysis is that, according to the scale used, a
score of 7 or higher implies a high level of need attached to any of the
dimensions.
General scenarios identified:
• The first scenario is one in which the strategic areas are considered im-
portant by several countries, they present high levels of development
and there is little need for training.
• The second scenario is one with strategic areas considered important,
but where the level of development is low, yet the need for training is high.
• The third scenario presents areas with a moderate level of importance
for the countries, the level of development is low, yet the need for training
is higher than for the first two groups mentioned. Beyond this, it is a very
diverse group in terms of the need for training.
• The fourth scenario presents areas of high importance to a few countries,
yet the level of development is minimal and the demand for training is low.
NDO ANAlYsIs IN lAtIN AMeRICA & tHe CARIBBeAN
76
table 10. scenarios in which strategic Areas are Distributed according to
their level of Importance, Development and Need for training
level of level of Need for
imPortaNce develoPmeNt traiNiNg
Scenario 1 High High Low
Scenario 2 High Low High
Scenario 3 Medium Low High
Scenario 4 Low Moderate Low
Source: NDO COPOLAD II 2016.

Analysis of Highly strategic scenarios
(1 and 2)
As seen in Table 11, 24 countries (out of 28) consider that drug use among
young people (prevalence and incidence) is important to the NDOs’ work.
This is the area with the greatest consensus since the other areas gene-
rated responses with less interest.
Additionally, several countries identified high prevalence of drug use in
the general population (prevalence and incidence), drug offenses, the
availability of drug treatment and the Early Warning Systems (EWS) to be
critical areas.
Within these strategic areas considered to be of high importance, the levels
of development and the need for training are very diverse. Generally, it is
therefore clear that at the lower end of development, the need for training
is greater.
An extreme case of this scenario could be the Early Warning System for
which only 3 countries reported it as being highly developed, while 21
countries show a high need for training.
It is critical to refer to the second scenario where strategic areas are con-
sidered important, the level of development is low, yet the need for trai-
ning is great. For example, areas such as Economic costs or Studies on
the impact of social projects, which are considered of high importance
by 18 countries, only 2 or 3 countries indicated them as highly develo-
ped. At the same time, 22-23 countries identified these areas as priorities
for training.
The strategic areas of High risk consumption and Control of precursors
and chemical substances, on the other hand, are considered of high im-
portance by 16 and 11 countries, respectively.
While these areas would be categorized as “less important”, 12 and 15
countries considered them to be critical areas for training.
2. Results
77

NDO ANAlYsIs IN lAtIN AMeRICA & tHe CARIBBeAN
78
table 11. Number of countries with 7 or more points according to
Area and Component
strategic areas
Drug use among youth
(prevalence and incidence) 24 16 8
Drug use in general population
(prevalence and incidence) 22 13 11
Crime related to drugs 22 5 18
Availability of drug treatment 20 7 10
Early Warning Systems 20 3 21
Information on drug availability
and drug markets 19 6 17
Drug-related morbidity 19 3 15
Studies on the impact of social projects 18 3 22
Economic cost studies 18 2 23
Psychiatric morbidity directly related
to drug use 18 2 13
Research on various forms
of illicit drug trafficking and related crimes 17 4 16
Drug use among special populations
or in situations of vulnerability 17 3 16
Drug-related mortality 17 2 17
Social exclusion and social disadvantages 17 2 15
High risk consumption 16 4 12
Control of chemical precursors
and controlled chemical substances 11 8 15
Source: NDO COPOLAD II 2016.
le
ve
l o
f
imP
or
ta
Nc
e
le
ve
l o
f
de
ve
lo
Pm
eN
t
Ne
ed
fo
r
tr
aiN
iNg
second strategy for Analysis
Another alternative for the analysis of strategic areas is the one that allows
them to be classified according to two areas: by level of development and
the need for training.
For this purpose, we created a graph that details the distribution of areas
of strategic interest according to the value of the median they reach in
each of the dimensions considered. As a consequence, four groups are
obtained that reflect the possible combinations of high and low level of de-
velopment and the need for training (see Graph 45).
The graph’s cut-off points were selected according to theoretical criteria
in order to be able to clearly identify the areas with the lowest level of de-
velopment (median value of 3 or less) and the highest training need (value
of the median of 8 or more).
Quadrant A:
Low Development and High Need for Training
Quadrant A brings together those areas that have a low development
index (median value 3 or less) and a high need for training (median value
of 8 or more).
These areas of low development and high need for training are:
• Drug-related morbidity.
• Economic costs.
• Early Warning Systems.
• Studies on the impact of social projects.
• Investigations on different forms of illicit drug trafficking and related
offenses.
• Drug use among special populations or in situations of vulnerability.
• Control of precursors and controlled chemical substances.
2. Results
79

NDO ANAlYsIs IN lAtIN AMeRICA & tHe CARIBBeAN
80
Graph 45. strategic areas according to level of Development
and Need for training
Level of Development
Train
ing
Need
s
References for Graph 45 / Strategic Areas
A Drug use in the general population (prevalence and incidence)
B Drug use among young people (prevalence and incidence)
C Drug use among special populations or in situations of vulnerability
D High risk consumption
E Availability of drug treatment
F Drug-related morbidity
G Psychiatric morbidity directly related to drug use
H Drug-related mortality
I Social exclusion and disadvantages
J Drug-related offenses
K Economic costs
L Availability and drug market information
M Early Warning Systems
N Studies on the impact of social projects
O Control of precursors and controlled chemical substances
P Investigations on different forms of illicit drug trafficking and related offenses
Source: NDO COPOLAD II 2016.
quadraNt a quadraNt b
quadraNt d quadraNt c
a
b
c
d
e
f
gH
i
J
k l
mN
o
P
0 10
10
0

2. Results
81
This group highlights the areas with the greatest need for training, in this
case:
• Early Warning Systems.
• Studies on the impact of social projects.
Quadrant B:
High Development and High Need for Training
Quadrant B brings together those areas that are highly developed yet there
is a high need for training:
• Availability and drug market information.
• Drug-related offenses.
Although these areas score high values in both dimensions, none of them
reach the maximum median value of the series.
Quadrant C:
High Development and Low Need for Training
Quadrant C brings together those areas that are highly developed yet there
is a low need for training:
• Availability of drug treatment.
• Drug use in the general population (prevalence and incidence).
• Drug use among young people (prevalence and incidence).
The latter two present the highest median values of the whole series in
terms of development.
Quadrant D:
Low Development and Low Need for Training
Quadrant D brings together those areas that are less developed and have
a low need for training.

These areas are:
• Social exclusion and disadvantages.
• Psychiatric morbidity directly related to drug use.
• Drug-related mortality.
• High risk consumption.
third strategy for Analysis
Based on the information relative to the need for training, on the assig-
ned importance and on the development of strategic areas, a disaggre-
gated analysis by country to determine the situation of each one was
conducted.
The distribution of countries according to the level of development and the
need for training for three priority areas are presented below:
• Drug use in the general population (prevalence and incidence).
• Drug use among young people (prevalence and incidence).
• High risk consumption.
In this case, the cut-off points of the graph’s axes are set to the value 7.
Drug Use in the General Population
According to the graph above, it is possible to organize all the countries
in 4 groups, depending on the level of development and the need for trai-
ning that they present specifically in the area of drug use in the general
population (prevalence and incidence).
• The first group includes these countries: Antigua & Barbuda, The Ba-
hamas, Dominica, Guatemala, Haiti, Nicaragua, Paraguay and Trinidad
& Tobago, all of which have a low level of development in this area and
state a high need for training. In the chart, this group corresponds to
the quadrant A.
NDO ANAlYsIs IN lAtIN AMeRICA & tHe CARIBBeAN
82

2. Results
83
Graph 46. Drug use in the general population: distribution of countries
according to their level of development and training needs
Level of Development
Train
ing N
eed
s
Source: NDO COPOLAD II 2016.
quadraNt a quadraNt b
quadraNt d quadraNt c
DominicaThe Bahamas
NicaraguaParaguay
Antigua & BarbudaTrinidad & Tobago
Haiti
Guatemala Venezuela Brazil
Peru
Panama
Guyana
Colombia
uruguay
Argentina
Ecuador
Mexico
Chile Jamaica
Bolivia
Dominican Republic
0 10
10
0
• The second group, located in quadrant B of the chart, comprises Brazil
and Venezuela, countries that show a high level of development in this
area, but at the same time, require training in these areas.
• The third group, located in the quadrant C, comprises countries that in-
dicated a high level of development, corresponding to 7 or more points
in the scale, and which show little need for training in the aforementioned
strategic area. The countries in this group are Argentina, Colombia,
Chile, Ecuador, Guyana, Jamaica, Mexico, Panama and uruguay.
• Finally, the fourth group, located in quadrant D, is characterized by those
countries that have a low level of development, but do not require trai-
ning, which translates into a score lower than 7 in both areas. These are
Bolivia, Peru and the Dominican Republic.
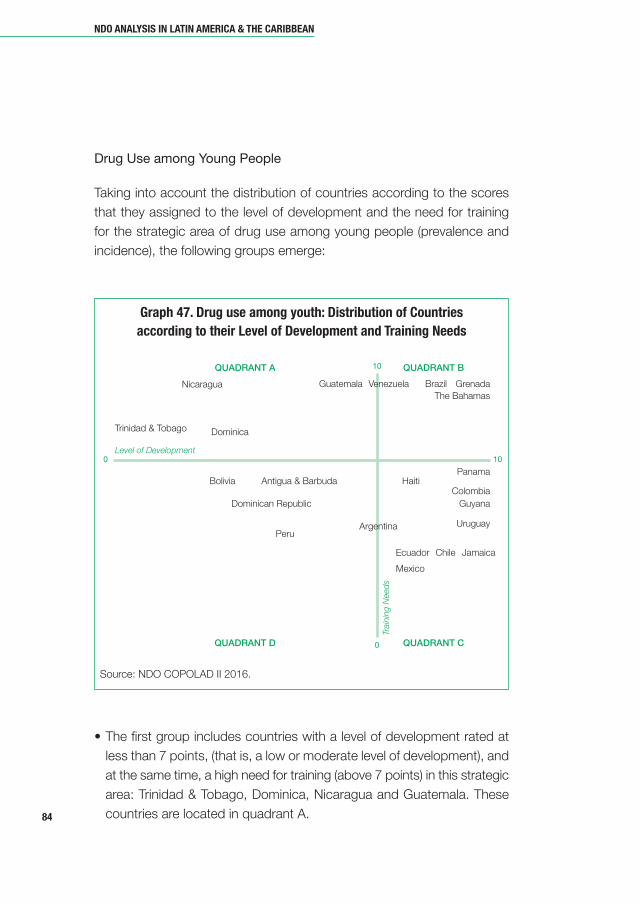
NDO ANAlYsIs IN lAtIN AMeRICA & tHe CARIBBeAN
84
Drug Use among Young People
Taking into account the distribution of countries according to the scores
that they assigned to the level of development and the need for training
for the strategic area of drug use among young people (prevalence and
incidence), the following groups emerge:
Graph 47. Drug use among youth: Distribution of Countries
according to their level of Development and training Needs
Level of Development
Train
ing N
eed
s
Source: NDO COPOLAD II 2016.
quadraNt a quadraNt b
quadraNt d quadraNt c
Guatemala Venezuela Brazil
Peru
Antigua & Barbuda
Grenada
The Bahamas
DominicaTrinidad & Tobago
Nicaragua
Panama
Guyana
Colombia
uruguay
Haiti
Argentina
Ecuador
Mexico
Chile Jamaica
Bolivia
Dominican Republic
0 10
10
0
• The first group includes countries with a level of development rated at
less than 7 points, (that is, a low or moderate level of development), and
at the same time, a high need for training (above 7 points) in this strategic
area: Trinidad & Tobago, Dominica, Nicaragua and Guatemala. These
countries are located in quadrant A.

2. Results
85
• The second group includes Venezuela, Brazil, Bahamas and Grenada
where there is a high level of development and a high need for training
in the area. They belong to quadrant B.
• The third group, located in quadrant C, includes Panama, Colombia,
Haiti, Guyana, uruguay, Jamaica, Chile, Ecuador, Mexico and Argentina.
These countries have a high level of development in this strategic area
and show a low training need.
• Finally, the fourth group, located in quadrant D, comprises Bolivia, An-
tigua & Barbuda, the Dominican Republic and Peru. These countries
have a development of less than 7 points, but they indicate a low need
for training.
High Risk Consumption
Graph 48. High Risk Drug use: Distribution of Countries
according to their level of Development and training Needs
Level of Development
Train
ing N
eed
s
Source: NDO COPOLAD II 2016.
quadraNt a quadraNt b
quadraNt d quadraNt c
Guatemala Brazil
Peru
El Salvador
Costa Rica
Antigua & Barbuda
The Bahamas
Trinidad & Tobago
Dominica
Panama
Guyana
Colombiauruguay
Haiti
ArgentinaEcuador
Mexico
Jamaica
Bolivia
Dominican Republic
0 10
10
0

• In the quadrant A, there are countries with high training needs (7 or more
points) and a low level development (less than 7 points) in the area of
High risk consumption. There are Costa Rica, El Salvador, Antigua &
Barbuda, Trinidad & Tobago, Guatemala, Guyana, Brazil, Peru, The Ba-
hamas and Colombia.
• uruguay is located in quadrant B. It is a country that reflects a high level
of development and a high need for training in the area.
• We find Panama, Argentina and Mexico in Quadrant C with high deve-
lopment and low training needs.
• Haiti, Dominica, Ecuador, Bolivia, Jamaica, Dominican Republic are lo-
cated in quadrant D since they have low levels of development and a
low need for training.
2.2. DesCRIptION AND ANAlYsIs Of Results
Of COuNtRIes wItHOut NDOs
Countries without NDOs responded to section 1 of the questionnaire
based on the type of institutional framework of the agency responsible for
activities relative to drug information and the type of activities undertaken
in the context of other institutions.
BELIzE
The country began the process of establishing a NDO in 2012: the National
Drug Abuse Control Council (NDACC) hired an Information and Investiga-
tion Officer whose terms of reference included the establishment of a NDO.
So far, the Officer has not been able to accelerate this agenda of the Ob-
servatory since it needs more capacity building and institutional streng-
thening to achieve the goal of a Belizean National Observatory.
In Belize, studies are conducted on the general population, on Prevalence
(NDACC, Outreach Services), Demand reduction activities, (NDACC, Drug
NDO ANAlYsIs IN lAtIN AMeRICA & tHe CARIBBeAN
86

2. Results
87
Prevention Education and Community Empowerment Services) and
Supply control (National Security).
CuBA
Cuba does not have a NDO because these functions are assumed by the
Secretary of the National Drug Commission. Its functions include a pro-
posal to the Board of State and Government on policies to address the
drug problem, to assist in their execution, and monitor compliance.
According to the information provided in the questionnaire, the National
Drug Commission is the official coordinator for international organizations
and evaluates the rules and regulations of the competent bodies and agen-
cies in import, export, manufacture, production, distribution and lawful use,
control, supervision, occupation, destruction and testing of drugs, their
precursors and basic chemical substances.
It also proposes appropriate measures and is responsible for the develop-
ment and results of drug-related information in order to establish a cen-
tralized information base. This is necessary for activity at the national and
international levels and to systematize this information to adopt the mea-
sures or to formulate proposals.
Finally, it is in charge of the evaluating statistical information on drugs ob-
tained in the country. It proposes and coordinates plans and programmes
for training and the specialization of experts, promotes periodic studies to
assess drug behavior in the country, and promotes and coordinates pro-
grammes to prevent drug abuse.
The National Drug Commission is in charge of national studies on Pre-
valence (surveys, investigations, registries of health care centers), De-
mand reduction, (surveys, investigations, preventive programmes),
Supply control (surveys, investigations, control records) and Socio-sani-
tary impact (re search records of health centers). They have no publica-
tions on such studies.

ST. KITTS & NEVIS
The National Council on Drug Abuse Prevention (NCDAP) collects data on
an ad hoc basis. Due to limited resources, the country is still without a fully
established National Drug Observatory.
The NCDAP collects data on High School Drug Prevalence every 4 years,
and on Supply Control (Police and Customs: production, arrests, convic-
tions, type, quantity, etc.) on a general level. They also conduct annual stu-
dies on the Social and Health Impacts (Global Alcohol and Health
Psychiatric related illnesses and hospital admittances).
NDO ANAlYsIs IN lAtIN AMeRICA & tHe CARIBBeAN
88
dN
89
Within the framework of Component I, Strengthening National Drugs Ob-
servatories (NDOs), a number of training activities for observatories are
being planned during COPOLAD II.
The current survey has the intention of providing inputs to guide the for-
mation of various working groups.
In this section, we recommend an index to CELAC countries built on the
data which incorporates indicators capable of accounting for three dimen-
sions that form the basis of a National Drugs Observatory. These dimen-
sions are contained in the handbook developed by the European
Monitoring Center for Drugs and Drug Addiction and the Inter-American
Observatory on Drugs (EMCDDA & CICAD/OAS) (2010). Building a Natio-
nal Drug Observatory: A Joint Handbook (Creación de un observatorio na-
cional de drogas: un manual conjunto).
The proposed dimensions are:
• Research conducted by NDOs.
• Publications produced by NDOs.
• Human Resources within NDOs.
Based on the data sent by the countries, indicators were defined in order
to adequately address each of these dimensions.
3. Development of nDos:proposal by the Working groups

We placed the greatest weight on the Research dimension in terms of the
core functions of National Drug Observatories: (1) the collection and mo-
nitoring of data at the national level, and (2) the analysis and interpretation
of the information gathered. Simultaneously, the consolidation of these two
functions facilitates the fulfillment of the third function, that is, the reporting
and dissemination of results which forms part of the publications aspect.
The indicators that make up the Research dimension are as follows:
• Specific budget for research.
• Scope of work of the NDO.
• Characteristics of the information gathered.
• Number of studies.
• Tracking of data records.
• Existence of EWS.
• Indicators used by substance.
• Adoption of protocols.
• Existence of cooperative production.
• Incorporation of Geographical Information Systems.
• Quality control of the data produced.
The Publications dimension includes indicators on:
• Specific budget for publications.
• Number of publications.
• Number of reports.
• EWSs reports.
Finally, in the Human Resource dimension, indicators considered were:
• Specific budget for staffing.
• Exclusively assigned staff.
• Staff hours.
• Level of seniority of persons employed.
• Seniority of the NDO Coordinator or Director.
nDo analysis in latin ameriCa & the Caribbean
90

Annex IV highlights the details of the indicators in each component, as well
as the values assumed.
The specific weight of each component is as follows:
3. Development of nDos: proposal by the Working groups
91
table 12. Weight of the Components in the Development of the index
DImeNsIoNs WeIght of the DImeNsIoN IN the INDex
Research 76,5%
Publications 11,8%
Human Resources 11,8%
Source: NDO COPOLAD II 2016.
Given this process, one can argue that the resultant ordering of NDOs
from the explicit criteria shows a categorization according to:
• Level of production of studies. This component considers both the
number of studies conducted by the NDOs and their publication on the
assumption that both components are interconnected.
• Potential to establish the epidemiological situation of the country
based on priority studies. This component assesses the capacity of
NDOs to conduct studies on the general population and on High School
students on the assumption that these investigations give a good ac-
count of the capacity of an NDO to evaluate the epidemiological situation
of the country.
• Potential to generate scientific evidence to capture the various as-
pects of the drug phenomenon. In this case, it is expected that the
NDO works with robust indicators to elicit greater heterogeneity to pro-
duce a good analysis of the drug phenomenon in each country.
• Incorporation of various sources of analysis. This component consi-
ders the ability of NDOs to incorporate and manage various data sources
and to analyze these at various stages of research, such as administra-
tive registry data.

Grouping the NDOs into 4 categories was defined by the use of the quar-
tiles as a cut-off point, resulting in groups with the same percentage
weight. These 4 groups comprise the 28 countries with a National Drug
Observatory.
nDo analysis in latin ameriCa & the Caribbean
92
graph 49. Characteristics of various nDos
• None or minimal number of studies being
produced.
• None or minimal potential to:
a) Assess the epidemiological situation of
the country based on priority studies.
b) Generate scientific evidence to describe
the diverse aspects related to drugs.
• Minimal inclusion of diverse sources of
analysis.
• Moderate number of studies being
produced.
• Medium potential to:
a) Assess the epidemiological situation of
the country based on priority studies.
b) Generate scientific evidence to describe
the diverse aspects related to drugs.
• Medium inclusion of diverse sources of
analysis.
• Limited number of studies being produced.
• Low potential to:
a) Assess the epidemiological situation of
the country based on priority studies.
b) Generate scientific evidence to describe
the diverse aspects related to drugs.
• Low inclusion of diverse sources of
analysis.
• High number of studies being produced.
• High potential to:
a) Assess the epidemiological situation of
the country based on priority studies.
b) Generate scientific evidence to describe
the diverse aspects related to drugs.
• High inclusion of diverse sources of
analysis.
A B
C D
The theoretical range of variation of the Index is 0 to 2,383 points. The
actual route is set between 361 and 1,831; this means that the country
with the highest score reaches 77% of the theoretical maximum and at
the other end, the one with the lowest number of points only gets 15%.
Annex III shows the ordering of the countries together with the exact
score obtained in the index. In this section, the formation of groups of
countries is focused on optimizing the development of activities with the
aim of strengthening and promoting the work of NDOs within the frame-
work of COPOLAD II.

• Group A shows a variation between 361 and 822 and comprises NDOs
from Antigua & Barbuda, The Bahamas, Dominica, Guatemala, Grenada,
Honduras and Mexico.
• Group B shows a variation between 940 and 1,082 points and compri-
ses National Drug Observatories from Barbados, Guyana, Haiti, Nicara-
gua, Dominican Republic, Suriname and Trinidad & Tobago.
• Group C comprises NDOs from Bolivia, Costa Rica, El Salvador, Ja-
maica, Panama, Paraguay and Peru with a variation between 1,092 and
1,262 points.
• Group D has a variation between 1,283 and 1,831 points and comprises
NDOs from Argentina, Brazil, Colombia, Chile, Ecuador, Uruguay and
Venezuela.
3. Development of nDos: proposal by the Working groups
93


dN
95
This Chapter refers to the 11 countries (Argentina, Bolivia, Brazil, Chile,
Colombia, Costa Rica, El Salvador, Panama, Paraguay, Peru and Uruguay)
that participated in both the 2011 and the 2016 studies. It compares si-
tuations before and currently, and recommends follow-up elements in the
process of NDO consolidation.
From a comparative standpoint between the two studies, the first aspect
to be highlighted relates to the level of responses generated by the 2016
questionnaire. While in 2011 the questionnaire was answered by 11 of 18
countries, in 2016 it was answered by 31 of the CELAC countries. The
higher response rate demonstrates a greater commitment to this new
phase of the programme, and allows for a more rounded perspective on
the state of NDOs. The data recorded in the study presents a rich platform
for the design of the short and medium term activities of COPOLAD ll.
4.1. progress and Consolidation of ndos
In the 2011 study, of 11 countries examined, 9 reported that they had
functioning Observatories, while 2 indicated that they were in the process
of being re-organized.
In the 2016 study, these two countries now have a NDO in full operation
which reflects institutional progress and a gradual consolidation of NDOs,
the central objective of this programme.
4. Comparative analysis:2011 & 2016 studies

4.2. Budget
In 2011, the questionnaire requested information on a specific budget for
the mandate of NDOs. As a result, we discovered that 9 countries reported
having a specific budget for at least one area. In 2011, 6 countries incre-
ased their budgetary resources. In 1 country, the budget was maintained,
while in the other 2, a reduction in budget was reported.
It must be understood that budget allocation is key when designing the
country strategy for research to be developed and to enhance the potential
of a NDO to generate evidence-based information on the country's drug
situation.
Therefore, monitoring this component is essential. Each NDO must know
where to source appropriate external financing. Monitoring and financing
are two key items when considering the consolidation of NDOs and their
sustainability over time.
In 2011, information on budgets allocated to 4 areas, i.e. Research,
Human Resources, Training and Infrastructure & Equipment, was reques-
ted. In the 2016 study, a fifth category of Publications was added.
When considering the 8 countries that responded on their budget distri-
bution in 2011, there was an increase in the allocation towards the various
ndo analysis in latin ameriCa & tHe CariBBean
96
A NDO requires its staff and its
partners to have the necessary
scientific capacity to ensure high
quality in its processes and its
products. For this reason, the
technical and scientific expertise
of a NDO must be part of an on-
going improvement and updating
process.
(EMCDDA & CICAD/OAS, 2010)
areas. More NDOs have a budget for
the three areas of Research, Human
Resources, Infrastructure and Equip-
ment. The only area in which there
was no change was for Training, with
the exception of 1 country.
This can be interpreted as a weak-
ness within the NDOs, but also an
important area for programmes such
as COPOLAD, to assist in generating
the various training needs detected
among NDOs.

4.3. type of studies
Another relevant aspect of this comparative analysis relates to the type of
studies developed by the NDO.
• According to reports from countries in the two surveys, studies on the
general population and on High School students are practically conduc-
ted in all NDOs. In 2011, 11 countries reported conducting these stu-
dies, while in 2016, 10 of 11 countries did the same.
• Studies on university students were conducted by 4 of 11 countries in
2011. This number was doubled in 2016 where 8 of 11 countries repor-
ted having conducted this type of study which is significant progress.
• As for epidemiological studies, reported by only 2 countries in 2011, pro-
gress is also shown in this area. In 2016, 4 of 11 countries reported ha-
ving conducted the same.
• Regarding studies on patients in drug treatment centres, in 2011 these
were conducted by 7 countries, while in 2016, these were conducted
by 6 countries.
4.4. indiCators
As discussed in Chapter 2, the 2011 study provided good baseline infor-
mation from the indicators used by NDOs.
In 2016, we find a body of 13 indicators that have been agreed, and 14
that have not yet been considered. In this way, one very important aspect
is the monitoring of all indicators used by NDOs in order to strengthen the
process of agreements reached and to expand them over time.
For this reason, we created the table below in order to highlight the “ad-
vances and challenges” that appeared over time. It should be noted that
the table presents the results of 15 indicators (and not the 17 used in
2011) since the remaining two could not be compared with the data ga-
thered in 2016.
4. Comparative analysis: 2011 & 2016 studies
97

ndo analysis in latin ameriCa & tHe CariBBean
98
Arg
entina
Y
YY
Y
Y
YY
Y
Y
YY
Y
Y
YY
Y
Y
YY
Y
Y
YN
Y
N
YN
N
N
N
Boliv
iaY
Y
Y
NN
N
N
NY
N
Y
NN
N
N
NY
N
N
NY
N
Y
NY
N
Y
NN
N
Bra
zil
Y
YY
Y
Y
YY
N
Y
YY
Y
Y
YN
N
Y
YY
Y
Y
YY
Y
Y
YY
Y
Y
Y
Chile
Y
YY
Y
Y
YY
Y
Y
YY
Y
N
NN
N
Y
YN
N
N
NY
N
Y
NN
N
Y
N
Colo
mb
iaY
Y
Y
YY
Y
Y
YY
Y
Y
YN
N
N
NY
Y
Y
YN
N
Y
YY
Y
Y
YY
Y
Costa
Ric
aY
Y
Y
NY
N
Y
YY
Y
Y
YY
N
Y
NY
Y
Y
YY
N
Y
YY
Y
Y
YY
Y
El S
alv
ad
or
Y
YN
Y
N
YY
Y
Y
YN
Y
N
NN
N
N
YY
Y
Y
YY
Y
Y
YN
N
Y
Y
Panam
aY
Y
Y
YN
Y
N
YY
Y
Y
YN
Y
N
YN
Y
N
NN
N
N
NN
N
N
NN
N
Para
guay
Y
YN
N
N
NY
Y
Y
YY
Y
N
NN
N
Y
YN
N
N
YY
Y
Y
YY
Y
N
N
Peru
Y
YY
Y
Y
YY
Y
Y
YY
Y
Y
NN
N
Y
YY
Y
Y
NY
Y
Y
YY
N
N
Y
Uru
guay
Y
YY
Y
Y
YY
Y
Y
YY
Y
N
YN
N
Y
YY
Y
Y
YY
Y
Y
YN
N
Y
Y
=–
1+
1=
–1
==
=+
1=
–2
–1
–1
–2
=
Sourc
e: S
tud
ies C
OP
OLA
D 2
011 a
nd
2016.
tab
le 1
3. i
nd
ica
tors
use
d b
y ea
ch
co
un
try
acco
rdin
g t
o C
op
ola
d 2
01
1 a
nd
20
16
drug use
prevaleNce
drug abuse
drug
depeNdeNce
iNcideNce
perceptioN
of risk
perceptioN
of drug access
direct
mortality
iNdirect
mortality
persoNs iN
treatmeNt
deteNtioN
accideNt
seizures
seizures of
chemical prec.
laboratories
dismaNtled
price of drugs
sold at retails
Pro
gre
ss
Recessio
n

4. Comparative analysis: 2011 & 2016 studies
99
Generally, a first reading of the report indicates that there was a decline in
relation to the number of indicators used in 2011 and those used currently.
Of the 15 indicators considered, 6 were not incorporated in NDO activity;
in 7 cases, no changes were reported; and only in two cases did “pro-
gress” occur in terms of the incorporation of the indicators into the work
of NDO. On the other hand, we found that 5 countries (out of the 11) wor-
ked with fewer indicators than those used in 2011, while in another 5
countries, the number of indicators increased. In one case, the country
continues to use the same number of indicators as those reported in the
2011 study.
Finally, it is worth highlighting the situation for those indicators agreed by
the countries. Of the 15 indicators compared, 9 fall into this category. Of
the agreed indicators, 4 are still used by NDOs, in 3 cases, their use was
abandoned, and in 2 cases, they were incorporated.
As we pointed out earlier, the monitoring of indicators is an area to be ex-
panded when designing activities aimed at strengthening NDOs. Taking
into account the work involved, discussion and consensus reached on
each of the indicators, it is hoped that those already approved will be fur-
ther developed to form the basis for future research projects.

dN
101
The present study was designed to gather relevant information on the cu-
rrent situation of National Drug Observatories (NDOs) of 33 member coun-
tries of the Community of Latin American and Caribbean States (CELAC)
in order to: a) assess the capacity of NDOs to collect and disseminate in-
formation in the countries, b) define the existing strengths and needs
through a participatory process with the countries concerned; and, c) de-
fine the final plan of action envisaged by COPOLAD II into 2019.
5.1. stRengths and limitations oF the study
Considering the general objective of the study, and considering the method
(sending a standardized questionnaire via email to each CELAC country
for data collection), it is important to highlight the high level of response
achieved (93.9%, 31 out of 33 CELAC countries). This reflects the intense
interest on the part of NDOs and allows us to have updated data from a
vast geo graphical area. In addition, the thematic scope of the question-
naire provides an extensive body of information which for the objective as-
pects of the study are comparable among the 31 participating countries.
On the other hand, the method we used in the current study makes it ne-
cessary to highlight limitations in the interpretation of some results that
should be taken with caution. The design therefore prioritized the use of
closed questions to facilitate the quantitative analysis of results, which li-
5. ConClusions
and Final ReCommendations

mits the availability of a detailed approximation on some aspects that
would require, on the one hand, to have had a previous validation on the
robustness of some questions; and, on the other hand, a more indepth
study, possibly through the development of complementary qualitative ap-
proaches that provide more contextual information to be interpreted with
greater certainty. This would be of particular interest for the analysis of the
situation relative to:
• The availability or lack thereof of a “country report” when comparing this
data with the type and number of publications made by each NDO
seems to have been interpreted as studies with national coverage (epi-
demiological studies).
• The incorporation of gender aspects in research carried out by NDOs.
The responses seem to have been interpreted as the availability of epi-
demiological data disaggregated by sex, rather than the fact that the
gender approach is incorporated in the analysis of such disaggregated
data.
• There have clearly been advances and challenges between 2011 and
2016 (of NDOs studied in both years), and these have been assessed
on the basis of observable changes in the inclusion of indicators exami-
ned in 2011 and 2016.
5.2. ConClusions
The current study achieves its purpose with regard to the realization of a
diagnosis on the capacity of NDOs in CELAC countries to collect and dis-
seminate information, to reflect their current situation, based on needs,
strengths and challenges.
Based on the overall situation in relation to the consolidation of NDOs in
33 CELAC countries, the existence of a NDO is verified in 28 of them. This
shows much promise for the region. At the same time, the data obtained
shows the degree of consolidation of the work of NDOs over time. The
majority (17 NDOs) have been operating for more than 10 years, leaving
ndo analysis in latin ameRiCa & the CaRiBBean
102

the remaining 11 NDOs with a lower trajectory, especially among 4 of them
that have been operating for less than 3 years.
The public institutional dependency of most NDOs, beyond private affilia-
tion within the Ministries of Justice, Interior, Security, Health or the Presi-
dency of the Republic, opens an excellent channel for the COPOLAD
Programme with stakeholders from the countries’ diverse institutions. This
provides certain guarantees depending on the common objectives that
the different actors can draw. This is evidenced by the existence of Natio-
nal Drug Strategies in most of the countries, and by the work of the NDOs
incorporated in those strategies. On the other hand, the importance given
to the majority of NDOs to construct scientific evidence for the definition
and orientation of the countries’ policy on drugs is significant.
Observatories, in fact, constitute the only or one of the main reference
points in the production of drug information in the country.
5. ConClusions and Final ReCommendations
103
Given the pre-eminence that NDOs face in designing policies that aim to
respond to different problems related to drugs, it is critical to work towards
consolidation of their work, which is a priority objective of the COPOLAD
Programme. In this way, a specific budget dedicated to the NDO seems
to be one element that will provide operational guarantees while enabling
institutional strengthening.
The situation emerging from the survey shows that it is not always possible
to have specific resources. Only 3 of 28 NDOs indicate that they have a
specific budget for all items. The most general situation is that they either
do not have a defined budget or that it is provided for certain specific items
and not necessarily to fully cover the work of the NDO.
With regard to human resources, the findings show that the majority of
staff is exclusively assigned to the Observatory, but in many cases, the
number of dedicated staff is small. At the same time, it is observed that
in a large number of NDOs, staff incorporations are relatively recent.

The seniority of the position of Coordinator is less than two years in half of
the Observatories.
On the other hand, more than half of those responsible for NDOs indicated
that they needed more staff. At this point, more than half of the NDOs in-
dicate having an active training programme for their staff.
Since one of the essential functions of NDOs is the collection and monito-
ring of data at the national level, another aspect shown in the study relates
to information management. While most NDOs produce information while
managing data generated by other institutions in the country, difficulties
arise in a significant number of countries in accessing information produ-
ced by others. In part, this situation reflects the lack of continuous moni-
toring of administrative data or secondary sources as well as automatic
updating of records by many NDOs.
Observatories that have problems accessing information, as well as those
that directly mentioned not being able to access data produced by other
institutions, need to overcome these obstacles in order to strengthen the
capacity of NDOs to account for the varying drug-related dynamics in each
country in a holistic way.
On the other hand, NDOs need to place greater focus on the prioritization
of studies. The number of NDOs that do not conduct studies on the ge-
neral population is still significant, without which they cannot provide a
diagnosis on the levels and patterns of consumption at the national level.
(These surveys are performed in 2 countries, but are not within the scope
of work of the Observatories).
The situation with surveys on High School students is more positive since
the number of countries that conduct them is larger.
In this same vein, it is necessary to encourage NDOs to incorporate re -
search on specific populations, including the use of qualitative methodo-
logies and epidemiological studies, currently being developed by less than
half of the Observatories. The combination of these studies with the prio-
ndo analysis in latin ameRiCa & the CaRiBBean
104

rity studies, the monitoring of data from secondary sources (mortality,
morbidity, patients in drug treatment, drug-related offenses, among
others), provide Observatories with the possibility of a comprehensive
analysis of the drug phenomenon in country, which is another of its es-
sential functions.
It is important to note that most NDOs consider the implementation of
priority studies to be of high importance, although not all of them feel
that they have the capacity to implement them. Therefore the number
of observatories that consider training on this topic is to be noted.
5. ConClusions and Final ReCommendations
105
In relation to other studies and to the monitoring and management of se-
condary sources, the highest valuations are found in Drug-related offenses,
Illicit drug trafficking and related offenses, Demand for drug treatment,
Drug markets, Morbidity and mortality related to drugs, Impact of social
projects, Economic costs, Drug use in special populations or in Situations
of vulnerability and high risk consumption. In these areas, the vast majority
of countries show a low level of implementation, and a high need for trai-
ning, which opens another opportunity for the promotion of activities
through the COPOLAD Programme.
Another element to note in relation to the strengthening of NDOs is the
publication of the results of surveys to heighten communication and the
dissemination of information to various stakeholders.
It is also necessary to work on strengthening the work of NDOs in re-
lation to the incorporation of a gender perspective in the analysis of in-
formation, as well as a commitment to the further development of
specific studies which can provide distinctions between women and
men regarding the problem of drugs.
The adoption of international protocols is relevant since it enables a com-
parative look at different situations in countries, while the production of

data is, in some way, subject to quality control processes. In this regard,
it is recommended that the necessary agreements be struck to broaden
the research practice framed in existing protocols; concrete agreements
that clearly guide the aspects of the protocols be considered, which may
be subject to specific training.
On the other hand, the implementation of Early Warning Systems shows
minimal presence in the region; this is one of the major challenges given
the importance of this tool in surveillance systems. This activity demands
a set of specific activities in order to generate the appropriate conditions
for the NDO to develop and sustain such a system. Using the available
technology to exchange information between partners is inadequate; it is
essential to strengthen the role of manager, promoter and articulator of
the synergy between the different stakeholders that must be incorporated
into this network.
At the same time, it is important to develop the ability to generate added
value to the information disseminated so that each and every one of the
stakeholders find the exchange beneficial.
In principle, the current scenario can be considered promising in this
regard since most NDOs understand that Early Warning Systems is of
high importance, while the majority considers training in the subject
very necessary.
ndo analysis in latin ameRiCa & the CaRiBBean
106
Beyond this specific diagnosis on the current situation of NDOs in terms
of their operation in different areas, their ability to fulfill the essential func-
tions expected of an observatory, their needs in terms of institutional
strengthening, as well as their power and robustness in terms of investi-
gative capacity, the present study demonstrated the relevance of monito-
ring the work of NDOs. With regard to countries examined in 2011, there
was progress in institutional consolidation, and in several countries, an im-
proved situation in terms of defining the financial resources needed to ope-
rate with stability. However, in specific aspects of the work, for example in

maintaining certain indicators, some countries took a retrograde step by
excluding 2016 indicators that were used in 2011.
These circumstances, among others, define what should be one of the
priorities for the COPOLAD Programme in monitoring the situation of
NDOs, especially after a period of development of important activities as
is being planned for the next few years. As indicated previously, one of the
greatest potentialities of the present study is the coverage achieved among
the countries of the region, not only with regard to the number of countries
reached, but also in terms of the multiplicity of areas examined, which
forms a baseline on which to evaluate future developments in NDO deve-
lopment, and forewarns of possible challenges in certain areas.
In terms of defining future COPOLAD activities, it is necessary to work in
an unbiased manner with different NDOs. The situation shows that the
level of their development is quite varied. On the one hand, there are
countries where observatories need to strengthen their capacities in se-
veral areas, as well as incorporate others in their work. On the other
hand, there are countries where the work of NDOs shows a significant
degree of consolidation which subjects them to more specific activities
as they aim to improve areas of weaknesses, as well as to incorporate
more complex techniques in the analysis of information and the produc-
tion of knowledge.
The divergent work with groups of countries, adapting to the different
needs of NDOs, seems to be the modality that guarantees an optimal
use of the COPOLAD Programme, as well as the resources invested
in them.
5. ConClusions and Final ReCommendations
107
Taking this situation into account, this document includes a proposal to
classify the countries according to the degree of development of their
NDO, considering several aspects that account for their capacity to ge-
nerate and disseminate evidence for making informed decisions for the
design and implementation of drug policies. That is, its potential to conduct

research, and to record/collect and disseminate data relevant to drug po-
licy decision-making, including:
• Providing a comprehensive diagnosis of the country's epidemiological
situation.
• Producing country-specific studies, using methods complementary to
epidemiological ones (qualitative studies, multi-method studies, mapping
of new threats, ethnographic studies, trend-spotting, etc.).
• Collecting and compiling other indicators that are important for drug po-
licy assessment and decision-making.
• Incorporating secondary sources that have a registry of key sectoral data
for informed decision-making (judicial system, penitentiary system, customs,
police records, health records, road safety records, supply indicators, etc.).
Finally, a special mention to countries that do not have NDOs is necessary.
In the three cases in which this situation is reported, there are very impor-
tant differences.
• In the case of Cuba, although it reports that a NDO does not exist, most
of the functions and activities conducted by NDO countries are develo-
ped in Cuba. The next step is to establish direct contact with the National
Drug Commission of Cuba which conducts research and studies so as
to establish a channel of communication through a focal point.
• In the case of Belize and St. Kitts & Nevis, the situation is different. In
both countries, there is an absence of structure and information that
NDOs require and provide. Both countries report an intention to establish
a NDO, but state that there are no economic or technical resources to
facilitate this. In these cases, we must move away from the institutional
to relevant agencies, but also from the technical in concrete support of
focal points that can be established, in the primary, basic but fundamen-
tal and foundational aspects to make the NDO a reality. This is the basis
for generating substantive and reliable information, allowing for the de-
finition of public policies on drugs based on evidence.
Generally, for both these countries, and for those at the initial stage of
developing a NDO, a way forward may be that of regional cooperation.
ndo analysis in latin ameRiCa & the CaRiBBean
108

In many country situations, there are difficulties with resources specific to
the subject, as well as technical deficiencies. The development of basic
and fundamental studies are also costly and complex, such as those of
the general population. There is a need to consider the option of sharing
technical and material resources as a way forward. The first step is the re-
cognition of common problems, populations with similar behaviors, repea -
ted cultural and behavioral patterns so that specific research tools could
be shared and coordinated. A second aspect is progress from “lower” cost
studies such as local diagnostics at the level of territories that have more
urgent problems to address. The methodology of local diagnostics pro-
poses an interesting methodological approach in this area, since from a
quantitative-qualitative perspective it allows a valid approximation to the
problematic of drugs of the zone, region or city where it is realized.
In summary, based on the situation observed among the NDOs of CELAC
countries, it is recommended that:
1. Consideration be given to the implementation of the activities of Com-
ponent I: Consolidation of National Drugs Observatories of COPOLAD
in different groups of countries, taking into account the unequal level
of development of NDOs in the region, as reported by the countries in
the questionnaires.
2. The visibility of NDOs be enhanced to embrace relevant stakeholders
in each country's institutional framework the production and mana-
gement of data to guide public policy on drugs, solidify a budget for
its operation, secure dedicated staff, and provide conditions that fa-
cilitate access to information produced by other institutions in the
country.
3. Efforts be made to overcome the challenges faced by NDOs in acces-
sing information and data produced by other institutions.
4. A high value be placed on the conduct of priority studies in general
populations and High School students by all NDOs. To achieve this,
training must be provided to those Observatories that have not rea-
ched this target, while including training to those NDOs that require
strengthening in this area.
5. ConClusions and Final ReCommendations
109

ndo analysis in latin ameRiCa & the CaRiBBean
110
5. Training be provided in local diagnostics for those NDOs that are in
the early stages of development and for those countries that have not
made any progress in this activity.
6. Training courses be developed on studies targeting specific popula-
tions and promote the exchange of experiences and methodological
approaches among NDOs that conduct these.
7. The capacity of NDOs be strengthened to manage secondary data,
administrative data on mortality, morbidity, number of people who are
addicted to drugs, number of patients being treated, resources inves-
ted in each of the different areas of drug policy (research, demand re-
duction, supply reduction, etc.), quantity of drugs produced, drug
offenses, seizures, existing and eradicated illicit crops, incarcerated
adults, etc. The promotion of the systematization of this information,
the production of periodic national reports, as well as their incorpora-
tion into global analyses on the drug phenomenon are critical steps to
be undertaken.
8. There be a continuation of the already established work in the previous
edition (2011) of the COPOLAD Programme regarding a consensus
on the indicators to be monitored by NDOs, as well as consensus on
their conceptual definition, clearly establishing the criteria that each in-
dicator aims to measure.
9. That a gender perspective be incorporated, beyond the disaggregation
of data by sex, in the analysis of information, as well as the conduct
of specific studies on gender.
10. There be an integration of international protocols into the framework
of NDOs. That opportunities for country exchanges be forged based
on the experiences of those who maintain these standards.
11. The Early Warning System be widely promoted by NDOs and that op-
portunities be forged to develop training in this strategic area by see-
king the support of those observatories that maintain the EWS
successfully.
12. An evaluation and a situational analysis be conducted among NDOs
in CELAC countries at the end of COPOLAD II.

dN
111
COPOLAD (2012). Características, necesidades y carencias de informa-
ción existente de los países de América Latina. Madrid: COPOLAD.
Available at:
https://copolad.eu/c/document_library/get_file?uuid=4b0ca2e3-da39-
4414-939a-257ecf45e37c&groupId=10157
COPOLAD (2014). Perspectiva de género y programas sobre drogas: El
abordaje de las desigualdades. Madrid: COPOLAD.
Available at:
https://www.copolad.eu/c/document_library/get_file?uuid=c4c8a51d-
7bec-4d84-bd3b-5fbfc36c35b5&groupId=10157
EMCDDA and CICAD/OAS (European Monitoring Centre for Drugs and
Drug Addiction & Inter-American Drug Abuse Control Commission / Or-
ganization of American States) (2010). Creación de un observatorio na-
cional de drogas: un manual conjunto. Luxemburgo: Oficina de
Publicaciones Oficiales de las Comunidades Europeas.
Available at:
http://www.emcdda.europa.eu/attachements.cfm/att_118914_ES_EMCD
DA-NDO-handbook-es.pdf
RefeRences
Oszlak, O. and Orellana, E. (1993). El análisis de la capacidad institucional:
aplicación de la metodología SADCI.
Available on-line: www.oscaroszlak.org.ar
Suarez, H. and Rossal, M. (2015). Viajes sintéticos. Estudio sobre uso de dro-
gas de síntesis en el Uruguay contemporáneo. OUD/JND - FCHE/UDELAR
Available at: http://www.infodrogas.gub.uy/images/stories/pdf/JND-Via-
jes%20Sint%C3%A9ticos-todo-WEB.pdf
nDO AnALYsIs In LATIn AMeRIcA & THe cARIBBeAn
112

dN
113
why this study on ndos?
A first study of reference, conducted in 2011 in COPOLAD I, showed
weak nesses and potentialities in most Latin American countries, in relation
to their capacity to generate, collect and disseminate relevant and high
quality information useful for evidence-based policy-making.
This second study has the following objectives:
• To assess the current situation, the strengths and needs existing in each
of the 33 countries belonging to the Community of Latin American and
Caribbean States (CELAC).
• To adjust the activities to be developed in COPOLAD II, to the necessi-
ties of the different groups of CELAC countries, aiming at establishing
or strengthening the role of National Drugs Observatories (NDO) in the
region.
why it is iMPortant your PartiCiPation
in this study?
Your answers to this questionnaire will allow you to inform about the cha-
racteristics, strengths, needs and shortcomings of the available drug in-
annex i:
questionnaire

formation resources in your country, and to benefit from the activities to
be developed in COPOLAD II.
aBout questionnaire
Before you start, please read this information.
TImE TO COmPLETE
• The questionnaire has 11 sections. This number might be inferior de-
pending on the situation of the Observatory in your country.
• Answering this questionnaire will take approximately between 7 and 60
minutes, accordingly to the above mentioned point.
• We are aware that your time is precious and that’s why we call for you
to read on the following recommendations.
fILLINg ThE fOrm
• The questionnaire was designed so you could answer from your
computer.
• You can save the document any time you like and return to it later.
• given the heterogeneity of situations, some options and formats might
not correspond to your particular case. Thus, you are kindly requested
to add notes with further information, comments and clarifications, at
the end of the questionnaire. Please specify, for each note, the number
of the related question.
THANK YOU VERY MUCH
FOR YOUR PARTICIPATION!
ndo anaLysis in Latin aMeriCa & the CariBBean
114

GeneraL inForMation
Country . . . . . . . . . . . . . . . . . . . . . . . . . . . . . . . . . . . . . . . . . . . . . . . . .
Date . . . . . . . . . . . . . . . . . . . . . . . . . . . . . . . . . . . . . . . . . . . . . . . . . . . .
Institution . . . . . . . . . . . . . . . . . . . . . . . . . . . . . . . . . . . . . . . . . . . . . . . .
Name of the respondent . . . . . . . . . . . . . . . . . . . . . . . . . . . . . . . . . . . . .
Current position of the respondent . . . . . . . . . . . . . . . . . . . . . . . . . . . . .
ContaCt
e-mail . . . . . . . . . . . . . . . . . . . . . . . . . . . . . . . . . . . . . . . . . . . . . . . . . . .
Phone . . . . . . . . . . . . . . . . . . . . . . . . . . . . . . . . . . . . . . . . . . . . . . . . . . .
mail address . . . . . . . . . . . . . . . . . . . . . . . . . . . . . . . . . . . . . . . . . . . . . .
City . . . . . . . . . . . . . . . . . . . . . . . . . . . . . . . . . . . . . . . . . . . . . . . . . . . . .
institutionaL
1. How is the current situation of the National Drugs Observatory?
1. Currently operating (Please indicate the month
and year of its creation) . . . . . . . . . . . . . . . . . . . . . . .
2. A proposal for a National Drugs Observatory has been drafted
(Go to question 6) . . . . . . . . . . . . . . . . . . . . . . . . . . . . . . . . . .
3. The National Drugs Observatory is currently being set up
(Go to question 6 . . . . . . . . . . . . . . . . . . . . . . . . . . . . . . . . . .
4. There is no National Drugs Observatory in the country
(Go to question 8) . . . . . . . . . . . . . . . . . . . . . . . . . . . . . . . . . .
annex i: questionnaire
115

2. What kind of organism is the Observatory?
1. Public . . . . . . . . . . . . . . . . . . . . . . . . . . . . . . . . . . . . . . . . . . .
2. Public-Private . . . . . . . . . . . . . . . . . . . . . . . . . . . . . . . . . . . . .
3. Non-governmental Organization . . . . . . . . . . . . . . . . . . . . . . .
4. Other (Specify) . . . . . . . . . . . . . . . . . . . . . . . . . . . . . . . . . . . . .
3. Under which organism(s) is the Observatory hierarchically placed?
1. . . . . . . . . . . . . . . . . . . . . . . . . . . . . . . . . . . . . . . . . . . . . . . . . . . .
2. . . . . . . . . . . . . . . . . . . . . . . . . . . . . . . . . . . . . . . . . . . . . . . . . . . .
3. . . . . . . . . . . . . . . . . . . . . . . . . . . . . . . . . . . . . . . . . . . . . . . . . . . .
4. . . . . . . . . . . . . . . . . . . . . . . . . . . . . . . . . . . . . . . . . . . . . . . . . . . .
4. Is the Observatory included within a strategic or action plan on drugs
in the country?
1. Yes . . . . . . . . . . . . . . . . . . . . . . . . . . . . . . . . . . . . . . . . . . . . .
2. It is not included, but there is a strategic or action plan
on drugs of the country . . . . . . . . . . . . . . . . . . . . . . . . . . . . . .
3. It is not included, because there is no strategic or action plan
on drugs in the country . . . . . . . . . . . . . . . . . . . . . . . . . . . . . .
5. How is Observatory involved in the national policies on drugs? (Mul-
tiple options)
1. Its information is used to set strategies and policies . . . . . . . .
2. In monitoring and evaluation . . . . . . . . . . . . . . . . . . . . . . . . . .
3. In relation to ad hoc, specific demands . . . . . . . . . . . . . . . . . .
4. Other (Specify) . . . . . . . . . . . . . . . . . . . . . . . . . . . . . . . . . . . . .
Move to next section: Budget. Sources of Funding (question 10).
ndo anaLysis in Latin aMeriCa & the CariBBean
116

6. Please identify which steps have been done to design or to set up
the Observatory (Multiple options).
1. A normative has been approved in order to regulate
its functioning . . . . . . . . . . . . . . . . . . . . . . . . . . . . . . . . . . . . .
2. A specific budget has been allocated . . . . . . . . . . . . . . . . . . .
3. Some activities have already been organized in order to
launch the Observatory . . . . . . . . . . . . . . . . . . . . . . . . . . . . .
4. Specific human resources have been appointed . . . . . . . . . . .
5. Other steps (Please specify) . . . . . . . . . . . . . . . . . . . . . . . . . .
7. Please introduce any other comments in relation to the design or
setting up of the National Drugs Observatory.
. . . . . . . . . . . . . . . . . . . . . . . . . . . . . . . . . . . . . . . . . . . . . . . . . . . . .
. . . . . . . . . . . . . . . . . . . . . . . . . . . . . . . . . . . . . . . . . . . . . . . . . . . . .
. . . . . . . . . . . . . . . . . . . . . . . . . . . . . . . . . . . . . . . . . . . . . . . . . . . . .
. . . . . . . . . . . . . . . . . . . . . . . . . . . . . . . . . . . . . . . . . . . . . . . . . . . . .
. . . . . . . . . . . . . . . . . . . . . . . . . . . . . . . . . . . . . . . . . . . . . . . . . . . . .
. . . . . . . . . . . . . . . . . . . . . . . . . . . . . . . . . . . . . . . . . . . . . . . . . . . . .
Go to question 9.
8. Please comment on the reasons why the country does not have a
National Drugs Observatory.
. . . . . . . . . . . . . . . . . . . . . . . . . . . . . . . . . . . . . . . . . . . . . . . . . . . . .
. . . . . . . . . . . . . . . . . . . . . . . . . . . . . . . . . . . . . . . . . . . . . . . . . . . . .
. . . . . . . . . . . . . . . . . . . . . . . . . . . . . . . . . . . . . . . . . . . . . . . . . . . . .
. . . . . . . . . . . . . . . . . . . . . . . . . . . . . . . . . . . . . . . . . . . . . . . . . . . . .
. . . . . . . . . . . . . . . . . . . . . . . . . . . . . . . . . . . . . . . . . . . . . . . . . . . . .
. . . . . . . . . . . . . . . . . . . . . . . . . . . . . . . . . . . . . . . . . . . . . . . . . . . . .
annex i: questionnaire
117

9. In the absence of a National Drugs Observatory, what organisms ma-
nage information related to drugs, and what kind of information is?
ndo anaLysis in Latin aMeriCa & the CariBBean
118
The questionnaire ends here for those countries that do not have an
Observatory or where the Observatory is still at a preliminary stage of
design and/or setting-up.
Please add any other comment or supplementary information at the end
of this questionnaire.
THANK YOU VERY MUCH
FOR YOUR PARTICIPATION!
* If applicable; otherwise, year of publication of each study.
Prevalence
Demand
reduction
Supply
control
Social and
health impact
Other areas
(Please specify)
ORGANIsM/s
OR INsTITUTIONsAREA
TYPE OF
INFORMATION
POPUlATION
CONsIdEREd
GEOGRAPHICAl
COVERAGEPERIOdICITY*

BudGet. sourCes oF FundinG
10. Does the Observatory currently have a specific budget for the fo-
llowing lines? (Please specify the period of the budget: e.g. for 5).
PERIOd OF THE
Budget line: YEs NO AllOCATEd bUdGEd
1. research . . . . . . . . . . . . . . . . . .
2. Publications . . . . . . . . . . . . . . . .
3. Training . . . . . . . . . . . . . . . . . . . .
4. human resources . . . . . . . . . . .
5. Infrastructure and Equipment . . .
11. Please provide the annual budget of the Observatory excluding
human resources/salaries (in US dollars).
2015 . . . . . . . . . . . . . . . . . . . . . . . . . . . . . . .
2016 . . . . . . . . . . . . . . . . . . . . . . . . . . . . . . .
12. Please indicate the current sources of funding of the Observatory
budget, their nature (national or international) and the periodicity.
annex i: questionnaire
119
sOURCE OF FUNdING
(ORGANIzATION / INsTITUTION)
NATIONAl
O INTERNATIONAlPERIOdICITY

13. Besides the Observatory specific budget detailed above, are there
any other mechanisms of funding, ad hoc mechanisms or for particular
activities?
1. Yes . . . . . . . . . . . . . . . . . . . . . . . . . . . . . . . . . . . . . . . . . . . . .
2. No (Go to question 15) . . . . . . . . . . . . . . . . . . . . . . . . . . . . . .
14. For those other mechanisms, please specify their main sources of
funding, their nature (national or international) and the periodicity in the
provision of resources.
ndo anaLysis in Latin aMeriCa & the CariBBean
120
interinstitutionaL. networks
15. The information the Observatory manages:
1. has been produced by the Observatory . . . . . . . . . . . . . . . . .
2. has been produced by other institutions . . . . . . . . . . . . . . . .
3. Both . . . . . . . . . . . . . . . . . . . . . . . . . . . . . . . . . . . . . . . . . . . .
sOURCE OF FUNdING
(ORGANIzATION
/ INsTITUTION)
NATIONAl OR
INTERNATIONAlPERIOdICITY
TYPE OF FUNdEd wORK
(INFORMATION sYsTEM,
PARTICUlAR sTUdY, ETC.)

16. What other organisms manage information related to drugs, and
what kind of information is?
annex i: questionnaire
121
* If applicable; otherwise, year of publication of each study.
OR
GA
NIs
Ms
OR
IN
sT
ITU
TIO
Ns
AR
EA
TY
PE
OF
INF
OR
MA
TIO
N
PO
PU
lA
TIO
N
CO
Ns
IdE
RE
d
GE
OG
RA
PH
ICA
l
CO
VE
RA
GE
PE
RIO
dIC
ITY
*
dO
Es
TH
E O
bs
ER
VA
TO
RY
wO
RK
wIT
H T
HIs
INF
OR
MA
TIO
N?
Prevelance
Demand
reduction
Supply
control
Social and
health impact
Other areas
(Specify)
17. Does the Observatory have difficulties in accessing to the informa-
tion generated by other organisms or institutions?
1. Yes (Go to question 19) . . . . . . . . . . . . . . . . . . . . . . . . . . . . . .
2. No . . . . . . . . . . . . . . . . . . . . . . . . . . . . . . . . . . . . . . . . . . . . . .

18. Please describe the most relevant reasons why there is no difficulty
in accessing to the information generated by other organisms.
. . . . . . . . . . . . . . . . . . . . . . . . . . . . . . . . . . . . . . . . . . . . . . . . . . . . .
. . . . . . . . . . . . . . . . . . . . . . . . . . . . . . . . . . . . . . . . . . . . . . . . . . . . .
. . . . . . . . . . . . . . . . . . . . . . . . . . . . . . . . . . . . . . . . . . . . . . . . . . . . .
. . . . . . . . . . . . . . . . . . . . . . . . . . . . . . . . . . . . . . . . . . . . . . . . . . . . .
Go to question 21.
19. What kind of difficulties the Observatory has with the other orga-
nisms or institutions that generate information?
1. They have information, but they do not provide it . . . . . . . . . .
2. They provide bad quality data (Go to question 21) . . . . . . . . . .
3. Other (Specify) . . . . . . . . . . . . . . . . . . . . . . . . . . . . . . . . . . . .
(Go to question 21)
20. How do you explain why the other institutions do not provide infor-
mation? (Mark in order of importance from 1 to 4, being 1 the most im-
portant).
1. Operational problems (including the absence of coordination
or institutional agreements) . . . . . . . . . . . . . . . . . . . . . . . . . . .
2. financial problems . . . . . . . . . . . . . . . . . . . . . . . . . . . . . . . . . .
3. The Observatory is still not recognized
as a legitimate institution . . . . . . . . . . . . . . . . . . . . . . . . . . . . .
4. Other reason (Specify) . . . . . . . . . . . . . . . . . . . . . . . . . . . . . . .
21. Do you think that the existing information constitutes a national drug
information system?
1. Yes . . . . . . . . . . . . . . . . . . . . . . . . . . . . . . . . . . . . . . . . . . . . .
2. Yes, partially . . . . . . . . . . . . . . . . . . . . . . . . . . . . . . . . . . . . .
3. No (Go to question 26) . . . . . . . . . . . . . . . . . . . . . . . . . . . . . .
ndo anaLysis in Latin aMeriCa & the CariBBean
122

22. Is there a normative framework to establish and/or regulate a na-
tional drug information system?
1. Yes (Specify) . . . . . . . . . . . . . . . . . . . . . . . . . . . . . . . . . . . . . .
2. No . . . . . . . . . . . . . . . . . . . . . . . . . . . . . . . . . . . . . . . . . . . . . .
23. In the context of the national drug information system, does the Ob-
servatory perform the following tasks? (Multiple options).
1. management of the network . . . . . . . . . . . . . . . . . . . . . . . . . .
2. Systematization of information . . . . . . . . . . . . . . . . . . . . . . . .
3. Validation of data . . . . . . . . . . . . . . . . . . . . . . . . . . . . . . . . . . .
4. Production of annual reports with the indicators
included in the system . . . . . . . . . . . . . . . . . . . . . . . . . . . . . . .
5. Promotion of dialogues and exchanges among
the actors of the system . . . . . . . . . . . . . . . . . . . . . . . . . . . . .
6. Other tasks (Specify) . . . . . . . . . . . . . . . . . . . . . . . . . . . . . . . .
24. Please identify which aspects contribute to an adequate functioning
of the national drug information system (e.g., availability of resources,
inter-institutional work in network, etc.).
. . . . . . . . . . . . . . . . . . . . . . . . . . . . . . . . . . . . . . . . . . . . . . . . . . . . .
. . . . . . . . . . . . . . . . . . . . . . . . . . . . . . . . . . . . . . . . . . . . . . . . . . . . .
. . . . . . . . . . . . . . . . . . . . . . . . . . . . . . . . . . . . . . . . . . . . . . . . . . . . .
. . . . . . . . . . . . . . . . . . . . . . . . . . . . . . . . . . . . . . . . . . . . . . . . . . . . .
. . . . . . . . . . . . . . . . . . . . . . . . . . . . . . . . . . . . . . . . . . . . . . . . . . . . .
. . . . . . . . . . . . . . . . . . . . . . . . . . . . . . . . . . . . . . . . . . . . . . . . . . . . .
. . . . . . . . . . . . . . . . . . . . . . . . . . . . . . . . . . . . . . . . . . . . . . . . . . . . .
. . . . . . . . . . . . . . . . . . . . . . . . . . . . . . . . . . . . . . . . . . . . . . . . . . . . .
. . . . . . . . . . . . . . . . . . . . . . . . . . . . . . . . . . . . . . . . . . . . . . . . . . . . .
annex i: questionnaire
123

25. Please identify which aspects constitute obstacles or problems for
the functioning of the national drug information system (e.g., lack of
coordination between institutions, lack of consensus about protocols
or indicators, system fragmentation, overlapping of incumbencies, ab-
sences of well-defined rules, etc.).
. . . . . . . . . . . . . . . . . . . . . . . . . . . . . . . . . . . . . . . . . . . . . . . . . . . . .
. . . . . . . . . . . . . . . . . . . . . . . . . . . . . . . . . . . . . . . . . . . . . . . . . . . . .
. . . . . . . . . . . . . . . . . . . . . . . . . . . . . . . . . . . . . . . . . . . . . . . . . . . . .
. . . . . . . . . . . . . . . . . . . . . . . . . . . . . . . . . . . . . . . . . . . . . . . . . . . . .
. . . . . . . . . . . . . . . . . . . . . . . . . . . . . . . . . . . . . . . . . . . . . . . . . . . . .
. . . . . . . . . . . . . . . . . . . . . . . . . . . . . . . . . . . . . . . . . . . . . . . . . . . . .
. . . . . . . . . . . . . . . . . . . . . . . . . . . . . . . . . . . . . . . . . . . . . . . . . . . . .
26. Are there any actions planned in order to create or to complete the
national drug information system?
1. Yes . . . . . . . . . . . . . . . . . . . . . . . . . . . . . . . . . . . . . . . . . . . . .
2. No (Go to question 28) . . . . . . . . . . . . . . . . . . . . . . . . . . . . . .
27. Which are the planned actions to create, strengthen or improve the
information system?
. . . . . . . . . . . . . . . . . . . . . . . . . . . . . . . . . . . . . . . . . . . . . . . . . . . . .
. . . . . . . . . . . . . . . . . . . . . . . . . . . . . . . . . . . . . . . . . . . . . . . . . . . . .
. . . . . . . . . . . . . . . . . . . . . . . . . . . . . . . . . . . . . . . . . . . . . . . . . . . . .
. . . . . . . . . . . . . . . . . . . . . . . . . . . . . . . . . . . . . . . . . . . . . . . . . . . . .
. . . . . . . . . . . . . . . . . . . . . . . . . . . . . . . . . . . . . . . . . . . . . . . . . . . . .
. . . . . . . . . . . . . . . . . . . . . . . . . . . . . . . . . . . . . . . . . . . . . . . . . . . . .
. . . . . . . . . . . . . . . . . . . . . . . . . . . . . . . . . . . . . . . . . . . . . . . . . . . . .
. . . . . . . . . . . . . . . . . . . . . . . . . . . . . . . . . . . . . . . . . . . . . . . . . . . . .
ndo anaLysis in Latin aMeriCa & the CariBBean
124

areas oF work
28. What are the areas of work of the Observatory?
28.1. Supply control.
1. Yes . . . . . . . . . . . . . . . . . . . . . . . . . . . . . . . . . . . . . . . . . . . . .
2. No . . . . . . . . . . . . . . . . . . . . . . . . . . . . . . . . . . . . . . . . . . . . .
28.2. Demand reduction.
1. Yes . . . . . . . . . . . . . . . . . . . . . . . . . . . . . . . . . . . . . . . . . . . . .
2. No . . . . . . . . . . . . . . . . . . . . . . . . . . . . . . . . . . . . . . . . . . . . .
28.3. Evaluation of plans, programmes and projects.
1. Yes . . . . . . . . . . . . . . . . . . . . . . . . . . . . . . . . . . . . . . . . . . . . .
2. No . . . . . . . . . . . . . . . . . . . . . . . . . . . . . . . . . . . . . . . . . . . . .
29. Please indicate in the following table the studies conducted by the
Observatory, their periodicity and coverage.
YEs/NO PERIOdICITY COVERAGE
1. Patients on treatment centres . . . . . . . .
2. high School students . . . . . . . . . . . . . .
3. University students . . . . . . . . . . . . . . . .
4. general population . . . . . . . . . . . . . . . .
5. Cost programmes . . . . . . . . . . . . . . . . .
6. 6. Epidemiological windows.
Specify (e.g. emergency rooms,
primary care) . . . . . . . . . . . . . . . . . . . . .
7. Inmates (adult prisoners) . . . . . . . . . . . .
8. Inmates (juvenile offenders) . . . . . . . . . .
annex i: questionnaire
125

9. Specific studies on gender . . . . . . . . . .
10. Other specific populations.
Which? . . . . . . . . . . . . . . . . . . . . . . . . .
11. Studies on the purity and
chemical compounds of drugs . . . . . . .
12. Determination of cultivated areas . . . . .
13. research on different modalities of illicit
trafficking of drugs and related crimes . .
14. Studies on sustainable development . . .
15. Qualitative studies
(Specify) . . . . . . . . . . . . . . . . . . . . . . . .
16. Other studies
(Specify) . . . . . . . . . . . . . . . . . . . . . . . .
30. Please list all studies conducted by the Observatory between 2011
and 2016.
ndo anaLysis in Latin aMeriCa & the CariBBean
126
TITlE OF THE sTUdY . . . . . . . . . . . . . . . . . . . . . . . . . . . . . . . . . . . . . . . . . . . . . . . . . . . . . . . . . . . . . . . . . . . . . . .
YEAR . . . . . . . . . . MAIN METHOdOlOGY UsEd . . . . . . . . . . . . . . . . . . . . . . . . . . . . . . . . . . . . . . . . . . . . . . . .
COVERAGE . . . . . . . . . . . . . . . . . . . . . . . . . . . . . Is THERE A REPORT OR A PUblICATION?
lINK OR REFERENCE . . . . . . . . . . . . . . . . . . . . . . . . . . . . . . . . . . . . . . . . . . . . . . . . . . . . . . . . . . . . . . . . . . . . . . .
Y N
Y N
Y N

31. In relation to the records of permanent update and/or to the conti-
nuous follow-up of administrative records, kept by the Observatory,
please indicate period and geographical coverage, and origin of the
records.
annex i: questionnaire
127
COVERAGE
PERIOd
GEOGRAPHICAl
COVERAGE
sPECIFY IF THE RECORds
ARE FROM THE NdO, FROM
THIRd PARTIEs, OR bOTH
Treatment demand
Patients in treatment
mortality
morbidity
Traffic accidents
Drug and chemical precursor seizures
Seizures of trafficking goods
Inmates/prisoners
Violence associated
with drug consumption
Others (Specify)
If the Observatory keeps at least one type of permanent record or if the
Observatory carries a continuous follow-up of data from at least one ad-
ministrative record: go to question 32.
If the Observatory does not keep any permanent record and does not
follow-up administrative records: go to question 34.
32. Does the Observatory publish a periodical report with data from ad-
ministrative records?
a. Yes . . . . . . . . . . . . . . . . . . . . . . . . . . . . . . . . . . . . . . . . . . . . .
b. No (Go to question 34) . . . . . . . . . . . . . . . . . . . . . . . . . . . . . .

33. What reports or publications have been issued between 2011 and
2016 with data from administrative records?
ndo anaLysis in Latin aMeriCa & the CariBBean
128
PUblICATION TITlE YEAR lINK OR REFERENCE
34. Does the country have an Early-Warning System (EWS)?
1. Yes . . . . . . . . . . . . . . . . . . . . . . . . . . . . . . . . . . . . . . . . . . . . .
2. No (Go to question 42) . . . . . . . . . . . . . . . . . . . . . . . . . . . . . .
35. Is the EWS coordinated by the National Drugs Observatory?
Yes . . . . . . . . . . . . . . . . . . . . . . . . . . . . . . . . . . . . . . . . . . . . .
No. Specify who coordinates . . . . . . . . . . . . . . . . . . . . . . . . . .
(Go to question 42)
36. How long has the EWS been in place?
months . . . . . . . . . . . . . . . . . . . . . . . . . . . . . . . . . . .
37. Is the EWS integrated by actors or institutions from the following
areas? (Multiple options)
1. forensic teams/institutions . . . . . . . . . . . . . . . . . . . . . . . . . . .
2. healthcare (e.g., centres specialised in care and treatment
of problematic use of drugs) . . . . . . . . . . . . . . . . . . . . . . . . . .

3. Supply control (e.g. law enforcement agencies,
police, anti-trafficking corps, etc.) . . . . . . . . . . . . . . . . . . . . . .
4. Scientific research: Biology and/or Chemistry (e.g., institutions
in charge of chemical analysis of substances) . . . . . . . . . . . . .
5. Social research . . . . . . . . . . . . . . . . . . . . . . . . . . . . . . . . . . . .
6. foreign institutions and teams . . . . . . . . . . . . . . . . . . . . . . . . .
7. International organizations and programmes
(UNODC, CICAD/OAS, etc.) . . . . . . . . . . . . . . . . . . . . . . . . . .
8. Others (Specify) . . . . . . . . . . . . . . . . . . . . . . . . . . . . . . . . . . . .
38. Please, describe the main characteristics and modalities of the
EWS.
. . . . . . . . . . . . . . . . . . . . . . . . . . . . . . . . . . . . . . . . . . . . . . . . . . . . .
. . . . . . . . . . . . . . . . . . . . . . . . . . . . . . . . . . . . . . . . . . . . . . . . . . . . .
. . . . . . . . . . . . . . . . . . . . . . . . . . . . . . . . . . . . . . . . . . . . . . . . . . . . .
. . . . . . . . . . . . . . . . . . . . . . . . . . . . . . . . . . . . . . . . . . . . . . . . . . . . .
. . . . . . . . . . . . . . . . . . . . . . . . . . . . . . . . . . . . . . . . . . . . . . . . . . . . .
. . . . . . . . . . . . . . . . . . . . . . . . . . . . . . . . . . . . . . . . . . . . . . . . . . . . .
. . . . . . . . . . . . . . . . . . . . . . . . . . . . . . . . . . . . . . . . . . . . . . . . . . . . .
. . . . . . . . . . . . . . . . . . . . . . . . . . . . . . . . . . . . . . . . . . . . . . . . . . . . .
39. For the last year with available information:
Specify year . . . . . . . . . . . . . . . . . . . . . . . . . . . . . . . . . . . . . . . . . . . .
1. Number of reported warnings . . . . . . . . . . . . . . . . . . . . . . . . .
2. Number of public warnings issued . . . . . . . . . . . . . . . . . . . . . .
3. Number of members/partners of the EWS . . . . . . . . . . . . . . . .
4. Number of substances identified . . . . . . . . . . . . . . . . . . . . . .
5. Number of adulterants identified . . . . . . . . . . . . . . . . . . . . . . .
annex i: questionnaire
129

40. Please, name the products (reports, bulletins, etc.) of the EWS in
the last two years (since 2014), their main objective and target audience.
ndo anaLysis in Latin aMeriCa & the CariBBean
130
PROdUCT MAIN ObjECTIVE TARGET AUdIENCE
41. According to your opinion, which are the components that a EWS
should include? (Multiple options).
1. Bulletins . . . . . . . . . . . . . . . . . . . . . . . . . . . . . . . . . . . . . . . . .
2. Public warnings . . . . . . . . . . . . . . . . . . . . . . . . . . . . . . . . . . . .
3. history/record of warnings . . . . . . . . . . . . . . . . . . . . . . . . . . . .
4. Epidemiological data about drug use . . . . . . . . . . . . . . . . . . . .
5. habilitated mechanism for public warnings . . . . . . . . . . . . . . .
6. reports and materials related to International Organizations . .
7. National reports and research on the subject . . . . . . . . . . . . . .
8. Links with other EWS . . . . . . . . . . . . . . . . . . . . . . . . . . . . . . .
9. Others. Specify . . . . . . . . . . . . . . . . . . . . . . . . . . . . . . . . . . . .

42. Does the Observatory provide inputs to the preparation of the man-
datory reports the country presents to international bodies (for example,
UNODC, CICAD/OAS, PAHO/WHO, CARICOM, etc.)?
1. Yes . . . . . . . . . . . . . . . . . . . . . . . . . . . . . . . . . . . . . . . . . . . . .
2. No . . . . . . . . . . . . . . . . . . . . . . . . . . . . . . . . . . . . . . . . . . . . . .
indiCators
43. Please, indicate if the Observatory works with the following indi-
cators.
1. Prevalence of substance use . . . . . . . . . . . . . . . . . . . . . . .
2. Drug abuse . . . . . . . . . . . . . . . . . . . . . . . . . . . . . . . . . . . .
3. Drug dependence . . . . . . . . . . . . . . . . . . . . . . . . . . . . . . .
4. Age of initiation of substance use . . . . . . . . . . . . . . . . . . .
5. Incidence of substance use (past year and past month) . .
6. Perception of risk associated with drug use . . . . . . . . . . . .
7. Perceived availability of drugs . . . . . . . . . . . . . . . . . . . . . .
8. Supply of drugs . . . . . . . . . . . . . . . . . . . . . . . . . . . . . . . . .
9. Potential demand of treatment and care . . . . . . . . . . . . . .
10. mortality directly associated with drug use . . . . . . . . . . . .
11. mortality indirectly associated with drug use . . . . . . . . . . .
12. morbidity associated with drug use . . . . . . . . . . . . . . . . . .
13. Prevalence/incidence of hIV and/or other infections
(hepatitis B & C…) among injecting and/or non-injecting
drug users . . . . . . . . . . . . . . . . . . . . . . . . . . . . . . . . . . . . .
Y N
Y N
Y N
Y N
Y N
Y N
Y N
Y N
Y N
Y N
Y N
Y N
Y N
annex i: questionnaire
131

14. Persons in treatment . . . . . . . . . . . . . . . . . . . . . . . . . . . .
15. Supply of treatment . . . . . . . . . . . . . . . . . . . . . . . . . . . . . .
16. Detentions related to violations of drug laws . . . . . . . . . . .
17. Substance-related traffic accidents . . . . . . . . . . . . . . . . . .
18. Drug-related gender violence episodes . . . . . . . . . . . . . . .
19. Drug seizures . . . . . . . . . . . . . . . . . . . . . . . . . . . . . . . . . .
20. Potency of cocaine production . . . . . . . . . . . . . . . . . . . . .
21. Cultivated areas of coca . . . . . . . . . . . . . . . . . . . . . . . . . .
22. Purity and chemical compounds of drugs . . . . . . . . . . . . .
23. Quantities and number of seizures of chemical
precursors used in the fabrication of illicit drugs . . . . . . . . .
24. Seizures of goods related to drug trafficking . . . . . . . . . . .
25. Number of dismantled illicit laboratories and other sites
of production or infrastructure . . . . . . . . . . . . . . . . . . . . . .
26. Price of drugs at retail level . . . . . . . . . . . . . . . . . . . . . . . .
27. Projects of sustainable development . . . . . . . . . . . . . . . . .
44. For those indicators that have been mentioned, when applicable,
please, indicate if there is available information disaggregated by sex.
1. Yes . . . . . . . . . . . . . . . . . . . . . . . . . . . . . . . . . . . . . . . . . . . . .
2. No . . . . . . . . . . . . . . . . . . . . . . . . . . . . . . . . . . . . . . . . . . . . . .
45. Specify the indicators the Observatory works regarding psychoac-
tive substances use in the General Population.
Y N
Y N
Y N
Y N
Y N
Y N
Y N
Y N
Y N
Y N
Y N
Y N
NY
NY
ndo anaLysis in Latin aMeriCa & the CariBBean
132

annex i: questionnaire
133
PsYCHOACTIVE
sUbsTANCE lIFE YEAR YEAR MONTH
Tobacco
Alcohol
Tranquilizers without
medical prescription1
Stimulants without
medical prescription2
Solvents & Inhalants3
marijuana
Cocaine (hydrochloride)
Smoking cocaine4
Ecstasy
hallucinogens5
hashish
heroin
Opium
morphine without
medical prescription
Ketamine
Amphetamines
methamphetamines
Other substances
dIR
EC
T
sU
PP
lY
PE
RC
EIV
Ed
AVA
IlA
bIl
ITY
PE
RC
EIV
Ed
RIs
K
dE
PE
Nd
EN
CE
Ab
Us
E
AG
E O
F
INIT
IAT
ION
INC
IdE
NC
E
PR
EVA
lE
NC
E
1) Valium, Lexotan, Alprazolam, rivotril, etc., 2) ritalin, fluoxetine, Zoloft. 3) fuels, glue, poppers. 4) base paste,
crack, paco, basuco. 5) Peyote, san pedro, LSD, PCP, mescalina.
Please, put an X in the boxes corresponding to the indicators worked,
the empty boxes will be understood as indicators that are not worked.

46. Specify the indicators the Observatory works regarding psychoac-
tive substances use in Secondary School (High School) students. Plea -
se, put an X in the boxes corresponding to the indicators worked, the
empty boxes will be understood as indicators that are not worked.
ndo anaLysis in Latin aMeriCa & the CariBBean
134
PsYCHOACTIVE
sUbsTANCE lIFE YEAR YEAR MONTH
Tobacco
Alcohol
Tranquilizers without
medical prescription1
Stimulants without
medical prescription2
Solvents & Inhalants3
marijuana
Cocaine (hydrochloride)
Smoking cocaine4
Ecstasy
hallucinogens5
hashish
heroin
Opium
morphine without
medical prescription
Ketamine
Amphetamines
methamphetamines
Other substances
dIR
EC
T
sU
PP
lY
PE
RC
EIV
Ed
AVA
IlA
bIl
ITY
PE
RC
EIV
Ed
RIs
K
dE
PE
Nd
EN
CE
Ab
Us
E
AG
E O
F
INIT
IAT
ION
INC
IdE
NC
E
PR
EVA
lE
NC
E
1) Valium, Lexotan, Alprazolam, rivotril, etc. 2) ritalin, fluoxetine, Zoloft. 3) fuels, glue, poppers. 4) base paste,
crack, paco, basuco. 5) Peyote, san pedro, LSD, PCP, mescalina.

47. Has the Observatory adopted an international protocol of reference
to collect and follow the data?
1. Yes . . . . . . . . . . . . . . . . . . . . . . . . . . . . . . . . . . . . . . . . . . . . .
2. No (Go to question 50) . . . . . . . . . . . . . . . . . . . . . . . . . . . . . .
48. What international protocols of reference for the collection and fo-
llow-up of data have been adopted?
1. COPOLAD Phase I . . . . . . . . . . . . . . . . . . . . . . . . . . . . . . . . .
2. SIDUC-CICAD/OAS . . . . . . . . . . . . . . . . . . . . . . . . . . . . . . . . .
3. European System/EmCDDA . . . . . . . . . . . . . . . . . . . . . . . . . .
4. UNODC . . . . . . . . . . . . . . . . . . . . . . . . . . . . . . . . . . . . . . . . . .
5. Other. Specify . . . . . . . . . . . . . . . . . . . . . . . . . . . . . . . . . . . . .
49. Is this tool included at the level of indicators?
COPOLAD PHASE I
49.1. Epidemiological and demand reduction
49.2. Supply control
SIDUC-CICAD/OAS
49.3. Epidemiological and demand reduction
49.4. Inter-American Uniform Drug Supply Statistical System
TOTALLY PArTIALLY DOES NOT USE
TOTALLY PArTIALLY DOES NOT USE
TOTALLY PArTIALLY DOES NOT USE
DOES NOT USEPArTIALLYTOTALLY
annex i: questionnaire
135
EUROPEAN SySTEM/EMCDDA
49.5. Epidemiological and demand reduction
49.6. Supply control
UNODC
49.7. Epidemiological and demand reduction
49.8. Supply control
OTHER. Specify . . . . . . . . . . . . . . . . . . . . . . . . . . . . . . . . . . . . . . . .
49.9. Epidemiological and demand reduction
49.10. Supply control
anaLysis and ProduCtion
50. What problems and issues have been examined by the Observatory,
using analytical strategies based on the collection and combination of
multi-source data?
. . . . . . . . . . . . . . . . . . . . . . . . . . . . . . . . . . . . . . . . . . . . . . . . . . . . . . .
. . . . . . . . . . . . . . . . . . . . . . . . . . . . . . . . . . . . . . . . . . . . . . . . . . . . . . .
. . . . . . . . . . . . . . . . . . . . . . . . . . . . . . . . . . . . . . . . . . . . . . . . . . . . . . .
. . . . . . . . . . . . . . . . . . . . . . . . . . . . . . . . . . . . . . . . . . . . . . . . . . . . . . .
. . . . . . . . . . . . . . . . . . . . . . . . . . . . . . . . . . . . . . . . . . . . . . . . . . . . . . .
TOTALLY PArTIALLY DOES NOT USE
TOTALLY PArTIALLY DOES NOT USE
TOTALLY PArTIALLY DOES NOT USE
TOTALLY PArTIALLY DOES NOT USE
TOTALLY PArTIALLY DOES NOT USE
TOTALLY PArTIALLY DOES NOT USE
ndo anaLysis in Latin aMeriCa & the CariBBean
136

51. Between 2011 and 2016, has the Observatory worked in coopera-
tion with other actors?
1. Yes . . . . . . . . . . . . . . . . . . . . . . . . . . . . . . . . . . . . . . . . . . . . .
2. No (Go to question 53) . . . . . . . . . . . . . . . . . . . . . . . . . . . . . .
52. Please indicate the actors that have strategically cooperated with
the Observatory.
1. Universities and research centres . . . . . . . . . . . . . . . . . . . . . .
2. NgOs and civil society organizations . . . . . . . . . . . . . . . . . . .
3. health and epidemiological institutions . . . . . . . . . . . . . . . . . .
4. Professional associations . . . . . . . . . . . . . . . . . . . . . . . . . . . . .
5. Statistics and census bureaus . . . . . . . . . . . . . . . . . . . . . . . .
6. Private consultant firms . . . . . . . . . . . . . . . . . . . . . . . . . . . . . .
7. Cooperation and international agencies . . . . . . . . . . . . . . . . . .
8. Others (Specify) . . . . . . . . . . . . . . . . . . . . . . . . . . . . . . . . . . . .
53. Does the Observatory produce information disaggregated by sex,
on systematic, explicit and regular basis?
1. Yes . . . . . . . . . . . . . . . . . . . . . . . . . . . . . . . . . . . . . . . . . . . . .
2. No . . . . . . . . . . . . . . . . . . . . . . . . . . . . . . . . . . . . . . . . . . . . . .
54. Does the Observatory hold a “gender perspective“ in the analysis
of information?
1. Yes . . . . . . . . . . . . . . . . . . . . . . . . . . . . . . . . . . . . . . . . . . . . .
2. No . . . . . . . . . . . . . . . . . . . . . . . . . . . . . . . . . . . . . . . . . . . . . .
55. Does the Observatory use Geographical Information Systems
(geo-referencing)?
1. Yes . . . . . . . . . . . . . . . . . . . . . . . . . . . . . . . . . . . . . . . . . . . . .
2. No . . . . . . . . . . . . . . . . . . . . . . . . . . . . . . . . . . . . . . . . . . . . . .
annex i: questionnaire
137

quaLity. teChniCaL indePendenCe
56. Are there any mechanisms to monitor and evaluate the activities
and products of the Observatory?
1. Yes . . . . . . . . . . . . . . . . . . . . . . . . . . . . . . . . . . . . . . . . . . . . .
2. No (Go to question 58) . . . . . . . . . . . . . . . . . . . . . . . . . . . . . .
57. Please, indicate the mechanisms of monitoring and evaluation im-
plemented in 2015 and 2016
ndo anaLysis in Latin aMeriCa & the CariBBean
138
ObjECT
OF EVAlUATION
ORGANIsM REsPONsIblE
OF THE EVAlUATION
NATURE OF
THE ORGANIsM*
PERIOd/
PERIOdICITY
* Nature of the organism.
1. International.
2. National, external to the Drug Commission.
3. National, internal to the Drug Commission.
58. At the Observatory, are there any procedures of quality control of
the processes of production of information and the publications?
1. Yes . . . . . . . . . . . . . . . . . . . . . . . . . . . . . . . . . . . . . . . . . . . . .
2. No (Go to question 60) . . . . . . . . . . . . . . . . . . . . . . . . . . . . . .

59. What processes and/or actions have been implemented in order to
control de quality of data?
. . . . . . . . . . . . . . . . . . . . . . . . . . . . . . . . . . . . . . . . . . . . . . . . . . . . . . .
. . . . . . . . . . . . . . . . . . . . . . . . . . . . . . . . . . . . . . . . . . . . . . . . . . . . . . .
. . . . . . . . . . . . . . . . . . . . . . . . . . . . . . . . . . . . . . . . . . . . . . . . . . . . . . .
. . . . . . . . . . . . . . . . . . . . . . . . . . . . . . . . . . . . . . . . . . . . . . . . . . . . . . .
. . . . . . . . . . . . . . . . . . . . . . . . . . . . . . . . . . . . . . . . . . . . . . . . . . . . . . .
60. Studies to be conducted (Multiple options):
1. Are decided by the Observatory . . . . . . . . . . . . . . . . . . . . . . .
2. Are requested from above in the hierarchy
(external to the Observatory) . . . . . . . . . . . . . . . . . . . . . . . . . .
3. Are requested by other areas within the same
Drug Commission . . . . . . . . . . . . . . . . . . . . . . . . . . . . . . . . . .
4. Others (Specify) . . . . . . . . . . . . . . . . . . . . . . . . . . . . . . . . . . . .
visiBiLity. CoMMuniCation
61. Do the main interlocutors, stakeholders and key players (effective
or potential) know the existence of the Observatory?
1. Yes, most of them or all of them . . . . . . . . . . . . . . . . . . . . . . .
2. Yes, some of them . . . . . . . . . . . . . . . . . . . . . . . . . . . . . . . . . .
3. No . . . . . . . . . . . . . . . . . . . . . . . . . . . . . . . . . . . . . . . . . . . . . .
62. Is the Observatory considered one of the main references in relation
to drug information in the country?
1. It is the main reference . . . . . . . . . . . . . . . . . . . . . . . . . . . . . .
2. It is one of the main references, among others . . . . . . . . . . . .
3. No, it is not one of the main references . . . . . . . . . . . . . . . . . .
annex i: questionnaire
139

63. Does the Observatory cooperate with the elaboration of other
products such as dissemination or sensitization materials, talks or
courses.
1. Yes . . . . . . . . . . . . . . . . . . . . . . . . . . . . . . . . . . . . . . . . . . . . .
2. No (Go to question 65) . . . . . . . . . . . . . . . . . . . . . . . . . . . . . .
64. In 2015, has the Observatory participated in the following acti-
vities?
1. Elaboration of materials of dissemination/sensitization
(brochures, multimedia) . . . . . . . . . . . . . . . . . . . . . . . . . . . . . .
2. realization of events
(Seminars/Symposia/Scientific Workshops) . . . . . . . . . . . . . . .
3. Talks and courses . . . . . . . . . . . . . . . . . . . . . . . . . . . . . . . . . .
4. Training of health professionals . . . . . . . . . . . . . . . . . . . . . . . .
5. formation of personnel working on supply control . . . . . . . . .
6. Other activities . . . . . . . . . . . . . . . . . . . . . . . . . . . . . . . . . . . . .
65. Does the Observatory develop a communication strategy
for its products? . . . . . . . . . . . . . . . . . . . . . . . . . . . . . . . . . . . .
66. Is the Observatory able to communicate directly
with the media? . . . . . . . . . . . . . . . . . . . . . . . . . . . . . . . . . . . .
67. Do media and journalists mention the reports and
publications of the Observatory? . . . . . . . . . . . . . . . . . . . . . . .
68. Do media and journalists spontaneously contact
the Observatory in order to get information? . . . . . . . . . . . . . .
69. Is there a communication policy oriented towards
the strategic partners? . . . . . . . . . . . . . . . . . . . . . . . . . . . . . . .
Y N
Y N
Y N
Y N
NY
ndo anaLysis in Latin aMeriCa & the CariBBean
140

70. Are there any publications, reports or working papers
specifically addressed to particular target audiences? . . . . . .
71. Does the Observatory have direct channels of communication
with the general public? (Social networks, Webpage) . . . . . . .
inFraestruCture. huMan and MateriaL resourCes
72. Does the Observatory have the following elements of infrastructure
and equipment?
1. Adequate facilities (location) . . . . . . . . . . . . . . . . . . . . . . . . . .
2. furniture and installations . . . . . . . . . . . . . . . . . . . . . . . . . . . .
3. Computers & other informatics equipment . . . . . . . . . . . . . . . .
4. Software . . . . . . . . . . . . . . . . . . . . . . . . . . . . . . . . . . . . . . . . .
5. Access to regular and efficient Internet networks . . . . . . . . . .
6. A space for documentation and archive . . . . . . . . . . . . . . . . .
7. Website . . . . . . . . . . . . . . . . . . . . . . . . . . . . . . . . . . . . . . . . . .
8. Platform for the information system . . . . . . . . . . . . . . . . . . . . .
9. Others (Specify) . . . . . . . . . . . . . . . . . . . . . . . . . . . . . . . . . . . .
73. What are the mains deficits in terms of infrastructure and equipment
of the Observatory?
1. Adequate facilities (location) . . . . . . . . . . . . . . . . . . . . . . . . . .
2. furniture and installations . . . . . . . . . . . . . . . . . . . . . . . . . . . .
3. Computers & other informatics equipment . . . . . . . . . . . . . . . .
4. Software . . . . . . . . . . . . . . . . . . . . . . . . . . . . . . . . . . . . . . . . .
5. Access to regular and efficient Internet networks . . . . . . . . . .
6. A space for documentation and archive . . . . . . . . . . . . . . . . .
Y N
Y N
annex i: questionnaire
141

7. Website . . . . . . . . . . . . . . . . . . . . . . . . . . . . . . . . . . . . . . . . . .
8. Platform for the information system . . . . . . . . . . . . . . . . . . . . .
9. Others (Specify) . . . . . . . . . . . . . . . . . . . . . . . . . . . . . . . . . . . .
74. Does the Observatory have a full-time, exclusive staff?
1. Yes . . . . . . . . . . . . . . . . . . . . . . . . . . . . . . . . . . . . . . . . . . . . .
how many employees? . . . . . . . . . . . . . . . . . . . . . . . . . .
2. No (Go to question 76) . . . . . . . . . . . . . . . . . . . . . . . . . . . . . .
75. Please describe the profiles of the staff currently working at the
Observatory.
ndo anaLysis in Latin aMeriCa & the CariBBean
142
CO
NT
RA
CT
*
MO
NT
Hs
/YE
AR
IN T
HE
PO
sIT
ION
NU
Mb
ER
OF
wO
RK
ING
HO
UR
s P
ER
wE
EK
sP
EC
IFIC
FO
RM
AT
ION
ON
dR
UG
s
Es
PE
CIA
lIz
AT
ION
AC
Ad
EM
IC O
R
PR
OF
Es
sIO
NA
l
FO
RM
AT
ION
PO
sIT
ION
/ d
UT
IEs
AN
d T
As
Ks
1. Coordination/direction
2. . . . . . . . . . . . . . . . . . . . . .
3. . . . . . . . . . . . . . . . . . . . . .
4. . . . . . . . . . . . . . . . . . . . . .
5. . . . . . . . . . . . . . . . . . . . . .
6. . . . . . . . . . . . . . . . . . . . . .
7. . . . . . . . . . . . . . . . . . . . . .
* Contract: 1. Permanent, 2. Short term.

76. What is the profile of the position of Director/Coordinator of the Ob-
servatory?
A position of political trust or direct appointment (regardless
the professional accreditation and/or technical preparation
for the position) . . . . . . . . . . . . . . . . . . . . . . . . . . . . . . . . . . .
A hierarchical position in the professional career within
the organizational structure . . . . . . . . . . . . . . . . . . . . . . . . . . .
Other ¿Which? . . . . . . . . . . . . . . . . . . . . . . . . . . . . . . . . . . . .
77. When was the last replacement in the position of Director/Coor-
dinator?
month . . . . . . . . . . . . . . . . . . . . . . . . . . . . . . . . . . . . . . . .
Year . . . . . . . . . . . . . . . . . . . . . . . . . . . . . . . . . . . . . . . . . .
78. Are there any formal mechanisms to involve national experts in the
activities of the Observatory?
1. Yes . . . . . . . . . . . . . . . . . . . . . . . . . . . . . . . . . . . . . . . . . . . . .
2. No . . . . . . . . . . . . . . . . . . . . . . . . . . . . . . . . . . . . . . . . . . . . . .
79. Does the Observatory coordinate activities with Observatories of
other countries?
1. Yes . . . . . . . . . . . . . . . . . . . . . . . . . . . . . . . . . . . . . . . . . . . . .
Please specify kind of coordination . . . . . . . . . . . . . . . . . . . . .
2. No . . . . . . . . . . . . . . . . . . . . . . . . . . . . . . . . . . . . . . . . . . . . . .
80. Does the Observatory coordinate activities with international orga-
nisms and programmes (CICAD, UNODC, COPOLAD, EMCDDA, etc.)?
1. Yes . . . . . . . . . . . . . . . . . . . . . . . . . . . . . . . . . . . . . . . . . . . . .
2. No . . . . . . . . . . . . . . . . . . . . . . . . . . . . . . . . . . . . . . . . . . . . . .
81. Does the Observatory hire external professionals or experts to form
technical teams?
1. Yes . . . . . . . . . . . . . . . . . . . . . . . . . . . . . . . . . . . . . . . . . . . . .
2. No (Go to question 84) . . . . . . . . . . . . . . . . . . . . . . . . . . . . . .
annex i: questionnaire
143

82. How often, for what purposes, does the Observatory hire external
personnel to the Observatory?
1. for all studies . . . . . . . . . . . . . . . . . . . . . . . . . . . . . . . . . . . . .
2. Only for ad hoc or particular studies . . . . . . . . . . . . . . . . . . . .
3. Others (Specify) . . . . . . . . . . . . . . . . . . . . . . . . . . . . . . . . . . .
83. Besides the permanent staff and the short-term personnel already
mentioned, do you consider that it is necessary to incorporate further
staff to the Observatory?
1. Yes . . . . . . . . . . . . . . . . . . . . . . . . . . . . . . . . . . . . . . . . . . . . .
2. No (Go to question 85) . . . . . . . . . . . . . . . . . . . . . . . . . . . . . .
84. Please specify the main needs regarding the staff or personnel of
the Observatory:
ndo anaLysis in Latin aMeriCa & the CariBBean
144
PROFEssION OR TECHNICAl
sKIlls (jOb)sPECIAlIzATION
PERMANENT
OR TEMPORARY NEEd

traininG
85. Please describe the training programmes of staff, that have been
carried out between 2011 and 2016.
annex i: questionnaire
145
ON
lIN
E O
R
PR
Es
EN
T T
RA
ININ
G
NU
Mb
ER
OF
PE
OP
lE
TR
AIN
Ed
PE
RIO
d O
R
PE
RIO
dIC
ITY
RE
sP
ON
sIb
lE
INs
TIT
UT
ION
AR
EA
s O
F
TR
AIN
ING
NA
ME
OF
TH
E P
RO
GR
AM
ME
NU
Mb
ER
OF
PE
OP
lE
TO
bE
TR
AIN
Ed
sC
HE
dU
lE
d
PE
RIO
d
RE
sP
ON
sIb
lE
INs
TIT
UT
ION
AR
EA
s O
F
TR
AIN
ING
86. Are new training programmes scheduled for next year 2017?

87. Please indicate below the degree of need of training in the different
areas in order to enhance the Observatory, being 10: extremely neces-
sary, and 1: not at all necessary. In the following boxes specify (if appli-
cable) the group or segment to be trained, the number of people to be
trained, and the preferred methodology. Please, do not qualify with the
number 10 more than 5 areas of training.
ndo anaLysis in Latin aMeriCa & the CariBBean
146
AREAs OF TRAINING
dEGREE
OF
NECEssITY
NUMbER OF
PEOPlE
TO bE TRAINEd
PREFERREd METHOdOlOGY
(PREsENT, ONlINE,
OTHER)
1. Logics of social research
2. multi method research design
3. Design of surveys
4. Sampling
5. Descriptive statistical analysis
6. Inferential statistical analysis
7. Parametric statistical techniques
8. Non parametric statistical techniques
9. Analysis of secondary data
10. Design of qualitative research
11. focus groups
12. Interviews
13. Ethnographic studies
14. Analysis of qualitative data
15. meta analysis
16. Writing reports
17. Writing and submission
of scientific papers
18. Public health (in general)
19. Epidemiology
and epidemiological research
20. Evaluation of projects and programmes
21. Development of information
networks about drugs
22. Other (Specify)

88. In which strategic areas do you consider the Observatory needs
training? Indicate in each box a number from 1 to 10, where 1 means
not at all necessary, and 10 extremely necessary.
1. Drug consumption among the general population
(prevalence and incidence) . . . . . . . . . . . . . . . . . . . . . . . . . . .
2. Drug consumption by young people
(prevalence and incidence) . . . . . . . . . . . . . . . . . . . . . . . . . . .
3. Drug consumption by special
or vulnerable populations (Specify) . . . . . . . . . . . . . . . . . . . . .
4. high-risk consumption (e.g. injecting, dependence, etc.) . . . . .
5. Services utilisation . . . . . . . . . . . . . . . . . . . . . . . . . . . . . . . . . .
6. Drug-related morbidity . . . . . . . . . . . . . . . . . . . . . . . . . . . . . . .
7. Psychiatric morbidity directly attributed
to drug consumption . . . . . . . . . . . . . . . . . . . . . . . . . . . . . . .
8. Drug-related mortality . . . . . . . . . . . . . . . . . . . . . . . . . . . . . . .
9. Social exclusion and disadvantage . . . . . . . . . . . . . . . . . . . . .
10. Drug-relate crime . . . . . . . . . . . . . . . . . . . . . . . . . . . . . . . . . . .
11. Economic costs of drug consumption . . . . . . . . . . . . . . . . . . .
12. Information on drug availability and drug markets . . . . . . . . . .
13. Early Warning System (EWS) . . . . . . . . . . . . . . . . . . . . . . . . . .
14. Studies on the impact of social programmes . . . . . . . . . . . . .
15. Studies of alternative development . . . . . . . . . . . . . . . . . . . . .
16. Control of precursors and chemical substances . . . . . . . . . . .
17. research on different modalities of illicit traffic
of drugs and associated crimes . . . . . . . . . . . . . . . . . . . . . . . .
18. Associated factors to drug use . . . . . . . . . . . . . . . . . . . . . . . .
19. Others (Specify) . . . . . . . . . . . . . . . . . . . . . . . . . . . . . . . . . . . .
annex i: questionnaire
147

strenGths and needs
89. According to your opinion, what is the level of development of the
Observatory?
Choose a value from 1 to 4 . . . . . . . . . . . . . . . . . . . . . . . . . . .
(considering that 1 is Low and 4 is High)
90. According to the “state of the art” in which the activities of the Ob-
servatory are now, please evaluate the following strategic areas. Indi-
cate in each box a number from 1 to 10, where 1 means not developed,
and 10 very developed.
1. Drug consumption among the general population
(prevalence and incidence) . . . . . . . . . . . . . . . . . . . . . . . . . . .
2. Drug consumption by young people
(prevalence and incidence) . . . . . . . . . . . . . . . . . . . . . . . . . . .
3. Drug consumption by special
or vulnerable populations (Specify) . . . . . . . . . . . . . . . . . . . . .
4. high-risk consumption (e.g. injecting, dependence, etc.) . . . . .
5. Services utilisation . . . . . . . . . . . . . . . . . . . . . . . . . . . . . . . . . .
6. Drug-related morbidity . . . . . . . . . . . . . . . . . . . . . . . . . . . . . . .
7. Psychiatric morbidity directly attributed
to drug consumption . . . . . . . . . . . . . . . . . . . . . . . . . . . . . . .
8. Drug-related mortality . . . . . . . . . . . . . . . . . . . . . . . . . . . . . . .
9. Social exclusion and disadvantage . . . . . . . . . . . . . . . . . . . . .
10. Drug-relate crime . . . . . . . . . . . . . . . . . . . . . . . . . . . . . . . . . . .
11. Economic costs of drug consumption . . . . . . . . . . . . . . . . . . .
12. Information on drug availability and drug markets . . . . . . . . . .
13. Early Warning System (EWS) . . . . . . . . . . . . . . . . . . . . . . . . . .
14. Studies on the impact of social programmes . . . . . . . . . . . . .
ndo anaLysis in Latin aMeriCa & the CariBBean
148

15. Studies of alternative development . . . . . . . . . . . . . . . . . . . . .
16. Control of precursors and chemical substances . . . . . . . . . . .
17. research on different modalities of illicit traffic
of drugs and associated crimes . . . . . . . . . . . . . . . . . . . . . . . .
18. Associated factors to drug use . . . . . . . . . . . . . . . . . . . . . . . .
19. Others (Specify) . . . . . . . . . . . . . . . . . . . . . . . . . . . . . . . . . . . .
91. Please qualify the activities of the Observatory in the following stra-
tegic areas. Indicate in each box a number from 1 to 10, where 1 means
not important, and 10 very important.
1. Drug consumption among the general population
(prevalence and incidence) . . . . . . . . . . . . . . . . . . . . . . . . . . .
2. Drug consumption by young people
(prevalence and incidence) . . . . . . . . . . . . . . . . . . . . . . . . . . .
3. Drug consumption by special
or vulnerable populations (Specify) . . . . . . . . . . . . . . . . . . . . .
4. high-risk consumption (e.g. injecting, dependence, etc.) . . . . .
5. Services utilisation . . . . . . . . . . . . . . . . . . . . . . . . . . . . . . . . . .
6. Drug-related morbidity . . . . . . . . . . . . . . . . . . . . . . . . . . . . . . .
7. Psychiatric morbidity directly attributed
to drug consumption . . . . . . . . . . . . . . . . . . . . . . . . . . . . . . .
8. Drug-related mortality . . . . . . . . . . . . . . . . . . . . . . . . . . . . . . .
9. Social exclusion and disadvantage . . . . . . . . . . . . . . . . . . . . .
10. Drug-relate crime . . . . . . . . . . . . . . . . . . . . . . . . . . . . . . . . . . .
11. Economic costs of drug consumption . . . . . . . . . . . . . . . . . . .
12. Information on drug availability and drug markets . . . . . . . . . .
13. Early Warning System (EWS) . . . . . . . . . . . . . . . . . . . . . . . . . .
14. Studies on the impact of social programmes . . . . . . . . . . . . .
annex i: questionnaire
149

15. Studies of alternative development . . . . . . . . . . . . . . . . . . . . .
16. Control of precursors and chemical substances . . . . . . . . . . .
17. research on different modalities of illicit traffic
of drugs and associated crimes . . . . . . . . . . . . . . . . . . . . . . . .
18. Associated factors to drug use . . . . . . . . . . . . . . . . . . . . . . . .
19. Others (Specify) . . . . . . . . . . . . . . . . . . . . . . . . . . . . . . . . . . . .
Please, add in the space below any clarification, commentary or further
information you might consider necessary or useful.
If applicable, please indicate the number of the related question.
THANKS VERy MUCH INDEED
FOR yOUR VALUABLE PARTICIPATION!
ndo anaLysis in Latin aMeriCa & the CariBBean
150

dN
151
AntiguA And BArBudAInstitution
Office of national drug and Money Laundering Control Policy (OndCP)
Name of the person who answered the questionnaire
John J. Swift
Position
Manager - Anti-drug Strategy unit
ArgentinAInstitution
Secretaría de Políticas integrales sobre drogas de la nación Argentina
(SedrOnAr)
Name of the person who answered the questionnaire
María Verónica Brasesco
Position
director
tHe BAHAMAS
Institution
national Anti-drug Secretariat (nAdS)
Name of the person who answered the questionnaire
indirah Belle
Position
Ond Manager
Annex II: DIrectory of focAl PoInts
resPonsIble for comPletIon
of the QuestIonnAIre

BArBAdOS
Institution
national Council on Substance Abuse (nCSA)
Name of the person who answered the questionnaire
Betty Hunte
Position
Manager
BeLize
Institution
national drug Abuse Control Council (ndACC)
Name of the person who answered the questionnaire
esner Vellos
Position
director
BOLiViA
Institution
Consejo nacional de Lucha contra el tráfico ilícito
de drogas (COnALtid)
Name of the person who answered the questionnaire
Marco Antonio Ayala Sánchez
Position
Head of ndO
BrAziL
Institution
Secretaria nacional de Politicas sobre drogas (SenAd)
Name of the person who answered the questionnaire
Cejana Brasil Cirilo Passos
Position
general Coordinator. Observatório Brasileiro de informaçôes
sobre drogas
nDo AnAlysIs In lAtIn AmerIcA & the cArIbbeAn
152
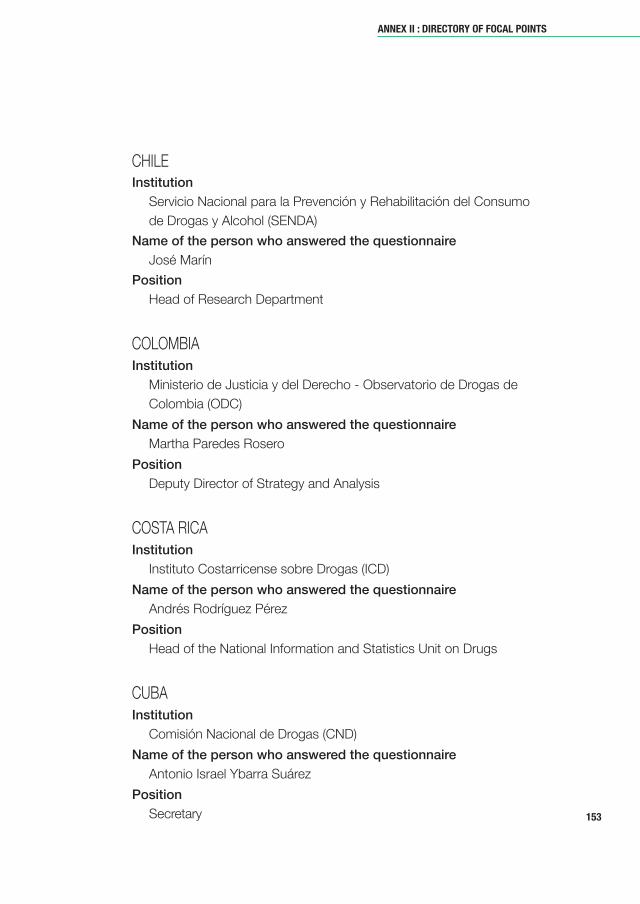
CHiLeInstitution
Servicio nacional para la Prevención y rehabilitación del Consumo
de drogas y Alcohol (SendA)
Name of the person who answered the questionnaire
José Marín
Position
Head of research department
COLOMBiA
Institution
Ministerio de Justicia y del derecho - Observatorio de drogas de
Colombia (OdC)
Name of the person who answered the questionnaire
Martha Paredes rosero
Position
deputy director of Strategy and Analysis
COStA riCA
Institution
instituto Costarricense sobre drogas (iCd)
Name of the person who answered the questionnaire
Andrés rodríguez Pérez
Position
Head of the national information and Statistics unit on drugs
CuBA
Institution
Comisión nacional de drogas (Cnd)
Name of the person who answered the questionnaire
Antonio israel Ybarra Suárez
Position
Secretary
Annex II : DIrectory of focAl PoInts
153

dOMiniCA
Institution
national drug Abuse Prevention unit (ndAPu)
Name of the person who answered the questionnaire
Martha Jarvis
Position
research and information Officer
eCuAdOr
Institution
Secretaría técnica de drogas (Seted)
Name of the person who answered the questionnaire
ernesto Javier Paspuel revelo
Position
director of Analysis and Studies on drugs
eL SALVAdOr
Institution
Comisión nacional Antidrogas (CnA)
Name of the person who answered the questionnaire
Alama Cecilia escobar de Mena
Position
Coordinator of the Salvadoran Observatory on drugs and the unit
of research and Studies
grenAdA
Institution
drug Control Secretariat
Name of the person who answered the questionnaire
dave Alexander
Position
drug Control Officer
nDo AnAlysIs In lAtIn AmerIcA & the cArIbbeAn
154

guAteMALA
Institution
Secretaria ejecutiva Comisión Contra las Adicciones y el tráfico ilícito
de drogas (SeCCAtid)
Name of the person who answered the questionnaire
renzo Adrián rivera Martínez
Position
director of the ndO
guYAnA
Institution
guyana drug information network (guYdin)
Name of the person who answered the questionnaire
Horace Cummings
Position
(interim)Chairman, guyana drug information network
HAiti
Institution
Commission nationale de Lutte contre la drogue (COnALd)
Name of the person who answered the questionnaire
Jean Alain Bernadel
Position
Head Manager Haitian drug Observatory
HOndurAS
Institution
dirección nacional de investigación e inteligencia (dnii)
Name of the person who answered the questionnaire
Sammá Blandón
Position
executive Secretariat for narcotics- Coordinator of the Chemical
Precursors Area
Annex II : DIrectory of focAl PoInts
155

nDo AnAlysIs In lAtIn AmerIcA & the cArIbbeAn
156
JAMAiCA
Institution
national Council on drug Abuse (nCdA)
Name of the person who answered the questionnaire
uki Atkinson
Position
research Analyst
MexiCO
Institution
Comisión nacional contra las Adicciones (COnAdiC)
Name of the person who answered the questionnaire
María José Martínez ruíz
Position
general technical-director of regulation Compliance
niCArAguA
Institution
Secretaría ejecutiva del Consejo nacional contra el Crimen
Organizado (CnCCO)
Name of the person who answered the questionnaire
José Javier Pineda Herrera
Position
Coordinator
PAnAMA
Institution
Comisión nacional para el estudio y la Prevención de
los delitos relacionados con drogas (COnAPred)
Name of the person who answered the questionnaire
nadja Porcell
Position
Coordinator of the national drug Observatory (OPAdrO)

PArAguAY
Institution
Secretaria nacional Antidrogas (SenAd)
Name of the person who answered the questionnaire
Juan Pablo López
Position
Head of departament of Statistics
Peru
Institution
Comisión nacional para el desarrollo y Vida sin drogas (deVidA)
Name of the person who answered the questionnaire
eduardo O´Brien neira
Position
director of technical Affairs
dOMiniCAn rePuBLiC
Institution
Consejo nacional de drogas (Cnd)
Name of the person who answered the questionnaire
Yelida garcía/Quénida Martínez
Position
director/research Officer
St. KittS & neViS
Institution
national Council on drug Abuse Prevention (nCdAP)
Name of the person who answered the questionnaire
Karimu Byron
Position
Coordinator
Annex II : DIrectory of focAl PoInts
157

SurinAMe
Institution
national Anti - drug Council (nAdC)
Name of the person who answered the questionnaire
M. Bunwaree
Position
director of the executive Office of the Councii
trinidAd & tOBAgO
Institution
national drug Council (ndC)
Name of the person who answered the questionnaire
Wendy Alexander
Position
Programme Officer
uruguAY
Institution
Junta nacional de drogas (Jnd)
Name of the person who answered the questionnaire
Héctor Suárez
Position
Coordinator of the ndO
VenezueLA
Institution
Oficina nacional Antidrogas (OnA)
Name of the person who answered the questionnaire
rafael Parada Yélamo
Position
director of the Venezuelan Observatory of drugs
nDo AnAlysIs In lAtIn AmerIcA & the cArIbbeAn
158
dN
159
Annex III: IndIcAtorsper substAnce by country
In this annex, tables that gather the number of indicators used in each
country are shown, by substance, making the distinction on studies made
with general population and secondary education students.
The 13 agreed indicators included in this study are:
• Prevalence of substance use.
• Drug abuse.
• Drug dependence.
• Age of initiation of substance use.
• Incidence of substance use (lifetime, past year, past month).
• Perception of risk associated with drug use.
• Supply of drugs.
• Potential demand for drug treatment and rehabilitation.
• Mortality associated with drug use.
• Morbidity associated with drug use.
• Persons in drug treatment.
• Drug seizures.
• Purity and chemical composition of drugs.

ndo AnALysIs In LAtIn AMerIcA & tHe cArIbbeAn
160
nu
mb
er
of
ind
ica
tors
use
d b
y ea
ch
co
un
try
in s
tud
ies
on
th
e g
en
era
l p
op
ula
tio
n b
y su
bst
an
ce
tobacco
alcohol
traNquilizers
stimulaNts
solveNts
marijuaNa
cocaiNe
smokiNg
cocaiNe
ecstasy
halluciNogeNs
hashish
heroiNe
opium
morphiNe
ketamiNe
metaNphetamiNe
aNphetamiNe
other drugs
Antigua &
Barb
ud
a
00
00
00
00
00
00
00
00
00
Arg
entina
67
66
510
99
85
20
22
22
05
The B
aham
as
00
00
00
00
00
00
00
00
00
Barb
ad
os
67
46
47
65
62
22
22
00
02
Boliv
ia5
55
55
77
75
50
00
00
00
5
Bra
zil
25
22
35
43
02
02
02
00
00
Chile
68
32
210
10
10
32
22
02
22
22
Colo
mb
ia6
86
67
10
10
10
85
05
00
55
70
Costa
Ric
a3
44
43
44
44
12
10
03
33
3
Dom
inic
a0
00
00
00
00
00
00
00
00
0
Ecuad
or
25
33
36
55
52
03
00
02
00
El S
alv
ad
or
6
86
65
10
10
10
81
04
00
10
01
Gre
nad
a
0
00
00
00
00
00
00
00
00
0
Guate
mala
00
00
00
00
00
00
00
00
00
Guya
na
6
86
67
10
10
10
80
00
00
00
00
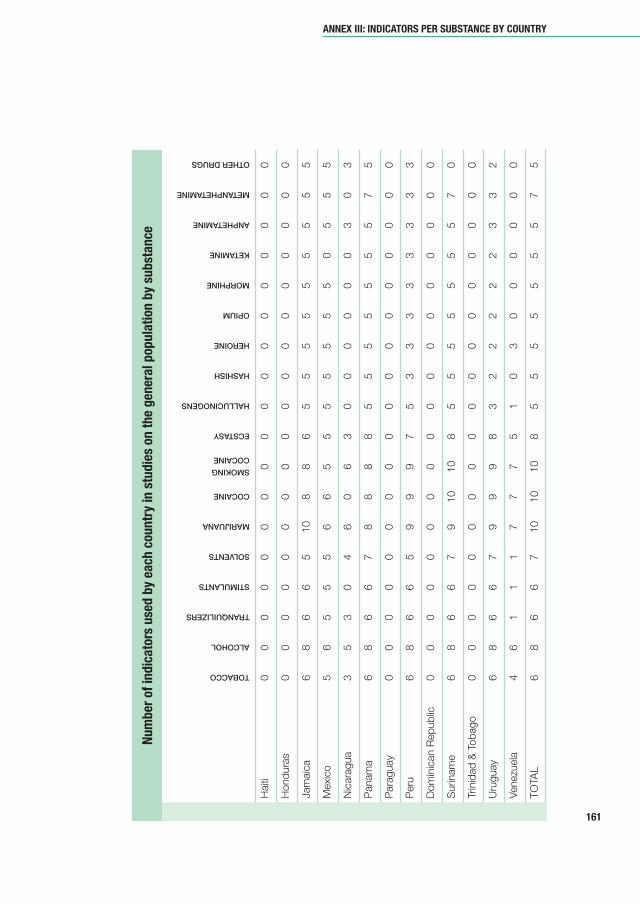
Annex III: IndIcAtors per substAnce by country
161
nu
mb
er
of
ind
ica
tors
use
d b
y ea
ch
co
un
try
in s
tud
ies
on
th
e g
en
era
l p
op
ula
tio
n b
y su
bst
an
ce
Haiti
00
00
00
00
00
00
00
00
00
Hond
ura
s
00
00
00
00
00
00
00
00
00
Jam
aic
a
6
86
65
10
88
65
55
55
55
55
Mexic
o
56
55
56
65
55
55
55
05
55
Nic
ara
gua
3
53
04
60
63
00
00
00
30
3
Panam
a
6
86
67
88
88
55
55
55
57
5
Para
guay
0
00
00
00
00
00
00
00
00
0
Peru
68
66
59
99
75
33
33
33
33
Dom
inic
an R
ep
ub
lic
00
00
00
00
00
00
00
00
00
Surinam
e
6
86
67
910
10
85
55
55
55
70
Trin
idad
& T
ob
ago
00
00
00
00
00
00
00
00
00
Uru
guay
68
66
79
99
83
22
22
23
32
Venezu
ela
4
61
11
77
75
10
30
00
00
0
TO
TA
L6
86
67
10
10
10
85
55
55
55
75
tobacco
alcohol
traNquilizers
stimulaNts
solveNts
marijuaNa
cocaiNe
smokiNg
cocaiNe
ecstasy
halluciNogeNs
hashish
heroiNe
opium
morphiNe
ketamiNe
metaNphetamiNe
aNphetamiNe
other drugs

ndo AnALysIs In LAtIn AMerIcA & tHe cArIbbeAn
162
nu
mb
er
of
ind
ica
tors
use
d b
y ea
ch
co
un
try
in s
tud
ies
on
Hig
h s
ch
oo
l st
ud
en
ts b
y su
bst
an
ce
Antigua &
Barb
ud
a0
00
00
00
00
00
00
00
00
0
Arg
entina
56
55
78
77
62
00
02
22
32
The B
aham
as
67
66
89
88
85
05
05
05
00
Barb
ad
os
67
55
58
66
51
11
11
00
04
Boliv
ia0
00
00
00
00
00
00
00
00
0
Bra
zil
34
30
34
33
11
01
01
13
10
Chile
67
52
59
88
22
22
00
02
22
Colo
mb
ia6
76
68
98
88
50
50
00
00
0
Costa
Ric
a3
44
44
44
44
30
30
03
33
3
Dom
inic
a6
76
68
98
88
55
55
55
57
5
Ecuad
or
35
44
57
66
63
03
00
03
00
El S
alv
ad
or
66
66
68
88
52
12
00
11
32
Gre
nad
a0
00
00
00
00
00
00
00
00
0
Guate
mala
66
66
88
88
85
55
00
55
70
Guya
na
67
66
89
88
80
00
00
00
00
tobacco
alcohol
traNquilizers
stimulaNts
solveNts
marijuaNa
cocaiNe
smokiNg
cocaiNe
ecstasy
halluciNogeNs
hashish
heroiNe
opium
morphiNe
ketamiNe
metaNphetamiNe
aNphetamiNe
other drugs

Annex III: IndIcAtors per substAnce by country
163
nu
mb
er
of
ind
ica
tors
use
d b
y ea
ch
co
un
try
in s
tud
ies
on
Hig
h s
ch
oo
l st
ud
en
ts b
y su
bst
an
ce
Haiti
66
66
77
70
75
55
50
05
60
Hond
ura
s0
00
00
00
00
00
00
00
00
0
Jam
aic
a6
76
66
88
88
55
55
55
55
5
Mexic
o5
55
55
55
55
55
55
50
55
5
Nic
ara
gua
34
00
05
04
00
00
00
00
00
Panam
a6
76
68
88
88
55
55
55
57
5
Para
guay
66
66
88
88
82
01
00
00
00
Peru
67
66
67
66
65
55
55
55
55
Dom
inic
an R
ep
ub
lic0
00
00
00
00
00
00
00
00
0
Surinam
e6
76
58
98
88
55
55
54
57
0
Trin
idad
& T
ob
ago
65
00
88
08
00
00
00
00
00
Uru
guay
44
44
39
66
63
32
22
22
42
Venezu
ela
44
44
45
55
20
01
00
00
10
TO
TA
L6
76
68
98
88
55
55
55
57
5
tobacco
alcohol
traNquilizers
stimulaNts
solveNts
marijuaNa
cocaiNe
smokiNg
cocaiNe
ecstasy
halluciNogeNs
hashish
heroiNe
opium
morphiNe
ketamiNe
metaNphetamiNe
aNphetamiNe
other drugs


dn
165
Annex IV: nDO DeVelOpment leVel:InDICAtORs useD tO buIlDthe ObseRVAtORy ClAssIfICAtIOn InDex
IndIcator defInItIon
answer and assIgned value
p10.1 Does the Observatory have specific budget for research?
yes = 100
no = 0
p15 Information the Observatory manages
produced by other institutions = 10
own production = 20
both = 30
p28.1 Scope of work of the Observatory: Supply control
yes = 80
no = 0
p28.2 Scope of work of the Observatory: Demand reduction
yes = 80
no = 0
p28.3 Scope of work of the Observatory: Evaluation of plans,
programmes and projects
yes = 60
no = 0
p29_a No. of approved studies conducted by the NDO
one = 60
two = 120
three = 180
0 study = 0
Research Component

nDO AnAlysIs In lAtIn AmeRICA & the CARIbbeAn
166
IndIcator defInItIon
answer and assIgned value
p29_b No. of non-approved studies conducted by the NDO
9 and more studies = 150
5 to 8 studies = 100
1 to 4 studies = 50
0 study = 0
p30_b_1 Weight of approved studies conducted by the NDO
between 2011-2016
9 and more studies = 240
5 to 8 studies = 160
1 to 4 studies = 80
0 study = 0
p30_b_2 Weight of non-approved studies conducted by the NDO
between 2011-2016
9 and more studies = 120
5 to 8 studies = 80
1 to 4 studies = 40
0 study = 0
p31 No. of administrative records managed by the NDO
10 and more records = 90
5 to 9 records = 60
1 to 4 records = 30
0 records = 0
p34 p35 Does the country have an Early-Warning System (EWS)? (p34)
Is the EWS coordinated by the National Drugs Observatory? (p35)
yes (in both questions) = 80
no (in at least one of the questions) = 0
p37 No. of actors in the EWS
1 actor = 1 point
p43_a Approved indicators used by the NDO
one = 10
0 = 0
p43_b Non-approved indicators used by the NDO
One = 5
0 = 0
p44 p53 p54 Information disaggregated by sex and “gender perspective”
in the analysis of information
gender perspective and info. disaggregated by sex = 40
gender perspective or info. disaggregated by sex = 20
no/no = 0

Annex IV: nDO DeVelOpment leVel: InDICAtORs
167
IndIcator defInItIon
answer and assIgned value
p45.1 Tobacco indicators
that the NDO uses for general population
adds 1 point for each indicator
0 = 0
p45.2 Alcohol indicators
that the NDO uses for general population
adds 1 point for each indicator
adds 0,5 if availability is older than 2011
0 = 0
p45.3 Tranquilizers indicators
that the NDO uses for general population
adds 1 point for each indicator
adds 0,5 if availability is older than 2011
0 = 0
p45.4 Stimulants indicators
that the NDO uses for general population
adds 1 point for each indicator
adds 0,5 if availability is older than 2011
0 = 0
p45.5 Solvents indicators
that the NDO uses for general population
adds 1 point for each indicator
adds 0,5 if availability is older than 2011
0 = 0
p45.6 Marijuana indicators
that the NDO uses for general population
adds 1 point for each indicator
adds 0,5 if availability is older than 2011
0 = 0
p45.7 Cocaine indicators
that the NDO uses for general population
adds 1 point for each indicator
adds 0,5 if availability is older than 2011
0 = 0
p45.8 Smoking cocaine indicators
that the NDO uses for general population
adds 1 point for each indicator
adds 0,5 if availability is older than 2011
0 = 0

IndIcator defInItIon
answer and assIgned value
p45.9 Ecstasy indicators
that the NDO uses for general population
adds 1 point for each indicator
adds 0,5 if availability is older than 2011
0 = 0
p45.10 Hallucinogens indicators
that the NDO uses or general population
adds 1 point for each indicator
adds 0,5 if availability is older than 2011
0 = 0
p45.11 Hashish indicators
that the NDO uses for general population
adds 1 point for each indicator
adds 0,5 if availability is older than 2011
0 = 0
p45.12 Heroine indicators
that the NDO uses for general population
adds 1 point for each indicator
adds 0,5 if availability is older than 2011
0 = 0
p45.13 Opium indicators
that the NDO uses for general population
adds 1 point for each indicator
adds 0,5 if availability is older than 2011
0 = 0
p45.14 Morphine indicators
that the NDO uses for general population
adds 1 point for each indicator
adds 0,5 if availability is older than 2011
0 = 0
p45.15 Ketamine indicators
that the NDO uses for general population
adds 1 point for each indicator
adds 0,5 if availability is older than 2011
0 = 0
p45.16 Amphetamines indicators
that the NDO uses for general population
adds 1 point for each indicator
adds 0,5 if availability is older than 2011
0 = 0
nDO AnAlysIs In lAtIn AmeRICA & the CARIbbeAn
168

IndIcator defInItIon
answer and assIgned value
p45.17 Methamphetamine indicators
that the NDO uses for general population
adds 1 point for each indicator
adds 0,5 if availability is older than 2011
0 = 0
p45.18 Other drugs indicators
that the NDO uses for general population
adds 1 point for each indicator
adds 0,5 if availability is older than 2011
0 = 0
p46.1 Tobacco indicators
that the NDO uses for High School students population
adds 0,5 points for each indicator
adds 0,25 if availability is older than 2011
0 = 0
p46.2 Alcohol indicators
that the NDO uses for High School students population
adds 0,5 points for each indicator
adds 0,25 if availability is older than 2011
0= 0
p46.3 Tranquilizers indicators
that the NDO uses for High School students population
adds 0,5 points for each indicator
adds 0,25 if availability is older than 2011
0 = 0
p46.4 Stimulants indicators
that the NDO uses for High School students population
adds 0,5 points for each indicator
adds 0,25 if availability is older than 2011
0 = 0
p46.5 Solvents indicators
that the NDO uses for High School students population
adds 0,5 points for each indicator
adds 0,25 if availability is older than 2011
0 = 0
p46.6 Marijuana indicators
that the NDO uses for High School students population
adds 0,5 points for each indicator
adds 0,25 if availability is older than 2011
0 = 0
Annex IV: nDO DeVelOpment leVel: InDICAtORs
169

IndIcator defInItIon
answer and assIgned value
p46.7 Cocaine indicators
that the NDO uses for High School students population
adds 0,5 points for each indicator
adds 0,25 if availability is older than 2011
0 = 0
p46.8 Smoking cocaine indicators
that the NDO uses for High School students population
adds 0,5 points for each indicator
adds 0,25 if availability is older than 2011
0 = 0
p46.9 Ecstasy indicators
that the NDO uses for High School students population
adds 0,5 points for each indicator
adds 0,25 if availability is older than 2011
0 = 0
p46.10 Hallucinogens indicators
that the NDO uses for High School students population
adds 0,5 points for each indicator
adds 0,25 if availability is older than 2011
0 = 0
p46.11 Hashish indicators
that the NDO uses for High School students population
adds 0,5 points for each indicator
adds 0,25 if availability is older than 2011
0 = 0
p46.12 Heroine indicators
that the NDO uses for High School students population
adds 0,5 points for each indicator
adds 0,25 if availability is older than 2011
0 = 0
p46.13 Opium indicators
that the NDO uses for High School students population
adds 0,5 points for each indicator
adds 0,25 if availability is older than 2011
0 = 0
p46.14 Morphine indicators
that the NDO uses for High School students population
adds 0,5 points for each indicator
adds 0,25 if availability is older than 2011
0 = 0
nDO AnAlysIs In lAtIn AmeRICA & the CARIbbeAn
170

IndIcator defInItIon
answer and assIgned value
p46.15 Ketamine indicators
that the NDO uses for High School students population
adds 0,5 points for each indicator
adds 0,25 if availability is older than 2011
0 = 0
p46.16 Amphetamines indicators
that the NDO uses for High School students population
adds 0,5 points for each indicator
adds 0,25 if availability is older than 2011
0 = 0
p46.17 Methamphetamine indicators
that the NDO uses for High School students population
adds 0,5 points for each indicator
adds 0,25 if availability is older than 2011
0 = 0
p46.18 Other drugs indicators
that the NDO uses for High School students population
adds 0,5 points for each indicator
adds 0,25 if availability is older than 2011
0 = 0
p47 Adoption by the National Drugs Observatory
of an international protocol
yes = 25
no = 0
p51 Cooperative processes between the NDO
and other actors between the years 2011 and 2016
yes = 10
no = 0
p55 The Observatory incorporates the use of Geographical
Information Systems in the analysis of the information
yes = 10
no = 0
p58 There are procedures for quality control of the different
processes of production of information and publications
yes = 20
no = 0
Annex IV: nDO DeVelOpment leVel: InDICAtORs
171

IndIcator defInItIon
answer and assIgned value
p10.2 NDO has a specific budget for publications
yes = 60
no = 0
p30_c No. of publications produced by the NDO between 2011-2016
more than 10 publications = 100
5 to 10 publications = 50
1 to 4 publications = 25
0 publication = 0
p33 No. of reports or publications on administrative records
more than 10 reports = 80
5 to 10 reports = 40
1 to 4 reports = 20
0 report = 0
p40 No. of products of the EWS
more than 10 products = 80
5 to 10 products = 40
1 to 4 products = 20
0 product = 0
nDO AnAlysIs In lAtIn AmeRICA & the CARIbbeAn
172
publications Component

Annex IV: nDO DeVelOpment leVel: InDICAtORs
173
IndIcator defInItIon
answer and assIgned value
p10.4 NDO has a specific budget for human resources
yes =80
no = 0
p74 NDO has full-time staff
yes = 30
no = 0
p75 Average hours of staff currently employed by the NDO
40 and more hours per week = 30
21 to 39 hours per week = 20
up to 20 hours per week = 10
0 hours per week = 0
p75 Proportion of persons currently employed in the NDO
with seniority in the position of 3 years or more
Assigned value = at a rate measured by the indicator
0 = 0
p77 Seniority of NDO Coordinator/Director
more than 7 years in the position = 40
3 to 7 years in the position = 20
0 to 2 years in the position = 0
human Resources Component

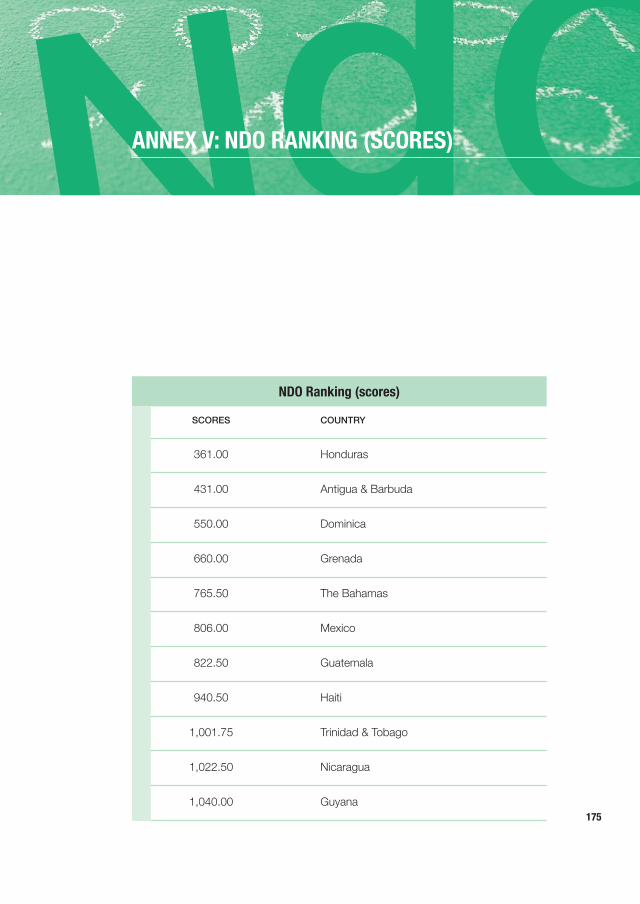
dn
175
ANNex V: NDO RANkiNg (scORes)
scores country
361.00 Honduras
431.00 Antigua & Barbuda
550.00 Dominica
660.00 Grenada
765.50 The Bahamas
806.00 Mexico
822.50 Guatemala
940.50 Haiti
1,001.75 Trinidad & Tobago
1,022.50 Nicaragua
1,040.00 Guyana
NDO Ranking (scores)

NDO ANALYsis iN LATiN AMeRicA & THe cARiBBeAN
176
scores country
1,069.00 Barbados
1,070.00 Dominican Republic
1,082.25 Suriname
1,091.75 Panama
1,094.00 Bolivia
1,147.50 Jamaica
1,154.00 Paraguay
1180.50 Costa Rica
1218.50 El Salvador
1262.50 Peru
1283.50 Ecuador
1286.50 Venezuela
1295.50 Chile
1314.75 Brazil
1458.50 Argentina
1813.00 Colombia
1831.50 Uruguay
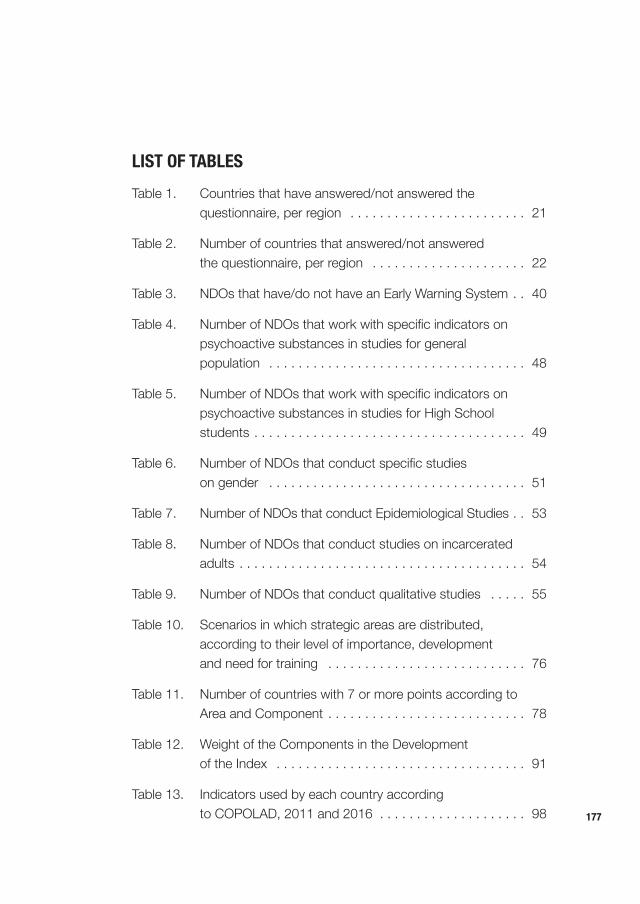
177
List of tabLes
Table 1. Countries that have answered/not answered the
questionnaire, per region . . . . . . . . . . . . . . . . . . . . . . . . 21
Table 2. Number of countries that answered/not answered
the questionnaire, per region . . . . . . . . . . . . . . . . . . . . . 22
Table 3. NDOs that have/do not have an Early Warning System . . 40
Table 4. Number of NDOs that work with specific indicators on
psychoactive substances in studies for general
population . . . . . . . . . . . . . . . . . . . . . . . . . . . . . . . . . . . 48
Table 5. Number of NDOs that work with specific indicators on
psychoactive substances in studies for High School
students . . . . . . . . . . . . . . . . . . . . . . . . . . . . . . . . . . . . . 49
Table 6. Number of NDOs that conduct specific studies
on gender . . . . . . . . . . . . . . . . . . . . . . . . . . . . . . . . . . . 51
Table 7. Number of NDOs that conduct Epidemiological Studies . . 53
Table 8. Number of NDOs that conduct studies on incarcerated
adults . . . . . . . . . . . . . . . . . . . . . . . . . . . . . . . . . . . . . . . 54
Table 9. Number of NDOs that conduct qualitative studies . . . . . 55
Table 10. Scenarios in which strategic areas are distributed,
according to their level of importance, development
and need for training . . . . . . . . . . . . . . . . . . . . . . . . . . . 76
Table 11. Number of countries with 7 or more points according to
Area and Component . . . . . . . . . . . . . . . . . . . . . . . . . . . 78
Table 12. Weight of the Components in the Development
of the Index . . . . . . . . . . . . . . . . . . . . . . . . . . . . . . . . . . 91
Table 13. Indicators used by each country according
to COPOLAD, 2011 and 2016 . . . . . . . . . . . . . . . . . . . . 98
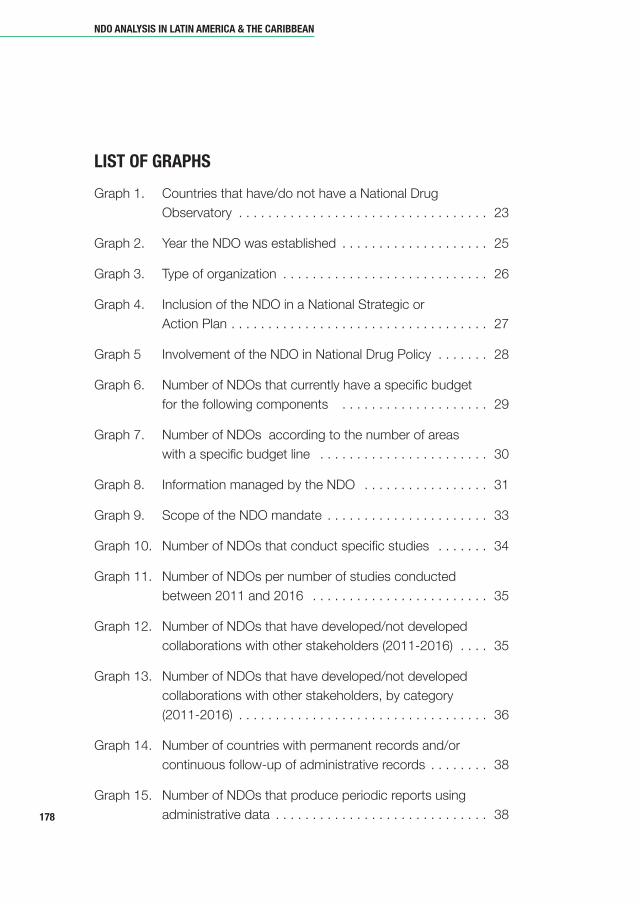
List of GRapHs
Graph 1. Countries that have/do not have a National Drug
Observatory . . . . . . . . . . . . . . . . . . . . . . . . . . . . . . . . . . 23
Graph 2. Year the NDO was established . . . . . . . . . . . . . . . . . . . . 25
Graph 3. Type of organization . . . . . . . . . . . . . . . . . . . . . . . . . . . . 26
Graph 4. Inclusion of the NDO in a National Strategic or
Action Plan . . . . . . . . . . . . . . . . . . . . . . . . . . . . . . . . . . . 27
Graph 5 Involvement of the NDO in National Drug Policy . . . . . . . 28
Graph 6. Number of NDOs that currently have a specific budget
for the following components . . . . . . . . . . . . . . . . . . . . 29
Graph 7. Number of NDOs according to the number of areas
with a specific budget line . . . . . . . . . . . . . . . . . . . . . . . 30
Graph 8. Information managed by the NDO . . . . . . . . . . . . . . . . . 31
Graph 9. Scope of the NDO mandate . . . . . . . . . . . . . . . . . . . . . . 33
Graph 10. Number of NDOs that conduct specific studies . . . . . . . 34
Graph 11. Number of NDOs per number of studies conducted
between 2011 and 2016 . . . . . . . . . . . . . . . . . . . . . . . . 35
Graph 12. Number of NDOs that have developed/not developed
collaborations with other stakeholders (2011-2016) . . . . 35
Graph 13. Number of NDOs that have developed/not developed
collaborations with other stakeholders, by category
(2011-2016) . . . . . . . . . . . . . . . . . . . . . . . . . . . . . . . . . . 36
Graph 14. Number of countries with permanent records and/or
continuous follow-up of administrative records . . . . . . . . 38
Graph 15. Number of NDOs that produce periodic reports using
administrative data . . . . . . . . . . . . . . . . . . . . . . . . . . . . . 38
NDo aNaLYsis iN LatiN aMeRiCa & tHe CaRibbeaN
178

Graph 16. Number of Early Warning Systems according to
stakeholders and institutions that integrate them . . . . . . 41
Graph 17. Number of NDOs that work with approved indicators
(COPOLAD, 2012) . . . . . . . . . . . . . . . . . . . . . . . . . . . . . 42
Graph 18. Number of NDOs that work with approved indicators
(COPOLAD, 2012), per indicator . . . . . . . . . . . . . . . . . . 44
Graph 19. Number of NDOs that work with selected “not approved”
indicators . . . . . . . . . . . . . . . . . . . . . . . . . . . . . . . . . . . . 45
Graph 20. Number of NDOs that work with “not approved”
indicators (COPOLAD, 2012) . . . . . . . . . . . . . . . . . . . . . 46
Graph 21. Number of NDOs that adopted international protocols . . 56
Graph 22. Number of NDOs according to each international
protocol adopted . . . . . . . . . . . . . . . . . . . . . . . . . . . . . . 57
Graph 23. Number of NDOs that use Geographical
Information Systems (Geo-Referencing) . . . . . . . . . . . . . 57
Graph 24. Number of NDOs that provide data
for National Reports . . . . . . . . . . . . . . . . . . . . . . . . . . . . 58
Graph 25. Number of NDOs that have/have no mechanisms to
monitor and evaluate their activities and products . . . . . 59
Graph 26. Number of NDOs responsible for monitoring and
evaluating their activities and products . . . . . . . . . . . . . . 60
Graph 27. Number of NDOs that have procedures for quality control
the generation of information and publications . . . . . . . . 60
Graph 28. Number of NDOs guided/not guided by an entity that
determines areas of research . . . . . . . . . . . . . . . . . . . . . 61
Graph 29. Number of NDOs using various communication
strategies . . . . . . . . . . . . . . . . . . . . . . . . . . . . . . . . . . . . 62
List of GRapHs
179

Graph 30. Number of NDOs that have organized specific
communication activities . . . . . . . . . . . . . . . . . . . . . . . . 63
Graph 31. Number of NDOs according to the perception that
stakeholders and interest groups show towards them . . 63
Graph 32. Number of NDOs that consider themselves as the main
reference point in relation to drug information in
the country . . . . . . . . . . . . . . . . . . . . . . . . . . . . . . . . . . . 64
Graph 33. Number of NDOs indicating shortcomings and
challenges in it . . . . . . . . . . . . . . . . . . . . . . . . . . . . . . . . 65
Graph 34. Number of NDOs based on the designation of the
Coordinator or Director . . . . . . . . . . . . . . . . . . . . . . . . . . 66
Graph 35. Number of NDOs based on the seniority of the
Coordinator or Director . . . . . . . . . . . . . . . . . . . . . . . . . . 66
Graph 36. Number of NDOs with full-time staff . . . . . . . . . . . . . . . . 67
Graph 37. Number of NDOs employing full-time staff . . . . . . . . . . . 68
Graph 38. Number of NDOs according to the percentage of staff
members with 3 or more years of service . . . . . . . . . . . . 68
Graph 39. Number of NDOs that require staff expansion . . . . . . . . . 69
Graph 40. Number of NDOs that hire consultants or experts
to form technical teams . . . . . . . . . . . . . . . . . . . . . . . . . 70
Graph 41. Number of NDOs that collaborate with other NDOs . . . . 71
Graph 42. Number of NDOs that coordinate activities with
international organizations or programmes . . . . . . . . . . . 71
Graph 43. Number of NDOs that have programmes for
staff training . . . . . . . . . . . . . . . . . . . . . . . . . . . . . . . . . . 72
Graph 44. Number of NDOs with 7 or more points according to
specific area for training . . . . . . . . . . . . . . . . . . . . . . . . . 73
NDo aNaLYsis iN LatiN aMeRiCa & tHe CaRibbeaN
180

Graph 45. Strategic areas according to level of development and
need for training . . . . . . . . . . . . . . . . . . . . . . . . . . . . . . . 80
Graph 46. Drug use in the general population: distribution of
countries according to their level of development and
training needs . . . . . . . . . . . . . . . . . . . . . . . . . . . . . . . . 83
Graph 47. Drug use among youth: distribution of countries
according to their level of development and
training needs . . . . . . . . . . . . . . . . . . . . . . . . . . . . . . . . 84
Graph 48. High risk drug use: distribution of countries according to
their level of development and training needs . . . . . . . . . 85
Graph 49. Characteristics of various NDOs . . . . . . . . . . . . . . . . . . . 92
List of GRapHs
181

aCRoNYMs
CARICOM Caribbean Community
CELAC Community of Latin American and Caribbean States
CICAD Comisión Interamericana para el Control del Abuso de
Drogas (Inter-American Drug Abuse Control Commission)
CONAPRED Comisión Nacional para el Estudio y la Prevención de los
Delitos Relacionados con Drogas (Panama)
COPOLAD Cooperation Programme between Latin America, the
Caribbean and the European Union on Drugs Policies
EMCDDA European Monitoring Centre for Drugs and Drug
Addiction
EU European Union
EWS Early Warning System
FIIAPP Fundación Internacional y para Iberoamérica de
Administración y Políticas Públicas (The International and
Ibero-American Foundation for Administration and Public
Policies) (Spain)
GIS Geographical Information Systems (geo-referencing)
JND Junta Nacional de Drogas (Uruguay)
NCDAP National Council on Drug Abuse Prevention (St. Kitts &
Nevis)
NDACC National Drug Abuse Control Council (Belize)
NDIS National Drug Information System
NDO National Drug Observatory
NGO Non-Governmental Organization
NDo aNaLYsis iN LatiN aMeRiCa & tHe CaRibbeaN
182

OAS Organization of American States
OID Observatorio Interamericano sobre Drogas
(Inter-American Observatory on Drugs)
PAHO Pan American Health Organization
SADCI Sistema de Análisis de Capacidad Institucional (System
for Institutional Capacity Analysis)
SEDRONAR Secretaría de Políticas Integrales sobre Drogas de la
Nación Argentina (Argentina)
SIDUC Sistema Interamericano de Datos Uniformes sobre Con-
sumo de Drogas (Interamerican System of Uniform Data
about Drug Consumption)
UNODC United Nations Office on Drugs and Crime
USAID United States Agency for International Development
WHO World Health Organization
aCRoNYMs
183


LEADERFIIAPP Spain
COUNTRIESSEDRONAR ArgentinaSENAD BrazilSENDA ChileMINJUSTICIA ColombiaICD Costa RicaCND CubaVLADA Czech RepublicCND Dominican RepublicSETED EcuadorCNA El SalvadorGIZ GermanyDNII HondurasCONADIC MexicoCONAPRED PanamaDEVIDA PeruNBDP PolandSICAD PortugalNAA RomaniaDGPNSD SpainNDC Trinidad and TobagoJND UruguayONA Venezuela
EUROPEAN AGENCYEMCDDA
MULTILATERAL AGENCIESCICAD – OAS • PAHO – WHO
BI-REGIONAL NETWORKSAIAMP • IDPC • RIOD
[email protected]@programacopolad
SITUATIONAL ANALYSIS OF NATIONAL DRUG OBSERVATORIES IN LATIN AMERICA AND THE CARIBBEAN
SITU
ATIO
NAL
ANAL
YSIS
OF
NATI
ONAL
DRU
G OB
SERV
ATOR
IES
IN L
ATIN
AM
ERIC
A AN
D TH
E CA
RIBB
EAN
Versión ingés
This project is funded bythe European Union
This project is funded bythe European Union
Versión ingés
libro_copolad(ingles).indd 1 3/11/17 14:15