size may not be the issue - bloustein...
TRANSCRIPT
Size May NotBe the iSSuean analysis of the Cost of Local Government
and Municipal Size in New Jersey
issue Paper #1 | November 2014 Bloustein Local Government Research Center
Raphael J. Caprio, PhDUniversity ProfessorDirector, Bloustein Local Government Research CenterEdward J. Bloustein School of Planning and Public PolicyRutgers, The State University of New Jersey
Marc H. Pfeiffer, MPAAssistant Director and Senior Policy FellowBloustein Local Government Research CenterEdward J. Bloustein School of Planning and Public PolicyRutgers, The State University of New Jersey
2 Bloustein Local Government Research Center
the Bloustein Local Government Research CenterNew Jersey is served by more than 1,500 distinct local government agencies: municipalities, school districts, utilities, counties,
and more. Yet, even with this wealth of opportunity, precious little substantive research as been done within the local
government environment to inform some of our state’s most pressing policy issues.
The Bloustein Local Government Research Center, or Bloustein Local http://blousteinlocal.rutgers.edu/, serves as a focal
point and engages in a range of services, including:
• Encouragingandconductingappliedandacademicresearchonlocalgovernmentfiscalandadministrativeissues,
emphasizing application and support to New Jersey local government.
• Developingresourcesthatcanassistothersinconductingresearchandanalysis.
• OrganizingandhostingconferencesandsymposiaonNewJerseylocalgovernmentfiscalandadministrative
issues.
• SupportingNewJerseylocalgovernmentfiscalandadministrativepolicydevelopment,implementation,and
analysis through contract research and on-call advice for organizations and institutions that engage in local
government policy setting and policymaking.
• Promotingandincreasingpublicunderstandingoflocalgovernmentissuesbypartneringwithandsupporting
civic and media organizations that inform and educate the public on local government matters.
A list of the Center’s current projects may be found online at http://blousteinlocal.rutgers.edu/projects/.
Raphael J. Caprio is university Professor at Rutgers university’s
edward J. Bloustein School of Planning and Public Policy, with
active research in the areas of local and state budgeting, public
finance, financial management, and public-sector management.
he is active in labor and public-sector interest arbitration, providing
expert testimony in more than 100 arbitration cases; Dr. Caprio
also maintains a continuing interest and participation in media
and public policy, for which he has received multiple New york and
mid-atlantic emmy nominations and awards.
Dr. Caprio also has extensive experience in higher education
management, serving as department chair, associate academic
dean, acting college dean, associate provost, interim university
Cio, and research institute director. Most recently he served as
university Vice President for Continuing Studies for more than
15 years, in which position he provided executive leadership for
off-campus, distance learning, summer and winter session, and
continuing education activities at the university.
he has served on several community service boards and is
currently a member of the St. Benedict’s Preparatory School Board
of trustees. Dr. Caprio can be reached at [email protected].
Marc H. Pfeiffer retired in 2012 from a 37-year career in New
Jersey local government administration, having served as a
municipal administrator in several municipalities, and 26 years
of service in the State’s local government oversight agency, the
Division of Local Government Services. at DLGS he served as
Deputy Director for 14 years, and periodically as acting Director.
Marc has broad experience in many areas of local government
policy and administration, including specific expertise in areas
such as finance and property taxation, public procurement, shared
services and consolidation, technology, energy, labor relations, and
general government administration. he also has deep experience
in the legislative process and as a regulatory officer. he is
currently engaged in research concerning the use of technology in
local government.
in addition to participating in Bloustein Local, Marc makes his
extensive government experience available as a guest lecturer at the
Bloustein School and other collaborative efforts. he is also assisting
the Rutgers School of Public affairs and administration with the
State’s Certified Public Manager Program in curriculum development
and instruction. he can be reached at [email protected].
author Biographies

Size May Not Be the issue | November 2014 3
“Everything is the way it is because it got that way” is
aseminalaphorismfromthefieldofbiology,buthas
applicationthroughoutscientificstudy.PaulZachary
(“PZ”)Myerswrote:
It’s a subtle way of emphasizing the importance
of process and history in understanding why
everything is the way it is. You simply cannot
grasp the concepts of science if your approach
is to dissect the details in a static snapshot of its
current state; your only hope is to understand
the underlying mechanisms that generate that
state, and how it came to be….
To understand how something works, you must
firstunderstandhowitgotthatway.1
This observation applies remarkably well to the study
of New Jersey municipalities and their spending and
taxation practices. It is also inconsistent with the way
our public policies have been developed over time,
ignoring what the authors of this report have come
to term “New Jersey’s unique ‘political biology.’”2
Municipalities,largeandsmall,arewhattheyare
and do what they do; they have evolved over time to
provide a range of goods and services that reflect local
demands and wants, enveloped within a cocoon of
state-imposedfiscal,policy,andoperationalstandards.
Thisresearchpaperisthefirstofseveralstudies
designed to contribute to an empirical understanding
of the differences in costs among municipalities and
the extent to which consolidation, shared services, or
other strategies might be effective in controlling local
government costs. As property taxes represent, on
average, 60 percent of all local government revenue
with which to pay these costs, a more insightful
understanding of the determinants of these costs
and the potential moderation of cost increases will
contribute to a better understanding of possible
solutions to our state’s property tax “problem.”
The challenge of controlling local government costs3
in New Jersey is thus inextricably linked to issues
of the property tax, and vice versa; they cannot
be discussed in a vacuum. Public discourse often
reflects a “folk hypothesis” that New Jersey has “too
many municipalities and too much government,”
implying that sharing services and consolidating
local governments are the remedies to the costs of
municipal government. These solutions are presented
aselixirs,ways(perhapsinpart)forthestatetosolve
its property tax challenges: hypothesizing that we
have “too many governments” and, by extension, too
many small governments.
Consolidationofsmall,inefficientmunicipalitieshas
been advanced as a major strategy necessary in solving
the New Jersey property tax problem. Yet, while
such arguments are advanced, even to the point of
electedofficialsproposingmandatoryconsiderationof
consolidation by municipalities, the basic premise that
consolidations will solve the property tax problem
remains empirically and largely unsupported.
The premise for these arguments is that there must be
someinherentefficiencythatwillbeachievedthrough
increasing the size and scale of the state’s municipal
governments, theoretically affording possibilities for
efficienciesnotpossiblewithinNewJersey’s[now]
565 municipalities. Stated differently, current public
discourse assumes small municipalities do not operate
“efficiently.”
If this premise is correct, there should be some
measurable link between the size of government and
the cost of government.
Thegoalofthisfirstphaseofresearch,then,isto
determine whether there appears to be a measurable
difference in the cost of local government across
municipalities of different sizes.
introduction
4 Bloustein Local Government Research Center
The results of this analysis of municipal government
costs per capita in New Jersey for both the 2011
and2012fiscalyearswouldseemtocontradictthe
prevailing folk hypothesis in two fundamental areas:
first,thatthestatemayhavetoomanymunicipalities,
and second, that smaller municipalities are more
expensive than larger municipalities, thus contributing
to the overall state property tax challenge.4
First, the perception that the state has too many
municipalitiesmaybeflawed,orperhapsfilteredby
our evolutionary success in serving more people in
less geography than any other state. Yes, New Jersey
is the most densley populated state in the nation, but
when we look at the average population of “general
governments” in the states, New Jersey actually ranks
15th of the 50 states. Put another way, measured by the
number of general governments per 10,000 population,
the state ranks 34th of 50. These rather remarkable
rankings also apply across all units of government, such
asspecialdistricts.Specifically,35otherstateshavemore
total governmental units and special districts per 10,000
people than does New Jersey. Compared with the
population of other states, we may actually not have too
many general governments.
Second, the cost per capita of municipal government
doesnotsignificantlyvarybetweenlargeandsmall
municipalities in New Jersey. This is evident after
considering the unique character of approximately
four dozen municipalities, characterized by large
seasonal but small year-round populations: the
state’s coastal resort municipalities.5Manyofthese
communities reflect infrastructure, service costs,
andtaxablepropertyvalue(tax“ratables”)farin
excess of what would otherwise be expected given
their permanent, year-round populations. Similarly,
the costs of operating these communities appear
high, especially when treated simply as data points
on a spreadsheet. Yet these communities, although
overwhelmingly among the state’s “small” towns, also
tend to have among the lowest effective tax rates in
New Jersey. Accordingly, unless they are understood
to be what they are with regard to their unique
characteristics, as a group they distort uninformed
analyses.
Onceresortcommunitiesareseparatedoutfromthe
approximately500remainingmunicipalities,wefind
that the average cost of municipal government per
capita, as demonstrated in each of ten population size
groupsofmunicipalities,doesnotdiffersignificantly
between large or small government population
groups. The cost of municipal government in 2011
for municipalities under 1,900 population averages
$1,271, while those over 40,000 population average
$1,340; municipalities having populations between
3,601 and 5,150 experience the least costly local
government per capita costs at $1,092!
Third, and most intriguing, is that while there are no
strong individual correlations between municipal cost
percapitaandpopulationsize,wedofindsignificant
differences in the cost for municipal government
when considered against two non-size variables:
(1)theNewJerseyDepartmentofEducation
DistrictFactorGroup(DFG)thatamunicipality
isin(i.e.,asocioeconomicsurrogate),and(2)the
“type” of municipality, using the New Jersey State
Police“character”classification(UrbanCenter,
UrbanSuburb,Suburban,RuralCenter,andRural).
Significantlyhighercostoflocalgovernmentwas
found in DFG Groups A and J municipalities, while
DE group municipalities represented the lowest per
capita cost of local government.6 Also, municipalities
executive Summary
“...the perception that the state
has too many municipalities
may be flawed....”

Size May Not Be the issue | November 2014 5
classifiedintheNewJerseyStatePoliceUniform
Crime Report as either Rural Center or Rural
demonstrated low cost per capita of local government.
Thesefindingsshouldgivepause,suggestingthat
we may need to rethink the conventional wisdom
that forcing municipalities into larger organizations
willbemoreeffective,moreefficient,and/orless
costly. It should also give pause as to whether we
should be advocating with uncompromising vigor
that consolidation of municipalities is a solution to
thestate’shighpropertytaxproblem.Othernotyet
well understood factors appear more intimately linked
to variations in the cost of local government on a per
capita basis.
Efforts aimed at forcing municipalities to consolidate
mightjustasreadilyresultinundesirableand/or
unintended consequences emerging from consolidation.
First, the average cost data suggest that for the
most part, savings ultimately would be marginal,
if any. Second, consolidation would also require
special circumstances to exist: Do candidates for
consolidation see themselves as one community with
two governments, or two communities with two
governments? Like it or not, our political biology
often reinforces a community’s identity with its
municipality, place names aside. Whether one’s
mailingaddressisMorristownorNewVernon,
Harding Township is Harding Township. Third,
shouldpotentialsignificantsavingsbeanticipated,
they should accrue simultaneously and without
undue cost shifts from or to one or another of the
municipalities considering consolidation.
The feared potential for increased costs in one of
the two target communities has contributed to the
failure of consolidation efforts once it becomes
clear that property taxes in one of the municipalities
could increase. That this circumstance (i.e., no
unduecostshift)existsbetweentwomunicipalities
that are geographically adjacent adds an additional
challenge. Fourth, while consolidation may result
insomeservicestobeperformedmoreefficiently,
the conventional wisdom ignores the fact that in
post-consolidation circumstances, the newly formed
larger municipality may also exceed a service thresh-
old, requiring new or additional levels of services
not previously anticipated. Fifth, and also a focus
for future research, consolidation ignores additional
potential cost control through cooperation and shared
services,aformof“servicespecificconsolidation”
that does not necessitate effective disenfranchisement
of a community.
“...We may need to rethink
the conventional wisdom that
forcing municipalities into larger
organizations will be more
effective, more efficient, and/or
less costly.”
the authors thank Rutgers Professor emeritus ernest Reock, Jr., PhD, and the long-running Property tax Study Group he coordinates,
for his personal and the group’s individual and collective encouragement, comments, deliberation, and collegiality. over the long
gestation of this report, having had the members serve as a sounding board helped inform and guide the research.
the full report can be downloaded in PDF format from the Bloustein Local website at http://blousteinlocal.rutgers.edu/size-study/.
the authors welcome a public discussion on the report. Comments can be posted at the site link above. the authors reserve the right
to remove comments that are off-topic or inappropriate for discussion of the issue.
acknowledgments
online Resource

6 Bloustein Local Government Research Center
Morethan40yearsagotheCountyandMunicipal
Government Study Commission dedicated its Fifth
Report to “Consolidation: Prospects and Problems.”7
The Commission noted at that time:
•Itisrecognizedthatofthethreestrategies
[modernizingcountygovernment,encouraging
jointservices,andconsolidation]mentioned
above, consolidation is the most far-reaching
from a municipal point of view, in that it involves
basic alterations to municipal corporations and
basic changes in the powers and scope of local
government. However, it is also believed that
consolidation may strengthen local government
better than other alternatives in certain
situations.8
This report also cautioned:
•[W]herelocalunitsarenumerous,individually
small and urbanized, there is less to be gained
through merging a few isolated pairs of
municipalities than by streamlining the county
itself and equipping it to handle problems that
transcend local boundaries or abilities.
•Giventherangeofcomplexchallengesfacing
the state, the Commission did “not believe
that consolidation can be employed as a means
to arrest severe urban problems and service
deficiencies.”
•Aboveall,theCommissiondoesnotsuggest
that any municipality be “eliminated” according
to some arbitrary standard. The decision to
consolidate or not to consolidate should remain
yet municipal institutions constitute the strength of a free nation. . . . a nation may establish a free government, but without municipal institutions it cannot have the spirit of liberty.
—alexis de tocqueville
the citizens’ prerogative to the greatest extent
possible.9
Consideration of consolidation continues to be
repeated every decade or so, most recently in the
form of the Local Unit Alignment, Reorganization,
andConsolidationCommission(LUARCC).The
Commission’s enabling law passed in 2007 included
thefollowinglegislative“findings”:
•TheState...currentlyhas566municipalities,
616schooldistricts,and186firedistricts,each
with its own layers of local bureaucracy that
contribute to the high property tax burden
suffered by New Jersey residents.
•Consolidatinglocalunits,structurallyand
administratively streamlining county and
municipal government, and transferring services
to the most appropriate level of government for
delivery would help to alleviate the property tax
crisis.
•Duetolegalobstacles,conflictinginterests,
andlocalconcernsaboutsacrificingcommunity
identity, current laws permitting consolidation
of municipalities and sharing of services between
local units are seldom used.10
LUARCC was initially directed to address problems
ofinefficiencyandtheinequitiesofhousingthat
segmentationfostered,andtoaddress(solve)regional
challenges by borrowing aspects of the federal
government’sBaseRealignmentandClosure(BRAC)
process.11 Eventually passed in a weakened form by
allowing the electorate of each proposed consolidated
Background

Size May Not Be the issue | November 2014 7
municipalitytohavethefinalsay,whatSenatorJoseph
Kyrillos described as a “poison pill,” LUARCC again
failed to stimulate large-scale, serious debate, and
failed to recognize our political biology, as discussed
earlier.
The Commission ceased meeting in 2011 when its
appropriation was stripped from the state budget, and
its membership was not kept whole. During its short
life, it produced a body of research that was unable
to fully support the key principles of its legislative
findings.Effortsatrevivingandmodifyingitsmission
remain with the legislature.
New Jersey has been fully incorporated almost since
its inception, while municipalities in most states have
developed, and continue to develop, by annexation
of unincorporated, often adjacent, areas. As a simple
starting point, we observe that while it may be true that
California has fewer municipalities than New Jersey,
fullyoneinfiveCaliforniaresidentsin2014continueto
reside in unincorporated areas, a phenomenon that has
not existed in New Jersey since 1798.
NeW JeRSey: the SuBDiViSioN State
What came to be known as New Jersey began with
the British seizing land from the Dutch and Swedes
in 1664, followed by conflicting charters and
subsequently all its land being granted by the English
Crown to Lords Carteret and Berkeley.12 This was
immediatelyfollowedbyitsfirstsubdivisionseparating
WestJerseyandEastJersey.Manyimmigrantgroups
settledandestablishedessentiallyself-sufficient
agricultural communities, with their highest priority
essentially of being left alone, and their primary
“unifying” element being mutual safety from
domination by either New York or Philadelphia.13
Subsequently, the British Crown reunited the two
sections as a colony in 1702 (though maintaining two
capitalsuntilaftertheRevolutionaryWar).
During the colonial period, acts of the legislature
accommodated property owners’ desire to sell their
land and ultimately subdivided all of the colony’s
land into formal municipalities. By the time the
United States took shape, there were more than 100
municipalities—mostly townships, some cities, some
towns—all with legislated government forms. By
1798,whenthelegislaturefirstrecognizedthestate’s
municipal boundaries, New Jersey’s original cities and
104 townships had claimed all 7,000 square miles
between the Delaware and Hudson Rivers.14 Unlike
other states, which often contained vast tracts of
unincorporated land, New Jersey had no room for its
own towns to expand beyond their original borders.15
This too, contributed to the inability of any city
within the state to expand into a major metropolis, an
additional element we discuss later.
By the commencement of the Civil War, this list had
grown through “subdivision” to 244 municipalities.
Driven by the economy and political dynamics of
evolving industrial and societal patterns, subdivision
continued under a myriad of circumstances into over
560 entities by the 1950s.16 The entities effectively
institutionalized themselves into municipal governments
with a diverse range and mix of services reflecting the
needs and desires of their residents, only periodically
buttressedby(mostlyenlightened)statepolicies.
Not that there was a complete absence of
annexation. Concurrent with rampant proliferation
of municipalities in the late 1800s were much less
well-known efforts aimed at enlarging the state’s
major cities through annexation of all or portions of
surrounding municipalities. Newark, for example,
grew from about 12 square miles to over 24 square
miles, and similar growth occurred in Jersey City,
Paterson, Elizabeth, Trenton, and Camden. Toward
the end of the nineteenth century this counter to
subdivision abruptly stopped, and boundaries of the
state’s older urban centers have remained almost static
since, resulting in older central cities in New Jersey
being among the smallest in the country in relation to
their surrounding metropolitan area.17
Control over local education is often overlooked
as one of many causes of municipal incorporations
(thoughoftennotforparticularlyloftyreasons).
As Republicans sought to equalize some of the
imbalance in education funding that had developed
across the state by 1894, and concurrently
8 Bloustein Local Government Research Center
through an unintended consequence of a poorly
worded statute, dozens of new municipalities were
incorporated/subdivideduntil1897,whenthestate
legislature corrected the statute and allowed future
incorporationsonlywhenspecificallyauthorizedby
the legislature.18
In his widely referenced observations on the topic,
the late Alan Karcher, former State Assembly Speaker,
summarized much of this subdivision activity into one
or more of eight categories, including:
1. Ambition manifested as avarice.
2. Particular economic conditions, unique to
the time, place and circumstance.
3. Actions of a single individual, or, in some
cases, a tightly knit group of like-minded men
engaged in a common venture, involving the
implementationofaverynarrow,personaland/
or provincial agenda.
4. Attempts to impose a policy as to the sale or
consumption of alcoholic beverages.
5. Preservationofexistingtaxbenefitsand/or
the anticipation of a new tax system that held a
special advantage.
6. Unique priorities of areas adjacent to railroad
passenger stations, motivating commuters to
want greater control over the expenditures
oftheirproperty-taxdollarsonthosespecific
priorities.
7. Exercise of the political maxim: divide and
conquer.
8. Use of municipal incorporation as a means
to attain exclusivity and enforce de facto
segregation along ethnic, racial, and economic
lines.19
When combined with the development of the country
that turned New Jersey into an industrial power-
houseduringthefirsthalfofthetwentiethcentury,
this process was without equal in other states. It
effectivelyexplainsthecracksandfissuresofNew
Jersey’s municipal boundaries and the evolution of
our political biology.
PRoPeRty tax aS DRiVeR oF DeCiSioNS
Since colonial times the power to tax property
was the only general tax the legislature gave to
municipal government. While the state held primary
responsibility for funding schools, it did permit
supplemental property-based taxes to be levied for
public education purposes.
Historically, from the perspective of an individual
taxpayer, the property tax was regarded as an
equitable fair tax, and as a downright progressive one;
there was a nexus between household income and
value of the property people owned. The greater the
value of property one owned, the greater the income.
There was a positive relationship between the two: the
value of property was positively correlated with the
owner’s income, and the political process ensured a
reasonable, if occasionally a contentiously set, tax levy.
This model worked from pre-colonial times through
the industrialization of the 1950s. What was
important was that industry and commerce were
located in cities, and it was the cities where most
workers lived. Cities also concentrated commercial
and industrial property wealth to provide the tax base
for a high level of municipal services that served the
wealthy who lived there and the working class that
supported its commerce. Cities had the property
valuestopayforpolice,fire,publichealth,andsocial
services needed in an urban environment. While
there was always grumbling about taxes, the system
generally worked. Until it didn’t.
This system was slowly undermined with the advent of
commuter rail, established at the turn of the twentieth
century and then fully exacerbated by state-funded
toll roads and federally funded interstate highways
constructed in the 1950s and 1960s. As wealthy
executives and the new middle class found they
could leave the densely populated cities and move to
suburbs, property value supporting jobs moved with
them, depriving the cities of the property values and
associated income that supported their services.20 This
draining of value and wealth led to the state’s creation
of a series of municipal aid programs that began
Size May Not Be the issue | November 2014 9
followingtheNewarkandPlainfieldriotsofthelate
1960s, and which continue today.
The challenge to the property tax didn’t end there. With
continuously improved health care in the latter twentieth
century and resultant increase in life expectancy, senior
citizens who previously might have lived with their
families or in nursing homes until they passed away
in their late ’60s or early ’70s were enjoying longer,
healthier lives, often remaining in their homes (with
vacantbedrooms).However,onfixedincomes,they
often lacked the wealth to meet the obligation of rising
property taxes as they did in their prime earning years.
This challenge was partially addressed by state programs
starting in the late 1970s. Programs to mitigate the
burden on income-constrained seniors continue today
through a constantly evolving, though inconsistent,
series of property tax credits, rebate programs, and
income tax policies.
The great diversity in the property tax base of each
municipalitybenefittedthegeographicallywellplaced,
whose municipalities attracted valuable development,
while others suffered with limited diversity, reduced
population, lower-income population, and perceived
greaterpublicfiscalstress.Thiswasparalleledand
complicated by myriad decisions by local elected
officialsondevelopmentapplications(more
subdivisions),publicfacilitiesandinfrastructure
construction, and the political environment with
its challenge to public integrity, all in the country’s
mostly densely populated state. Arguably, the property
tax was ill-equipped to meet these new stresses. But it
has endured.
Additional complicating factors are change and
obsolescence. First seen as a critical public policy
challenge in our cities, industrial developments once
the basis of substantial property tax revenues be-
came obsolete and decayed, leaving in their wake
continuing service support issues for the state’s older
moderate and large cities. The world cannot take what
Trenton no longer makes. This challenge continues
nowasmanyoncethrivingsuburbanofficeparks
search for new purpose and viability as technology
and globalization have restructured the information
age workplace.21
What’S So BaD aBout the PRoPeRty tax?
Economists generally like the property tax. Compared
with other taxes is it easy to administer (taxpayers are
easilyidentifiedthroughpropertyownershiprecords),
relatively simple to collect (assessments are placed,
leviesestablished,ratesstruck,andbillssentout),
provides reliable revenue (as opposed to income taxes,
whicharehighlyelastic),easytoenforcethrough
interest rates on delinquencies and placement of liens,
and is conceptually, at least, economically equitable
(bothhorizontallyandvertically)andprogressive.But
the equity and progressivity rely on the initial theory
of a nexus between the value of property one owns
and income, particularly income growth that is able
to match anticipated increases in costs in taxes, health
care, and other consumer items. While this continual
income growth was once assumed to be a universal
“given” among those still working, it no longer
appears valid as overall wages in New Jersey have seen
little if any growth over the last decade. This reflects
national trends.22
Overtheyears,withthelossoftheincome–
property value nexus, the property tax has become
more regressive, absorbing a greater percentage of
household and business income than in the past. This
is in part due to:
1. Federal policies that encourage home
ownership where income does not have a
positive correlation with costs of ownership.
2. The effect of the mortgage industry abuse of
the 2000s.
3. The impact of the Great Recession on
seniors and their retirement funds, and the
reduced rate of increase and net reduction of
household income (leading to an increase in the
“ the world cannot take what
trenton no longer makes.”

10 Bloustein Local Government Research Center
amount of income consumed by the property
tax)inthemiddleclass.
4. Thelossofpublicconfidenceingovernment
assoundfiscalstewards,asevidencedbythe
various anti-tax movements over the last 40
years.
CoNtRoL oF BuDGetS aND LeVieS – hiStoRy aND iMPaCt oF CaPS
New Jersey state government policy has been
obsessively focused on the property tax over the
decades. It has been the subject of countless policy
reports, at least three blue-ribbon commissions, two
special sessions of the legislature, and a range of
constitutional amendments. For our purposes, it is the
impact these activities had on municipal spending that
warrants examination.
Untilthemid-1970s,municipalelectedofficialswere
responsible only to their voters for spending increases
that were paid by increased property taxes. The public
schoolfinanceconstitutionalcrisisof1975thatled
to the state imposing an income tax in 1976 included
legislation that imposed appropriation limitations
(spendingcap)onmunicipalgovernment.Thelaws
also included a cap on school spending and county tax
levies, subjects not part of this study.
Whileefficaciousatthestart,thearbitrarynatureof
the cap on then 567 very different municipalities, and
various exceptions to the cap, led to a series of study
commissions and amendments over the next 30 years.
Overtime,newdevelopment,growthofpropertyvalues,
andcreativebudgetingbylocalofficialsinthe1990s
and 2000s led to the 1977 appropriations cap having
only a minimal effect on spending control in most
municipalities (with so many diverse places, the impact
ofthecaprangedfromstrongtoweakacrossthestate).
These increases and the start of the Great Recession
led the Corzine administration in 2007 to impose the
firstpropertytaxlevycaponmunicipalities.Setat4
percent,butsubjecttoadetailedandspecificlistof
exceptions, it did control levy increases, but not to
the 4 percent envisioned by the public and legislature;
increases of 7 to 9 percent were the norm, and while
it did lower the rate of increases in many places, in
the face of the recession the limited increases were
generally unacceptable to the public.
Giventhesignificantrevenuechallengesofthe
time, it was easy to ignore that external impacts
on state revenue were actually contributing to
the state’s municipal property tax challenge and
property tax increases. During 2007, for example,
the state distributed more than $1.7 billion in aid
tomunicipalities(table1),upfrom$1.66billion
in 2004. By 2010, aid distributed to municipalities
had decreased by more than $423 million (25.4
percent)toapproximately$1.303billion.State
aid as a percentage of total municipal government
revenue decreased from 15.4 percent to 10.6 percent
of municipal revenue statewide. In effect, close to
TABLE 1 Property Tax and Aid Revenue Summary
2007 2010
Total municipal purpose revenue $11.213 billion $12.282 billion
Unrestricted aid to municipalities $1.727 billion $1.303 billion
State aid as percent of revenue 15.4% 10.6%
Local purpose property tax $5.795 billion $7.156 billion
Property tax as percent of revenue 51.7% 58.3%
Property tax increase offsetting loss of state aid $423,670,657
Percentage of property tax increase offsetting loss of aid 31.13%
Source: New Jersey Division of Local Government Services and authors’ analysis.

Size May Not Be the issue | November 2014 11
one-third of the statewide property tax increases
experienced between 2007 and 2010 could be
attributed to simply offsetting revenue loss from aid
the state itself could not provide.23
Nevertheless, without regard to what contribution
state aid declines may have had on pressure for
replacement municipal revenue, the perceived
failure of the Corzine levy cap led the new Christie
administration in 2010 to propose and shepherd
through the legislature a more restrictive 2 percent
cap, with fewer exceptions. This cap had serious bite
and resulted in a continuation of policies initiated
during the recession years: employee layoffs and
furloughs, service reductions and realignments in
order for municipal governments to meet the new,
lower limits imposed on the revenue side.
Municipalofficialsreceivedunanticipatedlevycaprelief
in 2011, when the administration and legislature came
together to impose a four-year phase-in of mandatory
employeehealthbenefitcontributions.Thiseffectively
reducedemployeefringebenefitcostsovertime(and
reduced employee net income by as much as 8 to 10
percent).Whilethefullstatewideeffectofthephase-
in will take up to eight years, the levy cap and health
benefitreductionsareseentohavehadthegreatest
impact in limiting municipal cost increases. Future
studies in this series will document this claim.
Oneconfoundingaspectofcaplawsisthatthey
canskewspendingdecisions,specificallydistorting
operating and capital spending decisions. Because
capital, lease, and debt service expenses are exceptions
(outsidebothcaps),governmentdecisionmakersmay
tend to use capital spending accounts for items that,
without the imposition of the cap, might be more
appropriately funded as operating expenses. State
law facilitates these decisions that can lead to higher-
than-expected debt service substituting for what
would have otherwise been operating appropriations.
HasanyonenoticedtheproliferationofpoliceSUVs
(allowedasacapitalexpense)inlieuoftraditional
(operatingexpense)patrolvehicles?
the ChaLLeNGe oF DiVeRSe MuNiCiPaLitieS
Newark is not Howell Township, which is not
Brooklawn, which is not Far Hills. The point is that
makingbroadgeneralitiesaboutmunicipalfinance
in the state is an exercise of dubious reliability. Yet
the need for consistent underlying state laws is
complicated by this circumstance.
This diversity of municipal government provides a
great degree of market competition to residents when
looking for a place to live. A range of factors drives
the inherent matrix of costs and municipal services:
diversity of a uniform ratable base; the demographics
of ethnicity, age, and income; proximity to jobs; or
desired residential environment. A given municipality
typically offers both a range and level of services that
differs from neighboring towns. Is refuse collection
provided and, if so, at what level? We have, in effect, a
largenumber(now565)ofcommunitiesfromwhich
households can choose, and location decisions are
made based on an assessment balancing costs against
the range, type, and quality of services provided. New
Jersey’s municipalities do what they do, provide what
they provide, and thus represent a mature market
within which households have considerable choice.24
This very diversity challenges the ability to make
assumptions about why property taxes are “high”
(dependingonhowonedefines“high”)andshould
leadtoinformedskepticismofone-size-fits-all
solutions to the challenge and the use of generalized
data for policymaking decisions, contrary to the
broad brush of state policy usually applied to local
governments. This also ignores the likelihood that a
major component in the post-recession reconstitution
“...Making broad generalities
about municipal finance in the
state is an exercise of dubious
reliability.”

12 Bloustein Local Government Research Center
of the housing market—housing and property value—
will likely adjust for total carrying costs, property
tax inclusive. It is possible, likely even, that property
value, as with any market, will adjust for total carrying
costs vis-à-vis the range and quality of services found
within each of the state’s 565 municipalities.
the ChaLLeNGe oF CoNSoLiDatioN aS a ReMeDy to exCeSSiVe SPeNDiNG
If municipal consolidation is practical there would
have more than two in the last 60 years. Not to say we
haven’t tried. In the last 30 years, Chester Borough
and Township studied it twice and determined it would
not work in part because it would increase school
taxes in the Borough. Sussex Borough and Wantage
Township formally studied it, and voters in Wantage
decided against it. A study commission in Hardyston
Township and Franklin Borough (and for a while
HamburgBorough)lookedatitandfounditwould
increase school costs and taxes and decided against it.
TheconsolidationofVinelandandLandisTownship
in the early 1950s and the recent merging of the
two Princetons (the Township and Borough, after
variousattemptssincethemid-1950s)areoutliers.25
The world was different 60 years ago and, over time,
the Princetons had already become, arguably, “one
community, with two governments.” The voters
realized that and voted to merge (they already shared
13separateservices,hadasinglefiredepartment,
and a regional library, planning board, and board of
education).26
What weighs against consolidation as a solution to
reduce the number of governments in the state?
1. Experience. With multiple studies over the
past 25 years, only one true consolidation took
place after detailed analyses were completed.
Experienceconfirmsthatthedevilisinthe
details, and the challenge to the folk hypothesis
is evident.
2. Cost reduction and efficiency creation.
Whilesuperficiallytheeasiesttoaccomplish,
cost savings may be low-hanging fruit, especially
if potential retirees are not replaced or are
replaced by lower-cost individuals. Such savings
may provide the flexibility to provide additional
services. Hiding in the cost-saving bush,
however, lies the challenge of managing a larger
workforce and enhanced citizen expectations
of a consolidated organization. This implies
the need for additional managers; improved
communication; integrated technology;
potential for greater influence of now larger, or
newly organized labor unions; and increased
costs from aligning collective bargaining
agreements and “harmonizing” salary schedules.
3. Taxes must go down. Taxpayers in both
municipalities need to be convinced that
taxeswillgodown(oratleastnotgoup)for
both, and that implicates costs and property
assessments. When municipalities consolidate,
property values in both must be brought to
market value to meet the state’s constitutional
uniformity requirement. This adjustment
corrects historical distortions that often result
in shifts of levy burden between municipalities,
likely imposing a greater share of the tax levy on
one municipality than the other, and resulting
in tax increases as a result of consolidation.
Often,unachievablesavingswouldbenecessary
to offset the difference. This leaves voters with
the dilemma of voting to increase taxes. In
these cases, experience has shown voter distaste
for this alternative, leading to failure of the
opportunity.
“ if municipal consolidation
is practical there would have
been more than two in the
last 60 years.”

Size May Not Be the issue | November 2014 13
4. Community counts. To the resident, a
municipality is more than its government
structure; it is “my community.” A community
is more than its government; it includes its
social, education, cultural, religious, ethnic,
business, and related components. Lacking
community that overlaps consolidation-
candidate municipal boundaries, the burden
of justifying the concept, even with cost
savings, can fail if the communities are not
aligned. Remarkably, commentators advocating
consolidation often ignore this critical issue.
5. Trust and confidence are critical. If
municipalitieshavesignificantdifferences
(fromanydimension),thereisconcernforone
believing that they will be paying for or taking
on problems of the other. Comfort with the
partner and perception of trust are requisites for
success.
6. Uncertainty is certain. Even if assessments,
community, and cost savings align, and there
is a certain comfort level (as in the Princeton
example),therewillalwaysbeabattle
against fear, uncertainty, and doubt. Lacking
alignment makes this challenge more daunting.
Consolidation is forever, and that requires fear,
uncertainty, and doubt to be minimized.
cost savings, tax reduction, and comfort with the
partner. While consolidation has its place, experience
shows it to be an outlier solution: worthy of study
where appropriate, but given the challenges, not a
universal solution. To advocate or promise otherwise
diminishes the potential for consolidation in the right
place and time, diverting attention from other actions
that can address government costs.
the VaLue oF ShaReD SeRViCeS
Unappreciated by many commentators is that New
Jersey state government has actively promoted and
municipal governments have long participated since
thefirstlawswerepassedinthemid-1970s:the
concept of shared services (which, until a politically
motivated name change in 2006, was known as
“interlocalservices”).Affordedvaryingdegreesof
attention by successive state administrations (studies,
implementationgrantprograms,propertytaxrelief),
shared services are not a new innovation but have
been an integral part of the local administration
management toolbox, and are often implemented
with great success.
Municipalgovernmentshaveengagedinhundreds
of shared services over the decades for a wide
range of services with each other, and with their
county government, boards of education, and local
authorities.Theytaketheformofspecificservices
and are commonly framed as cooperative purchasing,
joint insurance funds, or joint meetings, where
management of a separate entity is shared between or
among partners. A 1991 Department of Community
Affairs report, Directory of Interlocal Activity, listed
more than 800 jurisdictions including municipalities,
school boards, and other various agencies that
participatedinarangeofinterlocal(shared)services.
Insurance pools, shared library services, and regional
sewage authorities represented additional services
provided, and continue to be provided independent
of municipal boundaries.27
Manyoftheseeffortshaveendured;somehavefailed.
But virtually every municipality is engaged in some
form of shared service agreement. It is an important
“...Consolidation...requires a
unique alignment of community,
cost savings, tax reduction, and
comfort with the partner.”
As this study shows, there is no clear data that says a
larger(orsmaller)communityisautomaticallymore
efficientorlessexpensive.Circumstanceanddetails
of each case are unique and mitigate against broad
predictions or sweeping conclusions.
Thus, consolidation, as demonstrated by the
successful Princeton effort but the failure of
others, requires a unique alignment of community,

14 Bloustein Local Government Research Center
According to Jun Choi, “It is a fairly ubiquitously
held premise that the state must continue to advocate
forimprovinglocalgovernmentefficiencythrough
consolidation and shared services.”30 Yet, another
less well distributed position is that separation of
consolidation from the discussion may actually enhance
the likelihood of new or more creative shared services.
A shared service agreement that may fail can be undone,
whereas a consolidation cannot. “Just . . . talking about
the possibility of merging towns creates major tension
and detracts from the likelihood of approving new
SharedServices,”notedDanMasonin2010.31
A 2011 study by Faulk and Hicks provided an analysis
of local government consolidation exploring potential
savingsduetoeconomiesofscaleandefficiency
gains.32 Here the authors focused on Indiana and
uniquechallengesoftheMidwest(population
declines, diminishing manufacturing, and changes
intheemploymentbase,amongothers)aslocal
governments“attempt...tofindwaystolowertheir
spending and increase their accountability.”33
Overall, the literature indicates that there is no
compelling evidence for consolidation, except as war-
ranted on a case-by-case basis. However, the interest
in consolidation has often triggered a review of other
mechanismstoprovidegovernmentservicesefficiently
and effectively.
Focused solely on consolidations, the literature34
providesthefollowingmajorfindings:
• Mostconsolidationstudieshavenotresulted
in consolidation.
• Theresultsinthosethathaveresultedin
consolidationarenotconsistentlybeneficial
management tool, rooted in the age-old decision-
making process of choosing whether to “make or
buy” a service.
But shared services are not a panacea for all that ails
municipal government. A shared service requires
thetrustoftheparties:theconfidenceofasound
agreementwithfiscalandmanagementengagement,
and a “Plan B” that provides protection and a
dispute resolution process in case of dissatisfaction,
a change in policy by a provider or recipient partner
(often generated by a related public event or political
change),achangeinservicedemandorcosts,orthe
inevitable “unintended consequences.”
An additional strategy for service delivery—
outsourcing—mayalsobeidentifiedasalong-
standing cost-reduction tool. Especially encouraged
during the 1990s, this also embodies the same classic
“make or buy” decision all business organizations
face, public agencies included. A statewide study of
outsourcingsome20yearsagoconfirmedthatmany
municipal governments used this additional tool to
control costs in a range of services including printing,
engineering, and legal services, while preferring
shared services in others.28
The continuing advocacy of consolidation seems
to be fairly unbroken, as is the premise that small
municipalitiesareeitherinefficientorunabletosustain
themselves, or both. In 1998 Alan Karcher reiterated
this, absent any supportive data notwithstanding,
noting that about a third of the state’s then 566
municipalities were geographically smaller than two
square miles, and that more than 100 had fewer than
2,000 people (two groups that do not necessarily
depictoverlappingcommunities).Hethenproffered,
most fatally and without supporting data, that
“more than 200 have tax bases so small, narrow, and
unexpandable that their very existence is solely and
exclusively a matter of state aid(authors’emphasis).29
We should remind ourselves that recipients of
emergency aid overwhelmingly are not the small and
the many, but the Trentons, Camdens, Bayonnes, and
Newarks, and that most small municipalities survived
formula state aid cuts in the late 2000s.
“ overall, the literature indicates
that there is no compelling
evidence for consolidation, except
as warranted on a case-by-case
basis.”
Size May Not Be the issue | November 2014 15
Where’s our Boston?
The same subdivision dynamic that has created municipal divorce
rather than municipal annexation has also yielded a political
biology that prevented developing our own “Boston,” i.e., a
prevailing, dynamic central city around which planning and development
might occur, and with the potential economic and political impact to drive
the conversation toward regional services.
Examination of census data makes this point. While Newark, with a
population of 277,140 ranks 32nd largest among “the largest city in
each of the 50 states,” a starkly different picture results when examining
the percentage of each of the 50 states’ populations that reside in their
largest city. On average across the 50 states, almost 12 percent of each
state’s total population resides in its largest municipality. The median,
Boston, with a population of 617,594, is home to 9.4 percent of the
Massachusetts population. By contrast, were Newark the “median,” its
population would exceed 835,000 persons.
New Jersey ranks 48th, Newark serving as home to only 3.15 percent of
the state’s population. Only South Carolina and West Virginia have a lower
proportion of the state’s population residing in its largest city. Newark,
thus, has a lower percentage of the total state population residing in
it than 47 other “largest cities” within the 50 states (see table 13 later
in this report). The absence of a major “central city” is as much of our
subdivision biology as is our mosaic of 565 towns, villages, townships,
cities and boroughs.
This lack of centrality in planning and development was cited by Bruck
and Pinto in their Consolidation Review, noting:
Part of the problem was that New Jersey lacked a major
metropolis. Any of the contenders—Jersey City, Newark, Trenton,
or Camden—were hamstrung by tight municipal boundaries. The
cities were too geographically compact [i.e., high densities] to
become regional powers. Newark and Jersey City combined were
still smaller than the island of Manhattan. . . . Unlike other parts
of the country, there were no unincorporated areas adjacent to
any of these cities, and so they had little room to grow as their
populations surged.36
The growing population of our state’s older cities overwhelmed adjacent
municipalities. Like a human tsunami, the population shifts created
growth and change requiring adjustments to development and services
in the adjacent municipalities. This demonstrates the principle of “we
are the way we are because we got to be that way.” We worry about
“cost savings” and “optimal” size in a political biology that has evolved
to a state where the stakes, having been so decentralized and unique to
the niche, have become marginal at best! We submit that decentralized
marginal savings are almost impossible to corral.
intermsoflong-termfinancialandpolitical
considerations.
• Thefinancialcostsofconsolidationinclude
costs of the transition, of salary and service
harmonization, and of additional facilities,
equipment, and infrastructure (both physical
andadministrative)resultingfromthemerger.
• Thefinancialbenefitsofconsolidation
typically result from a reduction in workforce
or a reduction in facilities or equipment, and
include costs avoided.
• Politicsisamajorobstacletoconsolidation,
but it should be perceived in the broadest terms
toincludetheinterestsofelectedofficials,
employees, and the public, who value local
control.
• Likeanypotentialrestructuring,thecosts
andbenefitsofconsolidationwillbespecificto
the conditions and issues of the governments
that are included.
• Thecostsandbenefitsshouldbeassessed
with recognition of the results that can be
achieved realistically.
Do We ReaLLy haVe too MaNy GoVeRNMeNtS?
Discussions concerning whether there are too many
municipalities in New Jersey seem to be as old as
sightings of the Jersey Devil. Almost 80 years ago, a
Princeton University report noted:
At the close of the year 1860 there were 244
municipalities and 21 counties in the state of
New Jersey. Since the creation of the state’s
youngest county, Union, in 1857, the number
of counties has remained constant. The increase
in municipalities, however, has been the result
of steady growth. New political units have
been created every year from 1860 to 1930
with only two exceptions, 1862 and 1877.
During the seventy-year period, an average of
4.56 new incorporations have occurred every

16 Bloustein Local Government Research Center
year. Beginning with 1931, this epidemic of
municipal divorces practically ceased, and only
oneincorporation(1933)hasbeeneffected
since that year. . . . While this growth in
thenumberofmunicipalities[anetof320
municipalitiesfrom1800to1936]mayseem
excessive, it has not kept pace with the growth
of population.35
Duringthesameperiod(1860through1934),
municipal incorporations increased 231 percent
while the state’s population increased more than 600
percent during the same time frame. The author went
on to observe that “In view of these facts, it might be
said that if New Jersey has ‘too many’ municipalities
in 1936, the same situation existed a generation or
moreago[i.e.,nowmorethan100yearsago].”
aRe We JuSt “DeNSeLy DeVeLoPeD” oR too SMaLL?
While New Jersey is a small state geographically, it
is diverse and complex from almost any dimension
one might consider. A corollary to the “too many,
too small” government argument has been that we
havetoomanygovernments,period.Morethan
anyone else, even. Actually, these arguments are
perhaps potentially as false as the small government
inefficiencyone.
The core of the folk hypothesis is that “Jersey has
more municipalities per square mile than any other
[state]inthecountry.”37 That is factually correct.
An appropriate corollary, however, is that New Jersey
has more people per square mile than any other
state. According to the 2010 census, with 1,210
persons per square mile, we are the most intensely
developed state, being approximately 20 percent more
denselysettledthanRhodeIsland(number2),anda
staggering 40 percent more densely developed than
thethirdmostdenselydevelopedstate,Massachusetts!
Asking the question about having too many
governments from a different perspective may
yield an entirely different conclusion. How many
“general governments” does New Jersey have on a
per capita basis? The answer is: surprisingly few. In
fact, New Jersey ranks 34th in the number of general
governments per capita. When all “special districts”
(fire,water,sewer,andsoon)arealsoconsidered,
TABLE 2 Number and Ranking of Government Frequency
Governments per
10,000 population
Number General
Purpose per
10,000
Number Special
Purpose per
10,000
Total Government
Units per 10,000
Rank General
Government
Rank Special
Government
Rank Total
Government
Units
New Jersey 6.7 8.6 15.2 34 37 36
New York 8.2 9.5 17.7 28 35 35
Pennsylvania 20.6 17.9 38.5 15 24 22
Delaware 6.6 30.6 37.2 36 16 23
United States 12.5 16.1 28.6
Source: U.S. Census of Governments, 2012; https://www.census.gov/govs/cog2012/
“ Discussions concerning
whether there are too many
municipalities in New Jersey
seem to be as old as sightings of
the Jersey Devil.”

Size May Not Be the issue | November 2014 17
NewJerseyranks36thofthe50states.Specifically,
about two-thirds of the states have more local
governmentand/ortotaltaxingdistrictspercapita
than New Jersey, with the neighboring states all
having more government per person than New Jersey
(table2).
But at the end of the day, each state reflects its own
evolution; they are the way they are because they got
that way. While the data may be fodder to media and
policy commentators, ultimately it does not provide
any answers.
hoW MuCh DoeS MuNiCiPaL GoVeRNMeNt iN NeW JeRSey SPeND?
Data for each New Jersey municipal budget was
obtained through a request to the New Jersey
Department of Community Affairs, Division of
LocalGovernmentServices,forfiscalyears2011and
2012.38 The database for both years includes detail
for each municipality on a range of major municipal
revenues,aswellasappropriationtotalsinspecific
categories consistent with reporting requirements; the
financialdatafor2011forallthestate’s[then]566
municipalities are summarized in table 3. During 2011,
spending of municipal government in New Jersey
represented approximately a $12.52 billion enterprise.
Additional descriptive variables were used in the
analyses from a variety of sources including the 2010
decennial census, the 2011 American Community
Survey (data including population, density, average
mean and median income by municipality, housing
vacancyrates,percentageofvariousethnicities/races,
percentage of children, the number of households, and
soon),anddataprovidedbytheNewJerseyDivision
of Local Government Services. Included among the
lattersetweretheaverage(assessedandequalized)
residential and total values in each municipality, the
average amount of property taxes paid, the percentage
of total property value in housing, the amount of value
exempt from taxation, and the number and type of
parcels, among other measures.
If the folk hypothesis is correct—that smaller
municipalities are inherently more costly—there
TABLE 3 Total Raised and Spent in New Jersey for Municipal Government – 2011a
Appropriations
Debt service Reserve for uncollected taxes General appropriations TOTAL APPROPRIATIONS
Amount Percentage
$1,096,415,943 $584,355,686
10,844,199,650 $12,524,971,279
8.75% 4.67%
86.58% 100.00%
Amount Percentage
Revenue
Local property tax (current) Municipal fund balance resources Delinquent local property tax collections Local miscellaneous revenue State aid Other revenue (i.e. grants) with offsetting appropriations TOTAL REVENUES
$7,437,008,418
$772,463,100 $337,299,916
$1,042,874,723 $1,511,667,421 $1,423,657,701
$12,524,971,279
59.38%
6.17% 2.69% 8.33%
12.07% 11.37%
100.00%Note: a. Data includes support of local government and fire districts, but exclude library and other minor revenue sources which are also omitted from the appropriation sum.
Source: New Jersey Division of Local Government Services and authors’ analysis.

18 Bloustein Local Government Research Center
should be a measurable link between the size of
government and the cost of government. How to
measure this can itself be an extended discussion,
as we know that the possible range of what local
governments provide varies widely. Still, one must
consider New Jersey’s governmental landscape as
mature and stable. Unlike many other states, New
Jersey did not develop through the incorporation of
unincorporated areas; it developed effectively through
the subdivision of larger governments into smaller
ones.Populationgrowthoccurred,andlocalofficials
responded to public and private demands for a wide
range and depth of services; or put another way, local
governments in New Jersey have come to do what
they do.
DeFiNiNG the CoSt oF LoCaL GoVeRNMeNt: the DePeNDeNt VaRiaBLe
Exploring the issue of local government cost requires
a standardized measure on which to compare
municipalities across the state. For the purposes of
this study we test a single dependent variable: the per
capita cost of municipal government. Costs calculated
on a per capita basis have the advantage of being
easily understood. People generally generate costs—a
measurement of demand for services. Further, this
measure can be viewed as a measure that is fairly
equivalent to one used in calculating education costs
(representing a much larger portion of the total
propertytaxliabilityforpropertyowners),i.e.,the
costperpupil.Othermeasureshavebeenused,such
as the cost of municipal government per residential
line item.39 We considered but rejected measures that
relate to property tax rates as they directly correlate
to property values in a municipality. They can distort
comparisons where similar municipalities may have
similar costs, but their tax rates vary solely due to
property values. We do not believe this contributes to
understanding the folk hypothesis.
Costs, as measured by total appropriations made
by governments, have the advantage of measuring
not the decisions of what to do but rather are an
objective measure of the costs of doing business
oncethoseserviceshavebeenidentified.Thisstudy
accepts as given that the range of services between one
municipality and another may differ but that the cost of
whatever each municipality does can be determined and
analyzed against other municipalities, as each of these
municipalities represents market decisions by citizens
or businesses: How close to my work? How much can I
afford? What is the range of services? Are some services
in the property tax or user based (garbage collection
bestrepresentsthis)?Aretherepaidorvolunteerfire
services? What are the property taxes? (Here, property
valuesplayarole.)
Recognizing the variation in services, this study needed
todefineareasonableandbroadlyunderstoodmeasure
of “cost” upon which to base our analyses. In order to
normalize some of the variation in service choices and
costs,ourdefinitionof“costofmunicipalservicesper
capita”(costpercapita)involvedtwomodifications
beyond simply taking the “total appropriations” in each
municipality and dividing by the population.
Thefirstadjustmentdeductsthe“reservefor
uncollected taxes” (also known as an “allowance for
baddebts”)fromtotalappropriations.The“reserve”
is a statutorily required, non-spending appropriation.
It ensures that the municipality, as tax collector for
the county and public school share of tax levy in its
jurisdiction, raised the full tax levy necessary for all
taxing jurisdictions, despite the fact that some taxpayers
will not pay their taxes on time. In short, the burden
for delinquent tax payment falls entirely on municipal
government. In times of extraordinary change such as
the housing market collapse, followed by loss of billions
in value due to Superstorm Sandy, it is municipal
government that is responsible for absorbing the bulk
of shortfall in property tax collection to ensure that the
schoolsandcountyremainfiscallywhole.
The second adjustment takes into account the unique
institutionof“firedistricts”inapproximately100
municipalities. In these municipalities, taxpayers fund a
separate service through a separately elected governing
body. Some municipalities have multiple districts with
different tax rates in the same municipality. Since public
safety typically represents more than marginal costs, the
Size May Not Be the issue | November 2014 19
totalfiredistrictbudget(s)foreachmunicipalitywith
oneormorefiredistrictswasaddedintotheadjusted
total appropriation, as is the case for municipalities
providingfireprotectionwithinthemunicipalbudget.
Thismodificationeffectivelyensuresthatfirecosts,to
the extent they are voter controlled, are represented
in all municipal budgets to the extent they exist at all.
The resulting calculation of cost (total appropriations,
lessreserve,plusfirecostsifoutsidethemunicipal
budget, was divided by the 2010 population to
determine the net cost per capita for municipal
services.Costspercapita,asdefined,wereanalyzed
for both 2011 and 2012.
Thus, returning to the primary purpose of the
study, this report focuses on what might be simply
stated as “The cost per capita of government in
larger municipalities should be lower than the cost
per capita of government in small communities.”
Morespecifically,byextension,ifwefindthatlarger
municipalities indeed have lower per capita costs, we
might then have preliminary support for economies
of scale and consolidation. If true, it supports the
folk hypothesis represented by generations of elected
stateofficialsandmediacommentators.Ifnot,it
opens the door for fresh discussion and debate on
how to control municipal property taxes if not by
consolidation.
Though New Jersey has had decades of debate
and discussion around this issue and the “need”
for consolidation, whether real or perceived, little
objective evidence has emerged other than opining
that the reason for New Jersey’s high property tax is
the size and number of the state’s local government
units. We advance the premise that the high property
tax challenge might not be caused by the large
number and small size of the state’s municipalities,
but rather by other socioeconomic factors including
location, diversity, income, density, and expectations.
This leads to a new discussion on how to “solve” the
property tax dilemma.
Wealsoviewthisreportasafirstofaseriesofanalyses
that will seek to further our understanding of the
challenges of providing government services in the
twenty-firstcentury.Asstatedinanearlieranalysis
sponsored by the Council of New Jersey Grantmakers,
“Is the state—and are the government institutions
createdinthe19thcentury—efficient,effective,
affordable and capable of meeting the needs and
requirements of New Jersey’s citizens in the 21st
century?”40
These questions remain paramount, but the answers
require sound analyses of what we are doing and how
we are doing it. Future research will need to expand
beyond determining costs and explore the revenue
sideoftheequation.Mightitbe,forexample,that
one reason we have high property taxes is not because
governmentisoperatinginefficiently,butbecause,vis-
à-vis patterns of revenue in other states, our revenue
mix is less robust and overly dependent upon one
majorsource?Orhaveotherstatepoliciescreated
cost dynamics that resulted in unanticipated cost
consequences?

20 Bloustein Local Government Research Center
Researchfindingsstronglysuggestthatourfolk
hypothesis, the hypothetical link between “too
many”smallgovernmentsthatareinefficientand
costly, resulting in “high” property taxes, must be
seriously reconsidered. In many cases, data that is
not fully understood can and may lead to inaccurate
conclusions. Cost per capita of municipal government
in New Jersey is an example of this, as we found and
will demonstrate.
Onefinaldisclosurepriortodiscussingourresults.As
isthecasewithmostsocialandfinancialexplorations,
onecanalwaysfindoutliers.Mostinformedobservers
would agree that aside from all sorts of other unique
distortions, there are four New Jersey municipalities
that may be characterized as extreme outliers.
Teterboro,PineValley,Walpack,andTavistockeach
representsuchextremedefinitionsofmunicipalities
as to warrant exclusion, lest results be distorted.41
Accordingly, virtually all of our analyses exclude these
four and engage 562 of the state’s 566 municipalities
extant at the time of the analysis.42
Each of 562 municipalities was initially assigned to
groups by population, and the average cost per capita
for each population group was calculated. The results,
illustratedinfigure1below,wouldseemtoreinforce
the long-held premise that the largest grouping (72
municipalities),withpopulationsbelow1,600,have
an average municipal cost per capita of $2,880, slightly
more than twice that of the unweighted average of the
remaining nine groups, of $1,322 per capita.
This would confer a high degree of veracity to
the conventional wisdom supportive of the small-
government-inefficiencypremise.Surprisingly,
though, the correlation between municipal cost
per capita and population size was not statistically
significant(r=-.067,significancelevelof.113,
n=562).
FiGURE 1 Average Cost per Capita by Population Group
(562 municipalities)
Source: New Jersey Division of Local Government Services; analysis by authors.
the analysis
Size May Not Be the issue | November 2014 21
We contend that such prior rough “correlations,”
where small-population municipalities appear to
have higher average per capita costs, have done
much to advance and sustain the premise that small
municipalities have disproportionately high costs.
Since most municipal revenue in New Jersey comes
from property taxes, the consolidation of these
small, high-cost municipalities would advance at
least in part a solution to the high property tax
problem.
We argue that this type of gross overview
oversimplifiesthecharacterofthestate,andin
particular ignores a major unique category of
municipalities in New Jersey: resort communities. As
a coastal state, a valued New Jersey resource is, in fact,
its shore communities. That said, one confounding
characteristic of our resort communities is that their
year-round populations misrepresent who they are
and what they do.
Off-seasonalhousingvacanciesarehigh;year-round
populations, on which per capita measures (such as
crimerates)arebased,areexceptionallylowvis-à-vis
the built infrastructure and the improvement base
upon which resources may be generated. Further,
in many of these communities, there is an ample tax
base that, for much of the year, generates little or no
service demand.
the ReSoRt CoMMuNity FaCtoR iN DiStoRtiNG CoSt oF GoVeRNMeNt iN NeW JeRSey43
In exploring the relationship between population
and per capita costs, it became obvious that resort
communities would need to be examined in greater
detail to determine the degree to which they are
like “other” New Jersey communities, or whether
they represent a unique group of municipalities that
contribute distorting views of costs and services. We
conclude without reservation that resort communities
are indeed a unique class of municipalities that greatly
distort the analysis of local government costs.
Resortcommunitiesaresufficientlyandsignificantly
different from all other 513 municipalities on a wide
range of indices that one has no other choice but to
conclude that, on any per capita or other comparative
basis, they must be treated as a separate and distinct
group.44
The Atlantic coast of New Jersey is home to
approximately 50 municipalities (almost 9
percentofallmunicipalitiesinthestate).Risking
oversimplification,mostofthesecommunitiesare
typically characterized by year-round populations
thatareone-thirdtoone-fifthoftheir“full-service”
seasonal populations for which infrastructure exists.
The Borough of Longport, for example, has 1,595
residential units with only 531 year-round households
(representingapopulationof895).Two-thirdsof
theproperty(residentialinfrastructure),andcost
of government, are predominantly vacation or
investment homes that remain vacant for a good
portion of the year. Further, many municipalities
on Long Beach Island and south also have a
comparatively high percentage of property owners
reporting their primary residence as out of state.45
Since many of these municipalities tend to be among
the state’s smaller communities (although the range in
populationsizeisfairlylarge)andtheyconcurrently
showmanysignificantdifferencesfrommainland
communities (see table 4, summarizing a range of
factors)inthe“costpercapita,”theyinappropriately
contribute an overall, and mistaken, impression that
small is more costly. Hence, including these unique
coastal towns in an analysis of municipal costs as part
of the larger group of year-round communities is
bothinappropriateandsignificantlydistortsresults.
Accordingly,ouranalysesfirstexploredresort
“...Resort communities are indeed
a unique class of municipalities
that greatly distort the analysis of
local government costs.”

22 Bloustein Local Government Research Center
TABLE 4 Comparison of Coastal Resort Communities to All Other Municipalities
Resorts (49) Others (513)
T-test Significance
(2-tailed)
Simple in-cap cost per capita $ 3,602 $ 938 0.000
Percent appropriations in-cap 74.27% 72.55% 0.177
Equalization ratio 96.04% 83.35% 0.000
Property tax as % of total municipal revenue 62.90% 57.57% 0.022
Percentage of value in residential items 87.55% 78.27% 0.000
Vacancy rate 52.567% 6.249% 0.000
Ratio of housing units to residential line items 1.192 1.387 0.056
Debt as percentage of appropriations 10.94% 8.81% 0.008
Fund balance as percentage of total revenue 9.50% 10.33% 0.531
Delinquent tax as % total revenue 2.96% 4.36% 0.005
Local revenue as % total revenue 11.39% 6.18% 0.000
State aid percentage of revenue 5.75% 10.68% 0.000
Reserve as percentage of appropriations 5.85% 7.96% 0.008
Effective tax rate 1.12% 2.33% 0.000
Value per square mile (in millions) $1,120.00 $306.17 0.000
Average residential line item value $741,510 $320,370 0.000
Average residential taxes paid $6,960 $7,789 0.082
Base cost per $100 of value $0.659 $1.766 0.141
Municipal tax as % of total tax levy 34.94% 25.03% 0.000
Percentage children 19.02% 23.59% 0.000
General crime rate 56.93 18.61 0.000
Major crime rate 2.686 1.652 0.008
Percentage white 90.87% 79.52% 0.000
Percentage black 3.33% 8.13% 0.008
Percentage Hispanic 7.16% 11.46% 0.021
Percentage Asian 1.35% 6.07% 0.000
Diversity index 0.2109 0.3757 0.000
2010 Density 2,263.14 3,541.13 0.105
2010 Population 5,402 16,590 0.001
Per capita cost including fire districts, less reserve
for uncollected taxes
$4,760 $1,210 0.000
Median household income $67,859 $84,569 0.000
Mean household income $98,604 $105,782 0.294
Debt per capita 691.83 113.26 0.000
Land area 6.795 13.655 0.011
Source: Data is 2011 unless other noted: Abstracts of Ratables, Line Items of Ratables; American Community Survey; 2011 Crime in New Jersey (NJ State Police); and 2010 Census.
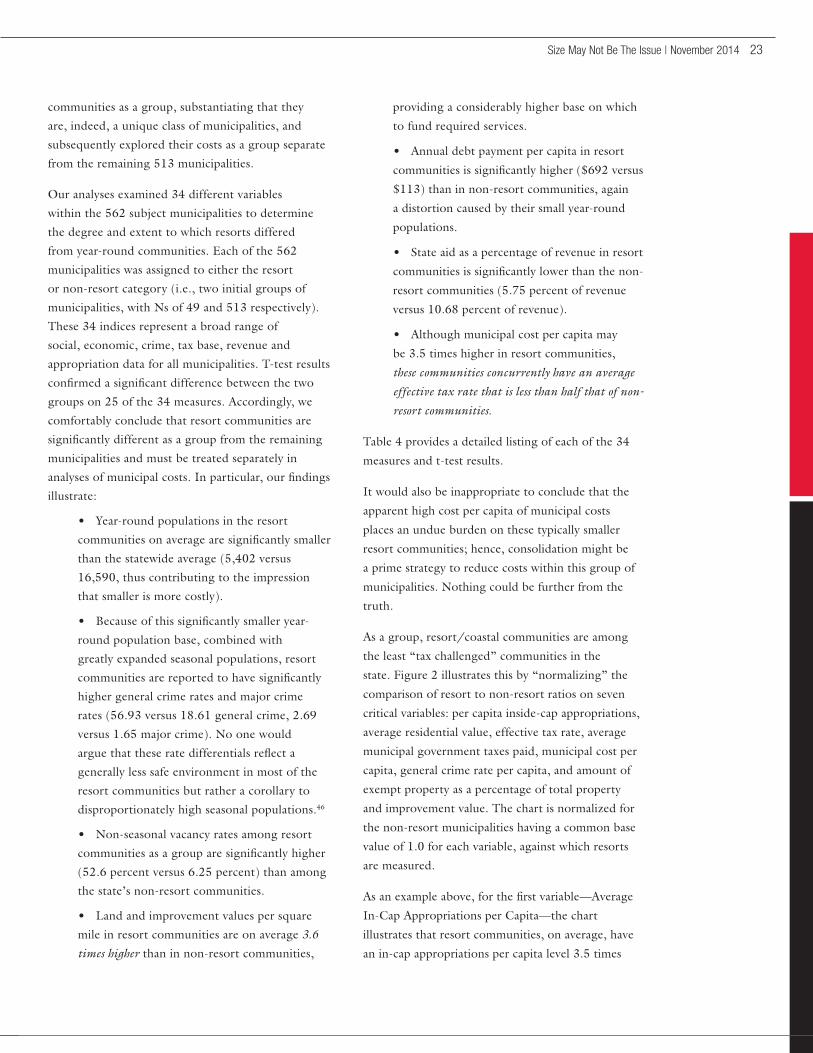
Size May Not Be the issue | November 2014 23
TABLE 4 Comparison of Coastal Resort Communities to All Other Municipalities
Resorts (49) Others (513)
T-test Significance
(2-tailed)
Simple in-cap cost per capita $ 3,602 $ 938 0.000
Percent appropriations in-cap 74.27% 72.55% 0.177
Equalization ratio 96.04% 83.35% 0.000
Property tax as % of total municipal revenue 62.90% 57.57% 0.022
Percentage of value in residential items 87.55% 78.27% 0.000
Vacancy rate 52.567% 6.249% 0.000
Ratio of housing units to residential line items 1.192 1.387 0.056
Debt as percentage of appropriations 10.94% 8.81% 0.008
Fund balance as percentage of total revenue 9.50% 10.33% 0.531
Delinquent tax as % total revenue 2.96% 4.36% 0.005
Local revenue as % total revenue 11.39% 6.18% 0.000
State aid percentage of revenue 5.75% 10.68% 0.000
Reserve as percentage of appropriations 5.85% 7.96% 0.008
Effective tax rate 1.12% 2.33% 0.000
Value per square mile (in millions) $1,120.00 $306.17 0.000
Average residential line item value $741,510 $320,370 0.000
Average residential taxes paid $6,960 $7,789 0.082
Base cost per $100 of value $0.659 $1.766 0.141
Municipal tax as % of total tax levy 34.94% 25.03% 0.000
Percentage children 19.02% 23.59% 0.000
General crime rate 56.93 18.61 0.000
Major crime rate 2.686 1.652 0.008
Percentage white 90.87% 79.52% 0.000
Percentage black 3.33% 8.13% 0.008
Percentage Hispanic 7.16% 11.46% 0.021
Percentage Asian 1.35% 6.07% 0.000
Diversity index 0.2109 0.3757 0.000
2010 Density 2,263.14 3,541.13 0.105
2010 Population 5,402 16,590 0.001
Per capita cost including fire districts, less reserve
for uncollected taxes
$4,760 $1,210 0.000
Median household income $67,859 $84,569 0.000
Mean household income $98,604 $105,782 0.294
Debt per capita 691.83 113.26 0.000
Land area 6.795 13.655 0.011
Source: Data is 2011 unless other noted: Abstracts of Ratables, Line Items of Ratables; American Community Survey; 2011 Crime in New Jersey (NJ State Police); and 2010 Census.
communities as a group, substantiating that they
are, indeed, a unique class of municipalities, and
subsequently explored their costs as a group separate
from the remaining 513 municipalities.
Ouranalysesexamined34differentvariables
within the 562 subject municipalities to determine
the degree and extent to which resorts differed
from year-round communities. Each of the 562
municipalities was assigned to either the resort
or non-resort category (i.e., two initial groups of
municipalities,withNsof49and513respectively).
These 34 indices represent a broad range of
social, economic, crime, tax base, revenue and
appropriation data for all municipalities. T-test results
confirmedasignificantdifferencebetweenthetwo
groups on 25 of the 34 measures. Accordingly, we
comfortably conclude that resort communities are
significantlydifferentasagroupfromtheremaining
municipalities and must be treated separately in
analysesofmunicipalcosts.Inparticular,ourfindings
illustrate:
• Year-roundpopulationsintheresort
communitiesonaveragearesignificantlysmaller
than the statewide average (5,402 versus
16,590, thus contributing to the impression
thatsmallerismorecostly).
• Becauseofthissignificantlysmalleryear-
round population base, combined with
greatly expanded seasonal populations, resort
communitiesarereportedtohavesignificantly
higher general crime rates and major crime
rates (56.93 versus 18.61 general crime, 2.69
versus1.65majorcrime).Noonewould
argue that these rate differentials reflect a
generally less safe environment in most of the
resort communities but rather a corollary to
disproportionately high seasonal populations.46
• Non-seasonalvacancyratesamongresort
communitiesasagrouparesignificantlyhigher
(52.6percentversus6.25percent)thanamong
the state’s non-resort communities.
• Landandimprovementvaluespersquare
mile in resort communities are on average 3.6
times higher than in non-resort communities,
providing a considerably higher base on which
to fund required services.
• Annualdebtpaymentpercapitainresort
communitiesissignificantlyhigher($692versus
$113)thaninnon-resortcommunities,again
a distortion caused by their small year-round
populations.
• Stateaidasapercentageofrevenueinresort
communitiesissignificantlylowerthanthenon-
resort communities (5.75 percent of revenue
versus10.68percentofrevenue).
• Althoughmunicipalcostpercapitamay
be 3.5 times higher in resort communities,
these communities concurrently have an average
effective tax rate that is less than half that of non-
resort communities.
Table 4 provides a detailed listing of each of the 34
measures and t-test results.
It would also be inappropriate to conclude that the
apparent high cost per capita of municipal costs
places an undue burden on these typically smaller
resort communities; hence, consolidation might be
a prime strategy to reduce costs within this group of
municipalities. Nothing could be further from the
truth.
Asagroup,resort/coastalcommunitiesareamong
the least “tax challenged” communities in the
state. Figure 2 illustrates this by “normalizing” the
comparison of resort to non-resort ratios on seven
critical variables: per capita inside-cap appropriations,
average residential value, effective tax rate, average
municipal government taxes paid, municipal cost per
capita, general crime rate per capita, and amount of
exempt property as a percentage of total property
and improvement value. The chart is normalized for
the non-resort municipalities having a common base
value of 1.0 for each variable, against which resorts
are measured.
Asanexampleabove,forthefirstvariable—Average
In-Cap Appropriations per Capita—the chart
illustrates that resort communities, on average, have
an in-cap appropriations per capita level 3.5 times
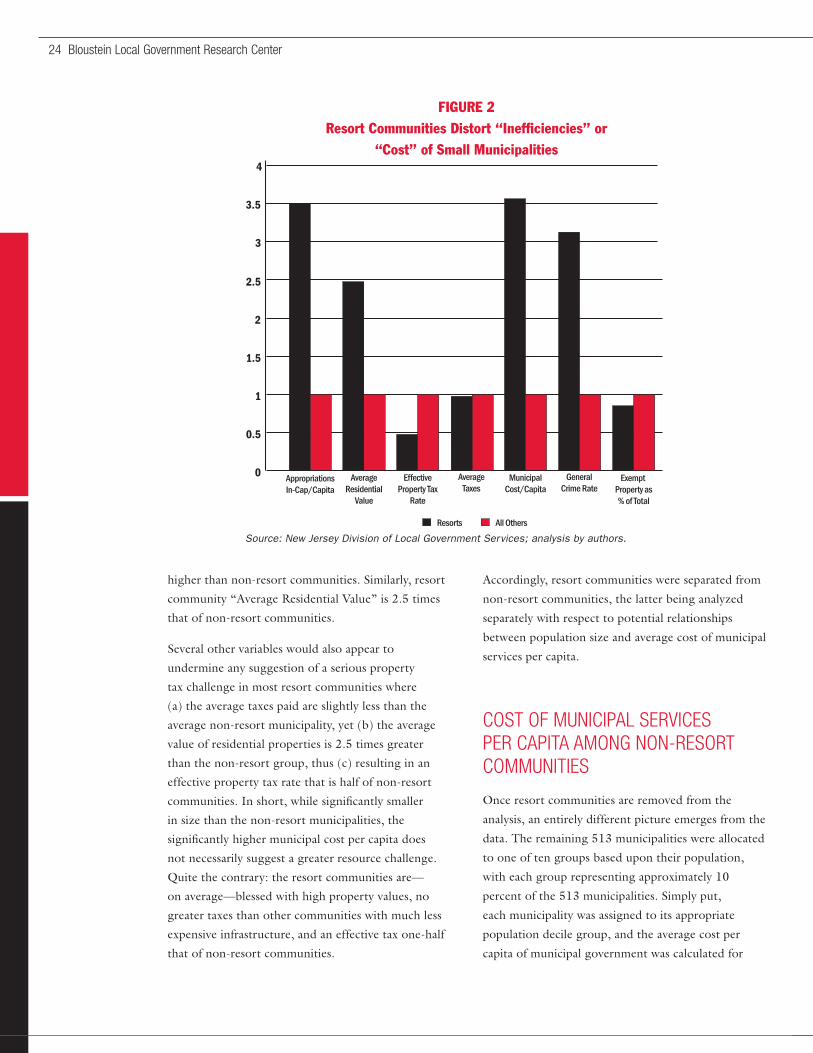
24 Bloustein Local Government Research Center
higher than non-resort communities. Similarly, resort
community“AverageResidentialValue”is2.5times
that of non-resort communities.
Several other variables would also appear to
undermine any suggestion of a serious property
tax challenge in most resort communities where
(a)theaveragetaxespaidareslightlylessthanthe
averagenon-resortmunicipality,yet(b)theaverage
value of residential properties is 2.5 times greater
thanthenon-resortgroup,thus(c)resultinginan
effective property tax rate that is half of non-resort
communities.Inshort,whilesignificantlysmaller
in size than the non-resort municipalities, the
significantlyhighermunicipalcostpercapitadoes
not necessarily suggest a greater resource challenge.
Quite the contrary: the resort communities are—
on average—blessed with high property values, no
greater taxes than other communities with much less
expensive infrastructure, and an effective tax one-half
that of non-resort communities.
Accordingly, resort communities were separated from
non-resort communities, the latter being analyzed
separately with respect to potential relationships
between population size and average cost of municipal
services per capita.
CoSt oF MuNiCiPaL SeRViCeS PeR CaPita aMoNG NoN-ReSoRt CoMMuNitieS
Onceresortcommunitiesareremovedfromthe
analysis, an entirely different picture emerges from the
data. The remaining 513 municipalities were allocated
to one of ten groups based upon their population,
with each group representing approximately 10
percent of the 513 municipalities. Simply put,
each municipality was assigned to its appropriate
population decile group, and the average cost per
capita of municipal government was calculated for
FiGURE 2 Resort Communities Distort “inefficiencies” or
“Cost” of Small Municipalities
Source: New Jersey Division of Local Government Services; analysis by authors.

Size May Not Be the issue | November 2014 25
each population size group. The results are illustrated
infigure3.
A cursory look at average costs, particularly in
contrasttothetotaldistributionpresentedinfigure
1, yields surprisingly very little difference between the
average per capita cost among small municipalities
($1,271fortownsfewerthan1,900persons)andthe
average per capita cost among the largest group of
municipalities($1,340fortowns40,601orlarger).
Municipalitieswithpopulationsofbetween3,601
and 5,150 persons represent the lowest per capita
cost group, with municipal per capita costs averaging
$1,092.
A series of t-tests were performed to determine
whether any of these seemingly minor variations are
significantand,ifso,towhatextent(table5).We
determined that as an initial exploration, comparing
the mean and variance of each population size group
to every other would potentially yield the greatest
insight into patterns. Hence, all ten groups were
analyzed against all other groups, yielding 45 sets
of results. The folk hypothesis would suggest that
the average cost per capita would be lower among
municipalities that were larger.
Statisticalsignificanceemergedinonlythefollowing
instances:
1. Innocasewasthereastatisticallysignificant
difference in the average per capita municipal
costasexpected.Specifically,no“larger”
populationgrouphadastatisticallysignificant
lower mean per capita cost than any smaller
population size group.
2. Statisticallysignificantdifferencesin
average costs were, however, found in four
instances, and in each of these four instances,
the relationship was contrary to conventional
FiGURE 3a Cost of Municipal Government Per Capita: 2011
Note: a. Population size categories in figure 3 and subsequent differ slightly from figure 1 because resort communities are placed into
a separate grouping, and the remaining 513 municipalities assigned to deciles.
Source: New Jersey Division of Local Government Services; analysis by authors.

26 Bloustein Local Government Research Center
In addition to the analyses of average cost per capita by
population size group, an extended number of correlations
were run in an effort to unmask possible reasons for these
findings. Also, as mentioned earlier, the ungrouped correlation
among all 562 municipalities did not yield a significant
correlation between municipal size and cost per capita.
A two-tailed Pearson r correlation was run between the per
capita cost of government against more than 60 variables
representing a range of budgetary, property value, economic,
and demographic data, results of which are summarized in
table 6 for variables with a statistically significant correlation
with the per capita cost of local government. This analysis was
performed on the 513 non-resort municipalities, with results
providing some additional insight, including the absence of
municipal population being significantly correlated to cost per
capita.
Several of the variables are worth comment. There is a clear
cluster of economic well-being variables: mean and median
household income, average residential value, ratable value
per square mile, net equalized value per capita, all positively
correlated with cost per capita. Municipalities with higher
income, higher equalized value, and higher residential
value would appear to be correlated with higher per capita
costs. Density, multiunit residential characteristics (ratio
of households to residential line items), and crime indices
also are positively correlated with higher per capita cost
municipalities.
TABLE 5 T-test Analyses (Means in Upper Right, Variance in Lower Left)
Each Population Size Group Analyzed against All Other Population Size Groups
Means (Upper right)
Variances (Lower left)
(1)
Up to
1,900
(2)
1,901 to
3,600
(3)
3,601 to
5,150
(4)
5,151 to
7,050
(5)
7,051 to
8,600
(6)
8,601 to
11,450
(7)
11,451 to
15,930
(8)
15,931 to
23,510
(9)
23,511 to
40,600
(10)
40,601 to
277,140
Population Size Group Average $1,271 $1,217 $1,092 $1,200 $1,118 $1,129 $1,290 $1,241 $1,217 $1,340
(1) Less than 1,900 NO NO NO NO NO NO NO NO NO
(2) 1,901-3,600 NO NO NO NO NO NO NO NO NO
(3) 3,601-5,150 NO NO NO NO NO NO NO NO INVERSE
(4) 5,151-7,050 NO NO NO NO NO NO NO NO 0.135
(5) 7,051-8,600 NO NO NO NO NO NO NO NO INVERSE
(6) 8,601-11,450 YES YES YES YES YES INVERSE NO NO INVERSE
(7) 11,451-15,930 YES YES NO NO NO NO NO NO NO
(8) 15,931-23,510 YES NO NO NO NO NO NO NO NO
(9) 23,511-40,600 YES YES NO YES YES NO NO NO NO
(10) 40,601-277,140 YES NO NO NO NO NO NO NO YES
Notes: (1) Yes indicates significance at 0.05 or better at expected level, (2) INVERSE = a significance level equal to or better than 0.05 but also where the
smaller population size group has a lower average cost per capita than the larger municipal population group, i.e. opposite what would be expected.
Source: New Jersey Division of Local Government Services; analysis by authors.
TABLE 6 Pearson Correlations (2-tailed test), n=513
Significance at 0.000 unless otherwise indicatedPositive correlations
Debt per capita 0.458
Net equalized value per capita 0.367
Ratable value per square mile 0.277
Percentage exempt property 0.276
Average residential value 0.274
Mean household income 0.266
Vacancy rate 0.225
Median household income 0.186
2010 Density 0.164
Major crime rate (0.001) 0.147
Current property tax as percentage of revenue (0.023) 0.101
Ratio of household to residential line items (0.039) 0.091
General crime rate (0.042) 0.090
Negative correlations
Fund balance as a percentage of revenue (0.020) -0.103
Percentage white -0.160
Effective tax rate -0.175
Percentage value in residential -0.43
Reserve as a percentage of appropriations -0.411
Delinquent taxes as a percentage of revenue -0.436
Selected variables without a significant correlation
Debt as a percentage of appropriations
State aid as a percentage of revenue
Equalization ratio
Average taxes
2010 Population
Percentage black
Percentage children under 16
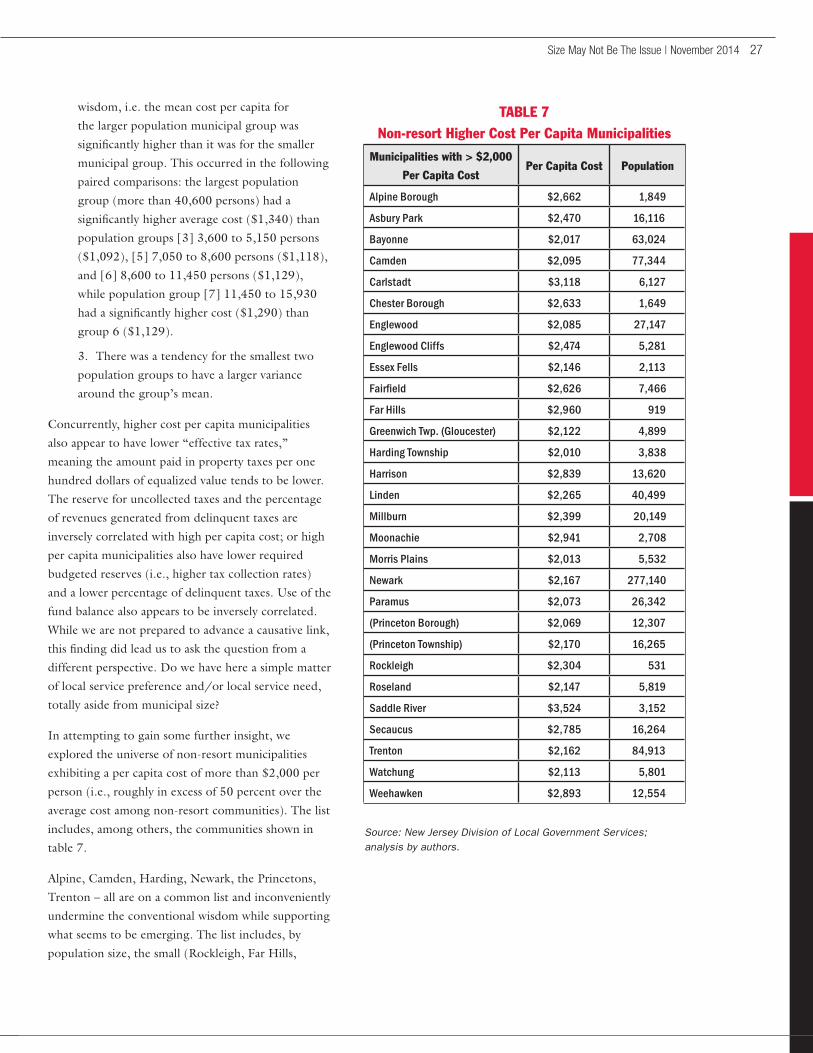
Size May Not Be the issue | November 2014 27
wisdom, i.e. the mean cost per capita for
the larger population municipal group was
significantlyhigherthanitwasforthesmaller
municipal group. This occurred in the following
paired comparisons: the largest population
group(morethan40,600persons)hada
significantlyhigheraveragecost($1,340)than
populationgroups[3]3,600to5,150persons
($1,092),[5]7,050to8,600persons($1,118),
and[6]8,600to11,450persons($1,129),
whilepopulationgroup[7]11,450to15,930
hadasignificantlyhighercost($1,290)than
group6($1,129).
3. There was a tendency for the smallest two
population groups to have a larger variance
around the group’s mean.
Concurrently, higher cost per capita municipalities
also appear to have lower “effective tax rates,”
meaning the amount paid in property taxes per one
hundred dollars of equalized value tends to be lower.
The reserve for uncollected taxes and the percentage
of revenues generated from delinquent taxes are
inversely correlated with high per capita cost; or high
per capita municipalities also have lower required
budgetedreserves(i.e.,highertaxcollectionrates)
and a lower percentage of delinquent taxes. Use of the
fund balance also appears to be inversely correlated.
While we are not prepared to advance a causative link,
thisfindingdidleadustoaskthequestionfroma
different perspective. Do we have here a simple matter
oflocalservicepreferenceand/orlocalserviceneed,
totally aside from municipal size?
In attempting to gain some further insight, we
explored the universe of non-resort municipalities
exhibiting a per capita cost of more than $2,000 per
person (i.e., roughly in excess of 50 percent over the
averagecostamongnon-resortcommunities).Thelist
includes, among others, the communities shown in
table 7.
Alpine, Camden, Harding, Newark, the Princetons,
Trenton–allareonacommonlistandinconveniently
undermine the conventional wisdom while supporting
what seems to be emerging. The list includes, by
population size, the small (Rockleigh, Far Hills,
TABLE 7 Non-resort Higher Cost Per Capita Municipalities
Municipalities with > $2,000
Per Capita CostPer Capita Cost Population
Alpine Borough $2,662 1,849
Asbury Park $2,470 16,116
Bayonne $2,017 63,024
Camden $2,095 77,344
Carlstadt $3,118 6,127
Chester Borough $2,633 1,649
Englewood $2,085 27,147
Englewood Cliffs $2,474 5,281
Essex Fells $2,146 2,113
Fairfield $2,626 7,466
Far Hills $2,960 919
Greenwich Twp. (Gloucester) $2,122 4,899
Harding Township $2,010 3,838
Harrison $2,839 13,620
Linden $2,265 40,499
Millburn $2,399 20,149
Moonachie $2,941 2,708
Morris Plains $2,013 5,532
Newark $2,167 277,140
Paramus $2,073 26,342
(Princeton Borough) $2,069 12,307
(Princeton Township) $2,170 16,265
Rockleigh $2,304 531
Roseland $2,147 5,819
Saddle River $3,524 3,152
Secaucus $2,785 16,264
Trenton $2,162 84,913
Watchung $2,113 5,801
Weehawken $2,893 12,554
Source: New Jersey Division of Local Government Services; analysis by authors.
28 Bloustein Local Government Research Center
Chester,andAlpine);themedium(Englewood,
Millburn,Paramus,andthePrincetons);andthelarge
(Trenton,Newark,Camden,andBayonne).
We submit that in New Jersey it is nearly impossible
to draw universal conclusions about the cost of local
government, particularly as communities evolve.
High-income municipalities perhaps desire a higher
quality of services and are prepared to pay for them;
other municipalities require a diverse range of services
due to the heterogeneity of residents. If this sort of
loose causal situation existed, we would hypothesize
that the cost of local government services, rather than
being dependent upon size per se, is more dependent
on two other factors:
(1)thepercapitapropertytaxbaseuponwhich
revenue may be assessed, and
(2)certainsocioeconomiccharacteristicsofthe
communities.
If these are the drivers of the per capita cost of
municipal government, this study introduces political
challenges of sensitive issues. This would include
consideration of the need for increased state aid to
municipalities with higher social service costs.
This observation also introduces another issue:
legislatively restricted revenue sources. Nationwide,
the property tax represents about a third of municipal
revenue, with municipalities in other states having
access to other revenue sources that are far more
diverse than in New Jersey. Local sales taxes, personal
property taxes, and other revenues are common in
other states and are in stark comparison to New
Jersey, where the property tax now represents more
than 60 percent of revenues collected for local
government services.
Do we have a cost problem, or do we have a revenue
problem?
Regrettably,thestate’sownfiscalchallengesprevent
this discussion from even taking place. Concurrently,
other solutions—consolidation among them—are
advanced. Yet, the surprisingly consistent average
per capita cost from among our smallest to our
largest municipalities raises a fundamental question
of whether savings incurred go beyond the margin:
Aretheymeaningful,long-lasting,andsufficientto
even advance the core premise that consolidation is a
major strategy in reducing the New Jersey property
taxproblem?Ourfindingsarenotintendedto
dissuade such discussions, nor do we wish to impede
other discussions on effective provision of services
through strategies such as sharing of services between
jurisdictions, or outsourcing. But with the paucity of
evidence that size is in some way a major determinant
of cost per capita, consolidation as a major strategy to
“solve” the property tax problem becomes a highly
suspect political policy.
With the folk hypothesis not standing up to scrutiny
as a strategy for long-term cost reduction, we turned
to a long established (and quite independently
constructed)surrogateforlocalsocioeconomicstatus,
the State Department of Education District Factor
Group, to assess whether municipal costs might
exhibit a stronger association with socioeconomic
status than municipal size.
DFG GRouPS aND CoSt PeR CaPita47
TheDistrictFactorGroups(DFGs)discussedearlier
in this report were developed in 1975 for the purpose
of comparing students’ performance on statewide
assessments across demographically similar school
districts and, as such, operated as a surrogate for
socioeconomicstatusofthemunicipalityand/or
district. DFG groupings were also used, subsequent to
Abbott v. Burke,todefinethegroupofschooldistricts
to which the parity remedy aid would be focused.
DFG categories were updated every ten years based
on data from the decennial Census.
“...in New Jersey it is nearly
impossible to draw universal
conclusions about the cost of
local government.”

Size May Not Be the issue | November 2014 29
Unlike municipal boundaries that may be visualized
as a flat plain, school districts exist at a range of
levels(K-8,regional,consolidated,andsoon).
Still,withminorqualifications,municipalitiescan
be assigned to the DFG group of their “primary”
district, and accordingly are a surrogate of municipal
socioeconomicstatus(SES).TheDFGswere
calculated using six variables that are closely related to
SES:48
1)Percentageofadultswithnohighschool
diploma
2)Percentageofadultswithsomecollege
education
3)Occupationalstatus
4)Unemploymentrate
5)Percentageofindividualsinpoverty
6)Medianfamilyincome
As a general rule, socioeconomic status may be
estimated with municipalities assigned to DFG group
“A” as being less well-off, higher proportions of
the population living in poverty, and the like. Status
increases, with group “J” representing communities
with the highest income, lowest poverty rates, highest
percentage of college educated adults, and so on.
If our preliminary contention that available taxing
resources, on the one hand, and high social costs on
the other, were two important factors in the variation
in the cost per capita of local government in New
Jersey,wewouldexpecttofindahighercostper
capita among “A” and “B” DFG areas (because of the
socialcosts),andalsohighercostpercapitaamong
“I” and “J” districts. Accordingly, a series of analyses
were completed to determine whether the average
costoflocalgovernmentpercapitavariedsignificantly
among municipalities in different DFG groups.
Results were both as expected but also surprising, as
illustratedinfigure4.Asanticipated,both“A”and
“J” municipalities had higher municipal costs than
most other DFG municipalities.
When all municipalities are considered, however,
itappearsthatmunicipalitieswith“FG”classified
schools actually have the highest average cost of
local government, at $2,013. Again, without looking
deeper,thisratherpuzzlingfindingcouldgenerate
incredible new urban myths. What would be the
FiGURE 4 Per Capita Cost of Government Grouped by DFG Educational Classification
Source: New Jersey Department of Education; analysis by authors.
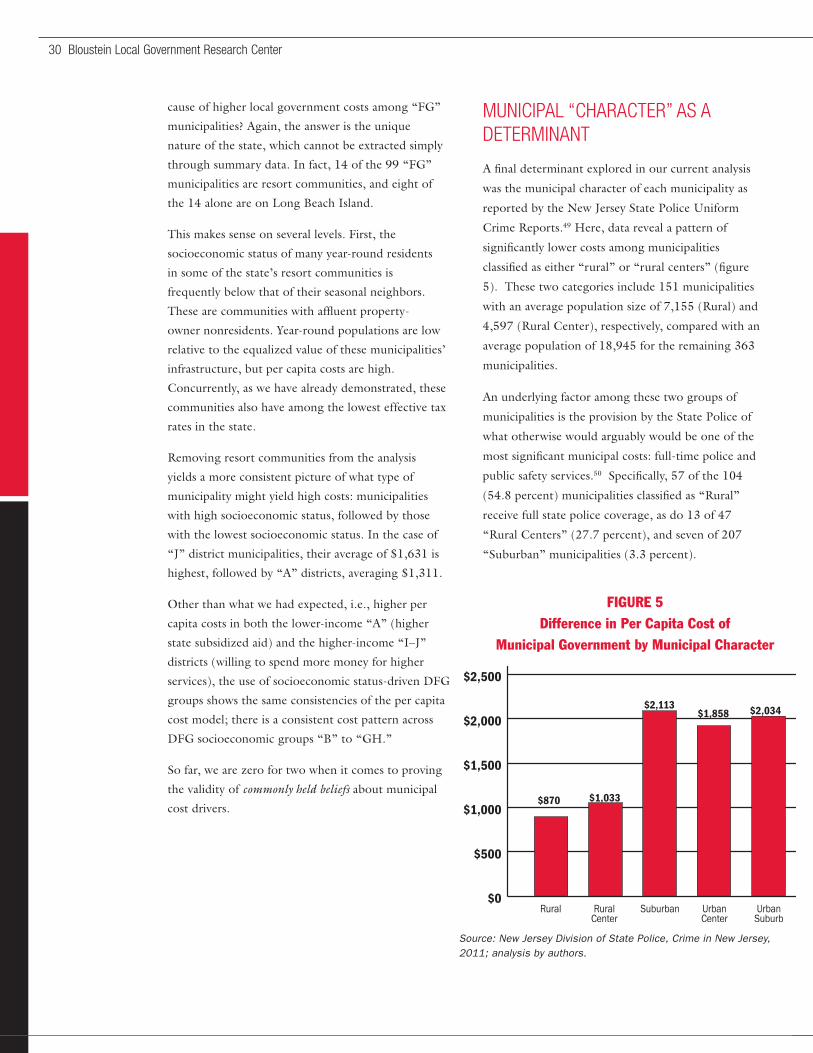
30 Bloustein Local Government Research Center
cause of higher local government costs among “FG”
municipalities? Again, the answer is the unique
nature of the state, which cannot be extracted simply
through summary data. In fact, 14 of the 99 “FG”
municipalities are resort communities, and eight of
the 14 alone are on Long Beach Island.
This makes sense on several levels. First, the
socioeconomic status of many year-round residents
in some of the state’s resort communities is
frequently below that of their seasonal neighbors.
These are communities with affluent property-
owner nonresidents. Year-round populations are low
relative to the equalized value of these municipalities’
infrastructure, but per capita costs are high.
Concurrently, as we have already demonstrated, these
communities also have among the lowest effective tax
rates in the state.
Removing resort communities from the analysis
yields a more consistent picture of what type of
municipality might yield high costs: municipalities
with high socioeconomic status, followed by those
with the lowest socioeconomic status. In the case of
“J” district municipalities, their average of $1,631 is
highest, followed by “A” districts, averaging $1,311.
Otherthanwhatwehadexpected,i.e.,higherper
capita costs in both the lower-income “A” (higher
statesubsidizedaid)andthehigher-income“I–J”
districts (willing to spend more money for higher
services),theuseofsocioeconomicstatus-drivenDFG
groups shows the same consistencies of the per capita
cost model; there is a consistent cost pattern across
DFG socioeconomic groups “B” to “GH.”
So far, we are zero for two when it comes to proving
the validity of commonly held beliefs about municipal
cost drivers.
MuNiCiPaL “ChaRaCteR” aS a DeteRMiNaNt
Afinaldeterminantexploredinourcurrentanalysis
was the municipal character of each municipality as
reported by the New Jersey State Police Uniform
Crime Reports.49 Here, data reveal a pattern of
significantlylowercostsamongmunicipalities
classifiedaseither“rural”or“ruralcenters”(figure
5).Thesetwocategoriesinclude151municipalities
withanaveragepopulationsizeof7,155(Rural)and
4,597(RuralCenter),respectively,comparedwithan
average population of 18,945 for the remaining 363
municipalities.
An underlying factor among these two groups of
municipalities is the provision by the State Police of
what otherwise would arguably would be one of the
mostsignificantmunicipalcosts:full-timepoliceand
public safety services.50Specifically,57ofthe104
(54.8percent)municipalitiesclassifiedas“Rural”
receive full state police coverage, as do 13 of 47
“RuralCenters”(27.7percent),andsevenof207
“Suburban”municipalities(3.3percent).
FiGURE 5 Difference in Per Capita Cost of
Municipal Government by Municipal Character
Source: New Jersey Division of State Police, Crime in New Jersey, 2011; analysis by authors.

Size May Not Be the issue | November 2014 31
As expected, the municipal cost per capita is examined
wefindthatthepercapitacostishigherintheselesser
developed communities where police are a local cost,
andstatepolicecoverageisnotprovided(table8).
Still, the weighted average per capita cost, combining
both rural municipalities and rural centers not
provided state police coverage is very low, at $1,017.
Overthelasttwentyyearsseveralstategovernment
administrationsattemptedtochargestatepolice–
covered municipalities for the services they received.
AdecisionoftheCouncilonStateMandates51
determined that charging these municipalities
forservicesviolatedthestate-mandate/state-pay
provisions of the New Jersey State Constitution.
This decision prevents the State of New Jersey
from shifting costs and adding a new cost to those
municipalities.
otheR SuPPoRtiVe aNaLySeS
It is worthy to note that these conclusions are not
new. While our methodology is new, others have
employed different methodology and reached
similar conclusions. Rutgers Professor Emeritus
Ernest Reock, one of the state’s most experienced
practitionersofmunicipalfiscaldatacollection
and analysis, has, since 2004, studied what causes
spending disparities across municipalities. In a series
of monographs entitled “Determinants of Property
Tax Burden in New Jersey,”52 Dr. Reock studied
municipaldemographicandfiscaldatafrom2004,
2008, and 2011. While he included municipal,
county, and school tax data in his analysis, he
observed that:
The heaviest property tax burdens are
found in small, older suburbs that have
low property tax bases and limited personal
incomes among their residents; excessive
spending is rarely found in such places,
and the only feasible assistance must come
from outside the community. State school
aid is of considerable help in many places,
especially in urban communities, but State
municipal aid is insufficient and poorly
TABLE 8 Average Cost Per Capita by State Police Coverage
Police funded
locally
Police
funded by
State
Rural municipalities $1,004 $747
Rural centers $1,074 $919
Suburban $1,268 $854
Source: New Jersey Division of State Police, Crime in New Jersey, 2011; analysis by authors.
distributed, and State tax rebates do not
redress the imbalance.
Dr. Reock makes the point that the heaviest property
tax burdens are in places that do not have excessive
spending. This too weighs against assumptions that
high property taxes are due to local spending decisions.
Robert Casey, a long-time municipal issues policy
advisor to several state commissions that studied
local government, researched and authored a study
forLUARCC(ofwhichhewasamember)entitled
“TheMunicipalOperationalTaxIndex—aMunicipal
Comparison Tool.”53 It was intended to “be used
by local taxpayers to compare their local municipal
tax burden with the comparable tax burden of
their neighboring municipalities as well as relevant
countywide averages.” While his study focused on
tax burden, not strictly costs, Casey did address the
issue of the reserve for uncollected taxes as a variable
that was not relevant to calculating the costs of a
government.
Richard Kaluzny, PhD, the retired director of the
NewJerseyOfficeofTaxAnalysisandformerassistant
treasurer in the New Jersey Department of the
Treasury, took a different approach in an unpublished
paper from 2009, titled “The Case for Consolidation
ofNewJerseyMunicipalities.”Thedraftpaperwas
circulated to an informal group of policy analysts
interested in property tax issues.54

32 Bloustein Local Government Research Center
In it, Kaluzny analyzed revenues used to support
municipal services, the average property tax on
residential parcels, and the total tax levy, with the
goal of examining the proposition that municipal
sizehasastatisticallysignificanteffectonthecostof
local services. He too wanted to test the “popular
hypothesis that consolidation of the then 566 New
Jersey municipalities into larger aggregate units could
have a positive impact on lowering municipal costs
and the property tax burden.” His analysis focused on
property tax impact, taking into account school and
county tax burdens.
At the end of his analysis, using various advanced
statistical tools, he reached the following conclusions:
• Thereisevidencethatlocalmunicipalcosts
bearsomesignificantstatisticalrelationshipto
the size of the community. Local expenditures
per capita decline as municipal size increases.
(Note: Regrettably, Kaluzny’s analysis did not
take into effect the distorting influence of the
reserve for uncollected taxes.)
• Evenanarrowmeasureoftaxburdenon
homeowners (i.e., average residential property
tax)doesnotindicatesubstantialsaving.
• Thissuggeststhatconsolidationofsmall
municipalities into larger municipalities by itself
will not lead to a reduced tax burden.
While Reock’s, Casey’s, Kaluzny’s, and our
methodologies vary to different extents, the direction
is the same. We concur with Kaluzny as he recognized
the complexity of the issue and the challenge of the
folk hypothesis when he wrote:
This is not to say that consolidation of
municipalities is not a good thing or that it
may lead to savings for some communities.
Consideration of more factors than the
handful of easily measured ones examined
hereisneededbeforeafinalassessmentcan
be rendered.
So, WheRe DoeS thiS LeaVe uS With ReSPeCt to CoNSoLiDatioN SaViNGS?
While our primary goal in this research effort was
to determine the extent to which municipal size
may contribute to higher or lower costs of local
government, and whether many local governments
with a high degree of local accountability are
necessarily a contributing factor to a “property tax
problem,” we determined it necessary at least to
explore some hypothetical implications from our
findings.Thefirst,ofcourse,isthatsizemaynot
matter nearly as much as the conventional wisdom
would have us believe. That said, let’s look at a simple
hypothetical example: a municipality with a $10
million budget.
Data from detailed municipal budgets for the subject
years would suggest that in any consolidation
instance, approximately one-third of municipal
budgets are inflexible, and in most of these
areas considerable “squeezing” has already been
accomplished. The major areas are summarized in
table 9.
Accordingly, one can anticipate that whatever the
municipalities, approximately one-third of all costs
are unlikely to be affected by a consolidation. The
reserve for uncollected taxes, for example, represents
actual required appropriation based upon collections
and is generally unrelated to size and management
decision. Likewise, debt is real and inviolate; although
overtimerefinancingmightyieldsavings,itwould
likelyhappenregardlessofthesediscussions.On
the revenue side, the property tax (current and
delinquent)represents,onaverage,62percentofall
municipal revenue. As the data in table 10 show, the
major contributor to the property tax dilemma is not
local government, but education. Again, exploring
the statewide average distribution of the property tax,
local government represents only 28.5 percent of the
total levy.

Size May Not Be the issue | November 2014 33
TABLE 11 Hypothetical Budget impact
$10,000,000 Budget
66.35% Hypothetical unrestricted appropriations
$6,635,000 Budget amount within which decisions can be made
$6,200,000 Expected revenue from the property tax
$3,800,000 Revenue from other sources
5.0% Target savings from consolidation
$331,750 Savings to be accrued if all works well
$205,685 Savings allocated to property tax
$126,065 Savings allocated to other revenue
3.32% Local property tax savings
$23,280,702 Total property tax levy
0.88% Effective savings on the total property tax bill
Source: Analysis by authors.
TABLE 9 2011 Review of Municipal Budgets
Expense CategoryAverage Percentage of
Budget (%)
Reserve for uncollected taxes 5.13
Debt service 8.79
Utilities 3.41
Insurance 14.09
Miscellaneous 2.24
TOTAL 33.66
Revenue category
Current and delinquent property taxes 62.0
Source: New Jersey Division of Local Government Services; analysis by authors.
TABLE 10 2011 Distribution of the Property Tax by Jurisdiction
Jurisdiction Tax (in billions)Tax as a Percentage of
Total (%)
Municipal $7.550 28.5
School $13.845 52.2
County $4.777 18.0
Special district/assessments
$0.332 1.3
Total $26.504 100.0
Source: New Jersey Division of Local Government Services; analysis by authors.
Using these data as a base for our hypothetical case
with a $10 million budget, consolidation can target
only about 66 percent of the budget, or some $6.635
million in appropriations. Concurrently, with a
$10 million budget, we would expect the property
tax to generate $6.2 million in revenue. However,
since the municipal portion represents only a small
portion of the total tax levy, for this instance our
average allocation of the tax levy projects a total
levy of $23.280 million that would include county,
education, and other special district levies.
In this hypothetical, we hope to achieve a 5 percent
savings from consolidation, or a savings of $331,750
from the fungible $6.635 million portion of the
budget. Appropriating savings to revenue sources
would result in a reduced revenue requirement of
$331,750, of which $205,685 would be credited to
the property tax. Thus, if 5 percent savings could be
achieved through a perfectly executed consolidation
to the variable portion of appropriations, the net
savings for the municipal property tax portion would
yielda3.32percentsavings.Ofcourse,thiswould
not translate into a 3.3 percent reduction in taxes,
since municipal-purpose property taxes represent only
28 percent of the total levy.
Accordingly, in our hypothetical, a 5 percent savings
would translate into a 0.88 percent reduction in
the total levy. Using a $7,500 property tax bill as a
reference, this translates into a possible annual savings
of $66.26. Base data used are summarized in table 11.
“...Size may not matter nearly as
much as the conventional wisdom
would have us believe.”
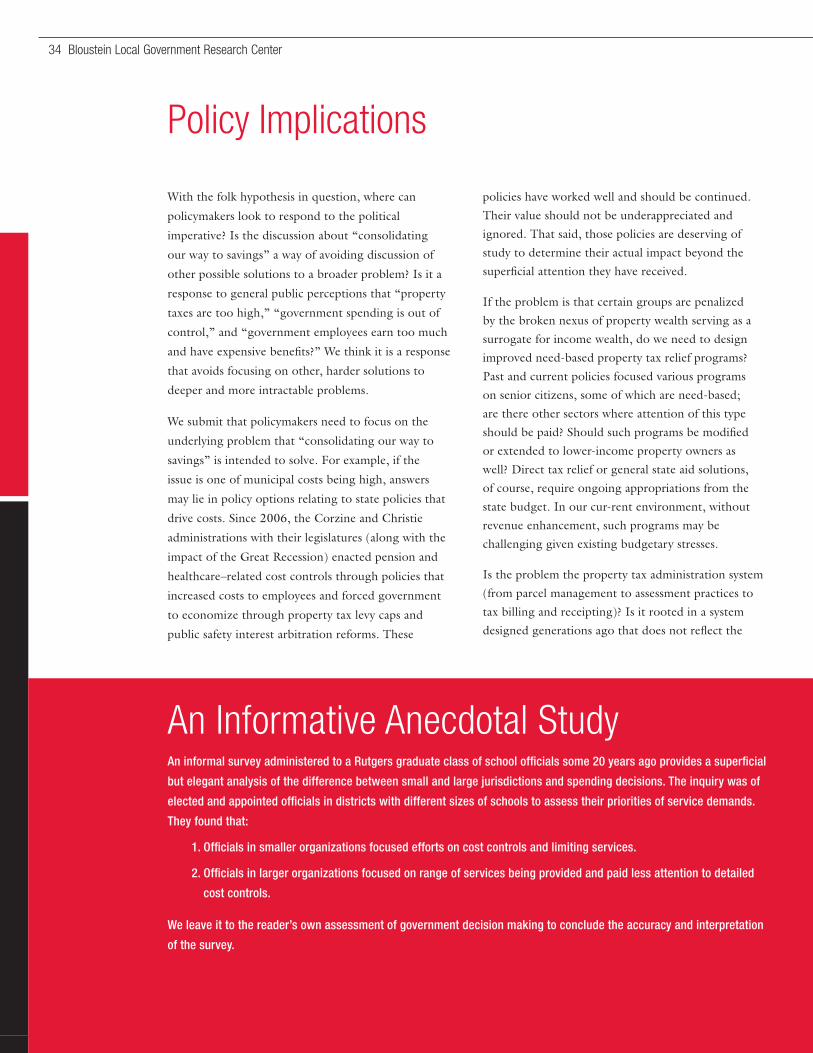
34 Bloustein Local Government Research Center
With the folk hypothesis in question, where can
policymakers look to respond to the political
imperative? Is the discussion about “consolidating
our way to savings” a way of avoiding discussion of
other possible solutions to a broader problem? Is it a
response to general public perceptions that “property
taxes are too high,” “government spending is out of
control,” and “government employees earn too much
andhaveexpensivebenefits?”Wethinkitisaresponse
that avoids focusing on other, harder solutions to
deeper and more intractable problems.
We submit that policymakers need to focus on the
underlying problem that “consolidating our way to
savings” is intended to solve. For example, if the
issue is one of municipal costs being high, answers
may lie in policy options relating to state policies that
drive costs. Since 2006, the Corzine and Christie
administrations with their legislatures (along with the
impactoftheGreatRecession)enactedpensionand
healthcare–relatedcostcontrolsthroughpoliciesthat
increased costs to employees and forced government
to economize through property tax levy caps and
public safety interest arbitration reforms. These
Policy implications
policies have worked well and should be continued.
Their value should not be underappreciated and
ignored. That said, those policies are deserving of
study to determine their actual impact beyond the
superficialattentiontheyhavereceived.
If the problem is that certain groups are penalized
by the broken nexus of property wealth serving as a
surrogate for income wealth, do we need to design
improved need-based property tax relief programs?
Past and current policies focused various programs
on senior citizens, some of which are need-based;
are there other sectors where attention of this type
shouldbepaid?Shouldsuchprogramsbemodified
or extended to lower-income property owners as
well? Direct tax relief or general state aid solutions,
of course, require ongoing appropriations from the
state budget. In our cur-rent environment, without
revenue enhancement, such programs may be
challenging given existing budgetary stresses.
Is the problem the property tax administration system
(from parcel management to assessment practices to
taxbillingandreceipting)?Isitrootedinasystem
designed generations ago that does not reflect the
an informative anecdotal StudyAn informal survey administered to a Rutgers graduate class of school officials some 20 years ago provides a superficial
but elegant analysis of the difference between small and large jurisdictions and spending decisions. The inquiry was of
elected and appointed officials in districts with different sizes of schools to assess their priorities of service demands.
They found that:
1. Officials in smaller organizations focused efforts on cost controls and limiting services.
2. Officials in larger organizations focused on range of services being provided and paid less attention to detailed
cost controls.
We leave it to the reader’s own assessment of government decision making to conclude the accuracy and interpretation
of the survey.

Size May Not Be the issue | November 2014 35
current economy and technology tools, hampered
by a lack of symmetrical information between those
who set value, property owners, and adjudicators?
If so, should we seriously address these issues with a
comprehensive study of our property tax system? Such
an effort was undertaken in the mid-1980s (“Equity
21”55).Arguably,thetimeisripeforafreshlookat
the whole system, rather than the piecemeal approach
currently used by state policymakers.56
There are a host of other possible answers to the
question of why costs or taxes are “high.” These
include:
1. Inefficientdeliveryofcertainmunicipal
services that could be improved with investment
in technology; technologies that can be
shared or acquired through improved public
procurement practices.
2. State laws that drive personnel costs through
collective bargaining policy, civil service rules,
health insurance requirements, and other
policies.
3. State and local political decisions that
favored employee groups for political gain—
placing short-term political agendas ahead of
long-termcosts(i.e.,increasedpensionbenefits
in the early 2000s, an initiative driven by public
employee organizations that coincided with a
gubernatorial/legislativeelectioncycle).
4. State mandates that incrementally or
substantially increase costs, regardless of equity
or fairness (i.e., prevailing wages in construction
contracting, minimum health insurance
standards,openpublicrecordlaws).Thereare
approaches that can reduce the impact of costs
imposed by outlier actions (they tend to drive
upcosts)withoutaffectingtheimportantvalues
that these mandates represent.
5. Economically or politically flawed policies
to fund local services primarily through
propertytaxes.Mostsignificantlythisisfound
inthereclassificationanddiversionofenergy
consumption taxes paid to utility companies for
state purposes. These revenues were originally
a means of compensating municipalities for
regulated utility use of the public right-of-
way and to offset the exemption of utility
property from property taxation. The flaw was
exacerbated when the state started retaining the
growth for its own purposes while freezing the
municipal portion.
FiGURE 6 Cumulative Change in NJ State GDP by Sector
and Cumulative Change in Median income, 1997-2011

36 Bloustein Local Government Research Center
6. Dependence on the property tax in New
Jersey compared with other states creates an
extraordinarily large major revenue source while
not concurrently focusing on the impact of
income growth or capital value. For example,
between 1997 and 2011, New Jersey’s GDP
increased approximately 60 percent while
median income, mirroring national trends of the
flatlining of wages, increased only 30 percent,
with virtually no change between 2005 and
2011,asshowninfigure6.
Property taxes are assessed on value. Between 1999
and 2013, the average statewide effective tax rate
actually decreased from $2.54 per $100 of value
to $2.26 per $100 of value.57 Even with the loss
of millions of dollars of value from the housing
market crash, total value on which property taxes are
based increased proportionately more than the total
property tax levy. Income, conversely, did not grow at
the same pace.
Nationwide, the criticality of this is less obvious, as
significantmunicipalresourcesaregeneratedfrom
sources other than the property tax. Elsewhere, the
property tax represents some 30 percent of revenue,
as compared with 62 percent of municipal revenue in
New Jersey. In effect, the property tax is high because
it is the overwhelming source of revenue for most
municipalities, unlike elsewhere.

Size May Not Be the issue | November 2014 37
New Jersey has been wrestling with the property
tax challenge for decades and generations. Every
generation of political leaders commissions a study of
the issue, the most recent being the Special Legislative
Session on Property Tax Reform in 2006 and 2007.58
Rutgers Professor (and SLERP Commission Executive
Director)HenryA.Coleman,PhD,preparedan
instructive study for the New Jersey State League of
Municipalitiesin2003entitled“AHistoryofTax
Reform in New Jersey: The Commission Approach.”59
Table12istakenfromthatreport.Ourresearch
found studies on the issue going back to 1946,
including a formal Commission on State Tax Policy
that issued regular reports from 1946 until the late
1950s.
So, this is not new.
Ourfindingshighlightthatthefolkhypothesisis
one of the more contemporary politically discussed
solutions to the “property tax problem.” It is more
challengingthanthesuperficialandspeculative
analysis on which its advocates rely. We further
highlight gaps in research and policy attention that
whenfilled,mayhelppolicymakersfocusonsolutions
that can help stabilize or even reduce the cost of
municipal government services. Policymakers should
move on from citing what we conclude to be a fully
discredited hypothesis and focus on other lines of
inquiry to address the challenge.
We submit that this research is an objective
starting point for more inquiry aimed at spurring
informed and thoughtful discussion of the issue.
Contrary to some public opinion, well-constructed
task forces have provided valuable insight, often
resulting in immediate, though sometimes delayed,
implementation. Consideration of this approach is
overdue and warranted once again.
This study indicates, and we maintain that there is not
a single “solution” to municipal property tax levels.
Rather, there is potential for a range of policies that,
after appropriate study and the requisite hard political
work, can lead to consensus on actions state and
localofficialscantaketoaddressthe“propertytax
problem.”
It just won’t be easy. Which also is not new.
Final observations
TABLE 12 Major Fiscal Study Commissions in New Jersey (1970–2000)
Name Alias Year Number of MembersNumber of
Recommendations
Tax Policy Committee Cahill Committee 1972 32 105
Commission on Government Costs and Tax Policy
Leone Commission 1977 16 32
Property Tax Assessment Study Commission
Glaser Commission 1986 18 37
State and Local Expenditure and Revenue Commission
SLERP Commission 1988 33 111
Quality Education Act Commission QEA Commission 1991 29 20
Education Funding Review Commission
EFRC 1994 15 26
Property Tax Study Commission Cannon Commission 1998 25 60
Source: New Jersey State League of Municipalities.

38 Bloustein Local Government Research Center
TABLE 13 impact of Primacy City on the Total Number of Local Governments
Largest City Population Rank of Major
City by Size
Largest City as %
State Population
Rank of
Largest City
Exclude
Largest City
Adjusted # General
Governments
Remaining Gen
Gov’t per 10,000
Adjusted
rank
Alabama Birmingham 212,237 33 4.4% 44 4,567,498 527 1.15 27
Alaska Anchorage 291,826 31 41.1% 2 418,405 161 3.85 8
Arizona Phoenix 1,445,632 6 22.8% 5 4,883,381 105 0.22 47
Arkansas Little Rock 193,524 36 6.6% 40 2,722,397 576 2.12 17
California Los Angeles 3,792,621 2 10.2% 24 33,461,335 538 0.16 48
Colorado Denver 600,024 16 11.9% 18 4,429,172 332 0.75 33
Connecticut Bridgeport 144,229 41 4.0% 47 3,429,868 178 0.52 42
Delaware Wilmington 70,851 46 7.9% 29 827,083 59 0.71 36
Florida Jacksonville 821,784 7 4.4% 45 17,979,527 475 0.26 46
Georgia Atlanta 420,003 24 4.3% 46 9,267,650 687 0.74 34
Hawaii Honolulu 390,738 26 28.7% 3 969,563 3 0.03 50
Idaho Boise 205,671 34 13.1% 15 1,361,911 243 1.78 22
Illinois Chicago 2,695,598 3 21.0% 8 10,135,034 2830 2.79 12
Indiana Indianapolis 820,445 8 12.7% 16 5,663,355 1665 2.94 11
Iowa Des Moines 203,433 35 6.7% 39 2,842,917 1045 3.68 10
Kansas Wichita 382,368 28 13.4% 14 2,470,750 1996 8.08 3
Kentucky Lexington 295,803 30 6.8% 36 4,043,559 535 1.32 26
Louisiana New Orleans 343,829 29 7.6% 32 4,189,543 363 0.87 30
Maine Portland 64,249 47 4.8% 43 1,264,112 503 3.98 7
Maryland Baltimore 620,961 13 10.8% 19 5,152,591 179 0.35 45
Massachusetts Boston 617,594 14 9.4% 25 5,930,035 355 0.60 40
Michigan Detroit 713,777 11 7.2% 33 9,169,858 1855 2.02 20
Minnesota Minneapolis 382,578 27 7.2% 34 4,921,347 2725 5.54 5
Mississippi Jackson 173,514 39 5.8% 41 2,793,783 378 1.35 25
Missouri Kansas City 459,787 22 7.7% 30 5,529,140 1380 2.50 13
Montana Billings 104,170 45 10.5% 21 885,245 182 2.06 19
Nebraska Omaha 408,958 25 22.4% 6 1,417,383 1041 7.34 4
Nevada Las Vegas 583,756 19 21.6% 7 2,116,795 34 0.16 49
New Hampshire Manchester 109,565 43 8.3% 28 1,206,907 243 2.01 21
New Jersey Newark 277,140 32 3.2% 48 8,514,754 586 0.69 38
New Mexico Albuquerque 545,852 21 26.5% 4 1,513,328 135 0.89 29
New York New York City 8,175,133 1 42.2% 1 11,202,971 1597 1.43 24
North Carolina Charlotte 731,424 10 7.7% 31 8,804,051 652 0.74 35
North Dakota Fargo 105,549 44 15.7% 11 567,042 1723 30.39 1
Ohio Columbus 787,033 9 6.8% 35 10,749,469 2333 2.17 16
Oklahoma Oklahoma City 579,999 20 15.5% 12 3,171,355 666 2.10 18
Oregon Portland 583,776 18 15.2% 13 3,247,298 276 0.85 31
Pennsylvania Philadelphia 1,526,006 5 12.0% 17 11,176,373 2626 2.35 15
Rhode Island Providence 178,042 38 16.9% 10 874,525 38 0.43 43
South Carolina Columbia 129,272 42 2.8% 49 4,496,092 314 0.70 37
South Dakota Sioux Falls 153,888 40 18.9% 9 660,292 1283 19.43 2
Tennessee Memphis 646,889 12 10.2% 23 5,699,221 436 0.77 32
Texas Houston 2,099,451 4 8.3% 27 23,046,110 1467 0.64 39
Utah Salt Lake City 186,440 37 6.7% 38 2,577,445 273 1.06 28
Vermont Burlington 42,417 50 6.8% 37 583,324 293 5.02 6
Virginia Virginia Beach 437,994 23 5.5% 42 7,563,030 323 0.43 44
Washington Seattle 608,660 15 9.1% 26 6,115,880 319 0.52 41
West Virginia Charleston 51,400 49 2.8% 50 1,801,596 286 1.59 23
Wisconsin Milwaukee 594,833 17 10.5% 22 5,092,153 1921 3.77 9
Wyoming Cheyenne 59,466 48 10.6% 20 504,160 121 2.40 14
Source: U.S. Bureau of the Census, 2010, and authors’ analysis.

Size May Not Be the issue | November 2014 39
Endnotes
1. Paul Zachary (“PZ”) Myers, in John Brockman (ed.), This Explains Everything: Deep, Beautiful, and Elegant Theories of How the World Works (New York: HarperCollins, 2013), pp.172–3).
2. The term “political biology” has several meanings in academic and contemporary literature, none of which apply here. For our purposes it serves as a convenient shorthand to mean the consistent long-term (i.e., going back centuries) patterns of political behavior and traditions that span multiple generations of New Jersey’s political leadership, rooted in our history, and evolved to meet the needs of each generation.
3. This paper focuses exclusively on municipal government spending and the property tax burden imposed by municipal government. It does not address matters of public school or county spending or property tax burden. Thus, all references to property taxes and spending refer to municipal government, and no other level of government.
4. Calendar 2010 and 2011 for calendar fiscal year municipalities, and SFY2010 and 2011 for state fiscal year municipalities.
5. State law provides a formula for identifying these resort municipalities; we used the formula (employed by the N.J. State Police), found in P.L. 1998, c.50.
6. DFG categories for the 603 operating public school districts in New Jersey (2012–13), as characterized by socioeconomic status (U.S. Census data), are (from lowest to highest): A, B, CD, DE, FG, GH, I, and J.
7. William Musto et al., Consolidation: Prospects and Problems, Fifth Report of the County and Municipal Government Study Commission (Trenton, NJ: State of New Jersey, February 1972). This study may be found at: http://www.njspotlight.com/stories/10/1006/2044/ http://nj.gov/dca/affiliates/luarcc/pdf/cmgsc_consol_prospctsandproblems.pdf.
8. William V. Musto, Chair, County and Municipal Government Study Commission. Fifth Report, Consolidation: Prospects and Problems (Trenton, NJ: State of New Jersey, February 1972), p.1.
9. Ibid.
10. http://www.state.nj.us/dca/affiliates/luarcc/pdf/n.j.s.a.52.27D-502.pdf.
11. Andrew J. Bruck and H. Joseph Pinto III, “Overruled by Home Rule: The Problems with New Jersey’s Latest Effort to Consolidate Municipalities,” Seton Hall Legislative Journal, Vol. 32, No. 2 (2008). pp.3-5.
12. Bruck and Pinto, ibid, p.18.
13. Bruck and Pinto, ibid., p.19.
14. Bruck and Pinto, ibid., p.19.
15. Bruck and Pinto, ibid., pp.19–20.
16. Deborah Mercer, New Jersey State Library Collections Librarian E-mail to Caprio dated 9/5/2013 with citation for “Growth of Municipal Incorporations in New Jersey.”
17. Ernest Reock, unpublished research proposal citing annexation of former municipalities adjacent to several of New Jersey’s largest, oldest cities, 2004; and Alan J. Karcher, New Jersey’s Municipal Madness (New Brunswick, NJ: Rutgers University Press, 1998), chs. 13 and 14.
18. Karcher, ibid., p.83; Bruck and Pinto, op.cit., p.26.
19. Karcher ibid., pp.13-14.
20. The reader is referred to a broad range of urban ecological research on intrametropolitan movement beginning with the work of Ernest Burgess and Robert Park, Introduction to the Science of Sociology (1922), describing the “outward” movement of the wealthy from central cities.
21. See James W. Hughes and Joseph Seneca, Reinventing the New Jersey Economy: New Metropolitan and Regional Employment Dynamics, Rutgers Regional Report No. 33 (New Brunswick, NJ: Rutgers University, Edward J. Bloustein School of Planning and Public Policy, December 2012).
22. Heidi Shierholz and Lawrence Mishel, “A Decade of Flat Wages: The Key Barrier to Shared Prosperity and a Rising Middle Class.” EPI Briefing Paper No. 365 (Economic Policy Institute, August 21, 2013). This is one of many contemporary articles and research papers documenting the disconnect between increases in productivity and flatlining of wages.
23. The reader is referred to the DCA/DLGS Information Resources website at: http://www.state.nj.us/dca/divisions/dlgs/resources/.
24. Henry J. Raimondo, Economics of State and Local Government (New York: Praeger, 1992), pp.59–61.
25. Coincidentally, the Princetons first started discussions around the same time Landis and Vineland merged.
26. Prior to his retirement from the New Jersey State Division of Local Government Services in 2012, author Pfeiffer was involved in all the consolidation studies dating back to 1995.
27. New Jersey Department of Community Affairs, A Directory of Interlocal Activity (Trenton, NJ: State of New Jersey, Department of Community Affairs, 1991); also see Bruck and Pinto 2008, p.36.
28. Raphael J. Caprio and Marc Holzer, Outsourcing and Shared Services Among New Jersey Municipalities: A Preliminary Assessment of Potential Privatization, Partnership, and Productivity in Government. Research Series (Newark, NJ: Rutgers University, 1995).
29. Karcher, op.cit., p.134.
30. Jun Choi, “Opinion: A Bold Plan for Local Government Consolidation,” NJ Spotlight, Oct. 7, 2010 at: http://www.njspotlight.com/stories/10/1006/2044/.
31. Dan Mason, New Jersey Municipalities (April 2010), p.10.
32. Dagney Gail Faulk and Michael Hicks, Local Government Consolidation: Potential Savings Due to Economies of Scale and Efficiency Gains (Center for Business and Economic Research, Ball State University, October 2011).
33. Ibid.
34. Marc Holzer et al., “Literature Review and Analysis Related to Municipal Government Consolidation.” Report prepared for the New Jersey Local Unit Alignment, Reorganization, and Consolidation Commission (Rutgers University, Newark, New Jersey, May 6, 2009), p.1.
35. Charles Erdman, Princeton Local Government Survey: Growth of Municipal Incorporations in New Jersey (Princeton: Princeton University, 1937), pp.3-4. Reader is referred to the State Archives J352 E66.
36. Bruck and Pinto, op.cit., p.28.
37. Stephen Sweeney, “Can New Jersey Afford Its Small Towns,” The County Freeholder (May 2008), p.57.
38. The data represents calendar year 2011 for most municipalities and the state fiscal year 2012 for those remaining few municipalities on a SFY.
39. LUARCC Study, Municipal Operational Tax Index; http://www.nj.gov/dca/affiliates/luarcc/pdf/MUNICIPALOPERATIONALTAXINDEX 081310.pdf.
40. Nina Stack et al., Facing Our Future (Trenton, NJ: Council of New Jersey Grantmakers, January 2011), p.5. Dr. Caprio contributed the municipal and county analyses to this report.

40 Bloustein Local Government Research Center
41. Population in all four are less than 100, with Teterboro being an industrial enclave consisting primarily of an airport and related businesses with 67 residents; Tavistock and Pine Valley being golf courses incorporated as a municipality with 5 and 12 residents, respectively; and Walpack with 16 people, being the most rural and remote municipality in the state.
42. With the fiscal data in the study coming from 2010 and 2011, the dataset includes both the preconsolidated Princeton Borough and Princeton Township as separate entities, as their consolidation did not take effect until 2013. This accounts for the use of 566 municipalities, instead of the current 565.
43. Used for this study is the classification of resort communities specified in the New Jersey State Police Annual Crime Data Report, which in turn used Department of Labor definitions. Two adjustments which we believe appropriate were made by adding Atlantic City (Atlantic County) as a resort municipality, and removing Woodbine (Cape May County), yielding a “resort community” set of 49 municipalities. We recognize that other coastal municipalities such as Spring Lake or Asbury Park are year-round “destinations.” The differentiating variable, however, is the disproportionate percentage of residential units that are vacant “off-season.”
44. We are not the first to suggest this; see Reock and Kaluzny below (51 and 53).
45. We infer this from an overview of state MOD4 files for the resort communities versus a few random non-resort communities.
46. Resort communities are defined in the Uniform Crime Report of the New Jersey State Police at http://www.njsp.org/info/ucr2011/pdf/2011_sect_8.pdf, per P.L. 1998, c. 50. This list was used with two appropriate changes. Woodbine (Cape May County) was removed as a Resort, while Atlantic City (Atlantic) was added. The total count, 49, remained unchanged.
47. Source for DFG definitions and explanatory material may be found at: http://www.state.nj.us/education/finance/rda/dfg.shtml.
48. Although initially included in the DFG determination, density was subsequently dropped as a characteristic.
49. New Jersey Uniform Crime Reports, Section Seven, 2012 Edition, http://www.njsp.org/info/ucr2012/pdf/2012_sect7.pdf.
50. Several municipalities have part-time State Police service; these municipalities are grouped with the “local cost” group. Hence the category of municipalities with State Police support are those with full-time State Police coverage.
51. http://nj.gov/localmandates/decisions/12-12-08ShilohOpinion.pdf.
52. Ernest C. Reock, Jr., “Determinants of Property Tax Burden in New Jersey—2008” (New Brunswick, NJ: Rutgers University, Center for Government Services). http://www.cgs.rutgers.edu/sites/cgs.rutgers.edu/files/images/68015-Property%20Tax%20Determination%20Final.pdf
53. LUARCC, August 2010, http://www.nj.gov/dca/affiliates/luarcc/pdf/MUNICIPALOPERATIONALTAXINDEX%20081310.pdf and data files at http://www.nj.gov/dca/affiliates/luarcc/pdf/MUNICIPALOPERATIONALTAXINDEX%20081310.XLS.
54. R.L. Kaluzny, unpublished research paper presented to the Property Tax Study Group, 2009. (Caprio and Pfeiffer are members of the group, which is coordinated by Ernest Reock.)
55. The report is online at: http://www.njleg.state.nj.us/legislativepub/reports/property_tax_assessment.pdf.
56. We refer here to the Division of Taxation’s mid-2000’s failed effort (“PAMS”) to reinvent the statewide parcel management system (currently a 40+ year-old COBOL program known as “MOD IV”); a current pilot program in Gloucester County to centralize tax assessment at the county level under the control of the Board of Chosen Freeholders; another pilot program currently under way in Monmouth County to centralize administration with the County Board of Taxation and using a modified assessment calendar; and a failed effort in the 1990s to consider “dual-rate” taxation, allowing separate tax rates on land and improvements; and other legislative initiatives.
57. The effective tax rates were calculated from data at the Information Resources site of the Division of Local Government Services. The 1999 data are the earliest readily available.
58. http://www.njleg.state.nj.us/PropertyTaxSession/specialsessionpt.asp.
59. http://www.njslom.org/tax_reform_04-2003.html.
Bloustein Local Government Research CenterRutgers, The State University of New Jersey33 Livingston AvenueNew Brunswick, N.J. 08901
p. 848-932-5475 blousteinlocal.rutgers.edu
© 2014, Rutgers, The State University of New Jersey