sizing up natural disasters - crhnet · 2016-12-22 · disaster volcano earthquake tsunami tornado...
TRANSCRIPT

SIZING UP NATURAL DISASTERS
Ms. H. Jithamala Caldera
Prof. S. C. Wirasinghe
Prof. L. Zanzotto
Department of civil engineeringUniversity of Calgary
CRHNet Annual Symposium November 2016

© Caldera & Wirasinghe, 2016 2
Introduction
Overview
1. Existing techniques of natural disasters
2. Objectives
3. Proposed technique
Disaster Severity Index (DSI)
Qualitative - Order and definitions
Quantitative - Initial scale based on fatalities
4. Conclusions
3© Caldera & Wirasinghe, 2016
4
Existing Methods - Qualitative: Descriptive Terms
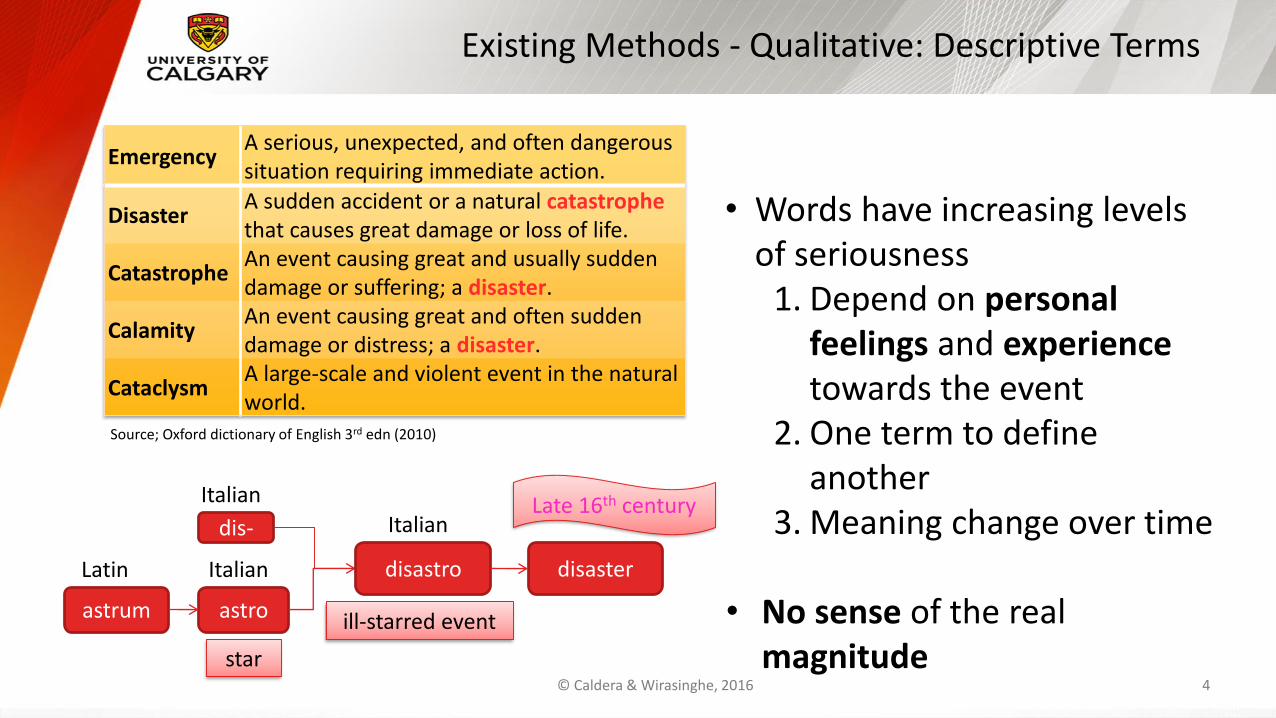
EmergencyA serious, unexpected, and often dangerous situation requiring immediate action.
DisasterA sudden accident or a natural catastrophethat causes great damage or loss of life.
CatastropheAn event causing great and usually sudden damage or suffering; a disaster.
CalamityAn event causing great and often sudden damage or distress; a disaster.
CataclysmA large-scale and violent event in the natural world.
• Words have increasing levels of seriousness
1. Depend on personal feelings and experiencetowards the event
2. One term to define another
3. Meaning change over time
• No sense of the real magnitude
Source; Oxford dictionary of English 3rd edn (2010)
dis-
astrum astro
disastro disasterLatin
Italian
Italian
Italian
star
ill-starred event
Late 16th century
© Caldera & Wirasinghe, 2016
5
Severity Classification: Quantitative
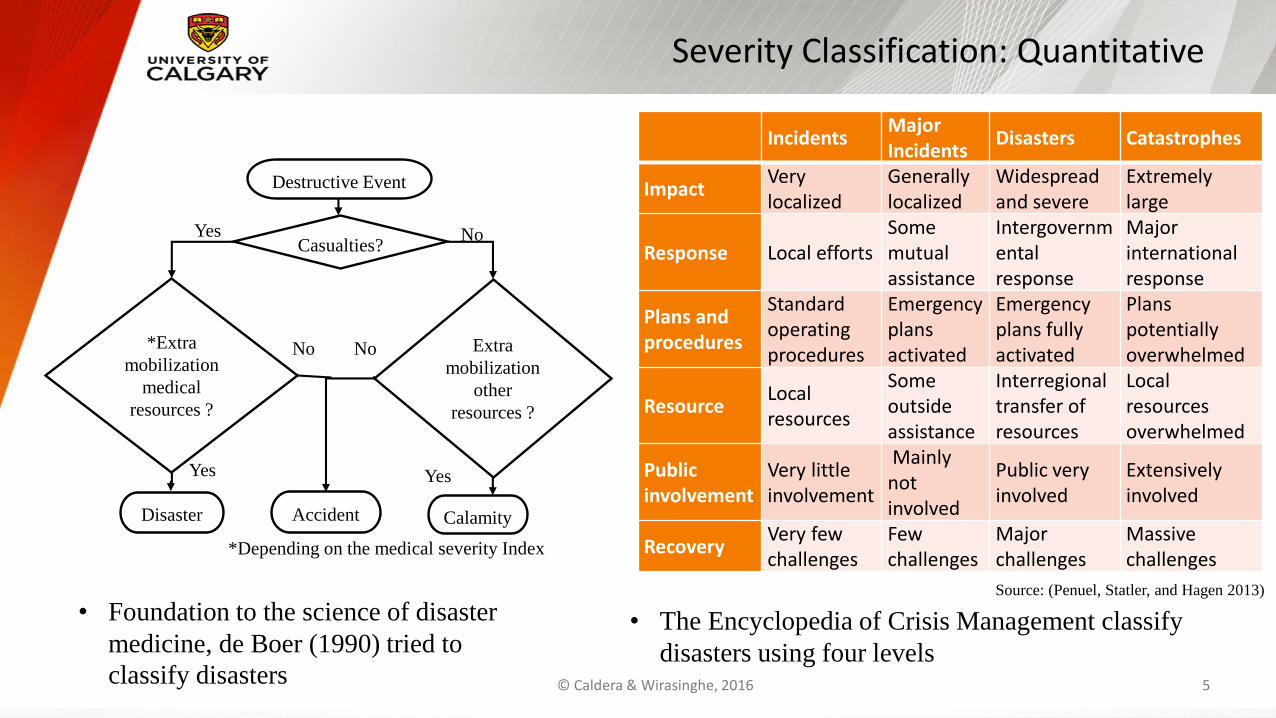
• The Encyclopedia of Crisis Management classify
disasters using four levels
• Foundation to the science of disaster
medicine, de Boer (1990) tried to
classify disasters
*Depending on the medical severity Index
YesYes
No No
Yes No
Destructive Event
Casualties?
*Extra
mobilization
medical
resources ?
Extra
mobilization
other
resources ?
Disaster Accident Calamity
IncidentsMajor Incidents
Disasters Catastrophes
ImpactVery localized
Generally localized
Widespread and severe
Extremely large
Response Local effortsSomemutual assistance
Intergovernmental response
Major international response
Plans and procedures
Standard operating procedures
Emergency plans activated
Emergency plans fully activated
Plans potentially overwhelmed
ResourceLocal resources
Some outside assistance
Interregional transfer of resources
Local resources overwhelmed
Public involvement
Very little involvement
Mainly not involved
Public very involved
Extensively involved
Recovery Very few challenges
Few challenges
Major challenges
Massive challenges
Source: (Penuel, Statler, and Hagen 2013)
© Caldera & Wirasinghe, 2016

6
Existing Methods - Quantitative: Magnitude/ Intensity Scales
Disaster Volcano Earthquake Tsunami Tornado
Existing ScaleVEIscale
RichterScale
IntensityScale
EF Scale
Fatalities 0.33 0.13 0.248 0.339Injuries 0.39 0.285 0.134 0.366Damage 0.09 0.488 0.168 0.32House Destroyed 0.33 0.23 0.043 -
House Damaged - 0.237 - -
Missing 0.45 - - -
• Indicate the strength not the impact• Impact depends on where a
disaster occurs• Not highly correlated
• Impact is similar but different scales• No relationship between among
different scales
© Caldera & Wirasinghe, 2016
Correlation coefficients of impact factors Vs. Intensity Scales
Existing Methods - Quantitative: Statistics
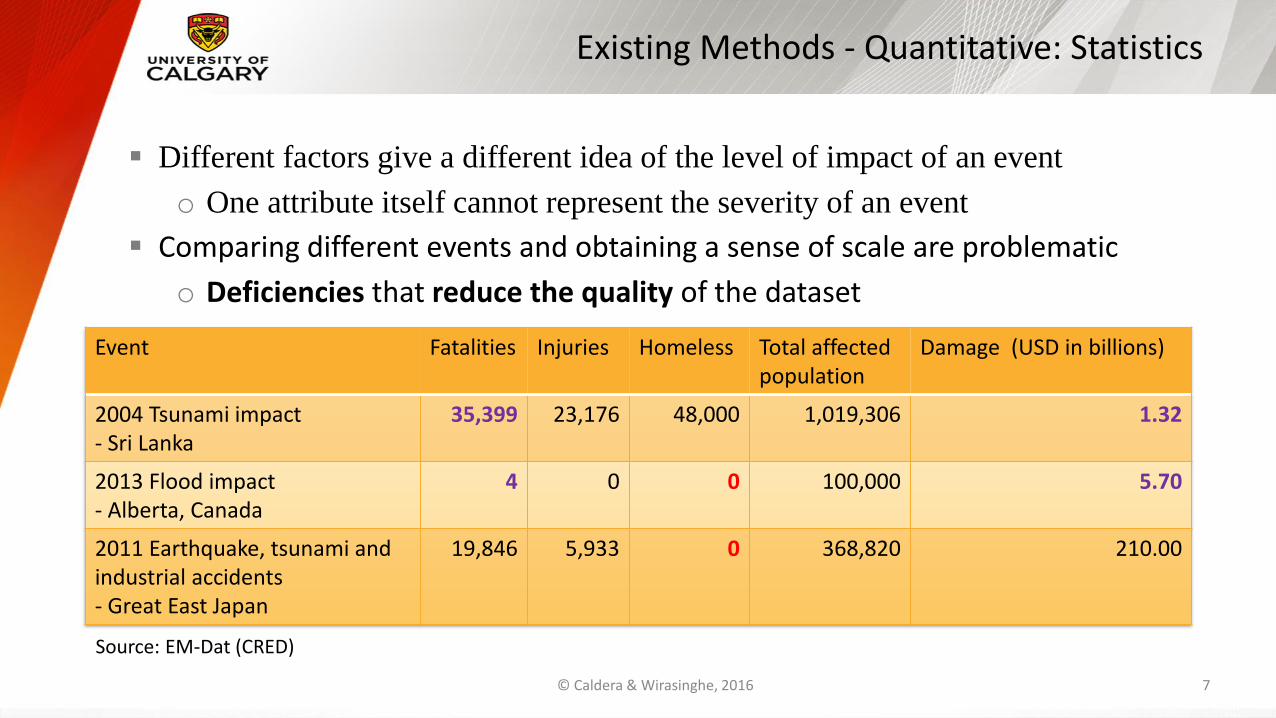
Different factors give a different idea of the level of impact of an event
o One attribute itself cannot represent the severity of an event
Comparing different events and obtaining a sense of scale are problematic
o Deficiencies that reduce the quality of the dataset
7
Event Fatalities Injuries Homeless Total affected population
Damage (USD in billions)
2004 Tsunami impact - Sri Lanka
35,399 23,176 48,000 1,019,306 1.32
2013 Flood impact - Alberta, Canada
4 0 0 100,000 5.70
2011 Earthquake, tsunami and industrial accidents - Great East Japan
19,846 5,933 0 368,820 210.00
Source: EM-Dat (CRED)
© Caldera & Wirasinghe, 2016
8
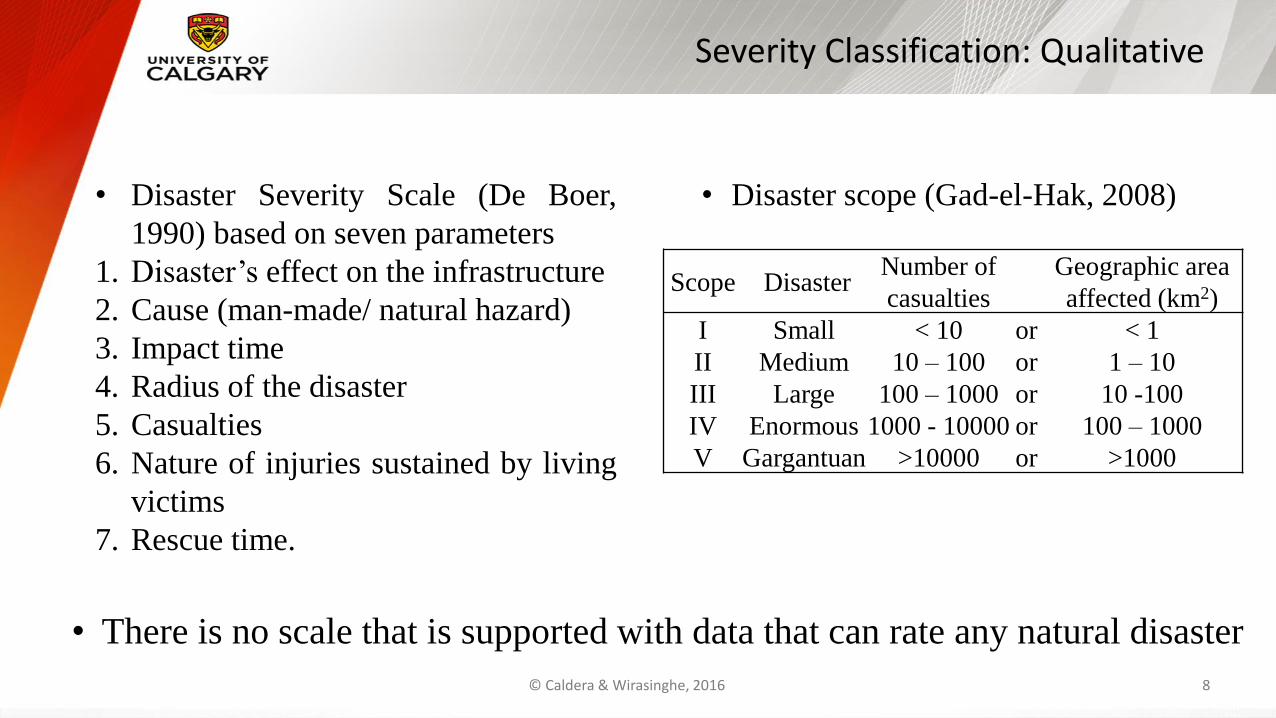
Scope DisasterNumber of
casualties
Geographic area
affected (km2)
I Small < 10 or < 1
II Medium 10 – 100 or 1 – 10
III Large 100 – 1000 or 10 -100
IV Enormous 1000 - 10000 or 100 – 1000
V Gargantuan >10000 or >1000
Severity Classification: Qualitative
• Disaster scope (Gad-el-Hak, 2008) • Disaster Severity Scale (De Boer,
1990) based on seven parameters
1. Disaster’s effect on the infrastructure
2. Cause (man-made/ natural hazard)
3. Impact time
4. Radius of the disaster
5. Casualties
6. Nature of injuries sustained by living
victims
7. Rescue time.
© Caldera & Wirasinghe, 2016
• There is no scale that is supported with data that can rate any natural disaster

Objectives
1. Create a Disaster Severity Index• Bridge between qualitative and quantitative techniques
2. Improve quantitative technique• Develop a clear order and definitions of existing terminologies, which describe the severity of
disasters
3. Improve quantitative technique and combine• Develop an initial scale, based on most influencing factor(s), to describe the range of severity
levels of natural disasters worldwide9© Caldera & Wirasinghe, 2016

Importance of Severity Classification
10
Who Benefits?
Research Community
• Existing technology
• Available recourses
General Public
• Education levels
• Response time
Disaster Managers and Emergency Responders
• Disaster mitigation
• Independent estimates of the magnitude of a disaster
Governments, Relief Agencies, NGO’s, Media Outlets
• Respond to events
• Clear definitions
Insurance Managers and Estimators
• Disaster compensation
• Insurance policiesDatabase Managers
• Information management
• Information processing
© Caldera & Wirasinghe, 2016

Factors Reflects Severity
11
Cost of Damage
Affected population
Property damage
Region of
impact
Population
density/ increase
Injuries
Fatalities
Missing people
Houses damaged
Economic damage
Social Damage
( distress/ suffering)
GDP per capita
Intensity
Disaster duration/
speed
Location
Mitigation Methods
Available Resources
Available Technology
Evacuated or not
Response Rate
Education Level
Experience
© Caldera & Wirasinghe, 2016
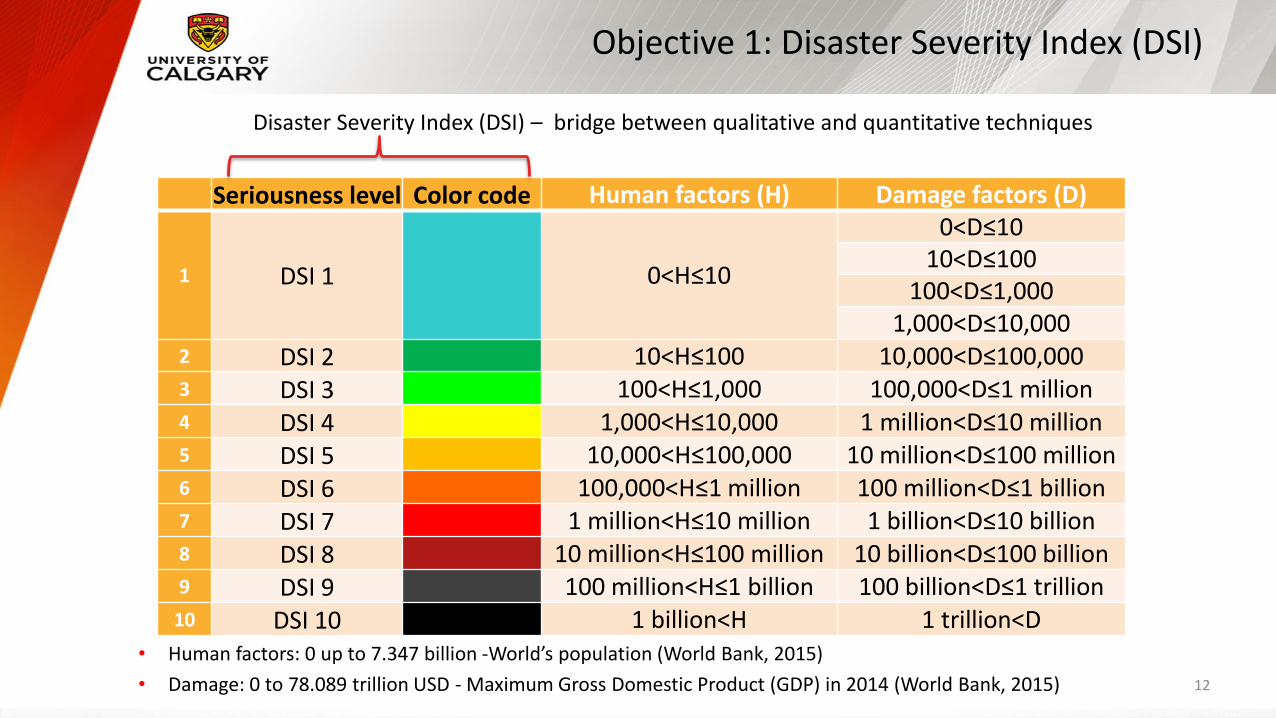
Objective 1: Disaster Severity Index (DSI)
• Human factors: 0 up to 7.347 billion -World’s population (World Bank, 2015)
• Damage: 0 to 78.089 trillion USD - Maximum Gross Domestic Product (GDP) in 2014 (World Bank, 2015) 12
Seriousness level Color code Human factors (H) Damage factors (D)
1 DSI 1 0<H≤10
0<D≤1010<D≤100
100<D≤1,0001,000<D≤10,000
2 DSI 2 10<H≤100 10,000<D≤100,0003 DSI 3 100<H≤1,000 100,000<D≤1 million4 DSI 4 1,000<H≤10,000 1 million<D≤10 million5 DSI 5 10,000<H≤100,000 10 million<D≤100 million6 DSI 6 100,000<H≤1 million 100 million<D≤1 billion7 DSI 7 1 million<H≤10 million 1 billion<D≤10 billion8 DSI 8 10 million<H≤100 million 10 billion<D≤100 billion9 DSI 9 100 million<H≤1 billion 100 billion<D≤1 trillion
10 DSI 10 1 billion<H 1 trillion<D
Disaster Severity Index (DSI) – bridge between qualitative and quantitative techniques
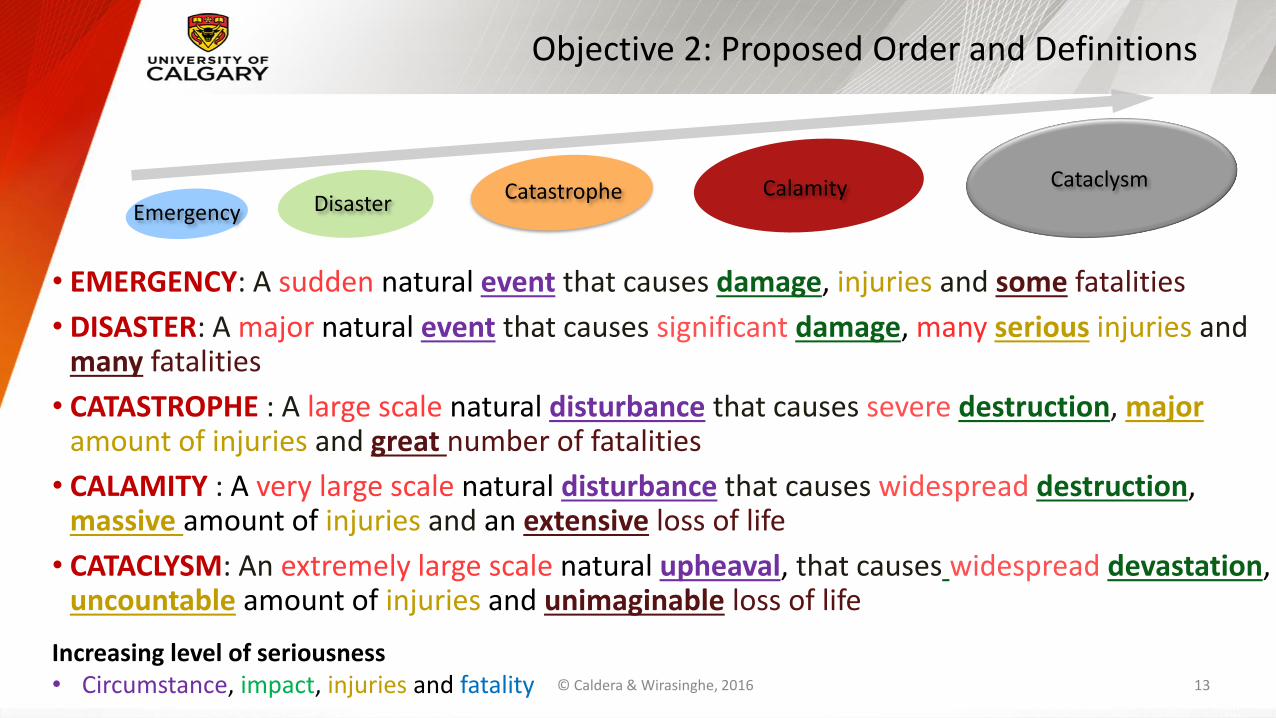
Objective 2: Proposed Order and Definitions
13
• EMERGENCY: A sudden natural event that causes damage, injuries and some fatalities
• DISASTER: A major natural event that causes significant damage, many serious injuries andmany fatalities
• CATASTROPHE : A large scale natural disturbance that causes severe destruction, major amount of injuries and great number of fatalities
• CALAMITY : A very large scale natural disturbance that causes widespread destruction, massive amount of injuries and an extensive loss of life
• CATACLYSM: An extremely large scale natural upheaval, that causes widespread devastation, uncountable amount of injuries and unimaginable loss of life
DisasterEmergency
CataclysmCatastrophe Calamity
Increasing level of seriousness• Circumstance, impact, injuries and fatality © Caldera & Wirasinghe, 2016
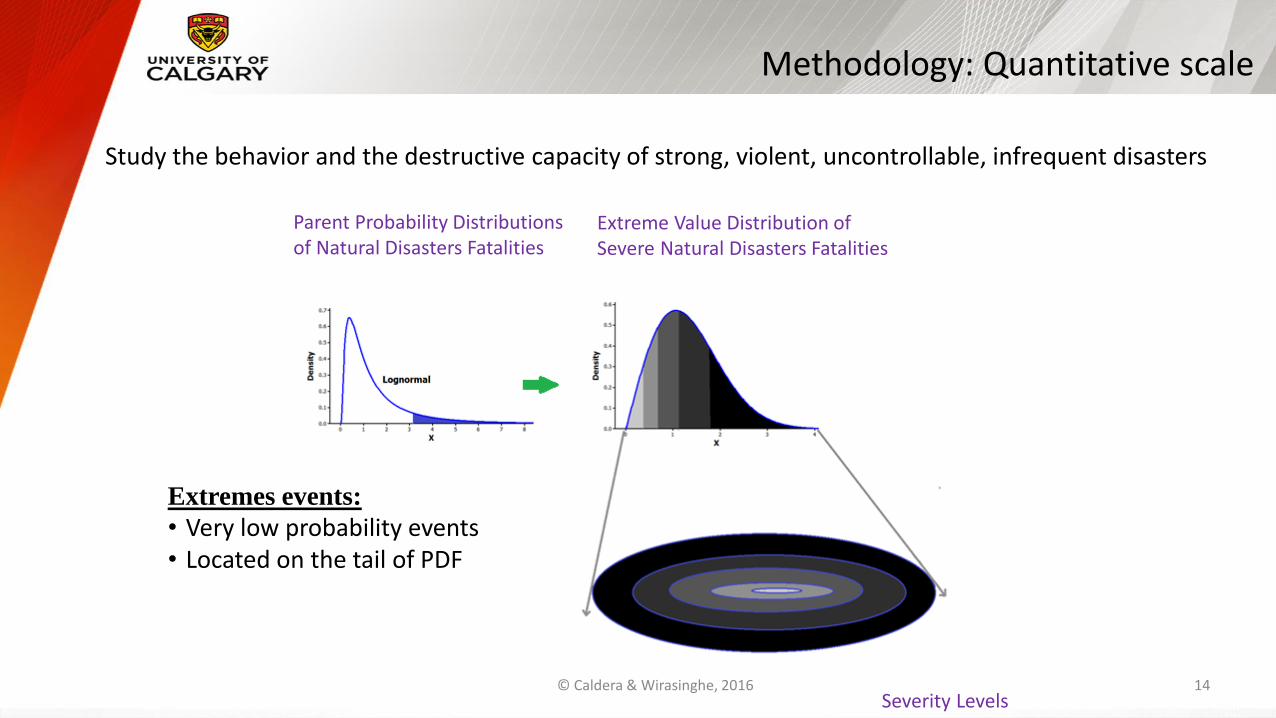
Methodology: Quantitative scale
Study the behavior and the destructive capacity of strong, violent, uncontrollable, infrequent disasters
14© Caldera & Wirasinghe, 2016
Parent Probability Distributions of Natural Disasters Fatalities
Extreme Value Distribution of Severe Natural Disasters Fatalities
Severity Levels
Extremes events:
• Very low probability events• Located on the tail of PDF

Analysis of Extreme Fatalities
Top 10 extreme cases for each disaster type
— Reflects the reasonable amount of data for each type
Estimated probabilities -> Weibull distribution
15
α=0.4095, β=37496; γ=0
10 different type of disasters
Large scale global disasters— Earthquakes, tsunamis, and volcanoes
Regional scale disasters — Floods, cyclones, and tornadoes
Local scale disasters — Flash floods, forest fires, landslides and lightning
𝑓 𝑥 =𝛼
𝛽
𝑥−𝛾
𝛽
𝛼−1𝑒𝑥𝑝 −
𝑥−𝛾
𝛽
𝛼; α, β>0; x>γ; γєR
© Caldera & Wirasinghe, 2016

Objective 3: Proposed Fatality Based Disaster Scale
Type Seriousness level
Color code
Fatality Range SampleProbability
EstimatedProbability
Example
Emergency DSI 1 1 ≤ F < 10 0 0.021 Southern Alberta flood, Canada - 2013- 4 deaths
Disaster Type 1 DSI 2 10 ≤ F < 100 0.031 0.051 Edmonton tornado, Canada - 1987 - 27 deathsDisaster Type 2 DSI 3 100 ≤ F < 1,000 0.268 0.118 Thailand flood – 2011 - 815 deaths
Catastrophe Type 1 DSI 4 1,000 ≤ F < 10,000 0.175 0.238 Hurricane Katrina, USA – 2005 - 1833 deaths
Catastrophe Type 2DSI 5
10,000 ≤ F < 0.1M 0.216 0.334 Tohuku earthquake and tsunami, Japan - 2011 -15882 deaths
Calamity Type 1 DSI 6 0.1M ≤ F < 1M 0.299 0.203 Haiti earthquake - 2010 – 316.000 deathsCalamity Type 2 DSI 7 1M ≤ F < 10M 0.010 0.022 China floods- 1931- more than 2,500,000 deaths
Cataclysm Type 1 DSI 8 10M ≤ F < 100M 0 5.27*10-05 Black death pandemic - from 1346 to 1353
Cataclysm Type 2DSI 9
100M ≤ F < 1B 0 1.04*10-11 Super Volcano (e.g. Yellowstone) – less than 1billion estimated deaths
Partial or FullExtinction
DSI 10
1B ≤ F < 10B 0 6.32*10-29 Meteor strike (diameter > 1.5 Km) - less than 1.5billion estimated deathsPandemic (Avian influenza) – less than 2.8 billionestimated deaths 16
Qualitative Technique
Quantitative Technique
Bridge of DSI
Some Example

Disaster Classification
Type Severity level
Color code
FlashFlood
ForestFire
Lightning Tornado Volcano Landslide
Cyclone/Hurricane
Earthquake Tsunami Flood
Emergency DSI 1 √ √ √ √ √ √ √ √ √ √
Disaster Type 1 DSI 2 √ √ √ √ √ √ √ √ √ √
Disaster Type 2 DSI 3 √ √ √ √ √ √ √ √ √ √Catastrophe Type 1 DSI 4 √ √ √ √ √ √ √ √ √ √Catastrophe Type 2 DSI 5 × × × × √ √ √ √ √ √Calamity Type 1 DSI 6 × × × × × √ √ √ √ √Calamity Type 2 DSI 7 × × × × × × × × × √
Cataclysm Type 1 DSI 8 × × × × × × × × × ×
Cataclysm Type 1 DSI 9 × × × × × × × × × ×Partial or FullExtinction
DSI 10× × × × × × × × × ×
17
’√’ -> levels covered by each disaster
© Caldera & Wirasinghe, 2016

Conclusions
18
1. Proposed a methodology to measure the severity for all types of natural disasters under one single scale
2. Illustrated using only fatalities• Facilitates the comparison among various degrees of disasters and obtaining a sense of
scale
3. Limitations: One factor is not sufficient4. Continuation of the research provides an overall picture of the severity of
natural disasters based on several independent combine factors and ranks disasters based on their impact
• Develops a multidimensional → Universal Disaster Severity Scale• Unified way of describing disasters
• Yields independent estimates of the magnitude of a disaster for cities or countries • Helps gauge the need for regional/national/international assistance
© Caldera & Wirasinghe, 2016

Thank You!
??